29
October 1999 October 1999 Experiment Design for Computer Scientists Marie desJardins ([email protected] ) CMSC 601 March 5, 2009
| Date post: | 26-Dec-2015 |
| Category: |
Documents |
| Upload: | cecily-bell |
| View: | 214 times |
| Download: | 0 times |
September1999October 1999October 1999
Experiment Design for Computer Scientists
Marie desJardins ([email protected])
CMSC 601
March 5, 2009
September1999October 1999October 1999
3/5/09
2
Sources
Paul Cohen, Empirical Methods in Artificial Intelligence, MIT Press, 1995.
Tom Dietterich, CS 591 class slides, Oregon State University.
Rob Holte, “Experimental Methodology,” presented at the ICML 2003 Minitutorial on Research, ‘Riting, and Reviews.

September1999October 1999October 1999
3/5/09
3
Experiment design
Experiment design criteria: Claims should be provable Contributing factors should be isolated and controlled for Evaluation criteria should be measurable and meaningful Data should be gathered on convincing domain /problem Baselines should be reasonable Results should be shown to be statistically valid
ss

September1999October 1999October 1999
Provable Claims

September1999October 1999October 1999
3/5/09
5
Provable Claims
Many research goals start out vague: Build a better planner Learn preference functions
Eventually, these claims need to be made provable: Concrete Quantitative Measurable
Provable claims: My planner can solve large, real-world planning problems under
conditions of uncertainty, in polynomial time, with few execution-time repairs.
My learning system can learn to rank objects, producing rankings that are consistent with user preferences, measured by probability of retrieving desired objects.
September1999October 1999October 1999
3/5/09
6
More Provable Claims
More vague claims: Render painterly drawings Design a better interface
Provable claims: My system can convert input images into drawings in the
style of Matisse, with high user approval, and with measurably similar characteristics to actual Matisse drawings (color, texture, and contrast distributions).
My interface can be learned by novice users in less time than it takes to learn Matlab; task performance has equal quality, but takes significantly less time than using Matlab.

September1999October 1999October 1999
3/5/09
7
One More
Vague claim: Visualize relational data
Provable claim: My system can load and draw layouts for relational datasets
of up to 2M items in less than 5 seconds; the resulting drawings exhibit efficient screen utilization and few edge crossings; and users are able to manually infer important relationships in less time than when viewing the same datasets with MicroViz.
September1999October 1999October 1999
Measurable, Meaningful Criteria

September1999October 1999October 1999
3/5/09
9
Measurable Criteria
Ideally, your evaluation criteria should be: Easy to measure Reliable (i.e., replicable) Valid (i.e., measuring the right thing) Applicable early in the design process Convincing
Typical criteria: CPU time / clock time Cycles per instruction Number of [iterations, search states, disk seeks, ...] Percentage of correct classification Number of [interface flaws, user interventions, necessary
modifications, ...]
Adapted with permission from Tom Dietterich’s CS 519 (Oregon State University) course slides

September1999October 1999October 1999
3/5/09
10
Meaningful Criteria
Evaluation criteria must address the claim you are trying to make
Need clear relationship between the claim/goals and the evaluation criteria
Good criteria: Your system scores well iff it meets your stated goal
Bad criteria: Your system can score well even though it doesn’t meet the
stated goal Your system can score badly even though it does meet the
stated goal

September1999October 1999October 1999
3/5/09
11
Example 1: CISC
True goals: Efficiency (low instruction fetch, page faults) Cost-effectiveness (low memory cost) Ease of programming
Early metrics: Code size (in bytes)
Entropy of Op-code field Orthogonality (can all modes be combined?)
Efficient execution of the resulting programs was not being directly considered
RISC showed that the connection between the criteria and the true goals was no longer strong
→ Metrics not appropriate!
Adapted with permission from Tom Dietterich’s CS 519 (Oregon State University) course slides

September1999October 1999October 1999
3/5/09
12
Example 2: MYCIN
MYCIN: Expert system for diagnosing bacterial infections in the blood
Study 1 evaluation criteria were: Expert ratings of program traces
Did the patient need treatment? Were the isolated organisms significant? Was the system able to select an appropriate therapy? What was the overall quality of MYCIN’s diagnosis?
Problems: Overly subjective data Assumed that experts were ideal diagnosticians Experts may have been biased against the computer Required too much expert time Limited set of experts (all from Stanford Hospital)
Adapted with permission from Tom Dietterich’s CS 519 (Oregon State University) course slides
September1999October 1999October 1999
3/5/09
13
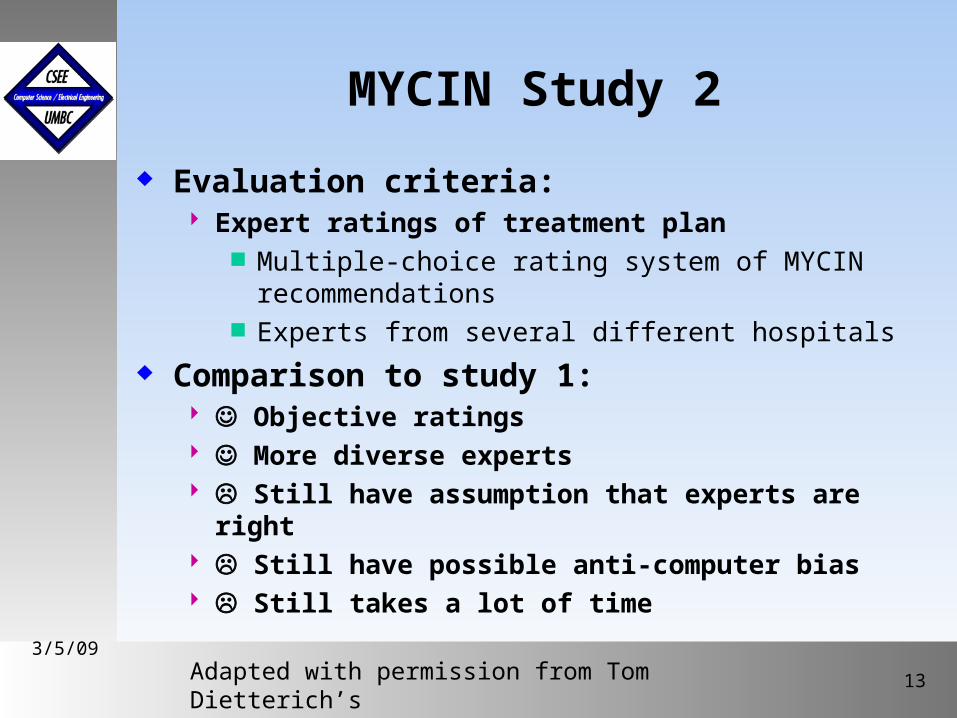
MYCIN Study 2
Evaluation criteria: Expert ratings of treatment plan
Multiple-choice rating system of MYCIN recommendations
Experts from several different hospitals
Comparison to study 1: Objective ratings More diverse experts Still have assumption that experts are right Still have possible anti-computer bias Still takes a lot of time
Adapted with permission from Tom Dietterich’s CS 519 (Oregon State University) course slides

September1999October 1999October 1999
3/5/09
14
MYCIN Study 3
Evaluation criteria: Multiple-choice ratings in a blind evaluation setting:
MYCIN recommendations Novice recommendations Intermediate recommendations Expert recommendations
Comparison to study 2: No more anti-computer bias Still assumes expert ratings are correct Still time-consuming (maybe even more so!)
Adapted with permission from Tom Dietterich’s CS 519 (Oregon State University) course slides

September1999October 1999October 1999
3/5/09
15
MYCIN Results
Experts don’t always agree Method appears valid (more experience → higher ratings) MYCIN is doing well!
Prescriber %OK(1 expert / 8)
% OK(majority)
MYCIN 65.0 70.0
Faculty-1 62.5 50.0
Faculty-2 60.0 50.0
Fellow 60.0 50.0
Faculty-3 57.5 40.0
Actual therapy 57.5 70.0
Faculty-4 55.0 50.0
Resident 45.0 30.0
Faculty-5 42.5 30.0
Student 30.0 10.0
Adapted with permission from Tom Dietterich’s CS 519 (Oregon State University) course slides

September1999October 1999October 1999
3/5/09
16
MYCIN Lessons Learned
Don’t assume experts are perfect Find out how humans are evaluated on a similar task Control for potential biases
Human vs. computer, Stanford vs. other institutions, expert vs. novice
Don’t expect superhuman performance Not fair to evaluate against “right” answer
...unless you evaluate humans the same way ...and even then may not measure what you care about
(performance under uncertainty)
Adapted with permission from Tom Dietterich’s CS 519 (Oregon State University) course slides

September1999October 1999October 1999
Reasonable Baselines

September1999October 1999October 1999
3/5/09
18
Baseline: Point of Comparison
Performance can’t be measured in isolation Often have two or three baselines:
A reasonable naive method Random No processing Manual Naive Bayes
The current state of the art Optimal or upper-bound solution
Ablation Test the contribution of one factor Compare system X to (system X – factor)

September1999October 1999October 1999
3/5/09
19
Poor Baselines
No baseline The naive method, and no other alternative A system that was the state of the art ten years ago The previous version of your own system
What if there is no existing baseline?? Develop reasonable baselines Decompose and find baselines for the components
September1999October 1999October 1999
3/5/09
20
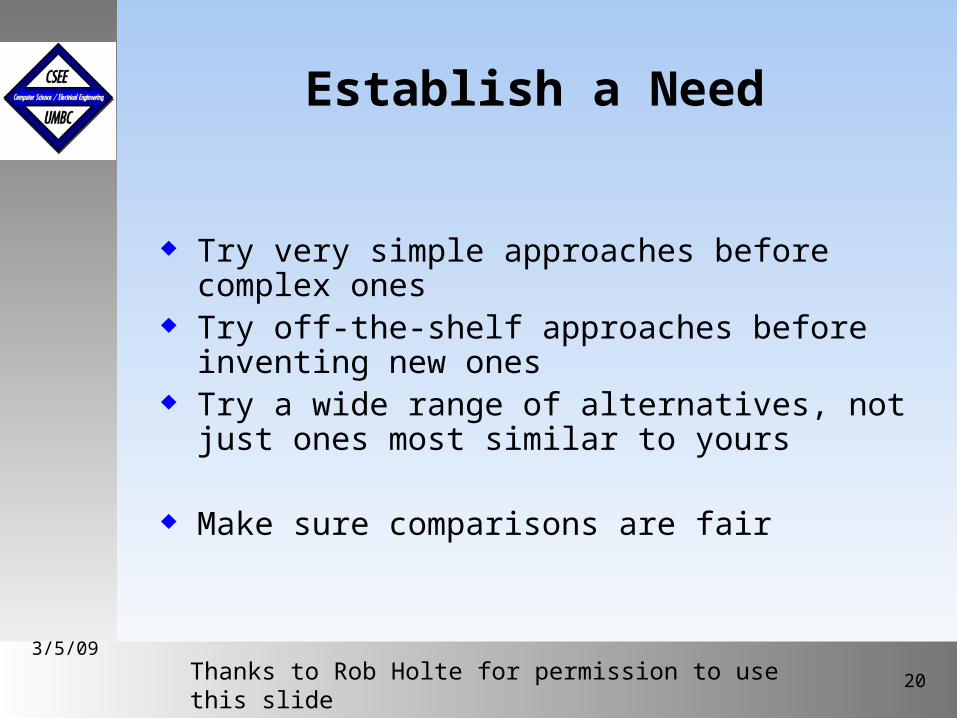
Establish a Need
Try very simple approaches before complex ones Try off-the-shelf approaches before inventing new
ones Try a wide range of alternatives, not just ones
most similar to yours
Make sure comparisons are fair
Thanks to Rob Holte for permission to use this slide

September1999October 1999October 1999
3/5/09
21
Test Alternative Explanations
Solution Quality (% of optimal)
Combinatorial auction problemsCHC = hill-climbing with a clever new heuristic
problem type CHC
path 98
match 99
sched 96
r75P 83
r90P 90
r90N 89
arb 87
Thanks to Rob Holte for permission to use this slide

September1999October 1999October 1999
3/5/09
22
Is CHC Better than Random HC ?
Percentage of CHC solutionsbetter than random HC solutions
problem type % better
path 100
match 100
sched 100
r75P 63
r90P 7
r90N 6
arb 20
Thanks to Rob Holte for permission to use this slide
September1999October 1999October 1999
Statistically Valid Results

September1999October 1999October 1999
3/5/09
24
Look at Your Data
4 x-y datasets, all with the same statistics.Are they similar ? Are they linear ?
• mean of the x values = 9.0 • mean of the y values = 7.5 • equation of the least-squared regression line is: y = 3 + 0.5x • sum of squared errors (about the mean) = 110.0 • regression sum of squared errors = 27.5 • residual sum of squared errors (about the regression line) = 13.75 • correlation coefficient = 0.82 • coefficient of determination = 0.67
F.J. Anscombe (1973), "Graphs in Statistical Analysis," American Statistician, 27, 17-21
Thanks to Rob Holte for permission to use this slide

September1999October 1999October 1999
3/5/09
25
Anscombe Datasets Plotted
Thanks to Rob Holte for permission to use this slide
September1999October 1999October 1999
3/5/09
26
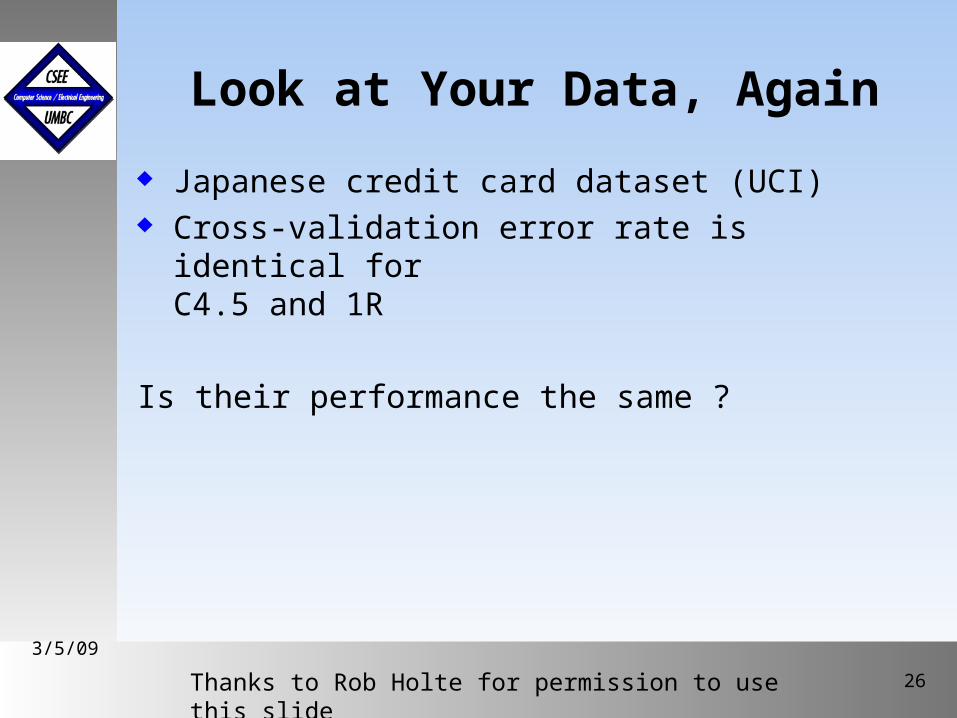
Look at Your Data, Again
Japanese credit card dataset (UCI) Cross-validation error rate is identical for
C4.5 and 1R
Is their performance the same ?
Thanks to Rob Holte for permission to use this slide

September1999October 1999October 1999
3/5/09
27
Closer analysis reveals…
Error rate is the same only on the dataset class distribution
•ROC curves•Cost curves•Learning curvesC4.5
1R
Thanks to Rob Holte for permission to use this slide
September1999October 1999October 1999
3/5/09
28
Statistical Methods
Plotting the data Sample statistics Confidence intervals
Bootstrap, t distribution
Comparing distributions Bootstrap, t test, confidence intervals
Learning algorithms Regression ANOVA

September1999October 1999October 1999
3/5/09
29
Lots more to come...


