41
September/October 2010 Also in this issue: • Global Positioning in Revit’s World • Career Advice from AUGI • Civil 3D Reports: The Good, the Bad, and the Ugly

September/October 2010
Also in this issue:• Global Positioning in Revit’s World• Career Advice from AUGI• Civil 3D Reports: The Good,
the Bad, and the Ugly

Table of ContentsEditorial
Managing EditorMarilyn [email protected]
Technical EditorDavid [email protected]
Contributing AuthorsThe CAD Manager Mark Kiker
AUGI Salary Survey Melanie Perry
AutoCAD Architecture Carolyn Gibbs
AutoCAD Architecture Melinda Heavrin
AutoCAD Civil 3D Christopher Fugitt
AutoCAD Civil 3D Kent Langdon
Autodesk Licensing Brian Myers
Autodesk Revit Felix Gonzalez
Autodesk Revit Architecture Chris Fox
Autodesk Revit Structure Phil Russo
Art & ProductionTim Varnau [email protected]
SubmissionsWe encourage prospective authors to contact our editors or [email protected] to discuss article submissions, guidelines and processes.
AUGI Board of Directors, 2010Bill AdamsDonnie GladfelterDavid HarringtonPeter JamtgaardMark W. KikerPaul KirillKenneth LearyJohn MorganDario PassarielloJane Smith
AUGI Officers, 2010Mark Kiker, PresidentDavid Harrington, Sr. Vice PresidentJohn Morgan, Vice PresidentPaul Krill, TreasurerBill Adams, Secretary© Copyright 2010 – Autodesk User Group International. All rights reserved.
Feature6
2 w w w. A U G I . c o m
4 The CAD Manager
12 Renovation Mode in ADA 2011
16 The User’s Guide to Licenses
20 Global Positioning in Revit’s World
24 Using Schedule Keys with Column Schedules
28 Beyond the Civil Tools in AutoCAD Civil 3D
32 Using Spaces to Apply BOMA Standards
36 Civil 3D Reports: The Good, the Bad and the Ugly
38 In the Line of Fire

�4131 Westmark Drive • Dubuque, IA 52002
800.678.6565 • www.eaglepoint.com • [email protected]
Are You Ready?Government agencies and owners are now specifying Building Information Models in project deliverables.This drives AE firms and General Contractors to demand that consultants and trade contractors operate in anintegrated, collaborative project environment.
If you haven’t already, you need to prepare your organization for BIM.
Delivering on BIM specifications not only requires innovative technology but modern workflows as well.Understanding your modeling capabilities and matching the required level of detail needed to theowner/agency expectations is critical for success. Considerations include:
• 3-D modeling for visualization and clash detection.• 4-D/5-D modeling for scheduling and cost estimation.• 6-D modeling for on-going lifecycle management.
Traditional design-bid-build workflows must also be changed in order to enforce new modeling practices,take advantage of BIM technology and deliver the right models.
See how the Pinnacle Series™ can help your firm deploy BIM.
Visit http://www.eaglepoint.com/bimready.
BIM software investmentsand the development ofinternal collaborative BIMprocedures rate as the toptwo areas of investment forfirms deploying BIM.*
*McGraw Hill Construction SmartMarket Report, 2009.
Half of the AEC industry is using BIM - up 75% over the last 2 years.*

With the results from AUGI’s Annual Salary Survey provided in this issue of AUGIWorld, many of you are looking to see how you match up to others and where the best salaries are located. With this comparison you may be thinking that you need to polish up your resume and look to see what’s out there as you think about your next career move.
Others may be trying to reenter the job market after a hiatus (planned or not). You may be looking for employment and won-dering when the economy will stop sput-tering and get moving.
Any of these career states can be ad-dressed by actions that you can take to make things happen.
I had the chance to sit down with AUGI’s Salary Survey Manager Melanie Perry (whom some of you may know as the Mistress of the Dorkness from her blog). We talked about career moves, resume refreshes, networking, and so much more. We recorded the sessions and posted them on BLAUGI. Even if you are not actively looking for your next position at this time, it is worth listening to. Go to BLAUGI.com and click on the Media link at the top.
In Part One of the six-part series, we discussed where to look for job postings. It is crucial to look at the right sites and locations to find those areas that are active and have openings. Search the most popu-lar sites as well as the more obscure. Don’t
forget about the associations you belong to, as many of those might have job post-ings as well.
In Part Two, Melanie discusses the process of the Salary Survey and the re-sponses we received for this year’s survey. The Salary Survey provides geographi-cally specific information, so it is relevant to all. Melanie speaks to the relevance of the dollar figures produced by the Salary Survey and how it fits together with other surveys to give a full orbed perspective on the market.
Part Three moves into the concept of networking—the connections you have with others—and how that can help in a job search. There are online sites that help
The CAD Manager
4 w w w. A U G I . c o m
AUGI Podcasts – Career Advice

S e p / O c t 2 0 1 0 5
in this process such as LinkedIn and others. Other sites related to professional organiza-tions might also pro-vide interactions with others. Recommenda-tions include how to net-work, who to network with, and when to do it. Also dis-cussed is the value of giving to others first.
Part Four con-tinues on with resumes and cover letters. We dis-cussed what needs to be on your re-sume. Things like references and correct information. I mentioned that the point of a resume is to get an interview. No one gets hired on their resume alone. The resume is what gets you in front of your perspective employer for an interview. It needs to be polished and focused on mak-ing them interested in finding out more. Cover letters are discussed and even how to deliver the information to the firms you have targeted. Presentation is critical at every level.
Part Five is dedicated to inter-viewing skills. Starting off
with a firm handshake and a confident
manner will make the interview
go well. The exchange of questions and answers will be how the firm will mea-sure your “fit”
and how they think you will
handle the work. Presenting your best side is important as well—be open, honest, and yourself.
Part Six finishes the series with tips on increasing your marketability. Selling the brand that is “you” is very important. Make sure that people see the brand that you want them to see. Internet searches turn up all kinds of information that says things about you. Maybe do a little more public speaking. Get in front of others in more ways than one.
By listening to this six-part series and putting some of the ideas into practice, you may increase you marketability and see progress in your career. The podcasts are under ten minutes each, so you can listen in small chunks of time.
Mark W. Kiker is president of the AUGI Board of Di-rectors. He is a National CAD Standards Project Team Member and team member of the National BIM Standard. Mark is
general editor of BLAUGI and also publishes caddmanager.com, the CADD Manager’s journal, as well as the caddmanager.com blog. He is a returning faculty member at Autodesk University. He is currently chief information officer for HMC Architects in Ontario, California.
Finding A Design Job - Part1.mp3 (8676.7K)
Finding A Design Job - Part 2.mp3 (7610.7K)
Finding A Design Job - Part 3.mp3 (8440.9K)
Finding A Design Job - Part 4.mp3 (8494.0K)
Finding A Design Job - Part 5.mp3 (8242.7K)
Finding A Design Job - Part 6.mp3 (8241.7K)

6 w w w. A U G I . c o m
In July, we asked our user community to volunteer a few minutes of their time to provide some information for the 9th An-nual AUGI Salary Survey. You’ll notice that participation has dropped a little bit from last year. The economy still appears to be taking a toll on our industry, and I person-ally know quite a few folks who have had to find another line of work. It’s a shame their experience isn’t being put to use.
We really appreciate those who did par-ticipate in this year’s survey. We are report-ing on what our members tell us, and if we didn’t have your data, we wouldn’t have these results to share. Thank you!
As an introductory note to those who did not take part this year, this is an anony-mous, 19-question survey which is re-ported in broad groups and is in no way traceable to you as an individual. So please come back next summer and add a voice for your industry.
We had 4,245 responses to the survey this year. Our international participation is still roughly 30% of the overall input. It looks like women’s marketshare has crept
up a percent since last year to 16.5%, which hasn’t really deviated much from the 15% reported in the first AUGI Salary Survey back in 2002. Men are reporting earnings 9% higher than women, so that gap has narrowed a little bit (but women tend to work fewer hours and have more benefits, so it might not be as bad as it sounds).
In 2006, as a result of a user’s suggestion, we added an option to report a decrease in salary. Through 2008, the average was 3% of users experiencing a salary reduction. In 2009 and 2010, that number increased fivefold. This year, 15.4% of our members reported a reduction in pay.
While only 45% of our members report-ed receiving a raise this year, those that did had an average of 6.5% increase (the number of users who reported receiving higher than a 15% increase was more than double that of last year, so that has pulled the number up a little).
Feelings of Job Satisfaction have dipped a little bit (5% fewer report being ‘Satis-fied’ or ‘Very Satisfied’), but, strangely enough, feelings of Job Security have re-
mained fairly steady (with over 74% of responents reporting they felt ‘Secure’ or ‘Very Secure’).
Other noteworthy items are that the highest paying field seems to be, by far, Petroleum/Gas/Biofuels, and the number of BIM Managers has doubled from last year (from 3% to 6% of total respondents).
I hope next year’s survey brings higher participation and greater levels of security, satisfaction, and an end to those decreases in pay for our membership.
If you have any questions, please read the FAQ posted on the AUGI site, and feel free to send suggestions to [email protected].
Melanie Perry is Facilities-Management CADD/BIM coordinator working for BJC Healthcare. She is the Salary Survey Manager, the AutoCAD Community Chair, and a freelance writ-
er & technical editor. Melanie can be reached at [email protected].
9th Annual AUGI Salary Survey

S e p / O c t 2 0 1 0 7
Atlantic: 568 Pacific: 549Midwest: 726 South: 548Mountain: 195 Southwest: 372
Africa: 60Asia: 361Caribbean: 5Central America: 23Europe: 426Middle East: 42Canada: 321South America: 49
Responses by United States Region
Non-U.S. Responses by World Region
Employee Ageage # respondents
25-under 235
26-30 729
31-40 1,475
41-50 1,012
51-59 619
60-65 144
65-over 31
Employee Gendergender # respondents
MALE 3,543
FEMALE 702
Compensationsalary type # respondents
HOURLY 1,489
SALARY 2,113
SALARYNE 476
SELFEMPLOYED 141
OTHER 26
Hours Worked Per Weekhours # respondents
UNDER40 437
40 1,957
41-50 1,651
51-OVER 200

8 w w w. A U G I . c o m
Aerospace 24 0.49%Architecture 1205 24.64%audio vis 20 0.41%Automotive 19 0.39%bldg aut 10 0.20%CAD 204 4.17%Chemical 27 0.55%Civil/Srv/GIS 768 15.70%Construction 282 5.77%Edu/Trn 42 0.86%electron 27 0.55%FM 78 1.59%Gov't 212 4.33%Interior De 65 1.33%landscaping 40 0.82%Medical 15 0.31%MEP 431 8.81%Mfg 370 7.56%Mining 50 1.02%Other 332 6.79%Pet/Gas/bio 127 2.60%Sales/mkt 6 0.12%Semicond 8 0.16%Shipbldg 24 0.49%Software 25 0.51%Struct 340 6.95%Telecomm 53 1.08%Tool/Die/M 7 0.14%transprt 80 1.64%
0
200
400
600
800
1000
1200
0 200 400 600 800 1000 1200
Aerospace 22 Architecture 1,135 Audio Visual 16 Automotive 13 Building Automation 6 CAD 158 Chemical 16 Civil/Srv/GIS 591 Construction 280 Education/Training 44 Electrical/Electronics 19 Facilities Management 63 Government 173 Interior Design 45 Landscaping 35 Medical 17 MEP 452 Manufacturing 322 Mining 47 Petroleum/Gas 95 Sales/Marketing 7 Semiconductor 5 Shipbuilding 19 Software 20 Structural 302 Telecommunications 47 Tool/Die/Molding 5 Transportation 47 Other 244
0-25,000 359 7.34%25,001-30 147 3.01%30,001-35 218 4.46%35,001-40 400 8.18%40,001-45 519 10.61%45,001-50 526 10.75%50,001-55 540 11.04%55,001-60 447 9.14%60,001-65 408 8.34%65,001-70 313 6.40%70,001-75 275 5.62%75-001-80 205 4.19%80,001-85 140 2.86%85,001-90 93 1.90%90,001-95 73 1.49%95,001-100 65 1.33%over 100,000 163 3.33%
0
100
200
300
400
500
0 100 200 300 400 500
$0-25,000 305
$25,001-30 120
$30,001-35 178
$35,001-40 298
$40,001-45 416
$45,001-50 474
$50,001-55 446
$55,001-60 400
$60,001-65 379
$65,001-70 292
$70,001-75 214
$75-001-80 168
$80,001-85 126
$85,001-90 101
$90,001-95 76
$95,001-100 66
over $100,000 186
Field/Industry Annual Compensation in 2010
acct exec 5 0.10%arch 303 6.20%bim mgr 148 3.03%cad mgr 806 16.48%cmp prg 26 0.53%desgnr 1260 25.76%drafter 1101 22.51%engineer 378 7.73%instr/train 78 1.59%it mgr/admn 76 1.55%land surv 37 0.76%nc prog 4 0.08%proj mgr 233 4.76%tool desgn 6 0.12%other 430 8.79%
0
200
400
600
800
1000
1200
0 200 400 600 800 1,000 1,200
Account Executive 4 Architect 389 BIM Manager 258 CAD Manager 586 Computer Programmer 21 Designer 1,014 Drafter 878 Engineer 355 Instructor/Trainer 83 IT Manager/Admn 52 Land Surveyor 38 Project Manager 211 Tool Designer 9 Other 347
Job Title/Function
1-2% 1215 15.52%3-4% 2320 29.63%5-7% 1071 13.68%8-10% 642 8.20%11-15% 310 3.96%over 15% 489 6.25%
-1000
-500
0
500
1000
1500
2000
2500
0 500 1,000 1,500 2,000
Decrease 654
Increase 1,920
Same 1,671
Medical 3958 80.92%dental 3202 65.47%Vacation 4208 86.04%Retirement 3261 66.67%Childcare 349 7.14%Education 1932 39.50%flextime 2400 49.07%telecomm 732 14.97%None 250 5.11%
0
500
1000
1500
2000
2500
3000
3500
4000
0 500 1,000 1,500 2,000 2,500 3,000 3,500 4,000
Medical Insurance 3,369
Dental Insurance 2,723
Paid Vacation 3,561
Retirement Plan 2,787
Childcare Assistance 291
Continuing Education 1,549
Flextime 2,022
Telecommuting 634
None of the Above 223
Employee Benefits
Salary Change in Last 12 Months10 or less 1126 14.38%11-50 1895 24.20%51-100 1028 13.13%101-200 904 11.55%201 or more 2877 36.74%
0
500
1000
1500
2000
0
500
1000
1500
2000
2500
3000
0 500 1,000 1,500 2,000 2,500
0 500 1,000 1,500 2,000
0 500 1,000 1,500 2,000 2,500 3,000
10 or fewer 4787 61.14%11-50 2528 32.29%51 or more 515 6.58%
10 or fewer 2,519
11-50 1,451
51 or more 275
How Big Is Your Department
Percentage of Increase
10 or less 568 11-25 579 26-50 543 51-100 543 101-200 473 201 or more 1,539
How Big Is Your Company
10 or less 1126 14.38%11-50 1895 24.20%51-100 1028 13.13%101-200 904 11.55%201 or more 2877 36.74%
0
500
1000
1500
2000
0
500
1000
1500
2000
2500
3000
0 500 1,000 1,500 2,000 2,500
0 500 1,000 1,500 2,000
0 500 1,000 1,500 2,000 2,500 3,000
10 or fewer 4787 61.14%11-50 2528 32.29%51 or more 515 6.58%
1-2% 628
3-4% 656
5-7% 0
8-10% 164
11-15% 94
over 15% 378

S e p / O c t 2 0 1 0 9
AV E R AG E SA L A RY BY J O B T I T L E / R EG I O NSurvey respondents were asked to provide their salary data in U.S. dollars. They were given access to an online currency translator to assist them in this effort.
DesignerAtlantic $56,452.10Midwest $52,916.67Mountain $55,069.44Pacific $59,724.41South $55,081.17Southwest $60,714.29Australia $67,336.96Canada $59,968.35GreatBritain $47,931.03Other $38,861.11Overall $55,431.46
0 10 20 30 40 50 60 70 80
CAD ManagerAtlantic $63,598.48Midwest $57,870.37Mountain $64,218.75Pacific $71,107.59South $60,367.65Southwest $65,636.36Australia $79,583.33Canada $69,642.86GreatBritain $51,013.51Other $45,443.55Overall $62,013.65
0 10 20 30 40 50 60 70 80
ArchitectAtlantic $63,366.67Midwest $52,741.94Mountain $57,000.00Pacific $71,306.82South $58,355.26Southwest $55,000.00Australia $63,833.33Canada $70,714.29GreatBritain $51,428.57Other $30,833.33Overall $54,209.51
0 10 20 30 40 50 60 70 80
BIM ManagerAtlantic $66,985.29Midwest $59,600.00Mountain $66,136.36Pacific $67,023.81South $60,166.67Southwest $62,500.00Australia $77,500.00Canada $63,888.89GreatBritain $56,136.36Other $51,600.00Overall $62,790.70
0 10 20 30 40 50 60 70 80
Instructor/TrainerAtlantic $68,333.33Midwest $52,166.67Mountain $55,000.00Pacific $70,833.33South $58,611.11Southwest $53,076.92Australia $72,500.00Canada $84,166.67GreatBritain $40,000.00Other $31,931.82Overall $51,475.90
0 10 20 30 40 50 60 70 80
IT Manager/AdminAtlantic $76,785.71Midwest $64,375.00Mountain $77,500.00Pacific $76,500.00South $61,666.67Southwest $72,500.00Australia $67,500.00Canada $57,500.00GreatBritain $73,750.00Other $50,416.67Overall $68,028.85
0 10 20 30 40 50 60 70 80
DrafterAtlantic $49,166.67Midwest $44,914.38Mountain $45,284.09Pacific $52,087.16South $40,805.08Southwest $45,978.26Australia $62,500.00Canada $54,081.63GreatBritain $40,000.00Other $33,147.32Overall $46,215.83
0 10 20 30 40 50 60 70 80
EngineerAtlantic $67,500.00Midwest $62,773.44Mountain $67,794.12Pacific $70,053.19South $64,423.08Southwest $62,053.57Australia $60,277.78Canada $70,500.00GreatBritain $45,555.56Other $33,240.74Overall $57,161.97
0 10 20 30 40 50 60 70 80
Project ManagerAtlantic $74,919.35Midwest $55,138.89Mountain $53,409.09Pacific $62,589.29South $56,893.94Southwest $56,911.76Australia $67,500.00Canada $68,750.00GreatBritain $57,500.00Other $41,093.75Overall $58,436.02
0 10 20 30 40 50 60 70 80
0 10 20 30 40 50 60
Miscellaneous Job TitlesNot Enough Response for Regional Breakdowns
AccountExec $ 45,000.00ComputerProg $ 58,690.48LandSurveyor $ 56,447.37ToolDesigner $ 47,222.22

10 w w w. A U G I . c o m
AV E R AG E SA L A RY BY I N D US T RY/ R EG I O N
ArchitectureAtlantic $60,081.97Midwest $51,410.89Mountain $49,825.58Pacific $60,714.29South $53,576.92Southwest $50,727.85Australia $63,928.57Canada $60,576.92GreatBritain $48,278.69Non-US $37,195.51Overall $53,259.91
0 10 20 30 40 50 60
ManufacturingAtlantic $61,538.46Midwest $53,790.32Mountain $54,500.00Pacific $60,147.06South $55,071.43Southwest $65,357.14Australia $60,500.00Canada $59,907.41GreatBritain $46,000.00Non-US $36,647.73Overall $53,936.34
0 10 20 30 40 50 60
StructuralAtlantic $58,712.12Midwest $53,109.76Mountain $52,916.67Pacific $61,666.67South $53,030.30Southwest $56,339.29Australia $79,117.65Canada $62,142.86GreatBritain $43,815.79Non-US $37,386.36Overall $55,918.87
0 10 20 30 40 50 60
CADAtlantic $60,576.92Midwest $52,708.33Mountain $55,714.29Pacific $48,409.09South $44,833.33Southwest $38,611.11Australia $70,500.00Canada $54,375.00GreatBritain $48,500.00Non-US $36,097.56Overall $48,006.33
Miscellaneous IndustriesNot Enough Response for Regional Breakdowns
Petroleum/Gas $73,894.74Facilities Mgmt. $62,023.81Mining $63,936.17Telecomm. $58,882.98Transportation $56,276.60Interior Design $46,722.22Education/Trng. $51,079.55Landscaping $46,142.86Aerospace $64,431.82Software $65,250.00
Electrical/Elctrncs. $58,947.37Shipbuilding $65,394.74Medical $46,029.41Audio Visual $57,031.25Chemical $63,281.25Automotive $47,307.69Sales/Marketing $43,214.29Bldg. Automation $57,500.00Semiconductor $50,000.00Tool/Die/Molding $51,500.00
0 10 20 30 40 50 60
0 10 20 30 40 50 60 0 10 20 30 40 50 60
Civil/Surv/GISAtlantic $59,479.17Midwest $53,153.41Mountain $51,406.25Pacific $63,797.47South $52,630.43Southwest $61,186.44Australia $69,523.81Canada $61,813.73GreatBritain $47,222.22Non-US $30,535.71Overall $54,957.70
0 10 20 30 40 50 60
MEPAtlantic $58,014.71Midwest $55,203.49Mountain $59,038.46Pacific $61,762.30South $52,916.67Southwest $53,333.33Australia $64,473.68Canada $56,759.26GreatBritain $48,833.33Non-US $40,256.41Overall $55,199.12
0 10 20 30 40 50 60
ConstructionAtlantic $60,000.00Midwest $53,012.82Mountain $60,000.00Pacific $69,102.56South $59,296.88Southwest $59,880.95Australia $63,500.00Canada $66,300.00GreatBritain $55,714.29Non-US $34,183.67Overall $56,223.21
0 10 20 30 40 50 60
GovernmentAtlantic $64,404.76Midwest $58,636.36Mountain $64,000.00Pacific $68,000.00South $54,090.91Southwest $55,625.00Australia $51,666.67Canada $63,750.00GreatBritain $43,500.00Non-US $40,277.78Overall $59,985.55
0 10 20 30 40 50 60

S e p / O c t 2 0 1 0 1 1
AV E R AG E SA L A RY BY M AJ O R FAC TO R S
Education Level/Degree AttainedDiploma/GED 314
Vocational 827
Associates 1,278
Bachelor’s 1,249
MBA 93
OtherMasters 368
Ph.D. 9
Other 1070 300 600 900 1200 1500
Average Pay Per Gender
Combined $55,392
Male $56,248
Female $51,072
Average Pay By Work Location
Urban $56,002
Suburban $54,154
Rural $53,583
0 10000 20000 30000 40000 50000 60000
0 10000 20000 30000 40000 50000 60000
Average Pay By Years of Experience0-2Years $42,679
3-4Years $41,846
5-6Years $44,767
7-8Years $49,011
9-10Years $52,898
11-12Years $55,757
13-15Years $57,436
over15Years $64,790
Average Pay By Years at Company0-2Years $51,142
3-4Years $48,712
5-6Years $55,013
7-8Years $55,756
9-10Years $58,386
11-12Years $57,209
13-15Years $63,008
over15Years $66,165
Percentage of members with a Bachelor’s Degree or Higher2002 26.5%2003 29.7%2004 31.9%2005 32.5%2006 34.5%2007 36.6%2008 35.7%2009 37.0%2010 40.5%
0 10000 20000 30000 40000 50000 60000 70000
0 10000 20000 30000 40000 50000 60000 70000
0 10 20 30 40
Average Pay By Education LevelDiploma/GED $55,088
Vocational $55,402
Associates $54,943
Bachelor’s $55,943
MBA $50,511
OtherMasters $56,427
Ph.D. $55,000
Other $55,864
0 10000 20000 30000 40000 50000 60000
Feelings of Job Satisfaction
VerySatisfied 1,234
Satisfied 1,835
Neither 566
SomewhatDissatisfied 442
Dissatisfied 168
Feelings of Job Security
Verysecure 1,166
secure 1,991
Neither 626
Somewhatinsecure 297
insecure 165

AutoCAD Architecture
12 w w w. A U G I . c o m12 w w w. A U G I . c o m
AutoCAD® Architecture 2011 boasted some great new and enhanced features and the Renovation Mode is one of my fa-vorites! Renovation Mode easily identifies objects and associates them with different phases of a renovation project, allowing for clear construction drawings every time. You now have the ability to display exist-ing, demolished, and new construction all in one drawing. Working within one drawing and having the ability to switch between renovation plan types allows you to avoid errors that are typically caused by editing multiple drawings.
Let’s take a closer look at how Renova-tion Mode works.
Activating Renovation Mode
The first time Renovation Mode is ac-tivated, a specific Renovation display con-figuration is created. Once activated, you will notice that this specific configuration is a copy of the existing display configura-tion with “Renovation” added as a prefix (see Figure 1).
To begin Renovation Mode, click the Manage tab of the Ribbon, Style & Display panel, Renovation Mode. This brings up the First Activation of Renovation Mode dialog box that allows you to give a name to the new display configuration. Please note that it is best to maintain the default prefixes for display configurations to elimi-
nate confusion later. Next, select the Op-tions button to change settings using the Display, Layers, and Styles, Blocks and Materials tabs. Click OK and you are now working in Renovation Mode.
Working In Renovation Mode
When you begin Renovation Mode, the existing category is assigned to exist-ing objects. Objects that are added to the drawing while you are working in Renova-tion Mode are automatically categorized as new. If objects are deleted, they are assigned to the demo category, however, they are not actually deleted. For example, moving a door will create both a new door as well as a demo door along with the cor-responding wall openings. It is important
to note that existing and new walls will au-tomatically clean up after each other while in Renovation Mode, however, demolition and new objects do not interact. This will be discussed later in the article.
In the display configuration for Reno-vation, objects are displayed according to their display representation. Within this display configuration, Existing, New, and Demolished categories are specified. They can be viewed in plan, elevation and sec-tion displays. Both 2D and 3D objects will display according to the categories that they are assigned in plan, elevation, and section views.
Dimensions are important to mention here, as well. When you use AEC dimen-sions, you cannot automatically ignore
Renovation Mode in ACA 2011
Figure 1: First activation of Renovation Mode dialog box.

S e p / O c t 2 0 1 0 1 3
objects by Renovation category. All existing, demolished, and new objects are dimensioned. Any undesirable di-mensions must be manually removed.
Objects can be manually assigned to a Renovation category, if needed. The display properties will change according to the category specified. This option may be necessary for 2D, multi-view block, or block objects because these objects are automati-cally assigned to the Existing category when you begin a Renovation session. To do this, click the Assign Existing, Assign New, or Assign Demo buttons, according to your needs. Next, select the objects to be assigned to the spec-ified category and hit Enter.
To make things easier, you can click the Select Existing, Select New, or Se-lect Demo buttons on the Renovation panel of the ribbon if you have several items to work with at once. Once se-lected, you can complete a command, such as Delete.
Settings for objectsDesign rules for New, Demolished,
and Existing categories by object type are controlled by Renovation styles. You can import Renovation Styles from external catalogs or export to ex-ternal catalogs in the Renovation Op-tions dialog box. For maximum flex-ibility, Renovation styles for display and layer assignment can be specified independently from each other and are saved to the current drawing.
In the Renovation options dialog box, the Display tab allows you to specify the Renovation Display Style and set specific design rules for ob-jects such as walls and doors (see Figure 2).
The layer tab allows you to set the Layer Assignment Style as well as to specify a prefix or suffix to layers in lieu of changing the layer name (see Figure 3).
The Styles, Blocks and Materials tab allows you to add a prefix or suffix to style/block names to avoid naming conflicts between objects in different Renovation categories (see Figure 4). This is much quicker than having to manually rename each object.
When the Duplicate Material Defi-nitions box is checked, a copy of the material is automatically generated and assigned to the building object. The corresponding color settings will automatically display.
Ending a sessionWhen you are finished working in
Renovation Mode, ending the session is simple. On the Renovation panel, click the Close Renovation Mode tool. It is important to note that if changes are made to the drawing after Reno-vation Mode has ended, the uncat-egorized objects are automatically as-signed to the Existing category when you reactivate Renovation Mode.
Continuing work in Renovation Mode
When Renovation Mode is reac-tivated in your drawing, the existing Renovation display configuration can still be used or you can create a new one. The objects that were previously categorized in an earlier Renovation phase will retain their representation and category. Any objects that do not yet have a Renovation category will be automatically categorized and dis-played as Existing objects.
The “Show existing, new and de-molished objects” option is auto-matically selected by default. I rec-ommend that you keep this option selected, as it ensures that categorized objects in your Renovation plan re-main visible while switching between the Demolition, Renovation, and Revision displays.
To continue working in Renovation Mode, select the Manage tab on the ribbon, then click the Style & Display panel and finally click Renovation Mode. This will display the Repeated Activation of Renovation Mode dialog box (see Figure 5).
Next you will need to specify the settings in the dialog, depending on what you want to do. To begin with an existing Renovation display con-figuration, click the drop-down arrow next to Activate an Existing Renova-tion Display Configuration, select the display you wish to use, and click OK. To begin with a new display configu-ration, select the Create a New Reno-vation Display Configuration Named button, enter a name for the new con-figuration, and click OK.
Next you can change the display style or design rules of objects by clicking the Options button at the bot-tom left of the dialog box. Click OK when finished. Then click OK again to exit the dialog box. You are now work-ing in Renovation Mode again.
Figure 2: Display options
Figure 3: Layer options
Figure 4: Styles, Blocks, and Materials options.

14 w w w. A U G I . c o m
Activating a demolition plan
The display of a demolition plan shows ex-isting construction and the objects that are categorized as demolished. All new objects, however, are hidden. Display settings for the demolition plan type are located in the op-tions dialog box for Renovation Mode.
To create a demolition plan, activate Renovation Mode as previously discussed and then select the button for Demoli-tion Plan on the Renovation panel of the ribbon. You can now select a Renovation Display Configuration to activate. The box next to Hide All New Objects is automati-cally checked. If you would like for New objects to show while you are working in the drawing, click in the box to deselect the item and then click OK. You can also click the New Show/Hide button on the Renovation panel. You are now ready to begin creating a demolition plan.
Please note that yellow is automatically as-signed by default to demolition objects. This can be changed in the options dialog box for Renovation Mode under the Layer tab.
Activating a revision planA revision plan displays new and exist-
ing construction objects, but all demolition
objects are hidden automatically. Display settings for the revision plan type are lo-cated in the options dialog box for Renova-tion Mode.
To create a renovation plan, activate Renovation Mode as previously discussed and then select the button for Revision Plan on the Renovation panel of the rib-bon. You can now select a Revision Plan Display configuration to activate. The box next to Hide All Demolished Objects is au-
tomatically checked. If you would like for Demolition objects to show while you are working in the drawing, click the box next to deselect the item and the click OK. You
can also click the Demo Show/Hide but-ton on the Renovation panel. You are now ready to begin creating a revision plan.
Manual modificationsSometimes walls of different renova-
tion categories do not intersect correctly so manual modifications become neces-sary. This can be done by temporarily sus-pending Renovation Mode. For example, you might have a plan that includes walls categorized as demolition and walls cat-egorized as existing with wall edges that need to be corrected. Remember, objects categorized as New do not interact with objects categorized as Demolition. When you need to make a manual correction, you temporarily interrupt Renovation Mode by freezing the walls you want to modify and then correcting the edges. These changes are not considered part of Renovation. The option to freeze or thaw walls is only avail-able when Renovation Mode is active.
Let’s make this a little more clear. To do a manual modification, click the Freeze Walls button on the Renovation panel of the ribbon. Next, select the walls in ques-tion and hit Enter. Renovation Mode is now temporarily suspended. Proceed with
correcting the wall edges and then click Thaw Walls when finished. Renovation Mode resumes.
ConclusionRenovation Mode is an excellent tool for
those who need to show new, existing, and demolished objects in a drawing. I chal-lenge you to open a drawing and activate Renovation Mode. Explore the possibili-ties for yourself. You will be glad you did!
Melinda Heavrin is a CAD Coordinator for Norton Healthcare in Louisville, Kentucky. She can be reached for comments and questions at [email protected].
Figure 5: Repeated activation of Renovation Mode.
Figure 6: Demolition dialog box.
Figure 7: Revision dialog box.

S e p / O c t 2 0 1 0 1 5
CLIMB TO NEW HEIGHTS.
AUGI CAD Camp will bolster your skills in one day.
Take your career to the next level by attending AUGI CAD Camp 2010. During one-day of intense Autodesk product training and invaluable networking, you’ll discover how to instantly impact your productivity.
Become a fan of AUGI on Facebook and you’ll automatically be entered to win FREE registration for you and a friend at the Fall 2010 camp of your choice.**Must connect to the AUGI Facebook page by August 31, 2010 to be eligible for two (2) complimentary registration fees. One winner will be selected at random from all AUGI Facebook fans and contacted via Facebook message no later than September 3, 2010. AUGI will not be responsible for any travel, accommodation, or other expenses related to winner’s attendance at the CAD Camp of choice.
Join us for AUGI CAD Camp 2010.
For more information, visit www. augicadcamp.com. Dates and Locations:
October10/26 – Boston, MA10/28 – Chicago, IL
November 11/4 – Arlington, VA11/9 – Minneapolis, MN

16 w w w. A U G I . c o m16
“I can’t check out a license!” How often have we or our users uttered these immor-tal words? Doesn’t it always happen when a deadline is on the horizon and we must get a project out the door?
As a user you’ve been told “we just ran out of licenses” or “we’re having issues with the service.” What does that mean? I need to get this project done today! I write this article to clear the mystery sur-rounding licenses: why your company is checking out a license, what a license is, and how to solve the behind-the-scenes problems yourself!
What is a license?Every Autodesk product has something
called a license which, in the most generic definition, tells the software that you have a legal copy of software that you have paid for and can use.
There are two types of licenses: stand- alone and network. Stand-alone licenses are most commonly used on one com-puter and the license is typically never removed from it. It doesn’t require a license “file” or a software program to manage it as it is essentially “static” on a single computer..
A network license is different. Unlike a stand-alone, which has the license built-in, a network license is borrowed from a spot on your network and managed by another software program called a service.
Both of these types have distinct advan-tages and disadvantages.
The stand-alone license file is always available, no worries about it being there…it just is. This is a good option for people who ALWAYS use AutoCAD or another Autodesk program.
But it’s fairly common to have people in the office that only use a specific pro-gram a certain percentage of the time. Is it cost effective to have a license constantly on the computer of a person who uses the software 16 hours each week? Not from a CAD management viewpoint! To solve this problem, network licenses are available.
A network license is used most often by companies that employ individuals who don’t use the software full time. Multiple people can share one license and use it on an as-needed basis. This can save a firm big money. For example, the company might be able to get by with six copies of the software instead of 10. It’s also great for large com-panies that only need a handful of licenses.
For instance, I know a medical research firm that has AutoCAD installed on more than 100 machines in their office, but has only one license for them. To install the software on each machine is free; the license is not. So if they need to ac-cess an AutoCAD file, they typically open AutoCAD for five minutes, review the file, and close it again… and one license serves the company’s 100 users perfectly.
Problems with network licenses
To be fair, many offices don’t have issues with their network licenses. Still, this sec-tion will discuss why you might have prob-lems with them! To better understand this, we need to start at the beginning: Why do our tech guys seem to have problems with these licenses being borrowed?
To understand this, refer to Figure 1, which shows a sample license file from a single server installation (which the major-ity of firms use).
These files can have a variety of names (much like a CAD file) but will tradition-ally end with an .LIC file extension. The good news is that it can be opened in virtually any text-editing program. My favorite is Wordpad, which comes with any version of Windows.
Now comes the tricky part—under-standing it. Some of these items you might recognize if you are very familiar with your network environment, but no one will understand everything in it without some explanation.
The first line in the license file contains the name of your server on the network.
Figure 1: A look at a common license file text.
2010

S e p / O c t 2 0 1 0 1 7
In Figure 1, the name SERVER is in caps. This should always be there—it tells the license software that the next word is the name of the server it is seeking. In this ex-ample, the server name is “servername.” The string of numbers after the server name is actually the Ethernet address of the network card that the License Man-ager is to be using. In layman’s terms, the first line is the name and number of the server.
The #1 reason a license file doesn’t work? The server name or Ethernet ad-dress has changed or was entered incor-rectly in the license file. So if you change the name of your server or put a new net-work card in it, then it’s time to get a new license file.
The next lines include USE_SERVER and VENDOR and every license file has them. For your network managers, the next portion is important: adskflex port=2080. This means that port 2080 needs to be open in order for the computers to pull licenses from the server. Sometimes user permissions and company firewalls block this port, which is why your Autodesk soft-ware won’t be able to get the license file. In short: this “route” for information trans-fer needs to be available.
On the next line, we can ignore INCRE-MENT 48800. The good information for us is what follows: ACD_2006_0. These abbreviations stand for AutoCAD 2006. Each piece of software in the license file will have similar abbreviations. If you don’t see the abbreviation with adskflex… after it, then that type of software isn’t available in the license file.
“Permanent 5 \” tells us that there are five permanent licenses available. So we know that in the example license file it is for five seats of AutoCAD 2006!
In the next line you’ll see another key piece of information: SN=123-45678900. This is the Serial Number for the Autodesk software that was installed.
The remaining information in the li-cense file has been generated by the li-censing system and is of no real use to you.
That being said, the aforementioned information also protects the integrity of the license file. So if you get the idea that changing the number “5” in the license file to “20” is a good idea to get 15 free seats of software, know that it won’t work quite the way you planned! In fact, you’ll likely get an error on the server stating that the license file can’t be read and then nobody will be able to pull a license file to work on their machines. So, there is no way to “trick” the system!
In case you are wondering if there is an easier way to read a license file or un-
derstand if the license file will “work,” there is. Autodesk has a website that will read the license file for you: http://www.licenseparser.com/
Updating the license fileI don’t want to overwhelm the casual
user with technical stuff, but I do need to
help the “technical” manager out with up-grading to the next software release.
It is common practice to “merge” one new license file with the old one if a “new” license file with all the software in it hasn’t been gener-ated from scratch.
Merging two li-cense files is nor-mally a simple process. First copy and paste the “new” license file (the text from the text edi-tor, not the file it-self) onto the end of your existing one. Make sure there is a blank line between the two licenses. Next, delete the first three lines from the text you just pasted in, so that the info you just pasted in now starts with the line “In-crement” (see Figure 2).
That’s it! But it’s important to realize this only works if the exact same software isn’t mentioned twice in the same file. For in-stance, if AutoCAD 2009 with the same se-rial number is mentioned twice in the same license file, the license manager will not be able to pull your license information appro-priately. This sometimes occurs when your total seat count changes or when your newly generated license file also contains informa-tion about your old software.
Introducing LMTOOLSLMTOOLS is a program that is known
as a service. On Microsoft Windows oper-ating systems, a Windows service is a long-running executable that performs specific functions and which is designed not to re-quire user intervention. So it’s a program that starts when your network server starts
and should run without any real outside management. Of course, this only applies once it is set up appropriately the first time. This is easy in theory and sometimes
difficult in practice. What follows is how I set up LMTOOLS and understanding the main tabs.
The first tab under the LMTOOLS in-terface is Service/License File. To set up the service, select Configuration using Ser-vices. It is tempting to use “License File,” but this is a service and should be config-ured that way.
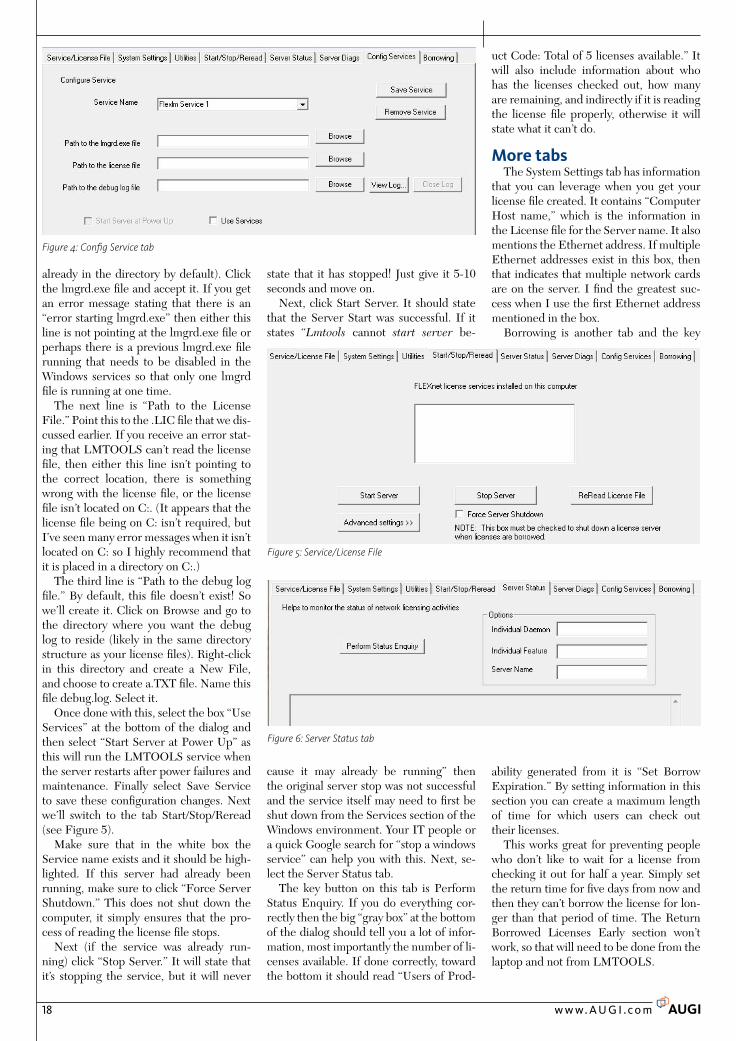
Next, change to the Config Services tab. There are three main fields here and it’s critical that this information is set up ap-propriately.
The first field is Path to the lmgrd.exe file. Click Browse and find this file (likely
Figure 2: Two license files “merged”
Figure 3: Service/License File
18 w w w. A U G I . c o m
already in the directory by default). Click the lmgrd.exe file and accept it. If you get an error message stating that there is an “error starting lmgrd.exe” then either this line is not pointing at the lmgrd.exe file or perhaps there is a previous lmgrd.exe file running that needs to be disabled in the Windows services so that only one lmgrd file is running at one time.
The next line is “Path to the License File.” Point this to the .LIC file that we dis-cussed earlier. If you receive an error stat-ing that LMTOOLS can’t read the license file, then either this line isn’t pointing to the correct location, there is something wrong with the license file, or the license file isn’t located on C:. (It appears that the license file being on C: isn’t required, but I’ve seen many error messages when it isn’t located on C: so I highly recommend that it is placed in a directory on C:.)
The third line is “Path to the debug log file.” By default, this file doesn’t exist! So we’ll create it. Click on Browse and go to the directory where you want the debug log to reside (likely in the same directory structure as your license files). Right-click in this directory and create a New File, and choose to create a.TXT file. Name this file debug.log. Select it.
Once done with this, select the box “Use Services” at the bottom of the dialog and then select “Start Server at Power Up” as this will run the LMTOOLS service when the server restarts after power failures and maintenance. Finally select Save Service to save these configuration changes. Next we’ll switch to the tab Start/Stop/Reread (see Figure 5).
Make sure that in the white box the Service name exists and it should be high-lighted. If this server had already been running, make sure to click “Force Server Shutdown.” This does not shut down the computer, it simply ensures that the pro-cess of reading the license file stops.
Next (if the service was already run-ning) click “Stop Server.” It will state that it’s stopping the service, but it will never
state that it has stopped! Just give it 5-10 seconds and move on.
Next, click Start Server. It should state that the Server Start was successful. If it states “Lmtools cannot start server be-
cause it may already be running” then the original server stop was not successful and the service itself may need to first be shut down from the Services section of the Windows environment. Your IT people or a quick Google search for “stop a windows service” can help you with this. Next, se-lect the Server Status tab.
The key button on this tab is Perform Status Enquiry. If you do everything cor-rectly then the big “gray box” at the bottom of the dialog should tell you a lot of infor-mation, most importantly the number of li-censes available. If done correctly, toward the bottom it should read “Users of Prod-
uct Code: Total of 5 licenses available.” It will also include information about who has the licenses checked out, how many are remaining, and indirectly if it is reading the license file properly, otherwise it will state what it can’t do.
More tabsThe System Settings tab has information
that you can leverage when you get your license file created. It contains “Computer Host name,” which is the information in the License file for the Server name. It also mentions the Ethernet address. If multiple Ethernet addresses exist in this box, then that indicates that multiple network cards are on the server. I find the greatest suc-cess when I use the first Ethernet address mentioned in the box.
Borrowing is another tab and the key
ability generated from it is “Set Borrow Expiration.” By setting information in this section you can create a maximum length of time for which users can check out their licenses.
This works great for preventing people who don’t like to wait for a license from checking it out for half a year. Simply set the return time for five days from now and then they can’t borrow the license for lon-ger than that period of time. The Return Borrowed Licenses Early section won’t work, so that will need to be done from the laptop and not from LMTOOLS.
Figure 4: Config Service tab
Figure 5: Service/License File
Figure 6: Server Status tab

S e p / O c t 2 0 1 0 1 9
Git’r doneSo if you’ve ever wondered why it has
been difficult to check out a license or wonder why your IT staff can’t keep it run-ning properly, these are the major reasons. 1. If there are not enough licenses it’s
because there is a limit to how many licenses your firm has purchased or that multiple people have checked out licenses for longer than they should. This can be resolved by the purchase of more licenses or by limiting the du-ration for which a person can “check out” a license.
2. If your software can’t find a license
it could be because LMTOOLS isn’t running; because your security “per-missions” have not been set up prop-erly; your network security may be blocking your PC or the proper ports; your PC is looking for the license file in the wrong location; or the license doesn’t exist in the license file.
3. If the LMTOOLS isn’t working then it could be a bad license file; a bad/out-dated install of LMTOOLS; improper security privileges; LMTOOLS not started; multiple LMGRD.EXE ser-vices running; the directory structure/file locations could be setup incorrect-
ly; the Server name may have changed; a new network card may have been in-stalled or made “primary.”
4. …and that’s just the start! We haven’t even discussed setups such as redun-dant or multiple server configurations; borrowing licenses over a VPN; a list of all the ports that need to be open; plac-ing the license file in a read/writable drive location (Okay, I guess I just did!); or the meaning behind each error that you can get. For further info, type this into Google: Single Server Network Li-cense Manager Quick Start Guide.
So if you wonder why you/they can’t just “Git’r done,” it’s because there are dozens of places where things can go wrong and hundreds of individual settings in secu-rity, computers, variables, and files where things can go wrong. It’s a challenge for even the best of us if not set up properly and understood from the start. I hope that this article helped.
Brian Myers is the Sr Applications Engineer for Seiler Instrument, an Autodesk reseller in St Louis, Missouri. Brian is a Revit Architecture 2010 Certified Professional and
can be reached at [email protected]
Revit upwith PDFRevit upwith PDF
Start your engine atwww.station32.com/drive
© 2010 Bluebeam Software, Inc.
Bluebeam PDF Revu’s AutoCAD andRevit plug-ins provide more horsepowerfor high quality, one button PDF creation.Gear up your PDF by selecting and reordering sheets, adding dimensions, text stamps, hyperlinks and file attachments. Or, get in the fast lane and choose custom plot settings with Bluebeam batch to create the right set of PDFs the first time. Need more torque? Use Revu to collaborate with anyone, anywhere, at any speed with Bluebeam Studio.
Figure 7: Borrowing tab

REVIT ARCHITECTURE
20 w w w. A U G I . c o m
Editor’s note:Revit software’s project files work best when they contain a single build-ing shell and its contents. How can the user specify where this building is? In this article we look at the mechanisms for referencing real-world locations and coordinate systems inside Revit. The illustrations will reference Revit Architecture, but these tools are also in Revit Structure. Revit MEP makes use of location information as noted in the article, but does not contain tools for site objects or toposurfaces.
–Chris Fox, AUGI Revit Editor
The project interface in Autodesk® Revit® can be a bit unnerving for new us-ers, particularly those with CAD experi-ence. There is no visible center point in a new file, and no indication of where one should start to work. All coordinates seem to be relative. How can one specify an ac-tual location and coordinate project anno-tations to this location? If your building site is not at sea level, how do you indicate this? How does one manage multiple buildings on a campus layout? Is there a Revit GPs app? Let’s take a look at the various tools in Revit for dealing with project placement, and what Revit means by coordinates.
City list and mapsThe Location tool from the Project Lo-
cation panel on the Manage tab opens the Location Weather and Site dialog. You can specify a global location by using the
Default City List or accessing Google Maps via the Internet Mapping Service in the De-fine Location by option list. Either usage provides decimal Latitude and Longitude val-ues, which you can edit. (The default location appears to be a cemetery south of Boston—a “drop dead” message from the programmers?)
All the Mapping functions re-quire internet connection. The Internet Mapping Service pro-vides Google’s imaging options: Map/Satellite/Hybrid/Terrain. You can relocate the Project Ad-dress icon by dragging it on the map (zoom in and out as appro-priate), or you can enter a street address for Google to search and display. In Revit MEP, the dialog holds a Weather tab, which will display temperature information for the selected site based on the nearest published weather station.
Attitude and latitude
You can enter latitude/longi-tude values in the Default City list if your location does not appear. Your location will be named User Defined, and you can refine the location using the Internet Map. Lati-tude and longitude display in decimal de-
grees. You can enter degrees-minutes-sec-onds values without punctuation (spacebar to step) and the field will convert to deci-mal readout. The latitude/longitude of the
Location, Location, Location
Global Positioning in Revit’s World
Figure 1: Mapping options in the Location Weather and Site dialog, and the Weather tab as shown in MEP.

S e p / O c t 2 0 1 0 2 1
project location is used for the sun loca-tion in views with shadows and for render-ings. Latitude and longitude are exported to gbXML for use in energy analysis ap-plications. Latitude and longitude do not copy to the site survey point or site base point—which will be covered later—or to spot coordinates.
The Location Weather and Site dia-log can be resized to make map reading easier, and it can then be used for screen captures. There is no direct link between the Google map feature in this dialog and Google Street View, but you can copy/paste the project address into a browser.
TopographyOnce you have located your project
north-south-east-west, how about up and down? Do you need to show site plans with contour lines that are accurate for your building location? Do your levels need to reference height above/below sea level? There are a number of steps to take, and some quick customizations you can add, that will make your building elevation be site-specific.
I’m going to assume that you will create the toposurface for your building model by importing a CAD file. This is the quickest, most reliable way to create a land form with accurate survey points; you can also import a survey points file if one is available.
Use or make a Site Plan view, and set its View Range deep enough to hold the necessary slope across your project site. Before importing a CAD file, you need to verify the accuracy of the CAD content. Are the lines or polylines that hold contour information properly set for elevation? Are they on clearly labeled layers? Revit reads points on the layers you designate dur-ing the creation routine. Bad points (lines set to elevation 0 are common—don’t use them!) will make errors that can be tedious to fix.
If you have not made toposurfaces be-fore, try making yourself a simple CAD file, with polylines at elevations between 100'-130' (30-40m), import it into Revit, create a toposurface and examine it in vari-ous views. To keep things simple, delete the CAD file.
Site contoursOnce you make a toposurface and can
see it, use the Site Settings dialog (click the arrow at the right of the Model Site panel title bar) to adjust contour line display. Set the Contour Line Display interval as ap-propriate for your primary (thick) contour lines. You can specify additional contours with different linetypes. This control will enable you to show your Revit contours
nearly exactly like the CAD file from which they were derived, so that your site plan can match the civil engineer’s site plan.
Here’s where you can do some custom-izing. In the Object Styles dialog, expand the Topography sec-tion. Click New under Modify Subcatego-ries to create a new type of topographic category. Name it ap-propriately. I’ve used Building Level in the illustrations. Set the lineweight and line type as you need.
Then, to highlight a specific elevation on the site, say as a reference level for a corner of the build-ing, use the Insert button to add a con-tour line. Enter the desired elevation in the Start field, and set the Range Type to Single Value. Set the Subcategory to your new Building Level. You will see a single
contour line at the specified elevation. Use the Label Contours tool to show contour elevations as necessary.
You can duplicate label types to achieve different effects, such as bold or underline text, or different units. Metric users, you can set label contours to display meters with a suffix rather than Revit’s default metric unit, the millimeter.
LevelsTo align your project levels with an el-
evated toposurface, the simplest thing is to move the levels. Do this in an elevation view, and be aware that you might possibly reset the view range of plan views if you move Level 1 (or its equivalent in your project) above Level 2.
Sea level elevations on project levels are of limited usefulness for relative floor levels, so a couple of tweaks are in order. Create a level type named Shared, and set its Elevation Base to Shared. Set Level 2 in your test project to be a Shared Level type.
Start the Relocate Project tool from the Position drop-down tool list on the Project Location panel of the Manage tab. Move the project down by the amount that you moved Level 1 up. Your shared level will report its distance from Level 1, which will be at its real-world elevation that matches your contour plan.
Metric users, there is at present no way to create level types that report units in a different format from the Project Units. You can set Project Unit length to me-ters for levels, and set dimension styles to millimeters.
Figure 2: A new topography subcategory applied to a single contour elevation and labeled using meter units.
Figure 3: A project level showing elevation above sea level and a shared level showing relative level.

22 w w w. A U G I . c o m
Point and survey pointThe Site Plan view in Revit Architecture
displays two datum elements that are hid-den in other views by default: the Project Base Point and Project Survey Point. You find their visibility controls under the Site Model Category in the Visibility/Graphics Overrides dialog. They cannot be deleted.
The project base point defines the origin (0, 0, 0) of the project coordinate system. It also can be used to position the building on the site and for locating the design el-ements of a building during construction. Spot coordinates and spot elevations that reference the project coordinate system are displayed relative to this point.
The survey point represents a known point in the physical world, such as a geo-detic survey marker. The survey point is used to correctly orient the building ge-ometry in another coordinate system, such as the coordinate system used in a civil en-gineering application.
The survey point and base point are at the same place (0, 0, 0) by default, so they may be hard to distinguish when both are displayed, until one is moved. Their de-fault state is clipped, meaning that their lo-cation controls project coordinates. If you move the Base Point when it is clipped, the project moves and shared coordinates change. If you move the Survey Point when it is clipped, model objects do not move, but the shared coordinates of the Base Point change. You can move either
when it is selected by dragging along the axis arrows that appear.
True North and Project North
The top of Revit’s drawing window is Project North, and plan views are set to Project North orientation by default. You can specify an angle for True North, so that at least one plan view will show north like a map, straight up on the page.
The Site Base Point holds a field for en-tering Angle to True North. If you adjust this, the Survey Point axis arrows will ad-just accordingly, as will plan views set to True North orientation. This North adjust-ment does not change the model, only the view. If you use the Rotate Project North tool from the Position control on the Proj-ect Location panel of the Manage tab, you re-orient the model in all views. The de-fault picks are 90° and 180°, or you can use an alignment line.
Spot elevations and spot coordinates
You can place spot annotations to show elevations and coordinates. Both types of annotations can be set to display project
or shared coordinates. You can format the units of spot annotations: metric users can display spot elevations in meters or milli-meters. Plan spot elevations can show top and bottom elevations (as of footers, for instance) with prefixes and suffixes.
Spot coordinates display N as prefix for the North/South indicator and E as the prefix for the East/West indicator by de-fault, but you can edit these. Spot coordi-nates do not show latitude and longitude.
To study the behavior of the Base Point and Survey Point, select each and enter co-ordinate values in the fields, including the elevation. You can also attach spot coor-dinates to each and move them, watching the coordinates update. In our toposurface example, if you relocated the project to get levels to read a certain way, the Base Point elevation will show the relocation value. After moving the Base Point and Survey Point while clipped, unclip them, move them, and observe the results. You can pin the Base Point and Survey Point in position. Pinning disables their relocation properties.
Property linesYou can create Property Line objects
separate from Toposurfaces. You can sketch property lines or enter values in a table. A property line can be converted from a sketch base to a table base, but not the other way. The Site Settings dialog al-lows you to change the values in a prop-erty line table from decimal degrees to degrees-minutes-seconds for purposes of editing the table.
Property Lines compute their areas so long as they are closed, i.e., all segments lie endpoint to endpoint. Unlike floors or roofs, property line sketches can contain a gap. When property lines are open you can close them by editing either the sketch or table.
Links and coordinatesLastly, when you link Revit files togeth-
er, you can control the position of the links inside the host. The Coordinates tools on the Project Location panel of the Man-age tab on the ribbon, and the Site tab of the Location Weather and Site dialog, work together.
When more than one project is linked into a host, as buildings on a site or cam-pus, the main host should hold the site in-formation and will push (Publish) its coor-
Figure 4: Project Base Point and Survey Point, alone and with Spot Coordinates.

S e p / O c t 2 0 1 0 2 3
dinates out to the individual links. You can do this from in the host or from in the link, where you use Acquire Coordinates.
In a file that will be linked into a host, if you intend to have more than one copy of the link in the site file, create a list of named sites on the Site tab of the Location Weather Site dialog, as many as you will place in the host. A Site named Internal exists in all files. In the illustration I have created sites named A and B. These are names only at this point. You do not create named locations in host files.
In the host file, place copies of the link where they need to be, or close to the pre-sumed final locations. Select each link in turn. On the Properties palette, pick the <Not Shared> field next to Shared Site to assign this position to one of the names in the list.
When link instances have been assigned location names, open the Manage Links dialog, Revit tab. The check box marked Positions Not Saved will have a tick. Se-lect the name of the relevant link in the list and click Save Positions. This reads the position information in the host file back into the link. You can then relocate link instances in the host by selecting one and using its Shared Site property to move it to an unassigned named location. This allows you to change building locations without dragging or rotating by the cursor.
Without saving link location information back to the link, when links are reloaded they will revert to previous locations. If you intend for a link location in the host to persist, save the named positions for the link as described above. This sounds more complicated than it is in practice.
With Revit, things get complicated soon enough, so I encourage you to practice all these procedures in very simple files so you can calibrate the results you get and understand what typical position changes will produce in the model, in views and in annotation values. Good luck with your Revit GPS!
Chris Fox is the Revit edi-tor for AUGIWorld, and has written numerous ar-ticles on Revit Architec-ture, Revit Structure and Revit MEP. He has written Autodesk Official Training
Courseware for Revit Architecture and Revit Structure and Introducing and Implement-ing Revit Architecture 2010, published by Autodesk Press. Chris recently moved from the US to Australia, and is leading training classes in Revit through corporate, universi-ty and technical school contacts there. You can reach him at [email protected]. Figure 5: Dialogs for creating named sites in a link, assigning site names in a host, and saving positions
from the host back to the link.

A common request from Autodesk® Revit® Structure users is to have more control over the Graphical Column Schedule tool. One thing users are looking for is the ability to capture Base Plate Connection information within the Schedule. Unfortunately, as everyone has discovered, there are limitations to what you can actually control within the Graphical Column Schedule.
Figure 1 shows some of the basic controls you have, such as Grid Appearance, Text Appearance, and controlling which levels are displayed.
Creating a key schedule
One method I have found to show the base plate information is to generate a Key Schedule. A Key Schedule al-lows you to attach as many fields of data you need but only refer-ence the Key in your main col-umn schedule. The remainder of this article will show the Base Plate Connec-tion information process for this approach.
To begin, se-lect the Sched-ule /Quant i t ies tool from the Schedules drop down found in
your view ribbon panel.When the New Schedule dialog box appears, check select
Structural Columns from the Category and Schedule Keys for the type of Schedule. Enter the Key name, which will appear in the instant properties of your Structural columns in a project.
AUTODESK REVIT STRUCTURE
24 w w w. A U G I . c o m
Using Schedule Keys with Column Schedules
Figure 1: Graphical Column Schedule Properties
Figure 2: Schedule Quantities tool
Figure 3: New Schedule dialog box

S e p / O c t 2 0 1 0 2 5
Once you exit this dialog box by select-ing OK, you will be placed in the Sched-ule Properties. This is the location where as many fields that are required can be added. These fields are directly associated with the Schedule Key. This allows you to automatically populate a schedule with these additional fields by just selecting the Schedule Key.
Select “Add Parameter” to add the first custom field. This will place you in the Pa-
rameter Properties dialog box. This is where you will specify the name and type of parameter to add.
The two parameters I will add for this sample are Base Plate Type and Anchor Bolts. Once these two parameters have been added, the rest of the settings are the same as other schedules in-side of Revit. Now that the parameters have been identified, the Keys need to be defined. When the active view is the Key Sched-ule just created, select “New” from the Row tab of the Modify Schedule/Quantities Ribbon Panel. This will add a new Row and Key which you can fill in the data needed.
Figure 7 shows a complete Key Schedule with six different keys and associate parameter data.
Assigning schedule keysOnce the Keys have been established all the Structural columns
with Base Plate connections need to be assigned to the appropri-ate Key.
Notice when the Key is assigned to the Base Plate Information of the column that the Base Plate Type and Anchor Bolt param-eters are automatically populated. This shows the true benefit of using Schedule Keys. The Key is used to bring along all of the associated parameters with it, so the user does not waste a lot of time manually filling in all the data.
After Schedule Keys have been assigned to the Struc-tural Columns with Base Plate connections a Structur-al Column Schedule needs to be created.
Creating column schedule
Figure 9 shows the fields used in this example for the Column Schedule. The type field will provide the Struc-
Figure 4: Schedule Properties
Figure 7: Completed Key Schedule
Figure 8: Assigning the Schedule Key
Figure 5: Parameter Properties
Figure 6: Key Schedule

26 w w w. A U G I . c o m
tural column shape. The column location mark is useful so the placement in the struc-ture can be identified. The Base Plate Type and Anchor Bolt specifications are both parameters directly from the Schedule Key that was created.
Not all columns in the structure being designed will have a Base Plate Connection. For this reason, it is important to apply a fil-ter to your Structural Column Schedule so those columns will not be displayed.
Figure 11 shows a sample of a complete Structural Column Schedule containing the Base Plate information.
Bringing it all togetherTo unite everything together drafting
views will need to be created detailing the different Base Plate types.
Figure 13 shows a sample sheet lay-out that can contain a Graphical Column Schedule, the newly created Structural Col-umn Schedule and the Base Plate Details.
SummaryHopefully, in future releases of Revit
Structure, Autodesk will expand on the Graphical Column Schedule to contain other parameters. Until then I hope this exercise provided you with the knowledge needed to expand your Revit skill set.
Phil Russo began with AutoCAD version 2.5 in 1986. Through the years, he has held positions in the CAD industry as CAD draftsman, CAD man-ager, applications engineer, and Autodesk Certi-fied Instructor. Lately Phil’s focus has been on the development and implementation of standard practices for the Autodesk Revit product line in-
cluding Revit Architecture, Revit Structure, and Revit MEP. He cur-rently works at Lindemann Bentzon Bojack, an architectural and engineering firm located in Clermont, Florida. He can be reached at [email protected].
Figure 9: Schedule Properties
Figure 10: Schedule Filter
Figure 13: Sample sheet layout
Figure 11: Completed Structural Column Schedule
Figure 12: Sample Base Plate detail view

If you have never attended Autodesk University (AU), you’ve missed out on the most unique, once-a-year, learning and networking event available to Autodesk product users and design professionals anywhere.
What Brings Design Professionals Back to AU Year After Year?• Autodesk product-specific and industry-focused classes taught by real
working professionals
• Hands-on labs, plus PowerTrack classes for advanced users
• Free on-site Autodesk Certification Exams
• On-site networking with the international Autodesk community
• Conference passes include: meals, hotel, entertainment…everything!
Nov. 30 – Dec. 2, 2010, Mandalay Bay Hotel, Las Vegas
600 Topics, 400 Speakers, 3 Days…One Huge Return for You
Register beginning August 31, 2010
Learn more today at www.autodeskuniversity.com
Autodesk University 2010 User Conference and ExhibitionMandalay Bay, Las Vegas, USANovember 30–December 2, 2010
Autodesk University Virtual 2010Streaming to Your DesktopNovember 30–December 2, 2010
Autodesk University ExtensionLocations WorldwideDecember 2010–January 2011
2010
Silver SponsorsPlatinum Sponsors Associate Sponsors
Silver SponsorsPlatinum Sponsors Associate Sponsors
Can’t make it to Las Vegas? Let AU come to you.

AUTOCAD
28 w w w. A U G I . c o m
What Lies Beneath?Digging down beyond the civil tools in AutoCAD Civil 3D
Many of us happily live in the Civil 3D Workspace for weeks or months at a time and barely take a second glance at the other workspaces available to us. Be-neath the surface of AutoCAD® Civil 3D® lies a fully fledged GIS package in MAP 3D, not to mention the ever-increasing AutoCAD toolbox.
A recent project for a new underground metro station and tunnels in Hong Kong required a 3D model to visualize the sub-surface structure of an existing hotel com-plex in relation to the proposed works. Alongside that, the existing geological conditions needed to be displayed and interrogated. All three main ‘layers’ to AutoCAD Civil 3D were needed to com-plete the model.
Our source data varied from spread-sheets, PDF scans of historic data, DGN and DWG files, DXF output from con-touring packages, survey drawings, and a geotechnical database for our borehole data. Somehow, we had to combine all this into a 3D model and generate data for later use. Let’s take a look at some of the processes involved.
Cleaning up the geologyWe may as well start with the material
that has been there long before mankind came to Hong Kong—the bedrock!
This task is made fairly easy as the con-tours are provided by our geologist from a well-known surface creation package, but the contours are very closely spaced and often dense with data points. While this creates a nice, smooth-looking surface, it creates quite a lot of overhead for the drawing; this is where one of our Map 3D tools come into play.
Clean Up: After importing the contours from DXF, I switch to Tool Based Geospa-tial workspace and click Tools Tab > Map Edit Panel > Clean Up. (Command line: MAPCLEAN)
This launches the Clean Up Wizard Di-alog; I manually select my contours, click Next, and then run the following four tools (with default settings);
• Delete Duplicates• Simplify Objects• Zero Length Objects• Weed Polylines
‘Modify the original objects’ and ‘Fin-ish’. That’s a typical quick toolset to help ensure your polylines aren’t too heavy and keep your surface manageable; particular-ly useful if your surfaces cover a very large area or are very dense.
Simplify Surface: Jump back to Civil 3D Workspace, add your contours to your surface, and if you require further reduc-tion in the numbers of triangles in your surface, a quick Surface Edit using ‘Sim-
Figure 1: Borehole Data and a rockhead surface

S e p / O c t 2 0 1 0 2 9
plify Surface’ in the Toolspace will do the trick. (Using a boundary on your surface will also help keep the presentation tidy and focused.)
At this point I use a third-party AutoCAD add-in called KeyHOLE (Keynetix Ltd.) to plot my boreholes into my drawing as 3D solid ‘sticks’ in ‘real space’. These are plotted immediately from a geotechnical database and colored by rock weathering grade to enable me to compare the interpreted rockhead surface with my down-hole data.
Archive data ‘Ins and Outs’The next task is to build the existing
hotel basement structure into our model. The hotel was cut into the rock on the side of a steep mountain slope, as is common in Hong Kong, and as such, the retaining structures and piling was significant. Un-fortunately, we didn’t have our historic data in a nice tidy BIM with export op-tions! So, what to do next?
DGN Import: Some of the old as-built files had been digitized and we had re-ceived them in DGN format. AutoCAD allows you to overlay a DGN via the XREF command, but with Map 3D you can im-port this format directly into your drawing (Command line: MAPIMPORT). After importing the DGN, I now had a bound-ary line for the floor structure, my caisson locations, without labels, and critical piles with labels.
The floor structure was a simple mass outline extrusion, duplicated to represent
floor levels, using AutoCAD’s 3D Solid Modeling workspace.
It was critical to show the found-ing depths of our foundations, and in order to extrude our 2D piles currently shown in plan to the cor-rect 3D length, I intended to cre-ate a dataset of Easting, Northing, Z Level and Pile Name (ENZP) to create COGO Points in Civil 3D to snap to when doing the extru-sions. With a couple of hundred piles to show, the dataset would mean each extrusion would be just one or two clicks rather than “read
the depth, then type the number, hit enter, etc.” for each and every pile!
Data Extract: First up, we had spread-sheets which listed our pile names and pile depths, but they had no coordinates for me to create ENZ data from. Here’s the trick: All text labels were placed and aligned such that their insert points were at the center of the pile circles. (To keep things clean I did a WBLOCK of the text objects out to a new temp drawing.) Then running the Data Extraction Wizard by selecting (Civil 3D Workspace) Insert Tab > Linking & Extraction Panel > Data Extraction (Com-mand line: DATAEXTRACTION), I then
Figure 2: ENZ Data
Figure 4
Figure 3: Use the AutoCAD & other tools as much as possible before resorting to manual data entry of historic data

had text label values and ENZ coordinates in an XLS file. I com-bined this with my pile depths in Excel using VLOOKUP to create my final dataset.
Saving my ENZP file as a CSV, I then used Civil 3D to Cre-ate COGO points which now represented the bases of my critical piles.
Extrude and ‘flip’: Now I had the plan view and base point of all my critical piles. I ran the Ex-trude command on each of my individual circles (which were all drawn at 0.00), and snapped to the COGO points to create piles to the correct depth.
Or were they? The more ob-servant amongst you would have known that when you click a dis-tance for an extrusion path it is al-ways positive, i.e., for a pile base of -7.50m, my extrusion was 7.5m long, so the default meant that now my pile was drawn from 0.0 to +7.50m. (It is relevant to add here that 95% of my piles had a ‘negative RL’ founding level).
No problem, though. I simply com-pleted the extrusion of all of my piles, and then did a mirror from a ‘side view’ UCS flipping them all about RL zero! To finish the look, I added another group-extrude of all of my piles from zero up to the ap-propriate basement floor level.
Super quick XYZ data plotting
Having completed the caisson wall around the boundary of my property from “zero down” in a similar way to the base-ment piles, I had to now create the top half of wall. This created another prob-
lem. Rather than a nice and simple “ex-trude to one reduced level” as required previously, now each and every pile had a specific, accurate pile cutoff level. Now, as someone who will avoid the manual entry of data at any cost, I needed a solution to this, and fast! Searching out and entering an RL for each and every extrusion for 123 piles didn’t sound like my idea of fun, but I then went back to my data tools. I had XY locations of each pile from my data extraction, all I needed to do was extract the EGL tops from our other data tables, and create a text file where the data was formatted in “X,Y,Z” format.
3DPOLY - Paste to Command Line. This was a simple and effective trick I learned some time ago; I opened the text file I created, copied the contents (no headers, please!) and ran the 3DPOLY command in AutoCAD, I then pasted the
contents, and wham, instant XYZ refer-ence for the tops of all my piles!
Grip Edits on Extrusions: Since Civil 3D 2010, it has been possible to grip edit
extrusions and ‘stretch and grow’ them to the right length. Now, by simply do-ing another mirror on my piles so I had a ‘stretch’ grip (arrow) pointing up toward my datum 3D polyline, I could simply grip edit them all. A couple of minutes later, all of my piles are done!
Cliché? An oldie but a goodie!
As I hope you can see, utilizing data, moving both in, and out, of Civil 3D can save you plenty of time. Not only that, it can provide a basis for database construc-tion, reporting, and checking of engineer-ing design. The ‘Data Extraction Tool’ for output, and the ability to create objects in “real space” using Civil 3D and Map 3D from ‘raw data’ files, are rapidly becoming two irreplaceable tools in my tool box. I trust that you will soon add them to yours!
One last warning, however, in that the old cliché is true: if you put garbage in, you get garbage out! Ensure that you have a sound checking procedure in place so that when you create a beautiful 3D mod-el, it’s also true and accurate!
Kent Langdon has been moving data through Au-toCAD products for near-ly 20 years. With a Civil & Geotechnical Engineering background, he broke out of the 2D drafting mould
when he recognised the value of seeing data in “real space.” At Enzdata Limited, he has been consulting recently in Hong Kong, Sin-gapore, and Pakistan on 3D and data mod-elling projects from his base in Auckland, New Zealand. You can contact him at [email protected].
30 w w w. A U G I . c o m
Figure 7: The Final Model with Rockhead & Boreholes
Figure 5: Pasting XYZ Data to a 3D Pline then grip editing the caissons
Figure 6

32 w w w. A U G I . c o m
AutoCAD ARCHITECTURE
The space object is one of the architectural object types found in AutoCAD® Architecture (often called ACA). Space objects are unique from the typical ACA objects because of their abil-ity to change from two-di-mensional shapes to three-dimensional extrusions. As a 2D geometry type, the space object delineates a room’s area measurements and is very use-ful in the early stages of the design process. As a 3D ge-ometry type, the space object’s role is to capture an area’s spatial volume and define its finish floor and ceilings (see Figure 1).
Space objects have many important functions in ACA. Although their main function is to contain room identification and finish data, space objects also play a primary role in the programming and anal-ysis diagrams during the space planning phases of a design project. This topic re-views how to use the space object with its imbedded BOMA standards to create dia-grams and schedules that calculate the net, usable, and gross building areas according to this standard.
Setting Up for the BOMA Standard
There are a few steps to ensure that each drawing is using the BOMA standard. First, all existing drawings in your project need to have the Calculation Standard (located in the Options dialog>Aec Ob-ject Settings tab) set to BOMA Standard. Next, you will also want to load the
BOMA room tag into all of your interior Construct drawings.
To verify and change the drawing’s preferences, open the Options dialog and select the Aec Object Settings tab (see Figure 2).
• Verify that the ‘Automatically up-date associative spaces’ is checked.
• Set the Calculation Standard to ‘BOMA Standard’.
Note: The Calculation Standard variable is a drawing variable and therefore needs to be set for each Construct and each View drawing. To use this standard for all your
Using Spaces to Apply BOMA Standards
Figure 1: Space object
Figure 2: Options dialogue

S e p / O c t 2 0 1 0 3 3
future projects, complete the above steps in the template file you typically use for projects. The default file is the ‘Aec Model (Imperial Stb).dwt’ template file located in the C:\ProgramData\Autodesk\ACA 2011\enu\Template folder.
Set up each floor’s interior Construct file
Hopefully, the ACA Project Naviga-tor is being used to manage and assemble the firm’s design projects. With the Proj-ect Navigator’s organizational structure, spaces are placed in the Construct files where the interior walls and doors are lo-cated (see Figure 3). Additionally, you can place spaces in separate Construct files, especially during the programming phases of a project.
For existing projects, open each interior Construct file. For each file:
• Set the calculation standard. Open the Options dialog > Aec
Object Settings tab and set the Cal-culation Standard to BOMA Stan-dard.
• Load the desired tag that you will use to label your space objects.
Go to the Document palette and select the Tags tab. Left-click the Room Tag BOMA and then use the ESC key to deselect (see Figure 4). This is a simple way to load an ob-ject or object style into a drawing file without actually placing.
Adding Spaces to the Interior Construct FilesDecide which space geometry type to use
Decide how you will ultimately use your spaces. If you are not using the room finish and volumes property set data, us-ing the two-dimensional geometry type is sufficient.
Add the necessary space separatorsYou can easily divide large spaces into
smaller distinct zones using space separa-tors. This allows you to place a space ob-ject for each zone. Space separators need to cross the wall’s justification lines (see Figure 5).
Add your spacesAfter defining the zones with space sep-
arators, insert the space objects using the Generate and the BOMA offset boundar-ies property options (see Figure 6).
1. Select space style in the Design tool palette>Space tab.
2. In the Properties palette, choose the Generate option for the create type and choose the desired geom-etry type of the space object. For the Offset boundaries property, choose ‘By standard (BOMA stan-dard)’ as shown in Figure 7.
3. Place your space in its appropriate room or zone by left-clicking within its boundary.
4. It is good practice to ‘Send spaces to send to back.’ You can quickly accomplish this by using the quick select tool (see Figure 8).
5. Finally, using the BOMA tag, place and adjust the tag locations for each space object.
Note: When using the Generate option,
Figure 3: Project Navigator
Figure 4: Room Tags
Figure 6
Figure 7: Properties Palette
Figure 5: Room Plan

34 w w w. A U G I . c o m
wall openings automati-cally create separations between spaces which can be problematic when you want to create separate corridor assignments (see Figure 9 ).
Create a Simple Space Use Diagram
Using the Project Navi-gator, create a new view for the diagram. Remem-
ber, each diagram type should have its own View file (see Figure 10).1. Open the Documentation tool palette>Theme tab and select the ‘Theme by Space Type’ tool (selecting the appro-
priate building type category).2. Left-click to locate the legend. Press enter to have the legend size itself.3. Save your View.
Create a BOMA Space Use Diagram
Using the same procedure for Simple Space Use Diagram, create a new view and
place the ‘Theme by Space Type-BOMA’ legend (see Figure 11). The area schedule in Figure 12 illustrates the area differences between net, usable, and gross.
Creating Customized Display Configurations
BOMA floor area measurement stan-dards differentiate between net, usable, and gross floor areas. To create the three types of diagrams, you will first need to create Display Configurations for each,
i.e., a Display Configuration for Net Area, Usable Area, and Gross Area. To use this standard for all of your future projects, complete the following steps in the tem-plate file you typically use for projects.
In the Manage tab of the ribbon, open the Display Manager
Create the Display Configuration I routinely use the Presentation Display
Configuration for all my diagrams because it automatically adds solid hatches to walls. To create the BOMA diagrams, I will du-plicate this Display Configuration (see Figure 13).
Expand the Display Configurations folder.
1. Right-click on the Presentation Display Configuration and select the Copy command. Right-click
Figure 8
Figure 9: Openings between corridors create problems
Figure 10: Project Navigator with Views Figure 11: BOMA display theme
Figure 12: Area schedule

S e p / O c t 2 0 1 0 3 5
again and select the Paste com-mand. Repeat until you have three copies.
2. Name each. I have used Presen-tation Gross Area, Presentation
Net Area, and Presentation Usable Area.
Create the Display SetsExpand the Display Sets
folder:1. Right-click on the Presentation Display Set and select the Copy command. Right-click again and select the Paste command. Repeat until you have three copies.2. Name each. Again, I have used Presentation Gross
Area, Presentation Net Area, and Presentation Usable Area.
Create the Display Representation for the Object
Expand the Representations by Object folder. Scroll down until you find the Space object. Select the Space object.
1. In the right-pane, right-click on the Plan Presentation Display Rep and select the Duplicate command. Re-peat until you have three copies.
2. Rename each.3. Set each Display Rep to their ap-
propriate Display Set.4. In the left pane, select the Display
Set and then revise the hatch and boundary visibility setting. Figure 14 shows the Display Set Plan Pre-sentation Usable Visibility settings.
Change the Top View of each of your new Display Configurations to the ap-propriate Display Set
Figure 15 shows the example Display Configuration setting for the Presentation
Usable Area display configuration. Use this example to adjust the settings for the Presentation Net Area and the Presenta-tion Gross Area Display Configurations.
Finally, add style overrides to specific space styles
For the Presentation Usable Area, turn off the visibility for the stair, elevator, cor-ridor, toilet room, etc. space styles.
For the Presentation Net Area, turn off the visibility for the stair, elevator, and cor-ridor space styles.
Figure 16 shows a plot sheet with each of the three space BOMA Floor Area Mea-surement Diagrams ready to be plotted.
Carolyn Gibbs is a li-censed architect (in Cali-fornia) with more than 10 years of experience prac-ticing architecture in the Baltimore, Maryland, and Sacramento, Califor-
nia. She has more than 17 years of experi-ence using, customizing, and teaching the various computer aided design and visual-ization software. Carolyn has her expert certification in Architectural Desktop—now called AutoCAD Architecture (2006) and Revit Architecture (2009) and has pub-lished The Design Studio— Developing Technical and Creative Skills Using AutoCAD and ADT (Fairchild Publishing, 2008). She is currently an Associate Professor at Sacramento State University. Her ongoing research is devoted to technology and its relationship to the creative process.
Figure 13: Display configuration
Figure 14: Display representation
Figure 15: Display configuration
Figure 16: BOMA use diagrams

AutoCAD Civil 3D
36 w w w. A U G I . c o m
During design of projects it is often necessary to produce reports to convey information contained within the Civil In-formation Model (CIM). Out of the box AutoCAD® Civil 3D® provides three types of reports, LandXML Reports, .NET Re-ports and Parcel Map Check Reports. By utilizing these reports we are able to ex-tract the information from the CIM. All of the reports may be run from the Tool-space; though the LandXML reports may also be accessed outside of Civil 3D.
The goodThe LandXML and .NET reports are
easily accessed through the Toolbox. If the Toolbox is not already open, it may be accessed from the Home ribbon tab, pressing the icon that resembles a toolbox on the Palettes panel. Alternatively the Toolbox may appear by typing ‘Toolbox’ at the command line. The Reports Manager, within the Toolbox, contains the various reports arranged by the object type. Run the reports by double clicking the report or right clicking and selecting ‘Execute…’. Depending on the type of report, LandX-ML or .NET, a different type of user inter-face is provided. LandXML reports pro-vide the LandXML export dialog box while the .NET report will provide a dialog box with a variety of options depending on the report type.
The Parcel Map Check Reports are run by right-clicking on the Parcels under the Site and choosing “Export Analysis…”. There are two analysis types, inverse analy-sis and Mapcheck analysis. Unlike the oth-er two types of reports this report may not be modified or customized, though one can create their own report to mimic it.
LandXML Reports utilize XSL style sheets to convert LandXML files into html reports. Upon running a report, Civil 3D
creates a LandXML file which is then converted into a report utilizing the ap-propriate XSL style sheet. The completed report shows up in an Internet Explorer window or some LandXML reports may provide a Save As dialog box to specify an alternative file format such as PDF. As an added bonus, the LandXML reports may utilize the LandXML Reporting program. This means that it is possible to utilize LandXML files to create reports without opening Civil 3D.
.Net Reports extract information direct-ly from the drawing utilizing the options selected from the dialog box. The reports provided out of the box utilize the vb.NET programming language, hence the name of the type of report. An advantage of .NET reports is the ability to save the reports in a variety of formats. Formats include
HTML, Microsoft Word Document, Microsoft Excel Workbook, Adobe PDF or Text Document.
The badOverall the reports provide a good
way to extract information out of the CIM, but as with all software pack-ages, there are some bad problems that come up. One of the first prob-lems new users encounter is figur-ing out where to set the precision of the reports. The problem is further confusing due to how the LandXML and .NET reports determine which precision to use. LandXML utilizes the Report Settings, which is stored in an XML file. In Civil 3D 2011 the Report Settings may be accessed from within Civil 3D. Previous ver-sions of the program require open-ing the LandXML Reporting pro-gram and altering the values in the separate program. The .NET reports utilize the drawing’s Ambient Set-
tings for units, precision and the like.Occasionally a report item does not for-
mat the numbers or precision from the set-tings as expected. For instance, the Station and Curve Alignment Report does not uti-lize the correct format or precision settings for the Station Equations at the top of the report if station equations are utilized. Be-fore utilizing a Civil 3D Report make sure to check to make sure results of the report contain the correct formats and results.
As previously stated, .NET reports may be saved to various Microsoft Office prod-ucts. Unfortunately, if the appropriate software package is not installed, an option for a Word Document, Excel Workbook or Text Document will not be available.
A minor bad item is the inability to de-termine which type of report is to be run.
Civil 3D Reports: The Good, the Bad, and the Ugly
Figure 2: Reports Manager

S e p / O c t 2 0 1 0 3 7
In previous versions of the program dif-ferent icons were utilized for the two dif-ferent types of reports. Currently in Civil 3D 2011 all of the report icons appear the same, meaning the report has to be run before the type of report is known. Alter-natively the report type may be found uti-lizing the Toolbox Editor.
Some CIM objects are conspicuously absent, such as a superelevation report. Users going from Land Desktop to Civil 3D may find the report format different. Correcting these bad things is where the “ugly” comes in.
The uglyThe ugly part of Civil 3D reports is the
ability to customize the reports or create your own reports. This part of reports is ugly since it takes extra work on the user’s part. Civil 3D allows the inclusion of ad-ditional custom reports right along with the reports out of the box. Additionally the reports may be modified. So the format and precision of the station equation re-ports may be revised to give the expected results. If the existing reports are revised, one needs to make sure they changes are not undone by hotfixes or updates.
To add a report to Civil 3D, open the Toolbox Editor and add an item to the list. Fill in the required information in the edi-tor. The macro may be located in the same folder as the Civil 3D Reports or placed in another location of your choice.
Modifying the LandXML reports may be done in a Notepad or using a third-party application created for creating style sheets. .NET reports may be modified utilizing the free Microsoft Visual Studio Express. Once the .NET reports are modi-fied, they need to be compiled and the C3DReport.dll would need to be overwrit-ten. It may be advisable to create your own C3DReport.dll to prevent updates or hot-fixes from undoing the modifications.
Civil 3D reports provide a method to convey information from the CIM to non-Civil 3D users. The reports are easily run from the Toolbox. Modifications to the reports are possible to customize them to meet your own requirements or correct deficiencies within the reports. Extending
the content of the reports is possible by creating your own custom reports.
Christopher Fugitt is a Civil Engineer and has spent the last eight years designing government projects as well as residen-tial subdivisions. Before working as a Civil Engi-
neer, Christopher worked for a General Engi-neering Contractor on subdivision and min-ing projects. Christopher earned his B.S. degree in Civil Engineering from California Polytechnic State University, San Luis Obispo. Christopher maintains and authors the Civil 3D Reminders blog at http://blog.civil3dreminders.com/
Figure 2: ToolboxEditor
CivilCivil3D3D
Civil3D
Civil3D
Civil3D
Civil3D
Civil3D
Civil3D
Civil3D
Civil3D3D3D
Civil3D
Civil3D
Civil3D
Civil3D
Civil3D
Civil3D3D3D3D3D3D3D3D
Easy to use PRODUCTIVITY TOOLS for Civ i l 3D
Authorised Developer
CivilCivil 3DEssentials Civil
Toll Free: 1.866.260.2514

AUTODESK REVIT
38 w w w. A U G I .c o m
Every now and then we need to talk about drafting convention issues, which always seem to be controversial because people have different opinions about how drafting should be done, particularly when it comes to drafting symbols. Yet without a standard set of accepted drafting symbols, communication between project team members would be as if everyone were speaking different languages. Therefore, an accepted standard for drafting sym-bols and annotation is required in order to facilitate the communication of infor-mation between architects, contractors, and engineers.
For years there have been efforts to create drafting standards. The United States National CAD Standard from the National Institute of Building Sciences is an attempt to establish a nationwide accepted method of drafting and anno-tation. And even though there is a “com-mon” drafting standard in the construc-tion industry, we are always trying to reinvent things depending on the tools we use for drafting. This is particularly true when it comes to computer drafting. We face the same issues again in Autodesk® Revit®: “How do we do this or that in Revit?” or “How can we change it so that we can do this or that in Revit?”
Representing Fire Lines in Revit-creat-ed drawings is a case in point. What is a fire line or fire-resistive rated line? Some may refer to this as fire tapes, remembering the “good old days” of manual drafting when we taped stickers from letra-symbol sets
into our drawings. The fire-resistive rated line is a linear pattern that represents the fire resistance rating of a wall or partition. Although there are several variations of the patterns used to represent fire ratings, the most commonly used method is to draw a thick line using a combination of long and short dashes where each short dash repre-sents one hour (see Figure 1). I have seen drawings where the rating is represented alphanumerically (“1HR”) repeated over and over along the line, diamonds used in-stead of short dashes, and the variations go on and on.
One might say, “Who cares what they look like?” But we need to remember that we are not the only ones who will
look at the drawings we produce. There will be other people who need to under-stand what was put on the drawing, es-pecially those who will be reviewing and approving them in government regula-tory agencies such as the American Health Care Association (AHCA), which reviews and approves hospital and other healthcare type projects.
If you’ve ever had to sit down in an AHCA review you know what I mean. Some reviewers actually sit down in front of you with a set of colored markers to highlight every rated partition shown on the drawing, and they do look at them with
particular attention. The requirements for drawing sub-missions to AHCA specify that all fire rated partitions need to be clearly identified in the life safety plan and coordinated with all other plans in the document set. Therefore, these rated lines will show in multiple plans that may be drawn at different scales.
This creates the following issues:
how can we represent fire ratings in plan so that we only do it once, and, how do we make it clearly visible in multiple scales?
In the Line of
Fire
Figure 1: Fire rating lines

S e p / O c t 2 0 1 0 3 9
When a floor plan is too large to fit in its entirety on a standard sheet of paper it is customary to split the plan in areas to maintain a good readable drawing scale, such as 1/8"=1'-0". On the other hand, life safety plans are generally shown at small-er scales in order to show an entire floor of a facility.
Let’s examine some of the most com-mon methods used to create fire lines in Revit to compare the efficiency of each method.
Coarse scale fill patternWall families have a parameter called
Coarse scale fill pattern that fills the inside area of the wall with a user-specified fill pattern when the detail level display set-ting is set to coarse (see Figure 2). Set a different pattern with a different color or perhaps just a solid fill with a particular color for each fire rating, assign it to the respective wall type, and you’ve got it.
The pros: • Automatic fire rating identification with
wall creation.• Available in all plan views.• Easy setup.
The cons:• View must be set to coarse detail level
for the rating to display. That is perfect-ly fine for the life safety plan, but other plans may want to be in medium detail for several other reasons.
• Not scalable. The rating identification is limited to the wall thickness. In small scale life safety plans it may be difficult see the rating clearly.
• The fire rating cannot be extended be-yond the wall. Many reviewers like to see the fire rating line extended beyond the end of the wall at smoke compart-ment separations, which would not be possible using this method.
• The rating pattern is interrupted at wall openings. This makes it even harder to follow rating at small plan scales.
Model lines and drafting lines
Model lines could be used to represent the fire rating very easily by applying a line pattern specific for the repre-sented rating. To set up, go to the Manage tab and click Line Styles un-der the Additional Set-tings tool in the Settings panel to create a line style for each fire rating and assigned it a respec-tive line pattern.
The pros:• Easy setup.
• Lines can be constrained to walls.• Lines can be extended beyond the
end of the wall at smoke compartment divisions.
The cons:• Not automatic. The line must be drawn
after the wall.• Can only be seen if walls are transpar-
ent or the line is created at the wall cut line level.
• Where the line must do multiple turns, each segment is a separate line. No “polylines” here.
• Model lines will need to be filtered out when showing in views where the line should not be visible, such as elevations.
• Drafting lines are view dependant; thus, they will not show in multiple views and must be copied from view to view. A co-ordination nightmare.
FiltersFilters can be used to change the display
properties of an object based on specified criteria. A filter could be created to change the line pattern of the wall and/or its color according to the Fire Rating Parameter of the wall. To do this, create a new filter and assign it to wall objects. Then select the Fire Rating parameter equal to a number or text you want to use to indicate rated hours (see Figure 3). Repeat the process for each fire rating.
The pros:• Easy setup.• Automatic fire rating identification with
wall creation.• Available in all views where the filters
are added.
The cons:• May be difficult to see in small scale
drawings where pattern may not com-plete due to short wall length.
• Changing the wall line pattern may not be appropriate for all plan views. This may be fine for life safety drawings but not for regular floor plans.
• Rating cannot be extended beyond the end of the wall at smoke compartment divisions.
• Not scalable. You cannot change the fire line thickness for small scaled plans.
Grid linesGrid lines are generally used to indicate
the centerline of structural column and beam locations. They can also be used to indicate fire lines because their display is not affected by the wall. All you need to do is create new types of grid lines and as-signed them line patterns accordingly.
The pros:Easy setup.
Figure 2: Coarse scale fill pattern
Figure 3: Create filters based on specific wall property criteria.

40 w w w. A U G I . c o m
• The grid line visibility will not be blocked by wall object.
• Visible in all views.• Can be constraint to centerline of wall
object.
The cons: • Not automatic. The grid line must be
created after the wall.• Filters must be created to prevent fire
grid line from displaying in elevations.• User must change visibility settings per
view to change line thickness at differ-ent scales.
• No continuous fire line. Each turn is a separate grid.
• User must use a different grid name strategy to avoid conflict with structural column grids names.
Railing objectsRailing objects have a particular char-
acteristic that makes them suitable candi-dates for fire rating lines. Railing objects are sketched objects, so drawing a rail-ing is as simple as drawing a line and the sketch line can be constraint to the wall centerline. On the other hand, setting up railing objects to be used as fire lines is a bit complicated. First of all you need to create a baluster family. Instead of using model lines or solid objects, just create a rectangle in plan view using symbolic lines. This will allow the railing to display in floor and reflected ceiling plans while remaining invisible in elevations and sections.
Use reference lines and parameters to constrain the rectangle so that multiple widths and lengths can be created. You can set one width for medium and fine detail levels and a wider one for coarse
level. This will allow you to have a thicker fire line using in life safety drawings using coarse detail level. Then create multiple types in the baluster family for long and short dashes. In the project file, create new railing types and control the baluster spac-ing using the Baluster Placement window accessible through the railing type proper-ties (see Figure 4). You may need to make some adjustments in the railing justifica-tion for some of the longer patterns such as 3-hour and 4-four patterns.
The pros:• Railing lines are visible in all plan views.
Only need to draw once.• User can change fire line thickness eas-
ily by just changing the view detail level.• The entire fire line is one object, not
multiple line segments.• The fire line can be extended beyond
the end of wall at smoke compartment divisions.
• No need to hide railing in elevations and sections.
• This method provides a much nicer graphical representation of the fire line than any other method.
• The fire line will not be interrupted at wall openings.
The cons:• Complicated setup.• Not automatic. The fire line must be
created after the wall.• Like model lines, railings must be drawn
at cut line level or walls must be set transparent.
Repeating detailTo use a repeating detail, you need to
create a linear detail component that can
be used repeatedly. The detail compo-nent would be no more than a pattern of filled regions of long and short dashes, if you are using this common standard. Once the detail component is loaded in the project, create a new repeating detail type for each fire rating line and assign it the corresponding detail component for that pattern.
The pros:• This method creates a nice pattern line
that will not be interrupted at wall open-ings.
• This method can take advantage of view detail levels to adjust line thickness.
The cons:• Repeating details are view dependent.
Objects must be copied to other views.• Curved lines cannot be created, only
straight lines.• Complicated setup.• Not automatic. The fire line must be
created after the wall.
Perhaps there are more ways to cre-ate fire lines out there, but the methods shown above are some of the most com-mon methods being used by many of our peers. I took the opportunity last year to inquire about this very subject at Autodesk University and found it interesting to learn the reasons many users have for choosing a particular method over another. Those of us who have had the opportunity to attend AU appreciate the value in meeting other Revit users and sharing thoughts about the issues that troubles us all.
As we have seen, all these methods of creating fire lines have merits and flaws. You need to decide what works best for you. However, as I mentioned earlier in this article, we should always remember that the clear and concise communication of the design intent should be the most im-portant thing here. Obviously, we should also want to accomplish that in the most efficient way possible, saving time and money where we can. Perhaps Autodesk will provide a tool to generate fire lines from the wall rating parameter, Wouldn’t that be nice? Keep sending this request to the AUGI Wish List!
Felix M. Gonzalez is the CAD Manager and Medi-cal Equipment Planner for HuntonBrady Architects, PA. in Orlando, Florida. He has a bachelor’s degree in computer program-
ming and has been working with Autodesk products for 20 years. Felix can be contacted at [email protected].
Figure 4: Edit baluster spacing to control the space between dashes.

ARCAT BIMObjects • Systems • Materials
“We put the info in BIM”
This object, plus thousands more, have all been developed by ARCAT BIM experts, so you can rely on them as you do for ARCAT specs and SpecWizards. These 3D objects are
packed with all the critical product data you need, and are free of charge like all of ARCAT services!
www.arcat.com
®B
INF
O M


