Syst. Biol. 55(4):595–609, 2006 Copyright c Society of Systematic Biologists ISSN: 1063-5157 print / 1076-836X online DOI: 10.1080/10635150600852011 Sequence-Based Species Delimitation for the DNA Taxonomy of Undescribed Insects J OAN PONS , 1, 2, 10 TIMOTHY G. BARRACLOUGH, 2, 3 J ESUS GOMEZ-ZURITA, 1, 2, 7 ANABELA CARDOSO, 1, 4, 7 DANIEL P. DURAN, 1, 8 S TEAPHAN HAZELL, 1, 2, 9 S OPHIEN KAMOUN, 5 WILLIAM D. S UMLIN, 6 AND ALFRIED P. VOGLER 1, 2 1 Department of Entomology, The Natural History Museum, London SW7 5BD, United Kingdom; E-mail: [email protected] (A.P.V.) 2 Division of Biology and NERC Centre for Population Biology, Imperial College London, Silwood Park Campus, Ascot, Berkshire SL5 7PY, United Kingdom 3 Jodrell Laboratory, Royal Botanic Gardens, Kew TW9 3DS, United Kingdom 4 Faculdade de Ciˆ encias da Universidade de Lisboa, Departamento de Biologia Animal, Centro de Biologia Ambiental, Rua Ernesto Vasconcelos, 1749-016, Campo Grande, Lisboa, Portugal 5 Department of Plant Pathology, Ohio State University, Ohio Agricultural Research and Development Center, Wooster, Ohio, 44691, USA 6 Department of Entomology, Texas A&M University, College Station, Texas 77843, USA 7 Present Address: Area de Biolog´ ıa Animal, Departamento de Zoolog´ ıa y Antropolog´ ıa F´ ısica, Facultad de Biolog´ ıa, Universidad de Murcia–Campus de Espinardo, 30071 Murcia, Spain 8 Present Address: Department of Biological Sciences, Vanderbilt University, Nashville, Tennessee, 37235, USA 9 Present Address: Division of Zoology, School of Animal and Microbial Sciences, University of Reading, Reading RG6 6AJ, United Kingdom 10 Present Address: Unitat de Biologia Evolutiva, Facultat de Ciencias de la Salut i e de la Vida, Universitat Pompeu Fabra, C/Dr. Aiguader 80, 08003 Barcelona, Catalonia, Spain Abstract.— Cataloging the very large number of undescribed species of insects could be greatly accelerated by automated DNA based approaches, but procedures for large-scale species discovery from sequence data are currently lacking. Here, we use mitochondrial DNA variation to delimit species in a poorly known beetle radiation in the genus Rivacindela from arid Australia. Among 468 individuals sampled from 65 sites and multiple morphologically distinguishable types, sequence variation in three mtDNA genes (cytochrome oxidase subunit 1, cytochrome b, 16S ribosomal RNA) was strongly parti- tioned between 46 or 47 putative species identified with quantitative methods of species recognition based on fixed unique (“diagnostic”) characters. The boundaries between groups were also recognizable from a striking increase in branching rate in clock-constrained calibrated trees. Models of stochastic lineage growth (Yule models) were combined with coalescence theory to develop a new likelihood method that determines the point of transition from species-level (speciation and ex- tinction) to population-level (coalescence) evolutionary processes. Fitting the location of the switches from speciation to coalescent nodes on the ultrametric tree of Rivacindela produced a transition in branching rate occurring at 0.43 Mya, leading to an estimate of 48 putative species (confidence interval for the threshold ranging from 47 to 51 clusters within 2 logL units). Entities delimited in this way exhibited biological properties of traditionally defined species, showing coherence of geographic ranges, broad congruence with morphologically recognized species, and levels of sequence divergence typical for closely related species of insects. The finding of discontinuous evolutionary groupings that are readily apparent in pat- terns of sequence variation permits largely automated species delineation from DNA surveys of local communities as a scaffold for taxonomy in this poorly known insect group. [Phylogenetic species concept; coalescence; mtDNA; Cicindelidae; Australia; paleoclimate.] Automated DNA sequencing procedures could greatly accelerate identification of known species (“DNA barcoding”; Hebert et al., 2003) and provide a framework for the taxonomy of poorly known groups (Tautz et al., 2003). However, sequencing-based approaches in taxon- omy are useful only if an individual’s DNA sequence can unambiguously associate that individual with a larger group of organisms (a species or higher taxon). Estab- lishing this association is complicated due to intraspe- cific variation and the possible incongruence of gene and species histories that might prevent the easy recognition of these groups, in particular where only a single frag- ment of mtDNA is used (Lipscomb et al., 2003; Mallet and Willmott, 2003; Will and Rubinoff, 2004). In current taxonomic DNA sequencing, species-level entities have been accepted to be known a priori, and their DNA sig- nature is based on genotypes from a representative sam- ple of well-identified individuals (Hajibabaei et al., 2006; Hebert et al., 2003; Meyer and Paulay, 2005). “DNA barcoding” therefore accepts that species limits are established following traditional practices of taxon- omy, usually based on morphology, and the DNA infor- mation is fitted into this system of predefined taxonomic groups. This approach is problematic because the corre- spondence of sequence variation with existing Linnean binomials is expected to be inexact. This may be because of the existence of unrecognized cryptic species (Hebert et al., 2004a, 2004b) or incongruence of gene histories confounding species recognition (Funk and Omland, 2003; Meyer and Paulay, 2005; Monaghan et al., 2006) or because procedures for species delimitation of the traditional taxonomy have been vague or species con- cepts have been applied inconsistently (Agapow et al., 2004; Cracraft, 1992; Meyer and Paulay, 2005; Wiens and Penkrot, 2002). To avoid these problems, a DNA-based taxonomic system should use the sequence information itself as the primary information source for establishing group membership and defining species boundaries. Current procedures for delimiting species from se- quence data aggregate populations lacking discrete dif- ferences into a single species (Cracraft, 1983; Davis and Nixon, 1992; Sites and Marshall, 2003; Wiens and Penkrot, 2002). These “smallest detected sample[s] of self-perpetuating organisms that have unique sets of characters” (Nelson and Platnick, 1981) can be recog- nized based on fixed nucleotide differences unique to 595
Sequence-Based Species Delimitation for the DNA Taxonomy of Undescribed Insects
JOAN PONS,1,2,10 TIMOTHY G. BARRACLOUGH,2,3 JESUS GOMEZ-ZURITA,1,2,7 ANABELA CARDOSO,1,4,7
DANIEL P. DURAN,1,8 STEAPHAN HAZELL,1,2,9 SOPHIEN KAMOUN,5 WILLIAM D. SUMLIN,6
AND ALFRIED P. VOGLER1,2
1Department of Entomology, The Natural History Museum, London SW7 5BD, United Kingdom; E-mail: [email protected] (A.P.V.)2Division of Biology and NERC Centre for Population Biology, Imperial College London, Silwood Park Campus, Ascot, Berkshire SL5 7PY,
United Kingdom3Jodrell Laboratory, Royal Botanic Gardens, Kew TW9 3DS, United Kingdom
4Faculdade de Ciencias da Universidade de Lisboa, Departamento de Biologia Animal, Centro de Biologia Ambiental, Rua Ernesto Vasconcelos,1749-016, Campo Grande, Lisboa, Portugal
5Department of Plant Pathology, Ohio State University, Ohio Agricultural Research and Development Center, Wooster, Ohio, 44691, USA6Department of Entomology, Texas A&M University, College Station, Texas 77843, USA
7Present Address: Area de Biologıa Animal, Departamento de Zoologıa y Antropologıa Fısica, Facultad de Biologıa, Universidad de Murcia–Campusde Espinardo, 30071 Murcia, Spain
8Present Address: Department of Biological Sciences, Vanderbilt University, Nashville, Tennessee, 37235, USA9Present Address: Division of Zoology, School of Animal and Microbial Sciences, University of Reading, Reading RG6 6AJ, United Kingdom
10Present Address: Unitat de Biologia Evolutiva, Facultat de Ciencias de la Salut i e de la Vida, Universitat Pompeu Fabra, C/Dr. Aiguader 80, 08003Barcelona, Catalonia, Spain
Abstract.— Cataloging the very large number of undescribed species of insects could be greatly accelerated by automatedDNA based approaches, but procedures for large-scale species discovery from sequence data are currently lacking. Here,we use mitochondrial DNA variation to delimit species in a poorly known beetle radiation in the genus Rivacindela fromarid Australia. Among 468 individuals sampled from 65 sites and multiple morphologically distinguishable types, sequencevariation in three mtDNA genes (cytochrome oxidase subunit 1, cytochrome b, 16S ribosomal RNA) was strongly parti-tioned between 46 or 47 putative species identified with quantitative methods of species recognition based on fixed unique(“diagnostic”) characters. The boundaries between groups were also recognizable from a striking increase in branching ratein clock-constrained calibrated trees. Models of stochastic lineage growth (Yule models) were combined with coalescencetheory to develop a new likelihood method that determines the point of transition from species-level (speciation and ex-tinction) to population-level (coalescence) evolutionary processes. Fitting the location of the switches from speciation tocoalescent nodes on the ultrametric tree of Rivacindela produced a transition in branching rate occurring at 0.43 Mya, leadingto an estimate of 48 putative species (confidence interval for the threshold ranging from 47 to 51 clusters within 2 logLunits). Entities delimited in this way exhibited biological properties of traditionally defined species, showing coherence ofgeographic ranges, broad congruence with morphologically recognized species, and levels of sequence divergence typicalfor closely related species of insects. The finding of discontinuous evolutionary groupings that are readily apparent in pat-terns of sequence variation permits largely automated species delineation from DNA surveys of local communities as ascaffold for taxonomy in this poorly known insect group. [Phylogenetic species concept; coalescence; mtDNA; Cicindelidae;Australia; paleoclimate.]
Automated DNA sequencing procedures couldgreatly accelerate identification of known species (“DNAbarcoding”; Hebert et al., 2003) and provide a frameworkfor the taxonomy of poorly known groups (Tautz et al.,2003). However, sequencing-based approaches in taxon-omy are useful only if an individual’s DNA sequence canunambiguously associate that individual with a largergroup of organisms (a species or higher taxon). Estab-lishing this association is complicated due to intraspe-cific variation and the possible incongruence of gene andspecies histories that might prevent the easy recognitionof these groups, in particular where only a single frag-ment of mtDNA is used (Lipscomb et al., 2003; Malletand Willmott, 2003; Will and Rubinoff, 2004). In currenttaxonomic DNA sequencing, species-level entities havebeen accepted to be known a priori, and their DNA sig-nature is based on genotypes from a representative sam-ple of well-identified individuals (Hajibabaei et al., 2006;Hebert et al., 2003; Meyer and Paulay, 2005).
“DNA barcoding” therefore accepts that species limitsare established following traditional practices of taxon-omy, usually based on morphology, and the DNA infor-mation is fitted into this system of predefined taxonomic
groups. This approach is problematic because the corre-spondence of sequence variation with existing Linneanbinomials is expected to be inexact. This may be becauseof the existence of unrecognized cryptic species (Hebertet al., 2004a, 2004b) or incongruence of gene historiesconfounding species recognition (Funk and Omland,2003; Meyer and Paulay, 2005; Monaghan et al., 2006)or because procedures for species delimitation of thetraditional taxonomy have been vague or species con-cepts have been applied inconsistently (Agapow et al.,2004; Cracraft, 1992; Meyer and Paulay, 2005; Wiens andPenkrot, 2002). To avoid these problems, a DNA-basedtaxonomic system should use the sequence informationitself as the primary information source for establishinggroup membership and defining species boundaries.
Current procedures for delimiting species from se-quence data aggregate populations lacking discrete dif-ferences into a single species (Cracraft, 1983; Davisand Nixon, 1992; Sites and Marshall, 2003; Wiens andPenkrot, 2002). These “smallest detected sample[s] ofself-perpetuating organisms that have unique sets ofcharacters” (Nelson and Platnick, 1981) can be recog-nized based on fixed nucleotide differences unique to
595
596 SYSTEMATIC BIOLOGY VOL. 55
such (sets of) populations (the criterion of “diagnos-ability”; Cracraft, 1983), implemented in population ag-gregation analysis (PAA; Davis and Nixon, 1992). Atree-based variant of this procedure (cladistic haplotypeanalysis; CHA) also considers homoplastic characterstates as diagnostic if they are shown to be uniquely de-rived for a particular group (Brower, 1999). The Wiens-Penkrot (WP) method (Sites and Marshall, 2003; Wiensand Penkrot, 2002) is also a tree-based method for delim-iting phylogenetic species but uses the topology (ratherthan character polarity, as in CHA) to assess whether ornot clades are restricted to a (set of) populations to theexclusion of clades elsewhere (criterion of “exclusivity”).
The prior definition of populations, usually definedgeographically, is a critical step in all of these methods,although the focus on individual organisms rather thana preconceived interbreeding “group” would be moreobjective for species delimitation (Vrana and Wheeler,1992). Current methods for estimating population coher-ence from the sequences themselves rely on evidence forrecombination to determine species limits (Doyle, 1995)but are impractical for large-scale analysis at present. Analternative possibility to detect species separation is tosearch for discontinuities in sequence variation associ-ated with the species boundaries. For example, statisticalparsimony analysis (Templeton et al., 1992) separatesgroups of sequences into different sequence networksif genotypes are connected by comparatively longbranches that are affected by homoplasy. Although ho-moplasious connections do not necessarily correspond tospecies boundaries, in practice this algorithm often doesseparate groups that are roughly coincident with namedspecies or species groups (e.g., Cardoso and Vogler, 2005;Templeton, 2001; Wilder and Hollocher, 2003; Templetonet al., 1995), and the WP method for species delimitationis now recommended to be applied only in conjunctionwith statistical parsimony analysis in order to reduce thecomplexity of large data sets (Sites and Marshall, 2003).
These observations would suggest the possibility ofusing analyses of branch lengths on a DNA tree for ex-plicit tests of species boundaries, based on the differencein branching rates at the level of species and populations.Branch lengths between species are determined by spe-ciation and extinction rates (macroevolution) (Nee et al.,1994), whereas branch lengths within a species reflect co-alescence processes at the level of populations (microevo-lution) (Hudson, 1991; Rosenberg and Nordborg, 2002;Wakeley, 2006). Well-developed approaches exist for an-alyzing branching rates in either framework. Combiningequations that describe processes of lineage birth at thespecies level with coalescence models within species, it ispossible to develop a statistical framework for estimatingthe predicted shift in dynamics of branching associatedwith the species boundary. Here we develop a methodthat determines the locations of ancestral nodes that de-fine putative species and applies a likelihood ratio testto assess the fit of the branch lengths to a mixed lineagebirth-population coalescence model.
As an example of a group whose current taxon-omy is incomplete, we attempted DNA-based species
delineation in tiger beetles in the genus Rivacindela(Coleoptera: Cicindelidae). These beetles are found insaline habitats and temporal lakes of interior Australia.To date, 24 species of Rivacindela have been formally de-scribed but because of the inaccessibility of their habi-tat, many species still await discovery (Freitag, 1979;Sumlin, 1997). Populations are restricted to habitat nearthe water edges in an otherwise inhospitable desert en-vironment. Although similar in their lifestyle as generalpredators of small arthropods, species and populationsdiffer in color pattern, body shape, habitat preference,and behavioral traits. Most species are flighted, butRivacindela includes several flightless lineages that are ex-tremely fast runners, attaining speeds of up to 170 timestheir body length per second (Kamoun and Hogenhout,1996). The analysis of morphological variation in thisgroup is complicated due to low character variationand nondiscrete differentiation. We hence conductedcomprehensive DNA sequencing across the geographicrange of Rivacindela to provide the scaffold for assign-ing species membership. We find that the various ex-isting procedures for DNA-based species delimitationidentify biologically meaningful groups. The new like-lihood method for analyzing branching rate producedresults closely similar to those obtained with character-based methods but does not require prior assumption ofpopulation boundaries and can provide a statistical mea-sure of confidence to the assessment of species limits.
MATERIAL AND METHODS
Collecting Information and DNA Procedures
Specimens were sampled at the edges of temporal saltlakes and salt flats in the Provinces of Western Australia,South Australia, and the Northern Territory during twoexpeditions in 2001 and 2003. Several of these sites weresurveyed for cicindelids for the first time, and collec-tions produced many apparently undescribed speciesand variants (Fig. 1). Specimens were placed directly intoabsolute ethanol after cursory identification in the field.Up to six individuals (more in a few cases) from eachlocality were sequenced, plus an additional set of upto six individuals if obvious morphologically differentforms were recognized during field work at a given siteor where individuals were obtained in different years orat multiple adjacent sites on the larger lakes (Supplemen-tary Table S1; http://systematicbiology.org). This sam-pling regime was thought to be a good reflection of thetotal diversity encountered at the various collecting sitescapturing species-level groups and their internal vari-ation, given the absence of a thorough taxonomic treat-ment, while keeping the sequencing effort to a minimum.In total, 468 specimens assigned to 108 local sets of in-dividuals (65 sites, plus morphologically distinct formsand samples from repeat visits of a site) were includedin the analysis.
Nondestructive DNA extraction was performed us-ing a Qiagen DNeasy kit. Whole specimens were soakedovernight in extraction buffer at 37◦C, with small per-forations made to the side of the abdomen and DNA
2006 PONS ET AL.—SPECIES DELIMITATION FOR UNDESCRIBED INSECTS 597
FIGURE 1. Map of 65 collecting sites. The distribution of four widespread species is shown as different symbols (species 1, light grey circles;species 11, black triangles; species 29, white boxes; species 35, dark grey diamonds). Detailed collecting information is provided in SupplementaryTable S1.
extracted from the supernatant. Damage to specimens(some of them to be holotypes in future species descrip-tions) was minimal, and softness of specimens was main-tained if transferred to 70% ethanol after the extraction.Vouchers will be maintained as pinned dry specimensin the W. D. Sumlin personal collection. Amplificationof three mtDNA regions from the cytochrome oxidasesubunit 1 (cox1), cytochrome b apoenzyme (cob), and 16Sribosomal RNA (rrnL) plus adjacent regions, was gen-erally successful with well-established oligonucleotides(Pons et al., 2004) but required newly designed cox1 andrrnL primers in some cases, the latter to avoid coamplifi-cation of a nuclear paralog (Pons and Vogler, 2005). (Thegenetic nomenclature in this paper follows Boore, 2001).Primer combinations for each region are given in Sup-plementary Table S2. PCR fragments were sequenced inboth directions on an ABI377 automated sequencer. Thesequences reported in this paper have been depositedin GenBank under accession nos. AJ617921–AJ618351(cox1), AJ618352–AJ618766 (cob), AJ619087–AJ619548(rrnL). In addition, three species of Australian cicindelidsestablished to be closely related to Rivacindela basedon a wider survey of Cicindela sensu lato (unpublished)were used as outgroups (AJ831553–AJ831564). The data
and tree files have been uploaded at Treebase underSN2798-10988.
Data Analysis
Statistical parsimony analysis was carried out withTCS version 1.3 software (Clement et al., 2000) usingonly individuals with complete sequence informationfor all three genes. Where a separate lake sample didnot include at least one specimen with complete se-quence information (listed in parentheses in Table S1),these were assigned to the networks based on theirphylogenetic position in standard parsimony analy-sis (below). Statistical parsimony analysis partitionsthe data into independent networks of haplotypesconnected by changes that are non-homoplastic witha 95% probability (Templeton, 2001). Intragroup andpairwise intergroup divergences were calculated withMega version 2.1 (http://www.megasoftware.net) us-ing p-distances. Fst and P values at 0.05 significancewere calculated from pairwise differences in Arlequin2.0 (http://lgb.unige.ch/arlequin).
Parsimony tree searches on the complete data set wereconducted using PAUP∗4.0b10 (Swofford, 2002) with
598 SYSTEMATIC BIOLOGY VOL. 55
40 independent runs and 200 ratchet iterations (Nixon,1999) each, with 15% of characters reweighted using thedefault settings of the PAUPRat script (http://www.ucalgary.ca/∼dsikes/software2.htm). The preferredtopology was selected among an initial set of parsimonytrees, from which one was selected according to theShimodaira-Hasegawa (SH) test under a GTR+I+�likelihood model and used as starting tree for an MLsearch in PAUP∗4.0b10. The ML search was conductedon a desktop computer for 3 days testing a total of18,622 rearrangements. Where nodes were consis-tent with the ML tree, bootstrap values were givenbased on parsimony analysis obtained by searching100 pseudoreplicated data sets (generated usingSEQBOOT in Phylip 3.57) using the ratchet. A strictconsensus tree was created from these trees for eachpseudoreplicate, and the 100 strict consensus trees eachrepresenting a bootstrap replicate were used to create a50% majority rule consensus tree providing the supportvalues. Relative ages of nodes were estimated usingthe r8s software (Sanderson, 2002) by fitting branchlengths of an ML tree using penalized likelihood anda smoothing parameter of 10, chosen as optimal bycross-validation. Absolute ages were estimated settingthe split of R. aurifodina (sample 204) and R. salicursoria(sample 208) to 3.2 Mya (Pons et al., 2004). This wasbased on an estimate from a phylogeny of worldwidelineages of Cicindela sensu lato calibrated from bioge-graphic evidence in North American lineages whichincluded only these two species to represent Rivacindela(Barraclough and Vogler, 2002). Sequence divergencebetween individuals of these species was 6.0% (SD0.14%) and hence the estimate corresponds closely to thewidely used insect mtDNA molecular clock calibrationof 2.3% per My (Brower, 1994). Lineage-through-timeanalyses were obtained as a semilogarithmic plot ofthe number of lineages against time since the firstbifurcation (Nee et al., 1992).
Species Delimitation
Different quantitative methods for species delimita-tion were applied, implemented by visual inspection ofthe variable nucleotide positions and trees derived fromthese. These procedures were conducted only within theindependent networks defined in the statistical parsi-mony analysis, greatly reducing the complexity of scor-ing separated groups. Population profiles of charactervariation were established according to Sites and Mar-shall (2003) as the basis for PAA (Davis and Nixon, 1992)and CHA (Brower, 1999), the latter by assessing variablecharacters on the likelihood tree shown below. The WPmethod also used this tree to delimit “exclusive” popu-lations, defined as the monophyly of geographically re-stricted genotypes to the exclusion of clades elsewhere.Fst values were used for aggregating samples with non-significant pairwise Fst, in analogy to the grouping ofpopulations under PAA (Supplementary Fig. S1).
Analyses of mtDNA Branching Times
A statistical model was developed to test for the pre-dicted change in branching rates at the species boundary.
FIGURE 2. Schematic illustration of the waiting times in a calibratedtree and the numbers of lineages present for each type of diversifi-cation process (interspecies diversification and within-species coales-cence) during each waiting interval. Branches are categorized as eitherbetween species (thin lines) or within species branching (bold lines)according to the procedures described in Material and Methods.
The overall aim of the procedure is to classify the ob-served branching time intervals defined by the nodes ina clock-constrained phylogram to either being the resultof inter-specific (“diversification”) or intraspecific (“co-alescent”) processes of lineage branching (Fig. 2). A fulldescription of the model and its performance on sim-ulated trees will be provided elsewhere (Barraclough,unpublished).
As raw data, the model uses the waiting times betweensuccessive branching events on the ultrametric DNAtree, xi . We combine standard models that separatelyconsider branching within populations (Hudson, 1991;Wakeley, 2006) and branching between species (Nee,1994, 2001; Nee et al., 1994). Under a neutral coalescent,the likelihoods of the waiting times within a single pop-ulation with effective population size Ne and ni lineagespresent during waiting time i are given by:
L (xi ) = λni (ni − 1)e−λni (ni −1)xi (1)
where the birth rate
λ = 12Ne
(2)
2006 PONS ET AL.—SPECIES DELIMITATION FOR UNDESCRIBED INSECTS 599
The simplest standard approach for considering branch-ing between species is as a Yule model (Yule, 1924); i.e., astochastic birth-only model. The likelihoods of the wait-ing times in a species phylogeny (one tip per species) ofa clade with constant average speciation rate, λ, and noextinction are given by:
L (xi ) = λni e−λni xi (3)
We combine the above equations describing populationand speciation processes to consider a clade that has di-versified into k species, each of which can be treated as asingle population with effective size, Nj , j = 1 to k. As-suming a constant speciation rate without extinction, andneutral coalescence within each species, the likelihoodsof waiting times in the entire tree under this mixed Yulecoalescent (MYC) model are given by:
L (xi ) = be−bxi (4)
where
b = λk+1ni,k+1 +∑
j=1,k
(λ j ni, j (ni, j − 1)) (5)
where k + 1 is the index assigned to the diversificationprocess and ni, j is the number of lineages in waiting in-terval i belonging to process j . λk+1 is the speciation rateand λ j are the branching rates for each coalescent processas defined in Equation 2. We do not consider effectivepopulation sizes explicitly hereafter, rather the coales-cent branching rate parameter for each species. The termb is the probability that an event of any type happens atthe end of the waiting interval and e−bxi is the probabilitythat no event happened during the waiting interval (seeappendix 1 of Nee, 2001).
This MYC model can be fitted to an ultrametric treeby maximizing the sum of the log-likelihoods of wait-ing times across the entire tree. A key step is fitting thelocation of the switches from speciation to coalescentnodes; i.e., the most recent common ancestral node defin-ing each species. The simplest approach is to assume thatthere is a threshold time, T , before which all nodes reflectdiversification events and after which all nodes reflect co-alescent events. Species in this model are thus delimitedby the descendent nodes of branches crossing the thresh-old. T can be optimized to find the maximum likelihoodsolution and hence to estimate the number of species.Note that this approach does not assume that all specieshave the same age of their most recent common ancestor,which would not be the expected even under an equalpopulation size model, but rather that the most recentdiversification event occurred before the oldest within-species coalescent event. Approximate 95% confidenceintervals for the parameters can be calculated by findingsolutions with 2 log-likelihood units of the maximum(Edwards, 1972).
To test whether there is significant evidence for thepredicted transition in branching rates, the likelihood
for the threshold model can be compared to that ob-tained assuming no threshold; i.e., a single branchingprocess for the entire tree (k = 0). Assuming initially thatall species have the same effective population size, thethreshold version of the MYC model introduces two ad-ditional parameters compared to the null model: an ad-ditional branching rate parameter, λ2, and T . A standardlog-likelihood ratio test can be used to assess whetherthe alternative model provides a significantly better fitthan the null model of no such shift in branching pro-cess: twice the difference in log-likelihood is expectedto be chi-square distributed with 2 degrees of freedom(Goldman, 1993). Failure to reject the null model couldhave several explanations. First, the clade might in factrepresent a single species (unlikely in the present case).Second, the observed branching rate within species de-pends on the number of individuals sampled per species:small samples per species will weaken the power todetect the transition. Conversely, incomplete samplingat the species level would reduce the apparent branchingrate in λ1. Third, some combinations of actual branchingprocesses will also make it harder to detect the transi-tion; for example, a combination of fast speciation rateand large population sizes.
Equations (4) to (6) make strict assumptions about bothspeciation and population processes that seem unlikelyto hold in many real clades. As a general solution tothis problem, we introduce additional parameters thatallow for a qualitatively wide range of different modelsfor both types of branching processes. Nee et al. (1994a)and Nee (2001) discussed transformations of waiting in-tervals that allow derived models to be treated as ex-ponential processes with a single rate parameter. Theseaccounts imply a simple general transformation of theMYC model by substituting b in Eq. (4) with b∗:
b∗ = λk+1(ni,k+1)pk+1 +∑
j=1,k
(λ j (ni, j (ni, j − 1))p j ) (6)
We call this the general mixed Yule coalescent (GMYC)model. The p j represent scaling parameters that can beoptimized during model fitting. Interpretation dependson which class of branching events are considered. Thescaling parameter for the diversification process, pk+1,provides similar information to the gamma statistic ofPybus and Harvey (2000). pk+1 = 1 represents a constantspeciation rate model with no extinction. pk+1 > 1 in-dicates an apparent increase in diversification rate to-wards the present, which might reflect, for example, areal increase in speciation rate or the effects of constantbackground extinction (Barraclough and Nee, 2001; Nee,1994). pk+1 < 1 represents an apparent decrease in diver-sification rate towards the present, which might reflect,for example, a real slow-down in speciation or the effectsof incomplete sampling of species within the clade (Neeet al., 1994b; Pybus and Harvey, 2000). The scaling pa-rameters for the coalescent processes within each speciesare interpreted differently. p j = 1 represents a neutralcoalescent model. p j < 1 indicates a relative deficit of
600 SYSTEMATIC BIOLOGY VOL. 55
recent coalescent events, expected, for example, if pop-ulations were growing in size or experiencing balancingselection (Nee et al., 1994). p j > 1 indicates a relative ex-cess of recent coalescent events, expected, for example,if all populations were declining in size, following a re-cent selective sweep affecting the marker or if there isfurther population structure within the species. Hence,optimizing across possible values of p for both classes ofbranching events relaxes the assumptions of the methodand can provide pointers for further analyses to explorepossible causes for departure from the simplest model.
Code implementing the model in R using functionsfrom the APE library is available from TGB. First, wevisualized the waiting time data by plotting the log ofthe number of lineages through time (Nee et al., 1992). Atransition in branching rates should be visible as a sud-den increase in slope of the plot towards the present. Sec-ond, we ran the threshold version of the GMYC model onthe calibrated ultrametric tree of Rivacindela. Third, wecompared the likelihood to that obtained assuming a sin-gle branching process for the tree. For the GMYC model,assuming all species have the same parameter values, thethreshold model has five parameters (λ1, λ2,p1,p2, and T),whereas the null model has two (λ1 andp1); hence, thereare three degrees of freedom for the comparison.
RESULTS
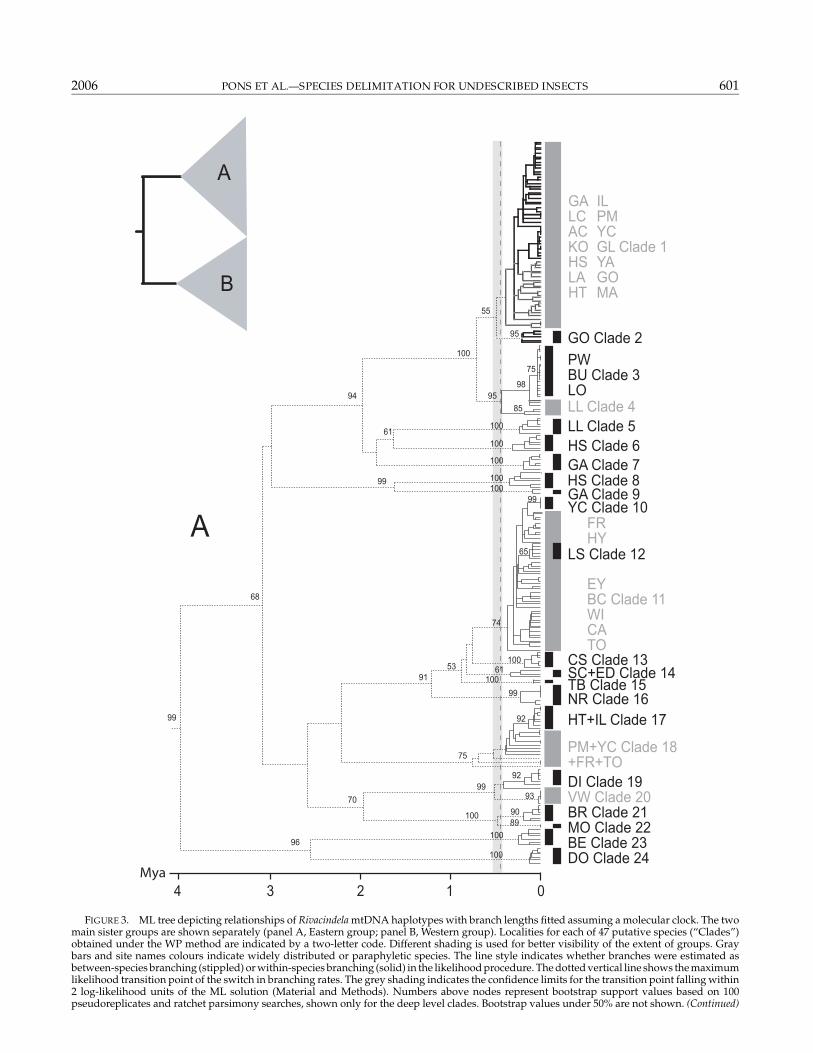
Sequencing of three gene regions of mtDNA for the se-lected 468 specimens produced a data matrix of 1914 bps,of which 514 bps were informative. The average uncor-rected p-distance between any two ingroup sequenceswas 5.8% (7.8%, 9.4%, and 2.8%, respectively, for the cox1,cob, and rrnL regions). We obtained 5355 parsimony treesof 3539 steps, and CI = 0.280 and RI = 0.926. Amongthose, one tree with highest likelihood was selected (fromthose which were significantly better in the SH test) asa starting tree in an ML search resulting in a slightlydifferent topology and marginally improved likelihoodscore of −logL 22,363.56 (Fig. 3). Basal relationships werecharacterized by relatively long internal branches, but tipbranches were short and grouped clusters of very sim-ilar sequences, as would be expected if Rivacindela hassplit into isolated evolutionary entities, each consistingof closely related individuals.
Patterns of sequence variation were investigated forthe presence of species-level groups based on varioustypes of aggregation analysis (Fig. 4). An initial step ofthis analysis was to identify independent networks us-ing statistical parsimony (Templeton et al., 1992), whichseparated the total variation into 25 groups based onconnection limit of 15 steps; i.e., branches of 16 stepsand beyond are considered to fall outside of the 95%confidence interval for these connections to be nonho-moplastic. The status of these independent networksas putative species was not questioned (see Sites andMarhall, 2003). Individual networks were then investi-gated for further subdivision. As we started the analysiswith a total of 108 local samples whose coherence wasnot in doubt (i.e., they each constituted a set of specimens
collected at the same site and did not show any obviousmorphological variation; Material and Methods), eachof these were included in the various aggregation analy-ses conducted separately for each network. These analy-ses grouped the samples into either 46 (under PAA andCHA) or 47 (under WP analysis) separate entities, eachentity consisting of up to 63 individuals from between 1and 13 localities (Fig. 4). When analyzed separately, eachof the three mtDNA regions still recovered 40 to 43 pu-tative species of similar extent, and those obtained from728 bp fragment of the cox1 gene most closely matchedthe result from the full data set. Average pairwise di-vergence within these putative species determined bythe WP method was 0.5%, much lower than the averageamong-species divergence of 6.3%, and 2.2% betweensister species.
Population genetic analysis was also used for ag-gregation of populations with non-significant pairwiseFst (Supplementary Fig. S1), in analogy to PAA/CHA.Among the 66 groups with four or more individuals in-cluded in the analysis, under a significance level for FstP < 0.05, this analysis led to recognition of only five ad-ditional entities over those in the WP analysis (Fig. 4).Bonferroni corrections for multiple comparisons wouldincrease the significance level for Fst to P = 0.00076,which would lead to the recognition of fewer subdividedgroups, although this value is likely to introduce a largetype 2 error, i.e., the lumping of groups separated at asignificant Fst level. Instead, using uncorrected pairwiseFst might result in type 1 error of accepting groups thatappear separated simply due to chance, and thereforethe reported results (Fig. 4) constitute the upper boundof the number of entities.
The existence of distinct mtDNA lineages was con-firmed by analysis of branch lengths. A lineage-through-time plot showed a steep upturn in branching ratestowards the present, presumably marking the transi-tion from between-species to within-species rate of lin-eage branching (Fig. 5). The position of the transitionwas fitted using the GMYC model assuming a sin-gle threshold: pretransition nodes were assumed to re-flect speciation events and posttransition nodes wereassumed to reflect within species coalescence. The modelfitted a transition in branching rate occurring at 0.43Mya, leading to an estimate of 48 putative species, 5of which contain a single individual. Confidence lim-its for the threshold ranged from 0.39 to 0.53 Mya andfor the estimated number of species from 47 to 51.The GMYC model was preferred over the null modelof uniform branching rates (logL = 2641, compared tonull model logL = 2606; 2�L = 71.8, χ2 test, d.f. = 3,P � 0.001). The groups of sequences identified by theseshifts matched closely with those identified throughother aggregation analyses (Fig. 4). There were six casesin which the WP method delimited species embeddedwithin a paraphyletic species that were not detected bythe branch-length method. Conversely there were sevencases of divergence (sometimes a single individual) de-tected by the branch-length analysis but not by the WPmethod.
2006 PONS ET AL.—SPECIES DELIMITATION FOR UNDESCRIBED INSECTS 601
FIGURE 3. ML tree depicting relationships of Rivacindela mtDNA haplotypes with branch lengths fitted assuming a molecular clock. The twomain sister groups are shown separately (panel A, Eastern group; panel B, Western group). Localities for each of 47 putative species (“Clades”)obtained under the WP method are indicated by a two-letter code. Different shading is used for better visibility of the extent of groups. Graybars and site names colours indicate widely distributed or paraphyletic species. The line style indicates whether branches were estimated asbetween-species branching (stippled) or within-species branching (solid) in the likelihood procedure. The dotted vertical line shows the maximumlikelihood transition point of the switch in branching rates. The grey shading indicates the confidence limits for the transition point falling within2 log-likelihood units of the ML solution (Material and Methods). Numbers above nodes represent bootstrap support values based on 100pseudoreplicates and ratchet parsimony searches, shown only for the deep level clades. Bootstrap values under 50% are not shown. (Continued)
602 SYSTEMATIC BIOLOGY VOL. 55
B
GG
CW Clade 32
PODE Clade 36JU
DUGE Clade 30SAGY
YI Clade 38
YI Clade 41CW Clade 33
DE Clade 42
LY Clade 43
WEMSMO Clade 35YYGYKI Clade 44
JO Clade 46
RE Clade 31
AU Clade 25NO Clade 26
SE Clade 37
RA Clade 39 CY Calde 40
NE Clade 34
HO Clade 45
WA Clade 47
4 0123
MNGGBA Clade 29BRGI
MN Clade 28
94
100
88
100
98
70
100
87
100
53
84
99
100
99
79
97
100
98
74
98
99
66
100100
7586
81
56
58
92
9886
52
9894
72
DE Clade 27
100
Mya
A
B
FIGURE 3. (Continued)
2006 PONS ET AL.—SPECIES DELIMITATION FOR UNDESCRIBED INSECTS 603
FIGURE 4. Species entities obtained by various procedures of grouping: Network statistical parsimony (Templeton et al., 1992), PopulationAggregation Analysis (PAA) (Davis and Nixon, 1992), Cladistic Haplotype Analysis (CHA) (Brower, 1999), Wiens-Penkrot method (WP) (Sites andMarshall, 2003; Wiens and Penkrot, 2002), haplotype frequencies (Fst), and the new likelihood method based in the analysis of mtDNA branchingtimes. Grey blocks indicate the aggregation of samples from the sites listed at the top ( a “+” sign after the site name indicates where more thanone site was aggregated in a group). The darker grey fields indicate groups linked in a particular subset. WP all data refers to the groupings basedon the full data set (numbers in each field correspond to the clades in Fig. 3). The results from WP analysis conducted separately on the threemtDNA subsets (cox1, cob, rrnL), are also shown. For Fst, the figure shows the result of pairwise comparisons between all populations of fouror more individuals, with fields left empty where fewer individuals were analyzed. For the likelihood analysis, the numbers in the grey fieldsindicate additional groupings that are recognized with this procedure, further subdividing groups shown as individual blocks. The bottom twolines of the graph show the number of individuals and number of sites included in each group.
The basic GMYC model assumes that all species havethe same coalescent branching rates, λj, and scaling pa-rameters, p j . To check the robustness of the results tothis assumption, we repeated the threshold optimizationprocedure but allowed all the putative species to havedifferent values of these parameters. This yields a modelwith 89 parameters; therefore, we simplified this modelby classifying the species into three categories based ontheir estimates of p j using the k-means clustering func-tion in R. This simplified model yielded an estimate of48 species, with confidence limits of 46 and 52 and a sig-nificantly better fit than the GMYC model that assumedconstant parameter values across species (LogL = 2652,
FIGURE 5. Lineages-through-time plot based on the time calibrated tree obtained from all 468 haplotypes. The sharp increase in branchingrate, corresponding to the transition from interspecies to intraspecies branching events, is indicated by the dotted line.
�L = 2652 − 2641, 2�L = 21; χ2 test, d.f. = 4, P < 0.001).Ignoring the putative species with single individualssampled, 32 putative species fell in a category withp1 = 0.03, 8 fell in a category with p2 = 0.3, and 3 fell ina category with p3 = 1.0. Hence, overall there was evi-dence for a deficit of recent branching events within mostof the sampled species (constraining all species to obeyneutral coalescent p1 to pk fixed at 1 reduces LogL to 2517,compared to three-category model, 2�L = 270; χ2 test,d.f. = 5, P � 0.001). For between-species branching, weobtained P = 1.3, signifying a slight increase in net di-versification rate towards the tips relative to a constantspeciation rate model.
604 SYSTEMATIC BIOLOGY VOL. 55
Most putative species identified in the analysis wererestricted to a single lake, but four widely distributedspecies were present at between 5 and 13 sites, show-ing contiguous ranges that included all nearest neigh-bor sites (Fig. 1). Geographical structure was apparentalso at deeper levels in the tree. For example, the basalnode defined two major clades roughly coincident witheastern and western localities (Fig. 3). Sister species andlarger sister clades tended to be found mostly at neigh-boring lakes or lake systems. A major divide separatingthe drainage systems (van de Graaff et al., 1977) wasalso apparent in the distribution of haplotypes. In west-ern Australia, most populations of the same basin orpaleo-river system were included in the same clade com-posed of closely related haplotypes. Haplotypes up to ap-proximately 0.7 My of divergence were almost entirelyconfined to a single paleo-river, whereas populationsfrom different drainage systems were not closely related,even where these lakes were in close geographic prox-imity (Fig. 6). Although most lakes harbored only onespecies, a maximum of three co-occurring species was ob-served, but these were not closely related in most cases.
DISCUSSION
The use of short mtDNA sequences in taxonomic stud-ies, including “DNA barcoding” (Hebert et al., 2003), hasbeen applied mostly to known species, but beyond noveltools for identification (and occasional evidence for cryp-tic species; Hebert et al., 2004a, 2004b; Meyer and Paulay,2005), this does not directly bear on the taxonomic sta-tus of groups (Moritz and Cicero, 2004). Here we usedquantitative analyses of sequence data to delimit pu-tative species, whereby the sequence information itselfprovided a framework for alpha taxonomy. Species de-limitation relied on two principal approaches, includingestablished procedures based on diagnostic characters(Sites and Marshall, 2003) and a novel procedure basedon detecting the shift in the rate of lineage branching.Other studies have observed similar shifts in branchingrates as signatures of the species boundary (e.g., Aci-nas et al., 2004; Barraclough et al., 2003; Cardoso andVogler, 2005; Hebert and Gregory, 2005; Hugall et al.,2002; Monaghan et al., 2005; Wiens and Penkrot, 2002).However, to our knowledge there have been no previousattempts to utilise this information in a quantitative pro-cedure of species delimitation, despite the developmentof methods for clustering of sequences (Blaxter, 2004) andmatching them to predefined taxonomic groups (Steinkeet al., 2005; Matz and Nielsen, 2005).
The branch-length analysis relies on a probabilisticmodel separating species diversification (phylogeny)from coalescent processes (genealogy within species). Inthis sense, the shift in branching rate corresponds to theelusive boundary between Hennig’s (1966) phylogeneticand tokogenetic realms, indicating divergent and retic-ulate relationships. Our goal was to produce a methodcapable of fitting approaches of phylogenetics and pop-ulation genetics, as the two major disciplines operatingabove and below this boundary (Brower et al., 1996). In
its current implementation, the approach is based on sim-ple assumptions such as a constant speciation rate modelor neutral coalescence, although these are relaxed some-what by incorporating the scaling parameter. The pro-cedure has acceptable false-positive rates when appliedto data simulated assuming no transition in branchingrates and reasonable power for data simulated assum-ing distinct species (Barraclough, unpublished). The ap-proach could be modified to specify detailed modelsof speciation, extinction, and population processes, andthen to choose among competing models, but because ofthe bewildering range of possible scenarios (Barracloughand Nee, 2001; Charlesworth et al., 2003), this was notfurther explored here.
The analysis of branch length overcomes two prin-cipal problems of existing methods for quantitativespecies delimitation. First, the approach takes into ac-count uncertainty of species limits by permitting confi-dence intervals when allocating species-defining nodes,a desirable property where species limits are weakly de-veloped (Hey et al., 2003). Population aggregation meth-ods do not allow for uncertainty, but rather optimizespecies limits based on a fixed criterion. Other recentpopulation-based approaches take uncertainty into ac-count (e.g., Matz and Nielsen, 2005) but have yet to beapplied to species delimitation per se rather than iden-tification of unknown sequences. Second, the branchlength–based methods do not require that populationsare defined a priori before being subjected to tests ofaggregation (Davis and Nixon, 1992; Mayden, 1997).Definitions of population units remain problematic, asthey frequently lack easily discernible spatial or geneticboundaries (Schaefer, 2006); e.g., where distributionalranges are insufficiently studied or where morpholog-ically cryptic forms are found in the same geographicallocality. For our study of Rivacindela we simplistically as-sumed that individuals collected at different sites weremembers of separate populations, whereas all individ-uals from a single site were considered a uniform pop-ulation, unless morphological differences were evident.As population aggregation analyses are based on the apriori definitions of populations, this kind of informaltreatment could introduce a major factor of uncertaintyinto species delimitation. The branching-based approachis independent of the recognition of population limits.In addition, the approach permits the inclusion of rarespecies represented by only a single individual, which isproblematic in population based species concepts.
The length of time needed to attain the signaturesused for species recognition differs between these meth-ods. For example, CHA and PAA rely on the predictionthat fixed nucleotide differences are unlikely betweenrandom samples of a single population, but expectedto accumulate between isolated populations. Under aneutral model of mutation and genetic drift, for a mi-tochondrial marker the expected time to the first fixeddifference, and hence ability of these methods to detectisolated species, is less than 0.5 Ne generations after pop-ulations were isolated (Hey, 1991). The WP method re-lies on the assumption that an isolated population will
2006 PONS ET AL.—SPECIES DELIMITATION FOR UNDESCRIBED INSECTS 605
FIGURE 6. Distribution of species in paleo-drainages for the western Australian assemblages (Panel B of tree shown in Fig. 3; see Fig. 1 for anoutline map of the wider region). Shadings and symbols indicate different paleo-river systems according to fig. 5 in van de Graaff et al. (1977).The dashed lines mark lineages inferred to have undergone a shift between major drainage systems marked by the arrows in the map (inset).
eventually become monophyletic with respect to its an-cestral or sister population. According to simulations ofthe probability to observe reciprocal monophyly, this isexpected to occur at around 0.7 Ne generations; i.e., there
is a 50% chance of a given locus being monophyleticat that time (table 1 in Hudson and Coyne, 2002). Thebranch-length analysis proposed here requires addition-ally that monophyletic groups are recognizable on longer
606 SYSTEMATIC BIOLOGY VOL. 55
stem branches, expected to occur around Ne generationsafter lineage separation (Hudson and Coyne, 2002). Tohave 95% of a given locus displaying a given signa-ture, the time interval needed will be higher in eachcase, for example, over 2Ne generations, for changesin branching rate to arise. The final method we used,based on the inbreeding coefficient, detects significantbetween-population genetic subdivision from pairwiseFst estimates, which does not entail fixed differences ormonophyly. Hence this method might detect more recentbreaks in gene flow than the others, but risks that popu-lations with partial gene flow are recognized as separateentities: it constitutes an extreme upper limit for speciesnumbers in population-based analyses.
Whether these methods actually produce differing es-timates of numbers of groups will depend on the relativeseparation of species versus within-species coalescencetimes. If many related species diverged more recentlythan the oldest coalescence times of the alleles theycontain, the methods will underestimate species num-bers, delimiting species complexes rather than individ-ual species. This will affect methods relying on branchlength more strongly than methods based on diagnos-tic fixed character states which have a greater chance toidentify recently diverged or otherwise cryptic speciesbecause they are expected to be apparent sooner after di-vergence (Goldstein and Desalle, 2003). However, in thepresent case very similar estimates of species numbersand species limits were obtained with either method,demonstrating the robustness of the data to differentquantitative approaches of species delimitation. Differ-ences that did occur reflect the opposing effects of crypticwithin-population divergence detected by the analysisof branching rates on the one hand, and the recognitionof more recent divergence by population-based methodson the other. In addition, the analysis of branching ratesconducted on monophyletic lineages will not recognizeparaphyletic species, while also relying on the correct re-construction of the tree. Arguably, the best final assign-ment would be to integrate branch-length approachesand the PAA method (as it is not based on topologyand hence a “correct” tree) and to recognize 54 putativespecies.
Neither approach would recognize recently derivedecological variants. For example, R. eburneola is a flight-less species from Lake Gilmore, which was not separatedby any of the DNA methods as distinct from the co-occurring, but flighted and morphologically and ecolog-ically distinct R. nr. blackburni. This form should clearlybe added to the count of Rivacindela species. The exam-ple hence demonstrated that the mtDNA-based methodsmay be conservative compared to classical morpholog-ical techniques of species differentiation, contrary towidely held concerns (see Agapow et al., 2004). In ad-dition, DNA delimited species were generally congruentwhen compared to the morphologically based species as-signment in those cases where names had been assignedto the specimens in preliminary identifications (Table S1),which allays concerns that DNA-based taxonomies re-sult in oversplitting of the existing variation.
Although R. eburneola was the only obvious case wheremajor morphological differences did not coincide withthe mtDNA defined groups, minor variation was seenin the informal morphological identification during fieldwork that also disagreed with DNA (Table S1). This raisesthe possibility of incongruent gene and species histo-ries, in particular in the light of reported high propensityfor gene flow of mtDNA between otherwise separatedgroups (Funk and Omland, 2003; Hudson and Coyne,2002; Seberg et al., 2003; Will and Rubinoff, 2004). With-out further morphological analysis or sequencing of nu-clear loci, the magnitude of this problem in Rivacin-dela is difficult to assess. However, the high fidelity ofgeographic distribution of DNA-based groups and an-cient river basins (Fig. 6) provides clear evidence againstmtDNA dispersal, in particular during the past ∼700 Kysince most of these species were separated. Across allwestern Australian species we observe only two casesof well-sampled distinct clusters in the branch lengthsanalysis (individuals from site GY in clade 30, and indi-viduals from site DE in clade 28; the DE individuals beinga diagnosable group in the PAA) where one or more se-quences were embedded in a “foreign” population; i.e.,in a different river basin than all other sequences withinthe cluster. Hence, in Rivacindela the broad congruenceof mtDNA distribution with biogeographical landscapefeatures is evidence for their biological relevance.
The geographic pattern strongly indicates vicariantspeciation as the cause of the range distributions, withonly occasional dispersal between drainage systems,consistent with the paleoclimatic history of the region.Ephemeral salt lakes of interior Australia formed by frag-mentation of paleo-drainage basins that existed prior tothe aridification of the continent starting in the Miocene(van de Graaff et al., 1977). Proposed ancient basins re-mained well preserved because of tectonic stability andslow erosion and sedimentation in the area (van de Graaffet al., 1977). The date of the species-to-population tran-sition (Fig. 4) coincides narrowly with the changes fromlacustrine clays to evaporites and dune sediments es-timated to have occurred between 400 and 700 Kya ina final shift to present-day aridity in regional climates(Pillans and Bourman, 2001). This would indicate thatspecies formation in Rivacindela was a direct result of thefragmentation of their habitat near edges of the disap-pearing river systems.
CONCLUSIONS
The acceptance of DNA taxonomy in the literature hasbeen slow (e.g., Lipscomb et al., 2003; Wheeler, 2004;Will and Rubinoff, 2004), partly because the biologicalstatus of entities established from sequence informationalone is not easily verified, unlike the long tradition oftaxonomic research based on morphological characters.However, in Rivacindela the species status of the mtDNA-based entities is well justified both evolutionarily andbiologically: the levels of sequence divergence betweenspecies matched those in other insects (Brower, 1994),including taxonomically well studied North American
2006 PONS ET AL.—SPECIES DELIMITATION FOR UNDESCRIBED INSECTS 607
Cicindela (Vogler et al., 2005); geographic ranges are con-tiguous but clearly delimited and consistent with bio-geography (Fig. 1); patterns of genetic diversity are con-sistent with paleoclimatic evidence for their vicariantorigin (Fig. 6); and the tree exhibits the branching ratesignature of the species-to-population transition (Fig. 5).Besides the question about species status, the mtDNAgroups also provide a powerful system for taxonomiccommunication, identification, and convenient integra-tion of newly generated information. For example, spec-imens found during our second (2003) expedition werereadily identified in the existing database either as mem-bers of established species or representing unknowngroups (Supplementary Table S1).
With an estimated 107 species of insects on Earth(Erwin, 1982; Odegaard, 2000), there is no realistic hopefor their in-depth taxonomic treatment using traditionalmethods. Greater sequencing throughput and algorith-mic analysis of species membership, as applied here toa depauperate desert ecosystem, could be extended tomore complex assemblages, including the spectaculardiversity of insect species in tropical forests. The effi-cacy of such approaches will depend on whether similarbranching rate shifts are found generally in insects andto what degree they separate closely related species. Theprominent feature of the branch-length distribution ofRivacindela defined by the largely synchronized origin ofspecies fitting a simplified model of rate shift may be aspecial case due to its unique paleoclimatic history. Inaddition, the extent of population sampling in a largeclade may rarely be as complete as in the current study,and could also affect the recovery of the rate shift, sup-pressing or inflating rates in either portion of the treeand shifting their slope relative to each other. Finally,population subdivision within species would also blurthe species-to-population transition of branching rates,as subdivision (metapopulation structure) tends to in-crease the age of the most recent common ancestor withinspecies (Wakeley, 2000; Wakeley and Aliacar, 2001), al-though, fortuitously, if the common ancestor of divergedspecies was also subdivided, genetic divergence betweensister species will tend to increase by a similar amount(Wakeley, 2000). Given the emerging evidence for strongclustering of sequence variation in most groups of in-sects and other invertebrates (Hajibabaei et al., 2006;Meyer and Paulay, 2005; Monaghan et al., 2005; Pageet al., 2005; Smith et al., 2005) and their largely uniformcoalescence time (Meyer and Paulay, 2005), for the greatmajority of lineages the signal of the clade-to-populationtransition is probably sufficiently robust to be detectableeven under a range of confounding biological factors andsampling regimes. This supports the wide applicabilityof mtDNA-based species delimitation in poorly knowngroups generally.
As well as establishing a taxonomic framework,the high-throughput mtDNA profiles simultaneouslyprovide information on the evolutionary and ecolog-ical history of a group. In Rivacindela, we establishedthat macroecological patterns (endemism, beta-diversity,
range sizes) and dynamics of speciation result largelyfrom the history of climate change, whereby separatedpopulations have persisted in situ for 105 to 106 years.This provides a context for comparative studies, e.g.,with the subterranean diving beetles dependent on thesame aquifers as Rivacindela (Leys et al., 2003), or withpatterns of diversity in the 1000 species of Cicindela s.l.on other continents (Pearson and Vogler, 2001). Whileproviding a framework for taxonomy widely accessi-ble without specialist knowledge, the comprehensivemtDNA profiling of faunas across biogeographic regions(see also Monaghan et al., 2006) at the same time providesa formidable resource for evolutionary biology, popula-tion genetics, and studies of global biodiversity patterns.
ACKNOWLEDGMENTS
We thank David Brzoska, Fabio Cassola, and Jay Shetterly for helpwith collection of specimens, and Saskia Bode and Fatos Kopliku for se-quencing. Charles Godfray, Ryan Gregory, Paul Harvey, Andy Purvis,Sean Nee, and Richard Thomas provided helpful comments on anearlier version of the manuscript. We are grateful to Marshal Hedin,Rod Page, Mark Fishbein, and an anonymous referee for their de-tailed and insightful comments in the review process. A permit forexport of specimens from Australia was held by WDS. This workwas funded by the Natural Environment Research Council (UK) grantNER/A/S/2000/00489 and NER/A/S/2001/01133.
REFERENCES
Acinas, S. G., V. Klepac-Ceraj, D. E. Hunt, C. Pharino, I. Ceraj, D. L.Distel, and M. F. Polz. 2004. Fine-scale phylogenetic architecture ofa complex bacterial community. Nature 430:551–554.
Agapow, P. M., O. R. P. Bininda-Emonds, K. A. Crandall, J. L. Gittleman,G. M. Mace, J. C. Marshall, and A. Purvis. 2004. The impact of speciesconcept on biodiversity studies. Quart. Rev. Biol. 79:161–179.
Barraclough, T. G., C. W. Birky, and A. Burt. 2003. Diversification insexual and asexual organisms. Evolution 57:2166–2172.
Barraclough, T. G., and S. Nee. 2001. Phylogenetics and speciation.Trends Ecol. Evol. 16:391–399.
Barraclough, T. G., and A. P. Vogler. 2002. Recent diversification ratesin North American tiger beetles (genus Cicindela). Mol. Biol. Evol.19:1706–1716.
Blaxter, M. L. 2004. The promise of a DNA taxonomy. Phil. Trans. R.Soc. B 359:669–679.
Boore, J. L. 2001. Mitochondrial gene arrangement source guide, ver-sion 6.0. http://evogen.jgi.doe.gov/second levels/mito-chondria/MGA Guide.html. Department of the Environment, Joint GenomeInstitute, Walnut Creek, California.
Brower, A. V. Z. 1994. Rapid morphological radiation and convergenceamong races of the butterfly Heliconius erato Inferred from patterns ofmitochondrial DNA Evolution. Proc. Natl. Acad. Sci. USA 91:6491–6495.
Brower, A. V. Z. 1999. Delimitation of phylogenetic species with DNAsequences: A critique of Davis and Nixon’s population aggregationanalysis. Syst. Biol. 48:199–213.
Brower, A. V. Z., R. DeSalle, and A. Vogler. 1996. Gene trees, speciestrees, and systematics. Annu. Rev. Ecol. Syst. 27:423–450.
Cardoso, A., and A. P. Vogler. 2005. DNA taxonomy, phylogeny andPleistocene diversification of the Cicindela hybrida species group(Coleoptera: Cicindelidae). Mol. Ecol. 14:3531–3546.
Charlesworth, B., D. Charlesworth, and N. H. Barton. 2003. The effectsof genetic and geographic structure on neutral variation. Annu. Rev.Ecol. Evol. Syst. 34:99–125.
Clement, M., D. Posada, and K. A. Crandall. 2000. TCS: A computerprogram to estimate gene genealogies. Mol. Ecol. 9:1657–1659.
Cracraft, J. 1983. Species concept and speciation analysis. Curr. Ornith.1:159–187.
608 SYSTEMATIC BIOLOGY VOL. 55
Cracraft, J. 1992. The species of the birds-of-paradise (Paradisaeidae):Applying the phylogenetic species concept to complex pattern ofdiversification. Cladistics 8:1–43.
Davis, J. I., and K. C. Nixon. 1992. Populations, genetic variation, andthe delimitation of phylogenetic species. Syst. Biol. 41:421–435.
Doyle, J. J. 1995. The irrelevance of allele tree topologies for speciesdelimitation, and a non-topological alternative. Syst. Bot. 20:574–588.
Edwards, A. W. F. 1972. Likelihood. The John Hopkins University Press,London.
Erwin, T. L. 1982. Tropical forests: Their richness in Coleoptera andother arthropod species. Coleopts Bull. 36:74–75.
Freitag, R. 1979. Reclassification, phylogeny, and zoogeography of theAustralian species of Cicindela (Coleoptera: Cicindelidae). Aust. J.Zool. Suppl. Ser. 66:1–99.
Funk, D. J., and K. E. Omland. 2003. Species-level paraphyly and poly-phyly: Frequency, causes, and consequences, with insights from an-imal mitochondrial DNA. Annu. Rev. Ecol. Syst. 34:97–423.
Goldman, N. 1993. Statistical tests of models of DNA substitution.J. Mol. Evol. 36:182–198.
Goldstein, P. Z., and R. Desalle. 2003. Calibrating phylogenetic speciesformation in a threatened insect using DNA from historical speci-mens. Mol. Ecol. 12:1993–1998.
Hajibabaei, M., D. H. Janzen, J. M. Burns, W. Hallwachs, and P. D. N.Hebert. 2006. DNA barcodes distinguish species of tropical Lepi-doptera. Proc. Natl. Acad. Sci. USA 103:968–971.
Hebert, P. D. N., A. Cywinska, S. L. Ball, and J. R. DeWaard. 2003. Biolog-ical identifications through DNA barcodes. Proc. R. Soc. B 270:313–321.
Hebert, P. D. N., and T. R. Gregory. 2005. The promise of DNA barcodingfor taxonomy. Syst. Biol. 54:852–859.
Hebert, P. D. N., E. H. Penton, J. M. Burns, D. H. Janzen, and W.Hallwachs. 2004a. Ten species in one: DNA barcoding reveals crypticspecies in the neotropical skipper butterfly Astraptes fulgerator. Proc.Natil. Acad. Sci. USA 101:14812–14817.
Hebert, P. D. N., M. Y. Stoeckle, T. S. Zemlak, and C. M. Francis. 2004b.Identification of birds through DNA barcodes. PLoS Biol. 2:1657–1663.
Hennig, W. 1966. Phylogenetic systematics. University of Illinois Press,Urbana.
Hey, J. 1991. The structure of genealogies and the distribution of fixeddifferences between DNA-sequence samples from natural popula-tions. Genetics 128:831–840.
Hey, J., R. S. Waples, M. L. Arnold, R. K. Butlin, and R. G. Harrison.2003. Understanding and confronting species uncertainty in biologyand conservation. Trends Ecol. Evol. 18:597–603.
Hudson, R. R. 1991. Gene genealogies and the coalescent process. Oxf.Surv. Evol. Biol. 7:1–44.
Hudson, R. R., and J. A. Coyne. 2002. Mathematical consequences ofthe genealogical species concept. Evolution 56:1557–1565.
Hugall, A., C. Moritz, A. Moussalli, and J. Stanisic. 2002. Reconcilingpaleodistribution models and comparative phylogeography in theWet Tropics rainforest land snail Gnarosophia bellendenkerensis (Bra-zier 1875). Proc. Natl. Acad. Sci. USA 99:6112–6117.
Kamoun, S., and S. A. Hogenhout. 1996. Flightlessness and rapid terres-trial locomotion in tiger beetles of Cicindela L. subgenus Rivacindelavan Nidek from saline habitats of Australia. Coleopts Bull. 50:221–230.
Leys, R., C. H. S. Watts, S. J. B. Cooper, and W. F. Humphreys. 2003. Evo-lution of subterranean diving beetles (Coleoptera: Dytiscidae: Hy-droporini, Bidessini) in the arid zone of Australia. Evolution 57:2819–2834.
Lipscomb, D., N. Platnick, and Q. Wheeler. 2003. The intellectual con-tent of taxonomy: A comment on DNA taxonomy. Trends Ecol. Evol.18:65–68.
Mallet, J., and K. Willmott. 2003. Taxonomy: Renaissance or Tower ofBabel? Trends Ecol. Evol. 18:57–59.
Matz, M. V., and R. Nielsen. 2005. A likelihood ratio test for speciesmembership based on DNA sequence data. Phil. Trans. R. Soc. B360:1969–1974.
Mayden, R. L. 1997. A hierarchy of species concepts: The denouementin the saga of the species problem. Pages 381–423 in Species. The unitsof biodiversity (M. F. Claridge, H. A. Dawah, and M. R. Wilson, eds.).Chapman and Hall, London.
Meyer, C. P., and G. Paulay. 2005. DNA barcoding: Error rates basedon comprehensive sampling. PLoS Biol. 3:2229–2238.
Monaghan, M. T., M. Balke, T. R. Gregory, and A. P. Vogler. 2005. DNA-based species delineation in tropical beetles using nuclear and mito-chondrial markers. Phil. Trans. R. Soc. B 360:1925–1933.
Monaghan, M. T., M. Balke, J. Pons, and A. P. Vogler. 2006. Beyond bar-codes: complex DNA taxonomy of a South Pacific Island radiation.Proc. R. Soc. B 273:887–893.
Moritz, C., and C. Cicero. 2004. DNA barcoding: Promise and pitfalls.PLoS Biol. 2:1529–1531.
Nee, S. 1994. Extinction rates can be estimated from molecular phylo-genies. Phil. Trans. R. Soc. B 344:77–82.
Nee, S. 2001. Inferring speciation rates from phylogenies. Evolution55:661–668.
Nee, S., R. M. May, and P. H. Harvey. 1994. The reconstructed evolu-tionary process. Phil. Trans. R. Soc. B 344:305–311.
Nee, S., A. O. Mooers, and P. H. Harvey. 1992. Tempo and mode ofevolution revealed from molecular phylogenies. Proc. Natl. Acad.Sci. USA 89:8322–8326.
Nelson, G. J., and N. I. Platnick. 1981. Systematics and biogeography:Cladistics and vicariance. Columbia University Press, New York.
Nixon, K. C. 1999. The Parsimony Ratchet, a new method for rapidparsimony analysis. Cladistics 15:407–414.
Odegaard, F. 2000. How many species of arthropods? Erwin’s estimaterevised. Biol. J. Linn. Soc. 71:583–597.
Page, T. J., S. C. Choy, and J. M. Hughes. 2005. The taxonomic feed-back loop: Symbiosis of morphology and molecules. Biol. Lett. 1:139–142.
Pearson, D. L., and A. P. Vogler. 2001. Tiger beetles: The ecologyand evolution of the Cicindelidae. Cornell University Press, Ithaca,New York.
Pillans, B., and R. Bourman. 2001. Mid Pleistocene arid shift in southernAustralia, dated by magnetostratigraphy. Aust. J. Soil Res. 39:89–98.
Pons, J., T. G. Barraclough, K. Theodorides, A. Cardoso, and A. P. Vogler.2004. Using exon and intron sequences of the gene Mp20 to resolvebasal relationships in Cicindela (Coleoptera:Cicindelidae). Syst. Biol.53:554–570.
Pons, J., and A. P. Vogler. 2005. Complex pattern of coalescence and fastevolution of a mitochondrial rRNA pseudogene in a recent radiationof tiger beetles. Mol. Biol. Evol. 22:991–1000.
Rosenberg, N. A., and M. Nordborg. 2002. Genealogical trees, coales-cent theory and the analysis of genetic polymorphisms. Nat. Rev.Genet. 3:380–390.
Sanderson, M. J. 2002. Estimating absolute rates of molecular evolutionand divergence times: A penalized likelihood approach. Mol. Biol.Evol. 19:101–109.
Schaefer, J. A. 2006. Towards maturation of the population concept.Oikos 112:236–240.
Seberg, O., C. J. Humphries, S. Knapp, D. W. Stevenson, G. Petersen,N. Scharff, and N. M. Andersen. 2003. Shortcuts in systematics? Acommentary on DNA-based taxonomy. Trends Ecol. Evol. 18:63–65.
Sites, J. W., and J. C. Marshall. 2003. Delimiting species: A Renaissanceissue in systematic biology. Trends Ecol. Evol. 18:462–470.
Smith, M. A., B. L. Fisher, and P. D. N. Hebert. 2005. DNA barcoding foreffective biodiversity assessment of a hyperdiverse arthropod group:the ants of Madagascar. Phil. Trans. R. Soc. B 360:1825–1834.
Steinke, D., M. Vences, W. Salzburger, and A. Meyer. 2005. TaxI: A soft-ware tool for DNA barcoding using distance methods. Phil. Trans.R. Soc. B 360:1975–1980.
Sumlin, W. D. 1997. Studies on the Australian Cicindelidae XII: Addi-tions to Megacephala, Nickerlea and Cicindela with notes (Coleoptera).Bull. Worldwide Res. 4:1–56.
Swofford, D. L. 2002. PAUP∗: Phylogenetic analysis using parsimony.Version 4.0b. Sinauer Associates, Sunderland, Massachusetts.
Tautz, D., P. Arctander, A. Minelli, R. H. Thomas, and A. P. Vogler. 2003.A plea for DNA taxonomy. Trends Ecol. Evol. 18:70–74.
Templeton, A. R. 2001. Using phylogeographic analyses of gene treesto test species status and processes. Mol. Ecol. 10:779–791.
Templeton, A. R., K. A. Crandall, and C. F. Sing. 1992. A cladistic analy-sis of phenotypic associations with haplotypes inferred from restric-tion endonuclease mapping and sequencing data. III. Cladogramestimation. Genetics 132:619–633.
2006 PONS ET AL.—SPECIES DELIMITATION FOR UNDESCRIBED INSECTS 609
Templeton, A. R., E. Routman, and C. A. Phillips. 1995. Separatingpopulation structure from population history: a cladistic analy-sis of the geographical distribution of mitochondrial DNA haplo-types in the tiger salamander, Ambystoma tigrinum. Genetics 140:767–782.
van de Graaff, W. J. E., R. W. A. Crowe, J. A. Bunting, and M. J. Jack-son. 1977. Relict early Cainozoic dranages in arid Western Australia.Zeitschrift f. Geomorphol. 21:379–400.
Vogler, A. P., A. Cardoso, and T. G. Barraclough. 2005. Exploring ratevariation among and within sites in a densely sampled tree: Specieslevel phylogenetics of North American tiger beetles (Genus Cicin-dela). Syst. Biol. 54:4–20.
Vrana, P., and W. C. Wheeler. 1992. Individual organisms as termi-nal entities: Laying the species problem to rest. Cladistics 8:67–72.
Wakeley, J. 2000. The effects of subdivision on the genetic divergenceof populations and species. Evolution 54:1092–1101.
Wakeley, J. 2006. Coalescent theory: An introduction. Roberts & Co.,Greenwood Village, Colorado.
Wakeley, J., and N. Aliacar. 2001. Gene genealogies in a metapopulation.Genetics 159:893–905.
Wheeler, Q. D. 2004. Taxonomic triage and the poverty of phylogeny.Phil. Trans. R. Soc. B 359:571–583.
Wiens, J. J., and T. A. Penkrot. 2002. Delimiting species using DNAand morphological variation and discordant species limits in spinylizards (Sceloporus). Syst. Biol. 51:69–91.
Wilder, J. A., and H. Hollocher. 2003. Recent radiation of endemicCaribbean Drosophila of the dunni subgroup inferred from mul-tilocus DNA sequence variation. Evolution 57:2566–2579.
Will, K. W., and D. Rubinoff. 2004. Myth of the molecule: DNA bar-codes for species cannot replace morphology for identification andclassification. Cladistics 20:47–55.
Yule, G. U. 1924. A mathematical theory of evolution based on theconclusions of Dr. J. C. Willis, FRS. Phil. Trans. R. Soc. B 213:21–87.
First submitted 16 October 2005; reviews returned 31 December 2005;final acceptance 7 April 2006