Monitoring of Geological CO 2 Sequestration Using Isotopes and Perfluorocarbon Tracers Project Number FEAA-045 D. E. Graham 1 , S. M. Pfiffner 2 , T. J. Phelps 2 , Y. K. Kharaka 3 , J. J. Thordsen 3 , and D. R. Cole 4 U.S. Department of Energy National Energy Technology Laboratory Carbon Storage R&D Project Review Meeting Developing the Technologies and Infrastructure for CCS August 12-14, 2014 1 2 4 3
Transcript
Monitoring of Geological CO2Sequestration Using Isotopes and
Perfluorocarbon TracersProject Number FEAA-045
D. E. Graham1, S. M. Pfiffner2, T. J. Phelps2, Y. K. Kharaka3, J. J. Thordsen3, and D. R. Cole4
U.S. Department of EnergyNational Energy Technology Laboratory
Carbon Storage R&D Project Review MeetingDeveloping the Technologies and
Infrastructure for CCSAugust 12-14, 2014
1 2 43
Presentation Outline• Benefits of Tracers to MVA Program• Project Objectives• Background on MVA Tracers• Results on PFTs• Results on Gas and Isotope
Geochemistry• Summary of Key Results• Lessons Learned• Future Plans
2
Benefit to the MVA Program • Tracer studies of subsurface fluids and gases can
provide information on physical and geochemical changes occurring in the host reservoir due to CO2plume migration.
• Tracers used in concert with other monitoring methods like geophysics can lead to a fundamental understanding of processes impacting the behavior of fluids – diffusion, dispersion, mixing, advection, reaction.
• Tracer data can provide ground-truth on behavior of fluids and gases, CO2 transport properties, and CO2saturation that can be used to constrain reservoir simulation models. 3
Project Overview: Overarching Goals
Develop complementary tracer methods to interrogate subsurface for improved CO2 sequestration, field test methods for application to MVA, demonstrate CO2remains in zone, and benefit industry through tech transfer.
4
Specific Objectives:1. Assessment of injections in field. PFT gas tracers are
analyzed by GC-ECD to <pg levels. GC and IRMS is used for gas chemistry and stable isotope ratios, respectively. (e.g. D/H, 18O/16O, 13C/12C, 87Sr/86Sr).
2. Integrate PFT and isotopic results to quantify the behavior of CO2 interaction with brine-rock leading to better predictive models beneficial for MVA.
3. Develop MVA strategy to decipher the fate, transport and breakthrough of CO2, estimate residence time and reservoir capacity, assess the potential leakagetransfer technology to partnerships and industry.
5
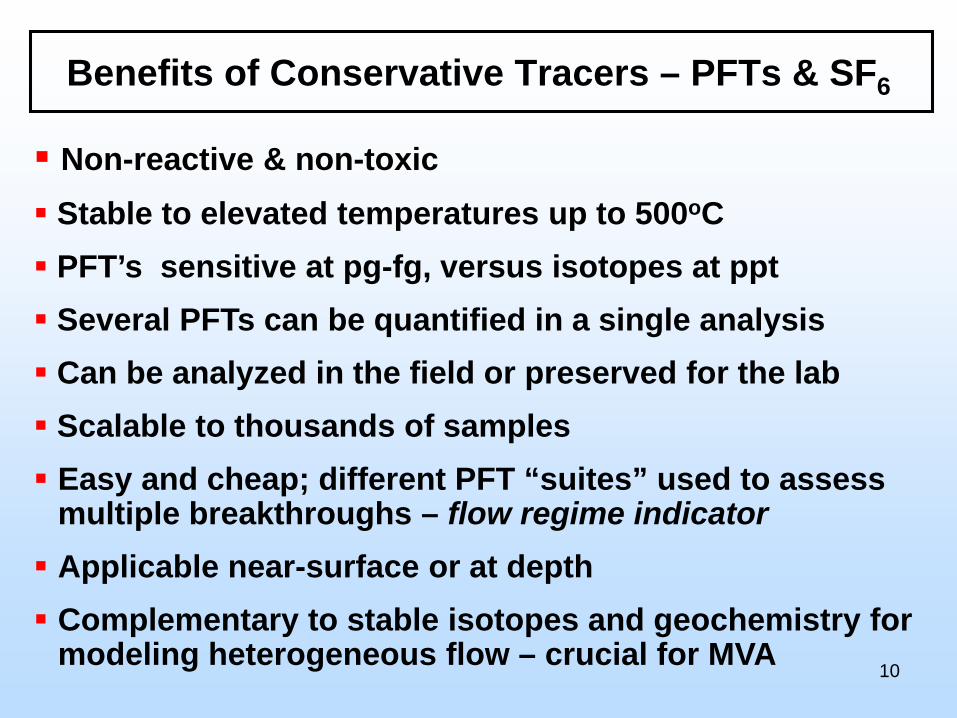
Candidate MVA Tracers (complementing hydrology and geophysics)
Non-reactive & non-toxic Stable to elevated temperatures up to 500oC PFT’s sensitive at pg-fg, versus isotopes at ppt Several PFTs can be quantified in a single analysis Can be analyzed in the field or preserved for the lab Scalable to thousands of samples Easy and cheap; different PFT “suites” used to assess
multiple breakthroughs – flow regime indicator Applicable near-surface or at depth Complementary to stable isotopes and geochemistry for
modeling heterogeneous flow – crucial for MVA 10
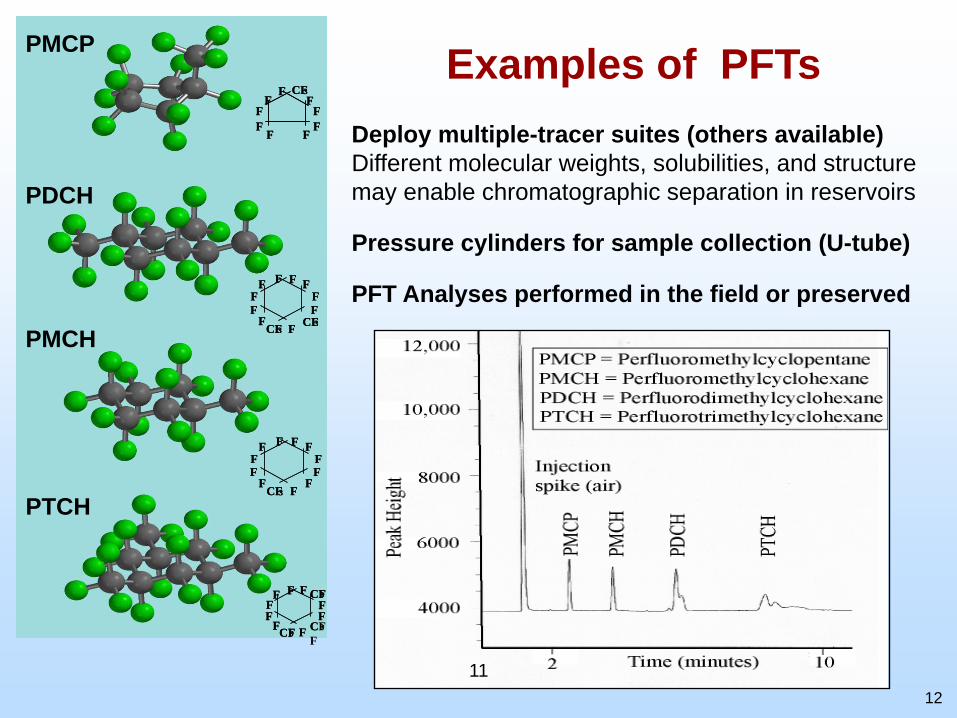
Examples of PFTsPMCP
PMCH
PDCH
PTCH
F FF
FFFF
FF
CF3
F FF
FFFF
FF
CF3
CF3F
FF
F F F
FFF
F
FCF3F
FF
F F F
FFF
F
F
CF3FFF
F F F
FF
F
F CF3CF3FFF
F F F
FF
F
F CF3
CF3
CF3FFF
F F F
FF
F CF3
CF3
CF3FFF
F F F
FF
F CF
3
Deploy multiple-tracer suites (others available)Different molecular weights, solubilities, and structure may enable chromatographic separation in reservoirs
Pressure cylinders for sample collection (U-tube)
PFT Analyses performed in the field or preserved
1211
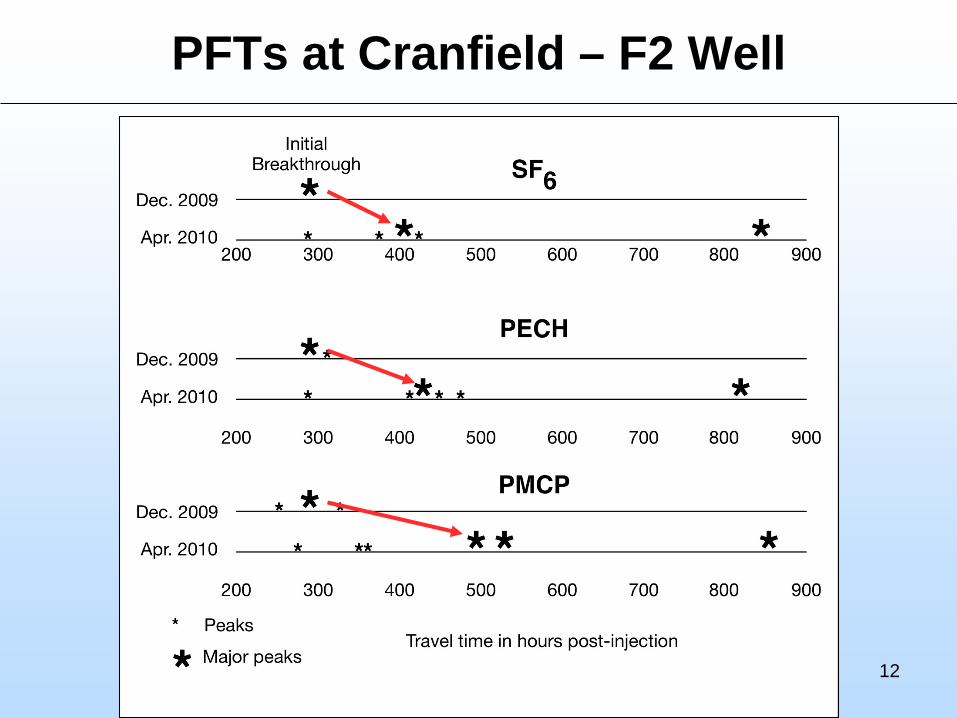
PFTs at Cranfield – F2 Well
12
PTCH Tracer Results from Cranfield, MS
0
2
4
6
8
10
12
750 800 850 900
Experimental Hrs
Peak
Are
a (x
1000
)
F3-PTCHF2-PTCH
April 2010 campaign:
PTCH was added at t = 693 hr,
F2 – Closer to F1, delayed breakthrough compared to F3,smaller peak areas
F3 – Further from F1,Earlier breakthrough compared to F2, larger peak areas
F1 F2 (68m) F3 (112m)DAS well distances
Radial-like flow in 2009; Multi-flow paths in 2010 with short circuits
13
Benefits of Nonconservative Tracers –Stable Isotopes
( 18O/16O, D/H, 13C/12C, 87Sr/86Sr )
Naturally occurring in gases, brines, rocks Sensitive mass spectrometric methods Kinetic & equilibrium partitioning constrained Can be analyzed in the field or the lab Assess gas-brine-rock interaction processes Assess leakage from reservoir; well bore Complementary to gas and brine chemistries Proven and established procedures
14
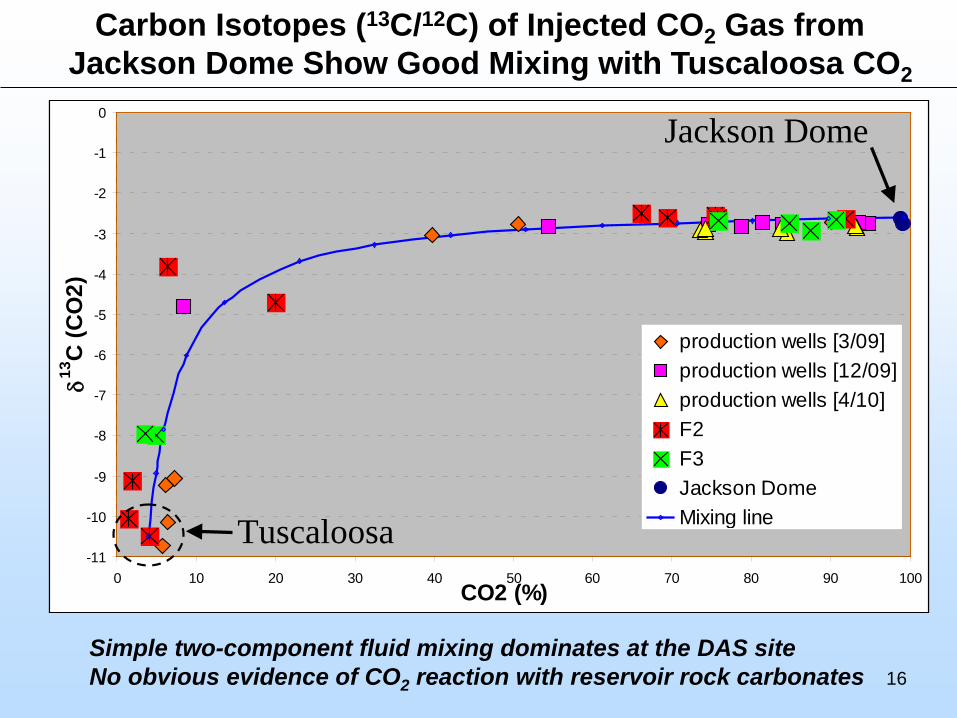
-11
-10
-9
-8
-7
-6
-5
-4
-3
-2
-1
0
0 10 20 30 40 50 60 70 80 90 100CO2 (%)
δ13C
(CO
2)
production wells [3/09]production wells [12/09]production wells [4/10]F2F3Jackson DomeMixing line
Jackson Dome
Tuscaloosa-11
-10
-9
-8
-7
-6
-5
-4
-3
-2
-1
0
0 10 20 30 40 50 60 70 80 90 100CO2 (%)
δ13C
(CO
2)
production wells [3/09]production wells [12/09]production wells [4/10]F2F3Jackson DomeMixing line
Jackson Dome
Tuscaloosa
Carbon Isotopes (13C/12C) of Injected CO2 Gas from Jackson Dome Show Good Mixing with Tuscaloosa CO2
Simple two-component fluid mixing dominates at the DAS siteNo obvious evidence of CO2 reaction with reservoir rock carbonates 16
Magnitude of oxygen isotope shift largely a function of brine/CO2 ratio
δ18OfCO2 – δ18Oi
CO2
δ18OiH2O – δ18Of
H2O
XH2OXCO2
=
19
Summary of Key Results
Suite of PFTs reveal multiple flow paths; short circuit connectivity between injection and monitoring wells
Mixing of CO2 injectate and reservoir CO2 revealed by carbon isotopes
Oxygen isotope shifts in CO2 and brine yield estimates of saturation conditions – analog to RST
Possible dual source for Sr – formation brine + dissolution of sediment (more 87Sr/86Sr in progress)
20
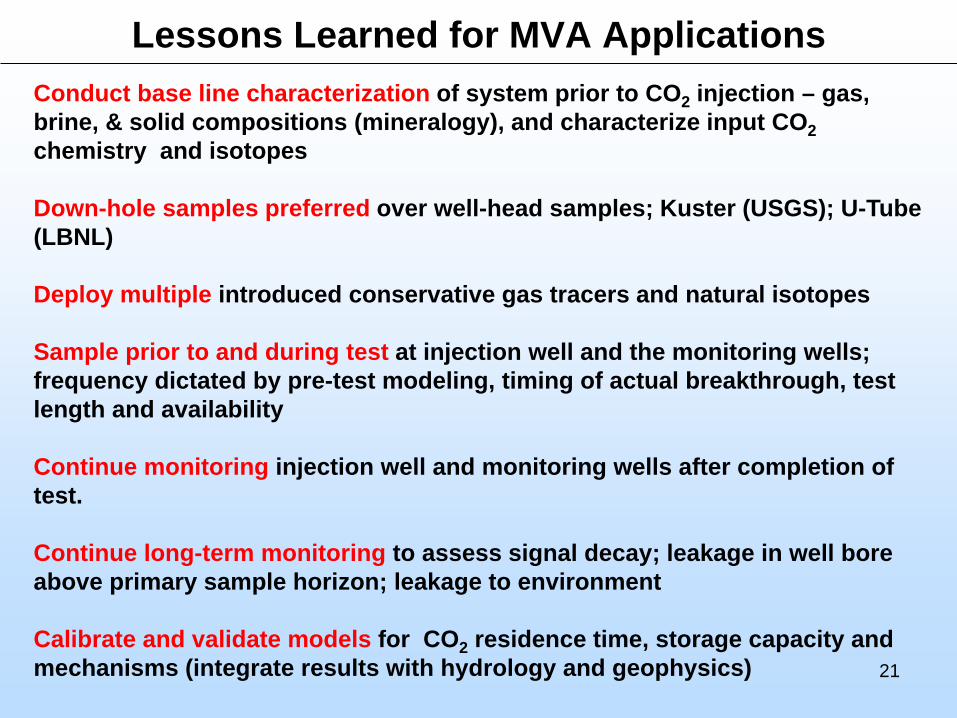
Lessons Learned for MVA ApplicationsConduct base line characterization of system prior to CO2 injection – gas, brine, & solid compositions (mineralogy), and characterize input CO2chemistry and isotopes
Down-hole samples preferred over well-head samples; Kuster (USGS); U-Tube (LBNL)
Deploy multiple introduced conservative gas tracers and natural isotopes
Sample prior to and during test at injection well and the monitoring wells; frequency dictated by pre-test modeling, timing of actual breakthrough, test length and availability
Continue monitoring injection well and monitoring wells after completion of test.
Continue long-term monitoring to assess signal decay; leakage in well bore above primary sample horizon; leakage to environment
Calibrate and validate models for CO2 residence time, storage capacity and mechanisms (integrate results with hydrology and geophysics) 21
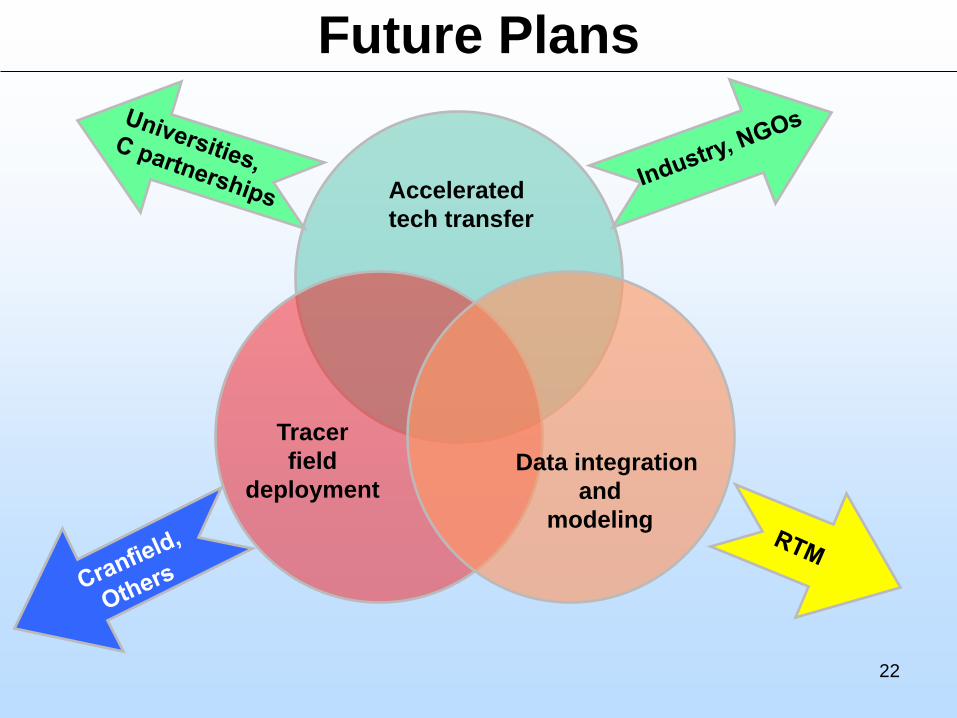
Future Plans
Acceleratedtech transfer
Data integration and
modeling
Tracerfield
deployment
22
Appendix
23
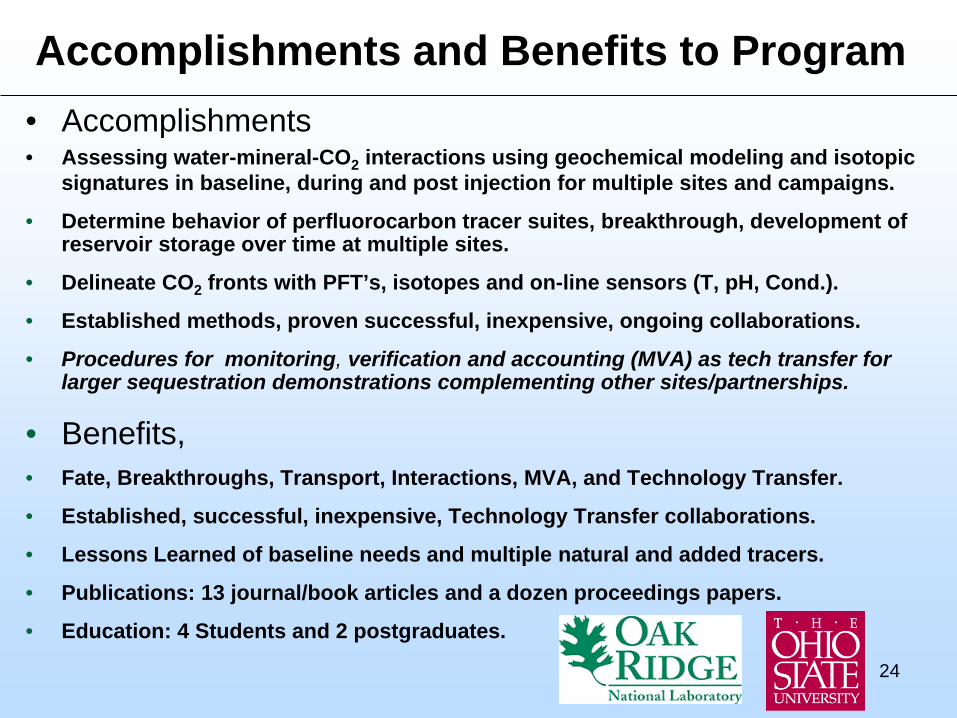
Accomplishments and Benefits to Program• Accomplishments• Assessing water-mineral-CO2 interactions using geochemical modeling and isotopic
signatures in baseline, during and post injection for multiple sites and campaigns.
• Determine behavior of perfluorocarbon tracer suites, breakthrough, development of reservoir storage over time at multiple sites.
• Delineate CO2 fronts with PFT’s, isotopes and on-line sensors (T, pH, Cond.).
• Established methods, proven successful, inexpensive, ongoing collaborations.
• Procedures for monitoring, verification and accounting (MVA) as tech transfer for larger sequestration demonstrations complementing other sites/partnerships.
• Established, successful, inexpensive, Technology Transfer collaborations.
• Lessons Learned of baseline needs and multiple natural and added tracers.
• Publications: 13 journal/book articles and a dozen proceedings papers.
• Education: 4 Students and 2 postgraduates.
24
Project Organization
Tommy PhelpsSusan Pfiffnerand team
Dave Coleand team
DOE-NETL & Partnerships
Collaborators
David Graham, PI
25
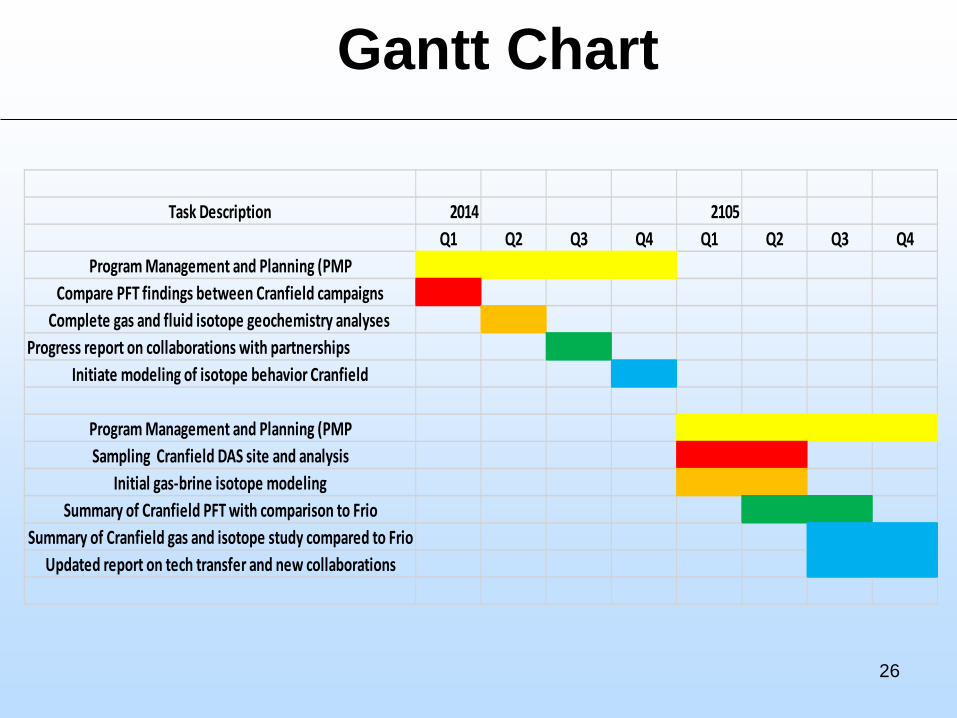
Gantt Chart
Task Description 2014 2105Q1 Q2 Q3 Q4 Q1 Q2 Q3 Q4
Program Management and Planning (PMPCompare PFT findings between Cranfield campaigns
Complete gas and fluid isotope geochemistry analyses Progress report on collaborations with partnerships
Initiate modeling of isotope behavior Cranfield
Program Management and Planning (PMPSampling Cranfield DAS site and analysis
Initial gas-brine isotope modelingSummary of Cranfield PFT with comparison to Frio
Summary of Cranfield gas and isotope study compared to FrioUpdated report on tech transfer and new collaborations
26
BibliographyKharaka, Y. K., Thordsen, J. J., Conaway, C. H., Thomas, R. B. and Cole, D. R. (2013) Geochemistry of geologic sequestration of CO2: Lessons learned from pilot tests and active CCS projects. In: Proceedings of the Le Studium Conference on “Geochemical Reactivity in CO2 Geological Storage Sites”, Orleans, France, Feb. 25-26, 2013.
DePaolo, D. J., Cole, D. R., Navrotsky, A. and Bourg, I. C. (2013, Editors) Geochemistry of Geologic CO2 Sequestration. In: Geochemistry of Geologic Carbon Sequestration (D.J. DePaolo, D. R. Cole. A. Navrotsky and I. Bourg, eds.), Rev. Mineral. Geochem. 77, 539 p.
DePaolo, D. J and Cole, D. R. (2013) Geochemistry of geologic carbon sequestration. An overview. Rev Mineral. Geochem. 77, 1-14.
Yousif K. Kharaka, David R. Cole, James J. Thordsen, Katherine D. Gans, and R. Burt Thomas, (2013) Geochemical Monitoring for Potential Environmental Impacts of Geologic Sequestration of CO2. In: Geochemistry of Geologic Carbon Sequestration (D.J. DePaolo, D. R. Cole. A. Navrotsky and I. Bourg, eds), Rev. Mineral. Geochem. 77, 399-430.