Serial Measurements of Circulating Transthyretin (TTR) In Subjects With TTR Amyloidosis or Carriers of Mutant TTR John Berk 1 , Lawreen Connors 1 , Elizabeth Hankinson 1 , Rick Falzone 2 , Yaysie Figueroa 2 , Renta Hutabarat 2 , Jim Butler 2 , Matthias Kretschmer 2 , Dinah W. Y. Sah 2 , Jeff Cehelsky 2 , Akshay Vaishnaw 2 , Jared Gollob 2 1 Boston University Medical Center, Boston, MA, 2 Alnylam Pharmaceuticals, Cambridge, MA Abstract Transthyretin (TTR) amyloidosis (ATTR) is a fatal, autosomal dominant disease caused by the extracellular deposition of mutant and wild-type TTR leading to polyneuropathy and cardiomyopathy. TTR, previously known as prealbumin, is a protein produced predominantly by hepatocytes (>95% of TTR is liver-derived), with a small fraction produced in the choroid plexus and retina. While approximately half of all TTR circulates free, the remainder is largely complexed to retinol binding protein (RBP), facilitating the transport of vitamin A. Although it is known that serum TTR concentrations are below the normal range in ATTR patients and gene carriers, little is known about temporal changes in TTR levels in either patients or carriers. To investigate and characterize such variability, we initiated a natural history study at Boston University Medical Center (BUMC) in early 2010. The main objectives were to a) assess serial TTR levels over a 4-week period in subjects with TTR amyloidosis and in healthy gene carriers, and b) determine the intra- and inter-patient variability in total TTR and in wild-type versus mutant TTR. ATTR patients or gene carriers with any amyloidogenic mutant TTR genotype were eligible; subjects with poor nutritional status, inflammatory disorders, or taking medications that might affect TTR levels were excluded from the study. Background demographics and medical histories were obtained from consented subjects. Subjects were seen weekly for 4 weeks at the BUMC Amyloid Clinic or at their home by a visiting nurse where blood samples were drawn. Samples were assayed for total TTR by ELISA and Turbidometric Nephlometry and by Liquid Chromatography/Mass Spectrometry for mutant versus wild-type TTR. To date, 26 subjects (15 active disease/and 11 healthy carriers) with seven different amyloidogenic TTR mutations (Val30Met, Thr49Pro, Thr60Ala, Ala97Ser, Ile107Met, Val122Ile, His90ASN/Glu42Gly) have been enrolled. Results from ELISA and turbidometric assays were comparable, with total TTR levels marginally lower in patients compared to gene carriers. Overall, there was relatively modest intra- and inter-subject variability within both patients and gene carriers for total TTR. Wild-type TTR circulates as ~55 KDa tetramer Binds and transports serum retinol binding protein (RBP)/vitamin A and minor fraction of serum thyroxine (T4) Amyloid plaques contain both mutant and wt TTR B Native TTR tetramer Rearranged tetramer Monomer Oligomeric, non-fibrillar and protofibrillar species Amyloid fibril n Adapted from Hou. X et al. 2007 TTR Biology Background A Autosomal dominant disease Caused by extracellular deposition of mutant and wild-type TTR in target organs such as the peripheral nervous system (PNS) and heart – Deposition in the PNS leads to a polyneuropathy/autonomic disorder termed Familial Amyloidotic Polyneuropathy (FAP) • Val30Met (V30M) is most common mutation in FAP • Orthotopic liver transplant (OLT) is only current treatment for FAP – Deposition in the heart leads to a cardiac disorder termed Familial Amyloidotic Cardiomyopathy (FAC) • Val122Ile (V122I) is most common mutation in FAC • OLT unproven in FAC Transthyretin (TTR) Amyloidosis (ATTR) B Results 0.00 V30M T60A T49P H90A/G42G I107M A97S V122I 002 5.00 10.00 15.00 20.00 25.00 mg/dL Wild Type mg/dL Variant 008 009 014 016 022 023 024 025 026 007 011 012 015 019 001 004 005 006 013 003 018 010 017 021 Serum TTR Concentration (mg/dL) Average 4-Week Serum TTR Concentration Patient Identification (Mutations) B Results 0 50 100 150 200 250 300 350 400 450 500 Mean TTR (μg/mL) Mean (±SD) Weekly Total Serum TTR by Subject Carriers Patients T49P V30M T60A H90A/G42G I107M V30M T60A V122I A97S Patient ID (Mutations on top) ELISA Anti-TTR Rb pAb Anti-TTR Sh pAb Anti-sheep Dk pAb-AP AP pNPP λ405nm Serum TTR “Sandwich” ELISA Ag A “Sandwich” ELISA Developed internally GLP validated assay for wt human and cyno TTR (Charles River Labs) Measures TOTAL (TTR) Methods Carrier Mutations T49P (4) V30M (4) T60A (1) I107M (1) H90N/G42G (1) Patient Mutations V30M (6) T60A (4) V122I (4) A97S (1) All Mutations T49P (4) V30M (10) T60A (5) V122I (4) I107M (1) A97S (1) H90N/G42G (1) Demographics and Mutations ALN-TTR-NT-001 Study 26 subjects enrolled 25 completers 15 patients/11 carriers 13 males/13 females TTR Assays developed for assessment of both mutant and WT TTR Over a 28 day observation period, mean TTR levels measured ~200 µg/mL with 10-20% intra-subject variability and approximately 25% inter-subject variability – V30M variability lower compared to the overall study population – TTR levels similar between patients and carriers Overall, IEF demonstrated an approximate 1:1 ratio of mutant to wild type TTR in V30M patients and carriers These data support further evaluation of RNAi therapeutics (ALN-TTR) for TTR Amyloidosis Summary ALN-TTR-NT-001 Study Design A To assess serial circulating levels of TTR in patients with TTR amyloidosis and in healthy carriers of a mutant TTR gene through: – Measurement of total TTR by ELISA – Exploratory analysis of wild type and mutant TTR using isoelectric focusing (IEF) To describe the intra-patient variability in mutant, wild-type, and total TTR over time Objectives B Carriers: Male or female aged ≥18 years Documented carrier of a TTR mutation (heterozygote or homozygote) No clinical manifestations of amyloidosis No history of biopsy-proven amyloid deposits Subject is willing and able to comply with protocol schedule of assessments Patients: Male or female aged ≥18 years Biopsy-proven TTR amyloidosis Subject is willing and able to comply with protocol schedule of assessments Key Inclusion Criteria C Known or suspected active inflammatory disorder (e.g., chronic infection, active RA/OA) Taking medication that is known or suspected to affect circulating TTR level (e.g., oral contraceptives, systemic steroids) BMI <19.0 kg/m 2 or clinical evidence of poor nutritional status Chronic renal disease (clinically significant elevation of serum creatinine) Key Exclusion Criteria D Single-center, natural history, non-therapeutic study – Boston University TTR amyloidosis patients and healthy carriers (≥18 years) Circulating levels of TTR assessed serially over 4 consecutive weeks Study Design ALN-TTR-NT-001 Schedule of Assessments Procedure Screening/Visit 1 (W0) Visit 2 (W1) Visit 3 (W2) Visit 4 (W3) Informed Consent and Medical History X Inclusion/Exclusion X Enrollment X Demographics X Previous and Conmeds X X X X Vital Signs X X* X* X* Physical Exam X Blood sampling for chem/hem X Blood sampling for TTR X X X X Interval Health Status Inquiry X X X *Temperature only for visits 2 - 4 Isoelectric Focusing Gel (IEF) A 2 Step Semi-Quantitative Native Polyacrylamide gel electrophoresis (7.5%) – Non-denaturing gels IEF – pH 4.0 – 7.0 gradient; partially denaturing conditions (2.5M Urea) – Proteins separated based on charge; migrate through pH gradient until net charge of protein is zero – Bands quantified using densitometry – Isolates monomeric form of TTR protein Methods Connors LH et al. (1998) BBA 1407:185-92 *Variance is estimated using a random effects model C Summary Statistics of TTR Levels Over Time Group included in analysis Visits included in analysis Number of Subjects Number of Observations Mean (µg/mL) Intrasubject Variance* (µg/mL) Intersubject Variance* (µg/mL) Carrier (All) All visits 11 44 194.9 33.2 (17%) 46.2 (22%) Patient (All) All visits 15 57 207.9 47.8 (23%) 52.3 (25%) Overall (All) All visits 26 101 202.2 42.0 (21%) 47.7 (24%) Carrier (Met30) All visits 4 16 230.7 26.5 (11%) 55.1 (24%) Patient (Met30) All visits 6 24 230.2 19.0 (8%) 65.5 (28%) Overall (Met30) All visits 10 40 230.4 22.3 (10%) 58.2 (25%)
Transcript
Serial Measurements of Circulating Transthyretin (TTR) In Subjects With TTR Amyloidosis or Carriers of Mutant TTR John Berk1, Lawreen Connors1, Elizabeth Hankinson1, Rick Falzone2, Yaysie Figueroa2, Renta Hutabarat2, Jim Butler2, Matthias Kretschmer2, Dinah W. Y. Sah2, Jeff Cehelsky2, Akshay Vaishnaw2, Jared Gollob2
1Boston University Medical Center, Boston, MA, 2Alnylam Pharmaceuticals, Cambridge, MA
AbstractTransthyretin (TTR) amyloidosis (ATTR) is a fatal, autosomal dominant disease caused by the extracellular deposition of mutant and wild-type TTR leading to polyneuropathy and cardiomyopathy. TTR, previously known as prealbumin, is a protein produced predominantly by hepatocytes (>95% of TTR is liver-derived), with a small fraction produced in the choroid plexus and retina. While approximately half of all TTR circulates free, the remainder is largely complexed to retinol binding protein (RBP), facilitating the transport of vitamin A. Although it is known that serum TTR concentrations are below the normal range in ATTR patients and gene carriers, little is known about temporal changes in TTR levels in either patients or carriers. To investigate and characterize such variability, we initiated a natural history study at Boston University Medical Center (BUMC) in early 2010. The main objectives were to a) assess serial TTR levels over a 4-week period in subjects with TTR amyloidosis and in healthy gene carriers, and b) determine the intra- and inter-patient variability in total TTR and in wild-type versus mutant TTR. ATTR patients or gene carriers with any amyloidogenic mutant TTR genotype were eligible; subjects with poor nutritional status, inflammatory disorders, or taking medications that might affect TTR levels were excluded from the study. Background demographics and medical histories were obtained from consented subjects. Subjects were seen weekly for 4 weeks at the BUMC Amyloid Clinic or at their home by a visiting nurse where blood samples were drawn. Samples were assayed for total TTR by ELISA and Turbidometric Nephlometry and by Liquid Chromatography/Mass Spectrometry for mutant versus wild-type TTR. To date, 26 subjects (15 active disease/and 11 healthy carriers) with seven different amyloidogenic TTR mutations (Val30Met, Thr49Pro, Thr60Ala, Ala97Ser, Ile107Met, Val122Ile, His90ASN/Glu42Gly) have been enrolled. Results from ELISA and turbidometric assays were comparable, with total TTR levels marginally lower in patients compared to gene carriers. Overall, there was relatively modest intra- and inter-subject variability within both patients and gene carriers for total TTR.
Wild-type TTR circulates as ~55 KDa tetramer Binds and transports serum retinol binding protein (RBP)/vitamin A and minor
fraction of serum thyroxine (T4) Amyloid plaques contain both mutant and wt TTR
B
Native TTRtetramer
Rearrangedtetramer
Monomer Oligomeric, non-fibrillarand protofibrillar species
Amyloid fibril
n
Adapted from Hou. X et al. 2007
TTR Biology
Background
A
Autosomal dominant disease Caused by extracellular deposition of mutant and wild-type TTR in target organs
such as the peripheral nervous system (PNS) and heart – Deposition in the PNS leads to a polyneuropathy/autonomic disorder termed
Familial Amyloidotic Polyneuropathy (FAP) • Val30Met (V30M) is most common mutation in FAP • Orthotopic liver transplant (OLT) is only current treatment for FAP – Deposition in the heart leads to a cardiac disorder termed Familial
Amyloidotic Cardiomyopathy (FAC) • Val122Ile (V122I) is most common mutation in FAC • OLT unproven in FAC
TTR Assays developed for assessment of both mutant and WT TTR Over a 28 day observation period, mean TTR levels measured ~200 µg/mL with
10-20% intra-subject variability and approximately 25% inter-subject variability – V30M variability lower compared to the overall study population – TTR levels similar between patients and carriers Overall, IEF demonstrated an approximate 1:1 ratio of mutant to wild type TTR in
V30M patients and carriers These data support further evaluation of RNAi therapeutics (ALN-TTR) for
TTR Amyloidosis
Summary
ALN-TTR-NT-001 Study Design
A
To assess serial circulating levels of TTR in patients with TTR amyloidosis and in healthy carriers of a mutant TTR gene through:
– Measurement of total TTR by ELISA – Exploratory analysis of wild type and mutant TTR using isoelectric
focusing (IEF) To describe the intra-patient variability in mutant, wild-type, and total TTR
over time
Objectives
BCarriers: Male or female aged ≥18 years Documented carrier of a TTR mutation (heterozygote or homozygote) No clinical manifestations of amyloidosis No history of biopsy-proven amyloid deposits Subject is willing and able to comply with protocol schedule of assessments Patients: Male or female aged ≥18 years Biopsy-proven TTR amyloidosis Subject is willing and able to comply with protocol schedule of assessments
Key Inclusion Criteria
C
Known or suspected active inflammatory disorder (e.g., chronic infection, active RA/OA) Taking medication that is known or suspected to affect circulating TTR level
(e.g., oral contraceptives, systemic steroids) BMI <19.0 kg/m2 or clinical evidence of poor nutritional status Chronic renal disease (clinically significant elevation of serum creatinine)
Key Exclusion Criteria
D
Single-center, natural history, non-therapeutic study – Boston University TTR amyloidosis patients and healthy carriers (≥18 years) Circulating levels of TTR assessed serially over 4 consecutive weeks
Study Design
ALN-TTR-NT-001 Schedule of Assessments
ProcedureScreening/Visit 1
(W0)Visit 2(W1)
Visit 3(W2)
Visit 4(W3)
Informed Consent and Medical History X
Inclusion/Exclusion X
Enrollment X
Demographics X
Previous and Conmeds X X X X
Vital Signs X X* X* X*
Physical Exam X
Blood sampling for chem/hem X
Blood sampling for TTR X X X X
Interval Health Status Inquiry X X X
*Temperature only for visits 2 - 4
Isoelectric Focusing Gel (IEF)
mt
Sample mutations
wt
pH7
pH4
V30A
V30M
F33L
A36P
E42G
A45T
L58H
T60A
F64L
V71A
I73V
S77Y
I84N
E89Q
V122I
Normal
A
2 Step Semi-Quantitative Native Polyacrylamide gel electrophoresis (7.5%) – Non-denaturing gels IEF – pH 4.0 – 7.0 gradient; partially denaturing conditions (2.5M Urea) – Proteins separated based on charge; migrate through pH gradient until net
charge of protein is zero – Bands quantified using densitometry – Isolates monomeric form of TTR protein
Methods
Connors LH et al. (1998) BBA 1407:185-92
*Variance is estimated using a random effects model
Pre-Clinical Development of ALN-TTR, a Novel RNAi Therapeutic for the Treatment of Transthyretin Amyloidosis Dinah W. Y. Sah1, Qingmin Chen1, Susete Costelha2, Jim Butler1, Shannon Fishman1, Josh Brodsky1, Lubomir Nechev1, Rene Alvarez1, Maria Joao Saraiva2, 3 1Alnylam Pharmaceuticals, Cambridge, MA; 2Molecular Neurobiology Group, Institute for Molecular and Cell Biology, Porto, Portugal; 3ICBAS, University of Porto, Portugal
0.0
0.2
0.4
0.6
0.8
1.0
1.2
Control siRNA(mg/kg)
TTR
/GA
PDH
mR
NA
(Rel
ativ
e to
Con
trol
)
ALN-TTR01(mg/kg)
3 0.3
47%
1.0
62%
3.0
82%
*** ***
***
ED50 = 0.3 mg/kg
Fig 2. ALN-TTR01 Reduces Wild-Type TTR mRNA Levels in NHP
Dose-response for ALN-TTR01 in non-human primate. Groups of animals (n=3/group) were intravenously administered 0.3, 1, or 3 mg/kg ALN-TTR01; or 3 mg/kg Control siRNA via a 15-minute IV infusion. Forty-eight hours later, animals were euthanized and livers harvested. TTR and GAPDH mRNA levels were measured from liver lysates using the Quantigene bDNA assay. The ratio of TTR to GAPDH mRNA levels was calculated for each animal. Group means were determined, normalized to the Control siRNA group, and then plotted. Error bars represent standard deviations. The percentage reduction of the group mean, relative to the Control siRNA group, is indicated for the ALN-TTR01 groups (*** p< 0.001, one-way ANOVA, with Dunn’s post-hoc test).
>100 Mutations identified in TTR gene ALN-TTR01 targets region of TTR mRNA common to wild-type and all known mutant forms of TTR
Loading-maintenance pharmacology of ALN-TTR01 in NHP. To evaluate the ability of lower doses of ALN-TTR01 to maintain suppression of serum TTR protein, groups of animals (n=3-4/group) were administered a first dose on Day 1 at 2 mg/kg ALN-TTR01, Control siRNA or PBS. Subsequent doses were Dose 2 on Day 15, Dose 3 on Day 29, and Dose 4 on Day 43, and comprised PBS, 0.7 mg/kg Control siRNA or 0.2 or 0.7 mg/kg ALN-TTR01. All doses were given via a 15-minute IV infusion. Serum was collected before the 1st dose on Days -8, -6 and -3, and then on Days 3, 8, 14, 17, 22, 28, 31, 36, 42, 45, 50, 57, 64, 71, 78 and 85. An ELISA was used to quantify serum TTR concentrations, which were normalized to baseline values to obtain the relative serum TTR concentration.
Dose-response for ALN-TTR01 in transgenic mice. To evaluate the efficacy of ALN-TTR01 on mutant (V30M) TTR mRNA in the liver and mutant (V30M) TTR protein in the serum, 8 to 12-week old V30M hTTR transgenic mice (5 animals/ group) were intravenously injected with 0.03, 0.3, or 3 mg/kg ALN-TTR01, 3 mg/kg Control siRNA, or PBS (n=5/group). (A) At 48 hours post-dose, mice were euthanized and livers harvested. TTR and GAPDH mRNA levels were measured from liver lysates using the Quantigene bDNA assay. The ratio of TTR to GAPDH mRNA levels was calculated for each animal. Group means were normalized to the PBS control group, and then plotted, where error bars represent standard deviations. The group mean, relative to the control siRNA, is indicated for the ALN-TTR01 groups (*** p<0.001, one-way ANOVA, with Dunn’s post-hoc test). (B) Serum was collected pre-dose and 48 hours post-dose from all animals, and TTR protein levels were quantified using the human pre-albumin (TTR) Assaymax ELISA Kit (AssayPro). Group means are shown, where error bars represent standard deviations. The group mean at 48 hours relative to the control siRNA group is indicated for the ALN-TTR01 groups (*** p<0.001, one-way ANOVA, with Dunn’s post-hoc test).
Fig 4. ALN-TTR01 Reduces Mutant Human TTR in Transgenic Mice
Liver mRNA
ALN-TTR01(mg/kg)
ControlsiRNA
(mg/kg)
0.00.20.40.60.81.0
TTR
/GA
PDH
mR
NA
(rel
ativ
e to
Con
trol
siR
NA
)
1.21.41.6
3 0.03 0.3
***p<0.001(one-way ANOVADunn’s post-hoc test)
***
3
***
ED50 ~ 0.15 mg/kg
Serum Protein
ALN-TTR01(mg/kg)
ControlsiRNA
(mg/kg)
0.00.20.40.60.81.0
TTR
ser
um le
vels
(rel
ativ
e to
Con
trol
siR
NA
)
1.21.4
3 0.03 0.3
***p<0.001(one-way ANOVADunn’s post-hoc test)
***
3***
BA
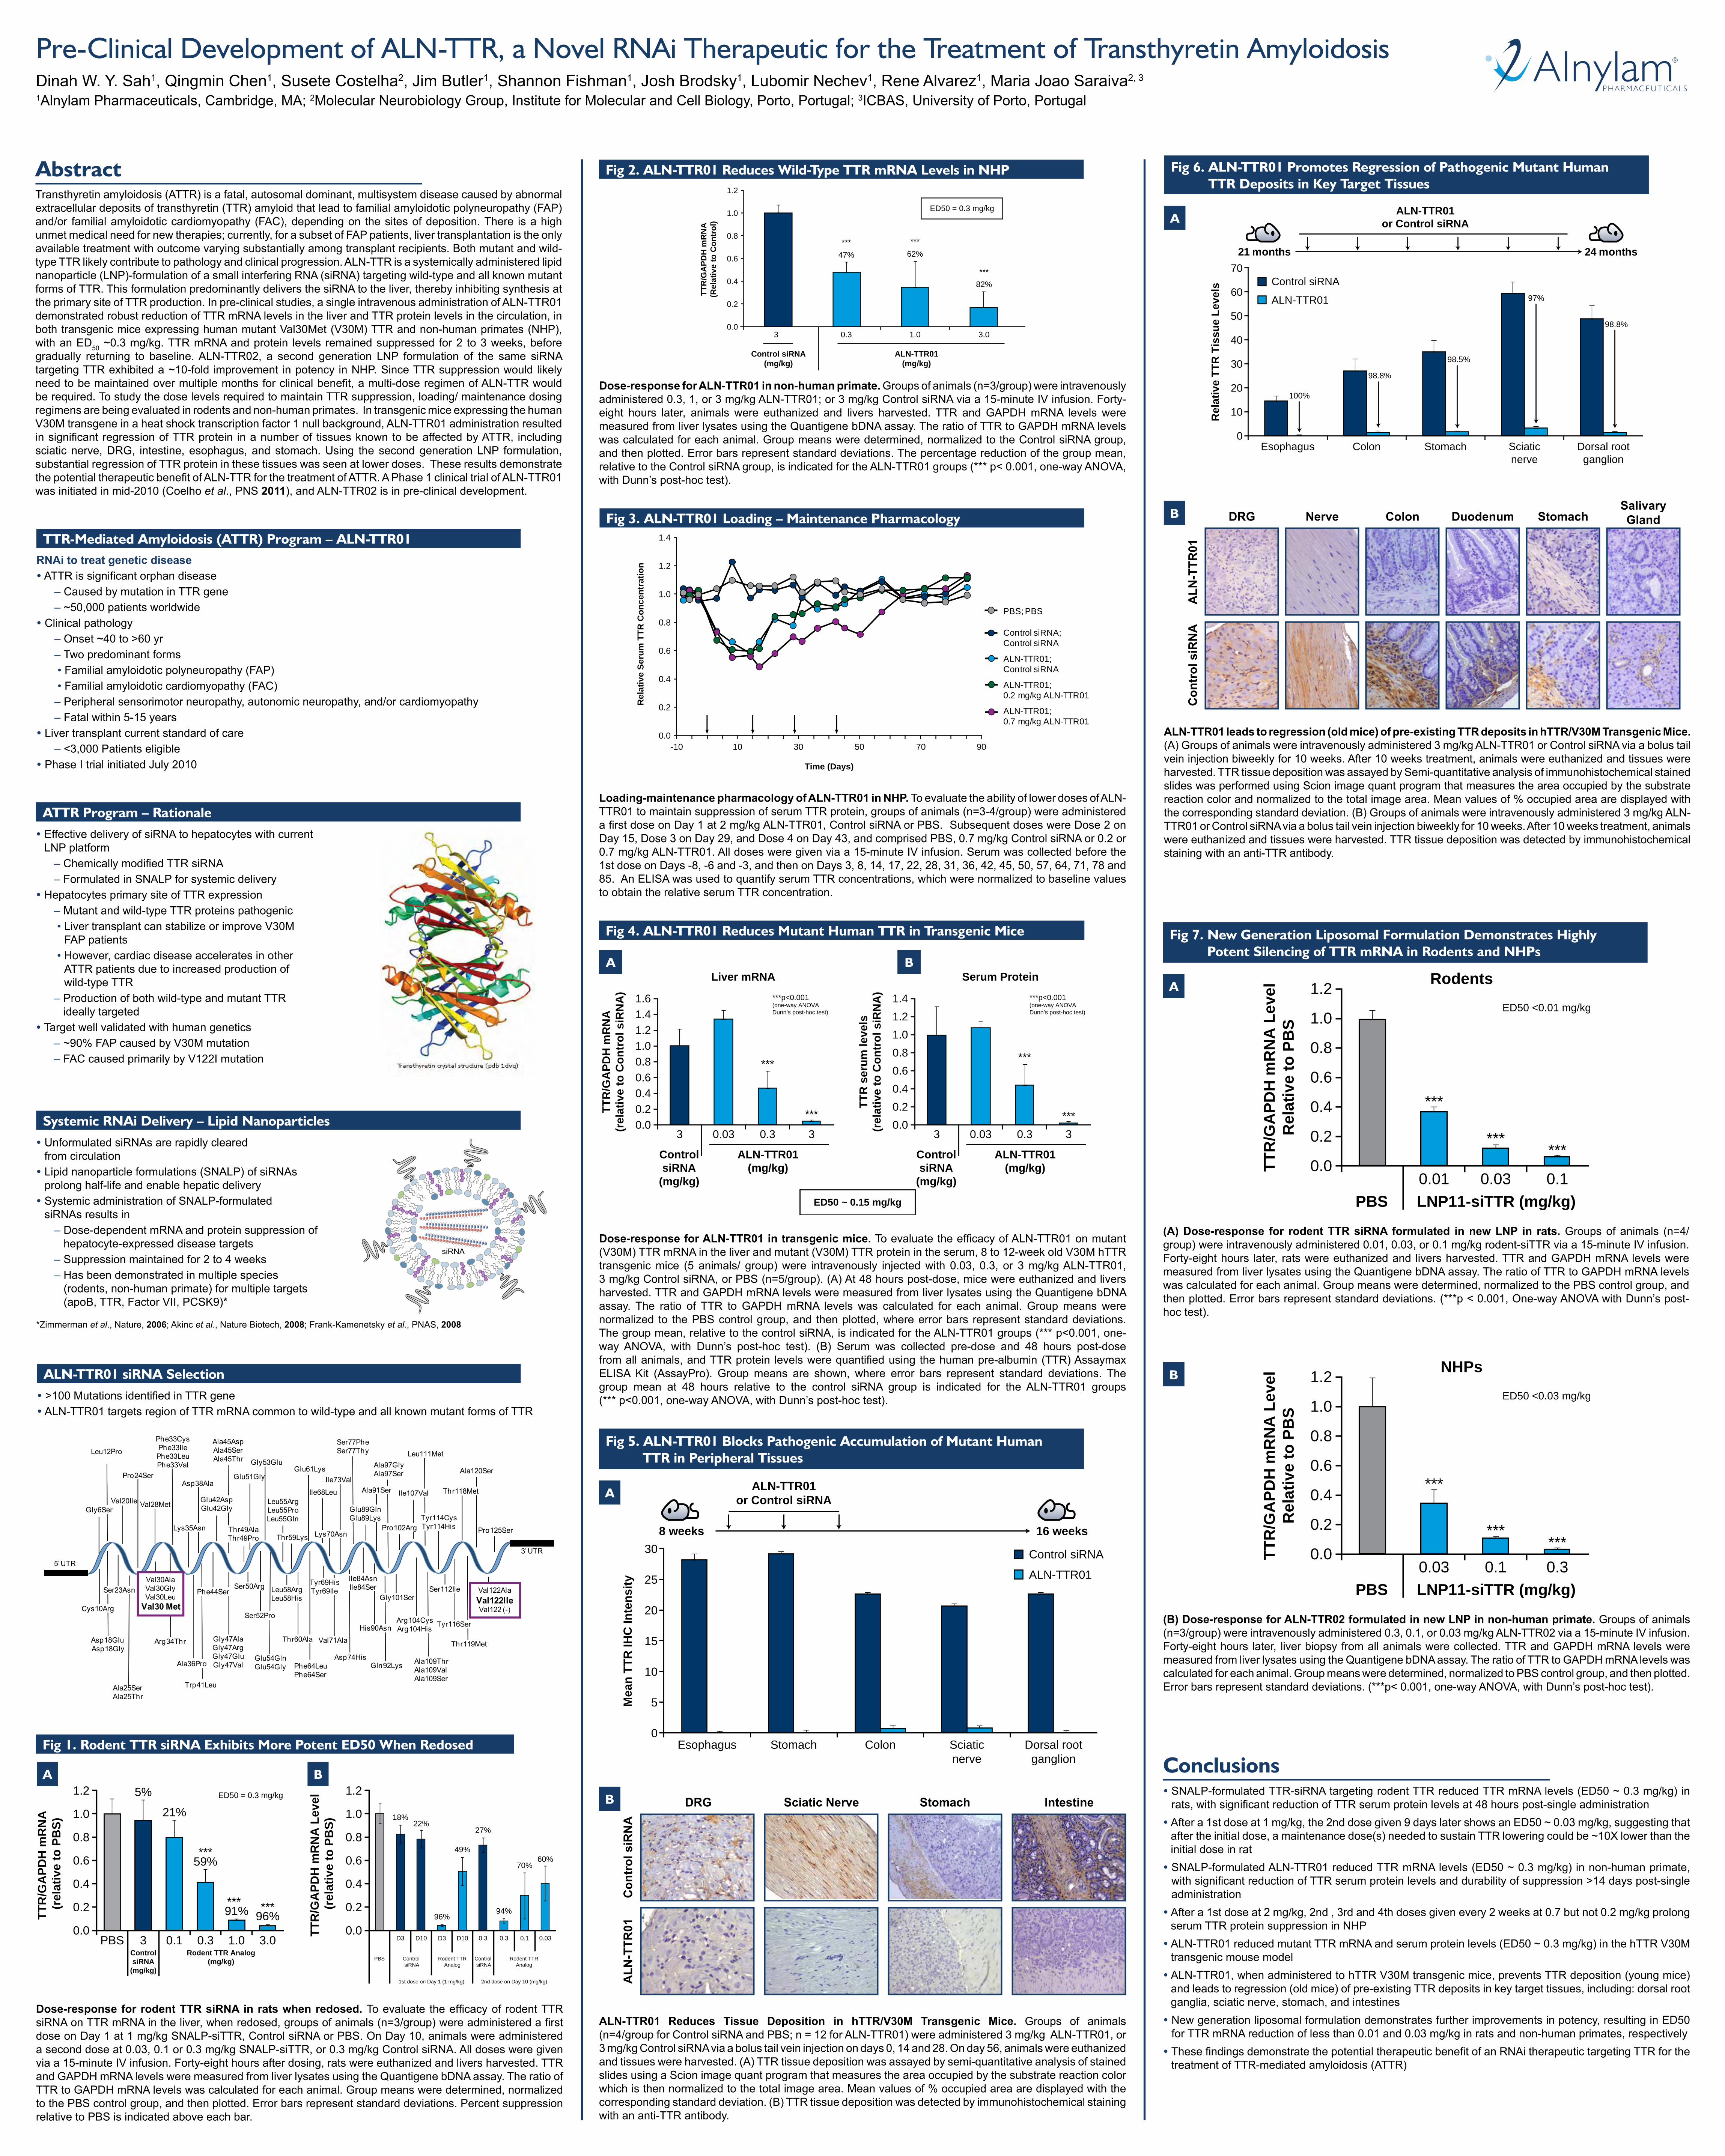
Fig 6. ALN-TTR01 Promotes Regression of Pathogenic Mutant Human TTR Deposits in Key Target Tissues
Rel
ativ
e TT
R T
issu
e Le
vels
70
60
50
40
30
Esophagus Colon Stomach Sciaticnerve
Dorsal rootganglion
20
10
0
21 months
ALN-TTR01or Control siRNA
24 months
100%
98.8%
98.5%
97%
98.8%
Control siRNA
ALN-TTR01
A
ALN-TTR01 leads to regression (old mice) of pre-existing TTR deposits in hTTR/V30M Transgenic Mice. (A) Groups of animals were intravenously administered 3 mg/kg ALN-TTR01 or Control siRNA via a bolus tail vein injection biweekly for 10 weeks. After 10 weeks treatment, animals were euthanized and tissues were harvested. TTR tissue deposition was assayed by Semi-quantitative analysis of immunohistochemical stained slides was performed using Scion image quant program that measures the area occupied by the substrate reaction color and normalized to the total image area. Mean values of % occupied area are displayed with the corresponding standard deviation. (B) Groups of animals were intravenously administered 3 mg/kg ALN-TTR01 or Control siRNA via a bolus tail vein injection biweekly for 10 weeks. After 10 weeks treatment, animals were euthanized and tissues were harvested. TTR tissue deposition was detected by immunohistochemical staining with an anti-TTR antibody.
B DRG
ALN
-TTR
01C
ontr
ol s
iRN
A
Colon StomachNerve DuodenumSalivary Gland
Fig 5. ALN-TTR01 Blocks Pathogenic Accumulation of Mutant Human TTR in Peripheral Tissues
Mea
n TT
R IH
C In
tens
ity
30
25
20
15
Esophagus Stomach Colon Sciaticnerve
Dorsal rootganglion
10
5
0
8 weeks
ALN-TTR01or Control siRNA
16 weeks
Control siRNA
ALN-TTR01
A
ALN-TTR01 Reduces Tissue Deposition in hTTR/V30M Transgenic Mice. Groups of animals (n=4/group for Control siRNA and PBS; n = 12 for ALN-TTR01) were administered 3 mg/kg ALN-TTR01, or 3 mg/kg Control siRNA via a bolus tail vein injection on days 0, 14 and 28. On day 56, animals were euthanized and tissues were harvested. (A) TTR tissue deposition was assayed by semi-quantitative analysis of stained slides using a Scion image quant program that measures the area occupied by the substrate reaction color which is then normalized to the total image area. Mean values of % occupied area are displayed with the corresponding standard deviation. (B) TTR tissue deposition was detected by immunohistochemical staining with an anti-TTR antibody.
B DRG StomachSciatic Nerve Intestine
Con
trol
siR
NA
ALN
-TTR
01
RNAi to treat genetic disease ATTR is significant orphan disease – Caused by mutation in TTR gene – ~50,000 patients worldwide Clinical pathology – Onset ~40 to >60 yr – Two predominant forms • Familial amyloidotic polyneuropathy (FAP) • Familial amyloidotic cardiomyopathy (FAC) – Peripheral sensorimotor neuropathy, autonomic neuropathy, and/or cardiomyopathy – Fatal within 5-15 years Liver transplant current standard of care – <3,000 Patients eligible Phase I trial initiated July 2010
TTR-Mediated Amyloidosis (ATTR) Program – ALN-TTR01
Effective delivery of siRNA to hepatocytes with current LNP platform
– Chemically modified TTR siRNA – Formulated in SNALP for systemic delivery Hepatocytes primary site of TTR expression – Mutant and wild-type TTR proteins pathogenic • Liver transplant can stabilize or improve V30M
FAP patients • However, cardiac disease accelerates in other
ATTR patients due to increased production of wild-type TTR
– Production of both wild-type and mutant TTR ideally targeted
Target well validated with human genetics – ~90% FAP caused by V30M mutation – FAC caused primarily by V122I mutation
ATTR Program – Rationale
AbstractTransthyretin amyloidosis (ATTR) is a fatal, autosomal dominant, multisystem disease caused by abnormal extracellular deposits of transthyretin (TTR) amyloid that lead to familial amyloidotic polyneuropathy (FAP) and/or familial amyloidotic cardiomyopathy (FAC), depending on the sites of deposition. There is a high unmet medical need for new therapies; currently, for a subset of FAP patients, liver transplantation is the only available treatment with outcome varying substantially among transplant recipients. Both mutant and wild-type TTR likely contribute to pathology and clinical progression. ALN-TTR is a systemically administered lipid nanoparticle (LNP)-formulation of a small interfering RNA (siRNA) targeting wild-type and all known mutant forms of TTR. This formulation predominantly delivers the siRNA to the liver, thereby inhibiting synthesis at the primary site of TTR production. In pre-clinical studies, a single intravenous administration of ALN-TTR01 demonstrated robust reduction of TTR mRNA levels in the liver and TTR protein levels in the circulation, in both transgenic mice expressing human mutant Val30Met (V30M) TTR and non-human primates (NHP), with an ED50 ~0.3 mg/kg. TTR mRNA and protein levels remained suppressed for 2 to 3 weeks, before gradually returning to baseline. ALN-TTR02, a second generation LNP formulation of the same siRNA targeting TTR exhibited a ~10-fold improvement in potency in NHP. Since TTR suppression would likely need to be maintained over multiple months for clinical benefit, a multi-dose regimen of ALN-TTR would be required. To study the dose levels required to maintain TTR suppression, loading/ maintenance dosing regimens are being evaluated in rodents and non-human primates. In transgenic mice expressing the human V30M transgene in a heat shock transcription factor 1 null background, ALN-TTR01 administration resulted in significant regression of TTR protein in a number of tissues known to be affected by ATTR, including sciatic nerve, DRG, intestine, esophagus, and stomach. Using the second generation LNP formulation, substantial regression of TTR protein in these tissues was seen at lower doses. These results demonstrate the potential therapeutic benefit of ALN-TTR for the treatment of ATTR. A Phase 1 clinical trial of ALN-TTR01 was initiated in mid-2010 (Coelho et al., PNS 2011), and ALN-TTR02 is in pre-clinical development.
Unformulated siRNAs are rapidly cleared from circulation Lipid nanoparticle formulations (SNALP) of siRNAs
prolong half-life and enable hepatic delivery Systemic administration of SNALP-formulated
siRNAs results in – Dose-dependent mRNA and protein suppression of
hepatocyte-expressed disease targets – Suppression maintained for 2 to 4 weeks – Has been demonstrated in multiple species
rats, with significant reduction of TTR serum protein levels at 48 hours post-single administration After a 1st dose at 1 mg/kg, the 2nd dose given 9 days later shows an ED50 ~ 0.03 mg/kg, suggesting that
after the initial dose, a maintenance dose(s) needed to sustain TTR lowering could be ~10X lower than the initial dose in rat SNALP-formulated ALN-TTR01 reduced TTR mRNA levels (ED50 ~ 0.3 mg/kg) in non-human primate,
with significant reduction of TTR serum protein levels and durability of suppression >14 days post-single administration After a 1st dose at 2 mg/kg, 2nd , 3rd and 4th doses given every 2 weeks at 0.7 but not 0.2 mg/kg prolong
serum TTR protein suppression in NHP ALN-TTR01 reduced mutant TTR mRNA and serum protein levels (ED50 ~ 0.3 mg/kg) in the hTTR V30M
transgenic mouse model ALN-TTR01, when administered to hTTR V30M transgenic mice, prevents TTR deposition (young mice)
and leads to regression (old mice) of pre-existing TTR deposits in key target tissues, including: dorsal root ganglia, sciatic nerve, stomach, and intestines New generation liposomal formulation demonstrates further improvements in potency, resulting in ED50
for TTR mRNA reduction of less than 0.01 and 0.03 mg/kg in rats and non-human primates, respectively These findings demonstrate the potential therapeutic benefit of an RNAi therapeutic targeting TTR for the
treatment of TTR-mediated amyloidosis (ATTR)
Fig 7. New Generation Liposomal Formulation Demonstrates Highly Potent Silencing of TTR mRNA in Rodents and NHPs
Rodents
LNP11-siTTR (mg/kg)PBS
0.0
0.2
0.4
0.6
0.8
1.0
TTR
/GA
PDH
mR
NA
Lev
elR
elat
ive
to P
BS
1.2
0.01 0.03
ED50 <0.01 mg/kg
***
***
0.1
***
A
(A) Dose-response for rodent TTR siRNA formulated in new LNP in rats. Groups of animals (n=4/group) were intravenously administered 0.01, 0.03, or 0.1 mg/kg rodent-siTTR via a 15-minute IV infusion. Forty-eight hours later, rats were euthanized and livers harvested. TTR and GAPDH mRNA levels were measured from liver lysates using the Quantigene bDNA assay. The ratio of TTR to GAPDH mRNA levels was calculated for each animal. Group means were determined, normalized to the PBS control group, and then plotted. Error bars represent standard deviations. (***p < 0.001, One-way ANOVA with Dunn’s post-hoc test).
LNP11-siTTR (mg/kg)PBS
0.0
0.2
0.4
0.6
0.8
1.0
TTR
/GA
PDH
mR
NA
Lev
elR
elat
ive
to P
BS
1.2
0.03 0.1
NHPs
ED50 <0.03 mg/kg
***
***
0.3***
B
(B) Dose-response for ALN-TTR02 formulated in new LNP in non-human primate. Groups of animals (n=3/group) were intravenously administered 0.3, 0.1, or 0.03 mg/kg ALN-TTR02 via a 15-minute IV infusion. Forty-eight hours later, liver biopsy from all animals were collected. TTR and GAPDH mRNA levels were measured from liver lysates using the Quantigene bDNA assay. The ratio of TTR to GAPDH mRNA levels was calculated for each animal. Group means were determined, normalized to PBS control group, and then plotted. Error bars represent standard deviations. (***p< 0.001, one-way ANOVA, with Dunn’s post-hoc test).
Dose-response for rodent TTR siRNA in rats when redosed. To evaluate the efficacy of rodent TTR siRNA on TTR mRNA in the liver, when redosed, groups of animals (n=3/group) were administered a first dose on Day 1 at 1 mg/kg SNALP-siTTR, Control siRNA or PBS. On Day 10, animals were administered a second dose at 0.03, 0.1 or 0.3 mg/kg SNALP-siTTR, or 0.3 mg/kg Control siRNA. All doses were given via a 15-minute IV infusion. Forty-eight hours after dosing, rats were euthanized and livers harvested. TTR and GAPDH mRNA levels were measured from liver lysates using the Quantigene bDNA assay. The ratio of TTR to GAPDH mRNA levels was calculated for each animal. Group means were determined, normalized to the PBS control group, and then plotted. Error bars represent standard deviations. Percent suppression relative to PBS is indicated above each bar.
Fig 1. Rodent TTR siRNA Exhibits More Potent ED50 When Redosed
Rodent TTR Analog(mg/kg)
ControlsiRNA
(mg/kg)
0.0
0.2
0.4
0.6
TTR
/GA
PDH
mR
NA
(r
elat
ive
to P
BS)
0.8
1.0
1.2
PBS 3 0.1
ED50 = 0.3 mg/kg
***59%
***91% ***
96%
21%
5%
0.3 1.0 3.00.0
0.2
0.4
0.6
TTR
/GA
PDH
mR
NA
Lev
el
(rel
ativ
e to
PB
S)
0.8
1.0
1.2
PBS Control siRNA
1st dose on Day 1 (1 mg/kg) 2nd dose on Day 10 (mg/kg)