American Mineralogist, Volume 72, pages914-934, 1987 Sericite from the Silverton caldera,Colorado: Correlation among structure, composition, origin, and particle thickness DBNNTsD. EsnRL U.S. Geological Survey, Federal Center, Mail Stop 404, Denver, Colorado 80225, U.S.A. JIN SnoooN Institute ofGeological Sciences, Polish Academy ofSciences, 3l-002 Krak6w, Senacka 3, Poland MrNccnou LBn Department of Earth Sciences, CaseWestern Reserve University, Cleveland, Ohio 44106, U.S.A. P. H. N.conau* The Macaulay Institute for Soil Research, Craigiebuckler, Aberdeen AB9 2QJ, United Kingdom H. RoY Nonrnnop U.S. Geological Survey, Federal Center, Mail Stop 963, Denver, Colorado 80225, U.S.A. AssrRAcr "sericite" is a petrographic term used to indicate highly birefringent, fine-grained, mica- ceous material that is viewed under the optical microscope. Other analy"tical techniques, including X-ray diffraction (xno) analysis, transmission-electron microscopy (reu), and chemical analysis, reveal that sericite from the Silverton caldera is very fine grained muscovite or phengite, with a layer charge close to 1.0 equivalent per O,.(OH), for the micaceouslayers. The structure and chemistry of this sericite differ from that of coarser- grained micas, however, because the sericite particles are so thin that exposedbasal sur- faces comprise a significant proportion of the sample.The presence of thesesurfaces leads to swelling (expandability),to larger cation exchange capacities, and to smaller fixed cation contents in the structural formulae. These surfaceproperties correlate with the thickness of the clay particles parallel to c*, in agreement with the theory of interparticle difraction. Expandability also correlates with the Kubler index (thereby suggesting that this "crystal- linity" index is a function of particle thickness), with an intensity ratio (Ir), and with the wave number of an 824-834 cm ' infrared absorption band. The amount of octahedral Fe + Mg can be estimated from the wave number of a 528-540 cm ' infrared absorption band. Based on xno analysis and computer modeling, the sericites are classifiedas R > 3, mixed-layer illite/smectites that rangein expandability from >4o/o to <l4o/o.The thickness of the expanding layers is related to interlayer chemistry and to relative humidity. Ex- pandabilities measuredby a conventional xno peak-position method are systematically smaller than expandabilities obtained by particle-thicknessmeasurements. Better agree- ment is obtained when xnp peak positions are corrected by deconvolution for a contri- bution from unarticulated illite particles. A new method for measuringexpandability uses xno peak-breadth measurements from very thin xno samplepreparationsand the Scherrer equation. Sericite from the Silverton calderaoccurs in fracturesthat cut a Tertiary volcanic com- plex and appears to have been formed by the hydrothermal alteration of fault gouge. K-Ar isotopic ages and oxygen-isotope geothermometryindicate that sericite formed during two hydrothermal eventsthat involved heated meteoric water. It formed at about 180"C during a2l-Maevent and at about 320'C during a l3-Ma event. Sericitecrystal chemistry roughly reflectstemperature of formation: the younger, higher-temperaturesericiteshave thicker micaceous particles,which meansthat they are less expandable, contain more fixed cations per formula unit, and have smaller cation-exchange capacities, and they have larger 2Mr/ lM polytype ratios. * Current address: STATOIL, Post Boks N4001, Stavanger, Norway. 0003-004x/87109 I 0-09 I 4$02.00 9r4
Transcript
American Mineralogist, Volume 72, pages 914-934, 1987
Sericite from the Silverton caldera, Colorado: Correlation amongstructure, composition, origin, and particle thickness
DBNNTs D. EsnRLU.S. Geological Survey, Federal Center, Mail Stop 404, Denver, Colorado 80225, U.S.A.
JIN SnoooNInstitute ofGeological Sciences, Polish Academy ofSciences, 3l-002 Krak6w, Senacka 3, Poland
MrNccnou LBnDepartment of Earth Sciences, Case Western Reserve University, Cleveland, Ohio 44106, U.S.A.
P. H. N.conau*The Macaulay Institute for Soil Research, Craigiebuckler, Aberdeen AB9 2QJ, United Kingdom
H. RoY NonrnnopU.S. Geological Survey, Federal Center, Mail Stop 963, Denver, Colorado 80225, U.S.A.
AssrRAcr
"sericite" is a petrographic term used to indicate highly birefringent, fine-grained, mica-ceous material that is viewed under the optical microscope. Other analy"tical techniques,including X-ray diffraction (xno) analysis, transmission-electron microscopy (reu), andchemical analysis, reveal that sericite from the Silverton caldera is very fine grainedmuscovite or phengite, with a layer charge close to 1.0 equivalent per O,.(OH), for themicaceous layers. The structure and chemistry of this sericite differ from that of coarser-grained micas, however, because the sericite particles are so thin that exposed basal sur-faces comprise a significant proportion of the sample. The presence of these surfaces leadsto swelling (expandability), to larger cation exchange capacities, and to smaller fixed cationcontents in the structural formulae. These surface properties correlate with the thicknessof the clay particles parallel to c*, in agreement with the theory of interparticle difraction.Expandability also correlates with the Kubler index (thereby suggesting that this "crystal-linity" index is a function of particle thickness), with an intensity ratio (Ir), and with thewave number of an 824-834 cm ' infrared absorption band. The amount of octahedralFe + Mg can be estimated from the wave number of a 528-540 cm ' infrared absorptionband.
Based on xno analysis and computer modeling, the sericites are classified as R > 3,mixed-layer illite/smectites that range in expandability from >4o/o to <l4o/o. The thicknessof the expanding layers is related to interlayer chemistry and to relative humidity. Ex-pandabilities measured by a conventional xno peak-position method are systematicallysmaller than expandabilities obtained by particle-thickness measurements. Better agree-ment is obtained when xnp peak positions are corrected by deconvolution for a contri-bution from unarticulated illite particles. A new method for measuring expandability usesxno peak-breadth measurements from very thin xno sample preparations and the Scherrerequation.
Sericite from the Silverton caldera occurs in fractures that cut a Tertiary volcanic com-plex and appears to have been formed by the hydrothermal alteration of fault gouge. K-Arisotopic ages and oxygen-isotope geothermometry indicate that sericite formed during twohydrothermal events that involved heated meteoric water. It formed at about 180"C duringa2l-Maevent and at about 320'C during a l3-Ma event. Sericite crystal chemistry roughlyreflects temperature of formation: the younger, higher-temperature sericites have thickermicaceous particles, which means that they are less expandable, contain more fixed cationsper formula unit, and have smaller cation-exchange capacities, and they have larger 2Mr/lM polytype ratios.
* Current address: STATOIL, Post Boks N4001, Stavanger, Norway.
0003-004x/87109 I 0-09 I 4$02.00 9r4
EBERL ET AL.: SERICITE FROM SILVERTON CALDERA. COLORADO 9 1 5
INrnolucrroN
"Sericite" is a petrographic term used to indicate highlybirefringent, fine-grained, micaceous material that isviewed under the optical microscope. Sericite is one ofthe most common alteration products found in rocks sur-rounding hydrothermal ore deposits; it is, for example,characteristic of the phyllic zone of alteration (quartz-sericite-pyrite assemblage) described by Lowell and Guil-bert (1970) for porphyry copper deposits. Because ofthefine grain size of sericite, little can be learned from ex-amination with the petrographic microscope other thanits mode of occurrence. However, other techniques suchas X-ray diffraction (xno) and microprobe analysis haveindicated that sericites have diverse structures and chem-istries (Bonorino, 1959; Shirozu and Higashi, 1972;LeBel, 197 9; Hendry, l 98 l ; Nicot, l 98 l ; Meunier and Velde,1982; Omelyanenko et al., 1982; Cathelineau, 1983;Beaufort and Meunier, 1983; Horton, 1983, 1985; Parryet al., 1984). Generally, these studies have described ser-icites as being composed of muscovite, phengite, illite,hydromica, or mixed-layer illite/smectite (I/S), with fixedinterlayer cation contents that usually are less than thestructural limit of 1.0 equivalent per O,o(OH)r.
This paper is an attempt to describe and to understandin detail the mineralogy and the origin of a suite of almostpure sericites that were collected from fractures in hydro-thermally altered volcanic rocks in the vicinity of theSilverton caldera in the western San Juan Mountains ofColorado, U.S.A. It was hoped that such a character-ization would aid in the development of general, crystal-chemical relations and identification techniques that canbe used in future studies to unravel the geologic historyof hydrothermal deposits that contain sericite.
Gpolocrc sETTTNG
Samples were collected within and around the Silver-ton caldera, between the towns of Silverton and Ouray,Colorado. The Silverton caldera is one of several similarvolcanic structures of Tertiary age in the San Juan vol-canic field (Lipman et al., 1973).It is linked by the Eurekagraben to the neighboring Lake City caldera (Fig. l). Lee-dy (1971), who mapped rock alteration in the Silvertoncaldera, discovered that its northern part has mineral zo-nation patterns in the country rock that are similar tothose described previously for porphyry copper deposits:pervasive phyllic alteration in the Red Mountain district,surrounded by propylitic alteration. The altered rocks areflows and tuffs of andesitic and rhyodacitic compositionbelonging to the Oligocene Silverton volcanic group. Ma-jor fracture zones usually have been altered hydrother-mally. Sometimes the fracture zones contain gold-silverore bodies or barren quartz veins; most commonly, how-ever, they are filled with clays, such as the fractures sam-pled for this study. All of the fractures that were sampledlie outside the phyllic zone, as was described for the coun-try rock, and within the zone ofpervasive propylitic al-teration. Most of the samples were collected from road
cuts; some were collected from abandoned mines. Mostof the fractures were a few centimeters wide, but samplesRM35A, RM35C, and RM35D came from an alteredzone several meters wide. All samples came from withinthe Silverton caldera, or from the system offractures thatborders it, except for samples ARI and ARIR, whichwere collected from the Eureka graben. Samples labeledLF came from an alteration zone associated with a silverdeposit at the Longfellow mine, which is located at RedMountain Pass. Clays from the fractures appear (on site)to have been formed by alteration of fault gouge.
Mrrnoos AND MATERTALS
AII samples were, in their natural state, wet, plastic clays thatsometimes contained hard-rock fragments. They were stored wetin plastic bags. In the laboratory, they were disaggregated byshaking in distilled water for about I h. The samples were wet-sieved to separate out the >420-pm and 420-40-pm size frac-tions. The 40-1O-pm, l0-2-pm, and <2-pm fractions were col-lected by sedimentation (Jackson, 1975).
Most of the samples were colored beige or brown in theirnatural state. White, or almost white material was produced fromthe <2-pm fraction by applying routine Na-acetate buffer plusNa-dithionite treatment, followed by lN NaCl exchange (Jack-son, 1975). Excess electrolyte was removed by dialysis. Samplesthen were checked for impurities by xno, and monomineralicsamples were analyzed for major elements by X-ray fluorescencespectroscopy (xnr; Taggart et al., 1981;A. J. Bartel, K. Stewart,and J. Taggart, analysts), and for F by selective-ion electrode.The <2-pm fractions also were saturated with Sr by washingthem twice with 0.lNSrClr; the first washing took place over-night. These samples were cleaned of electrolyte by four wash-ings in distilled water, and then were analyzed for K, Na, andSr by atomic absorption spectroscopy (le.s; Van Loon and Par-issis, 1969; D. D. Eberl, analyst).
Precision ofthe xnr analyses was checked against the NationalBureau of Standards standard clays 97 and 98, and was foundto be satisfactory for all elements except Na (<50/o difference forA1, Fe, K, Si, Ti; < 100/o difference for Mg). xnr analyses of du-plicate samples differed by no more than 2-30/0. The liO anal-yses by xRF were checked by ees. Structural formulae were cal-culated from the analyses using a model for the unit cell basedon O,o(OH)r. ers data were used for NarO and SrO; xnr datawere used for the other oxides. The calculation excluded TiO,from the structural formulae, because xno indicated the presenceofdiscrete anatase. CaO also was neglected, because it was pres-ent in such small quantities. A1l the formulae gave satisfactoryoctahedral occupancies (1.97-2.00), except for sample RM3(1.89), which was determined by xnn to contain discrete quartz,and sample ARlR (1.94), which was determined by xRD to con-tain discrete chlorite.
xno analysis was performed with a Siemensl D-500 automat-ed diffraction system using a Cu tube, a graphite monochro-mator, and, unless noted otherwise, 1'divergence and receivingslits, 0.02'2d steps, and counting times of I s per step for ori-ented preparations, and 20 s per step for random preparations.xno peak positions were corrected by external calibration againstNational Bureau of Standards standard reference materials 675
t The use of brand names is for identification purposes onlyand does not constitute endorsement by the U.S. Geological Sur-vey.
9 1 6 EBERL ET AL.: SERICITE FROM SILVERTON CALDERA, COLORADO
0 50 Klvr t r l l l
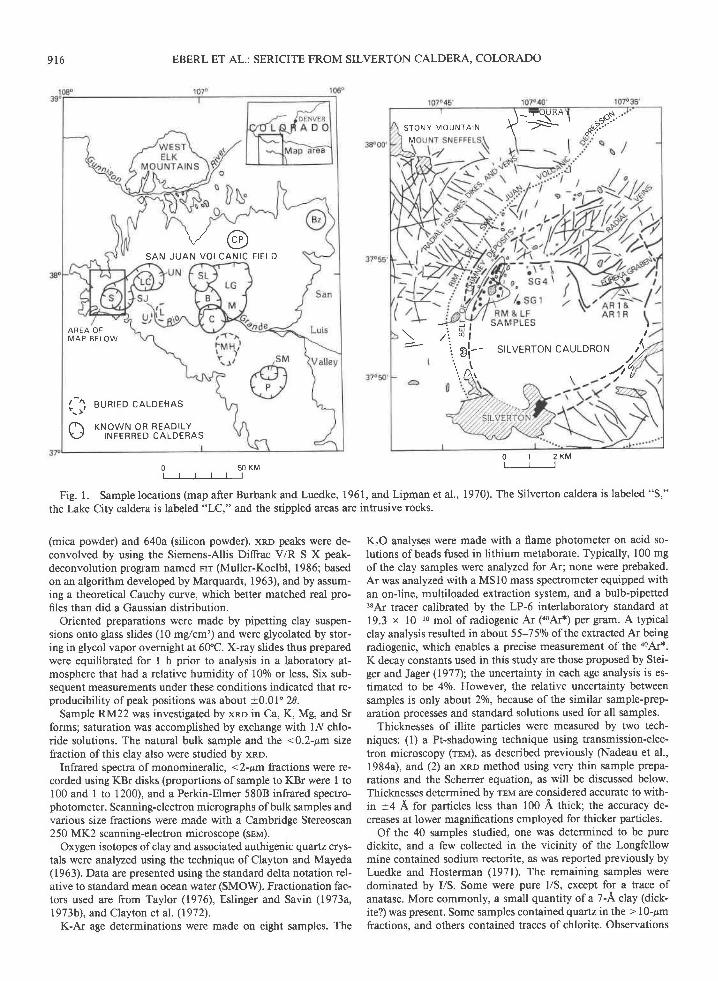
Fig. l. Sample locations (map after Burbank and Luedke, 1961, and Lipman et al., 1970). The Silverton caldera is labeled "S,"
the Lake City caldera is labeled "LC," and the stippled areas are intrusive rocks.
O 1 2 K M
(mica powder) and 640a (silicon powder). xno peaks were de-convolved by using the Siemens-Allis Diffrac V/R S X peak-deconvolution program named rrr (Muller-Koelbl, 1986; basedon an algorithm developed by Marquardt, 1963), and by assum-ing a theoretical Cauchy curve, which better matched real pro-files than did a Gaussian distribution.
Oriented preparations were made by pipetting clay suspen-sions onto glass slides (10 mg/cm'?) and were glycolated by stor-ing in glycol vapor overnight at 60"C. X-ray slides thus preparedwere equilibrated for I h prior to analysis in a laboratory at-mosphere that had a relative humidity of 100/o or less. Six sub-sequent measurements under these conditions indicated that re-producibility of peak positions was about +0.01" 20.
Sample RM22 was investigated by xno in Ca, K, Mg, and Srforms; saturation was accomplished by exchange with lN chlo-ride solutions. The natural bulk sample and the <0.2-pm sizefraction ofthis clay also were studied by xno.
Infrared spectra of monomineralic, <2-pm fractions were re-corded using KBr disks (proportions of sample to KBr were I to100 and 1 to 1200), and a Perkin-Elmer 580B infrared spectro-photometer. Scanning-electron micrographs of bulk samples andvarious size fractions were made with a Cambridge Stereoscan250 N IK2 scanning-electron microscope (snv).
Oxygen isotopes ofclay and associated authigenic quartz crys-tals were aralyzed using the technique of Clayton and Mayeda(1963). Data are presented using the standard delta notation rel-ative to standard mean ocean water (SMOW). Fractionation fac-tors used are from Taylor (1976), Eslinger and Savin (1973a,197 3b), and Clayton et al. (197 2).
K-Ar age determinations were made on eight samples. The
KrO analyses were made with a flame photometer on acid so-lutions of beads fused in lithium metaborate. Typically, 100 mgof the clay samples were analyzed for Ar; none were prebaked.Ar was analyzed with a MSl0 mass spectrometer equipped withan on-line, multiloaded extraction system, and a bulb-pipetted36,{r tracer calibrated by the LP-6 interlaboratory standard at19.3 x 10 '0 mol of radiogenic Ar (aoAr*) per gram. A typicalclay analysis resulted in about 55-7 5o/o ofthe extracted Ar beingradiogenic, which enables a precise measurement of the 40Ar*.
K decay constants used in this $tudy are those proposed by Stei-ger and Jager (1977); the uncertainty in each age analysis is es-timated to be 4o/0. However, the relative uncertainty betweensamples is only about 2010, because of the similar sample-prep-aration processes and standard solutions used for all samples.
Thicknesses of illite particles were measured by two tech-niques: (l) a Pt-shadowing technique using transmission-elec-tron microscopy (rrv), as described previously (Nadeau et al.,1984a), and (2) an xno method using very thin sample prepa-rations and the Scherrer equation, as will be discussed below.Thicknesses determined by rEM are considered accurate to with-in +4 A for particles less than 100 A thich the accuracy de-creases at lower magnifications employed for thicker particles.
Of the 40 samples studied, one was determined to be puredickite, and a few collected in the vicinity of the I-ongfellowmine contained sodium rectorite, as was reported previously byLuedke and Hosterman (1971). The remaining samples weredominated by I/S. Some were pure I/S, except for a trace ofanatase. More commonly, a small quantity of a 7-A clay (dick-ite?) was present. Some samples contained quartz in the > lO-pmfractions, and others contained traces of chlorite. Observations
\./ r";\" f--/
SAN JUAN VOLCANIC F IELD
A R E A O FM A P B E L O W
I 1 eunreo CALDERAS
A r towt l oR READTLY\J INFERRED CALDERAS
' \_-u\uKA \ .5$-. .
sroNY MouNrAi- Y ;>-\
t *".??.Y
' < J I J A l Y l r L c o
\ 7 t ' 3 iI
> ' i ; i- srLVERroN .AULDR.N ,iiA . .47
EBERL ET AL.: SERICITE FROM SILVERTON CALDERA, COLORADO 9l'r
AR1AR1 RLF7LF1 ORM3RM4RM5RM6RM8R M 1 1R M 1 2RM13RM21RM22RM25RM28RMSORM31RM33RM35ARM35CRM35DSG1SG4
TneLe 1. Miscellaneous properties ol the samples
ColorSampfe (<2 pm)
Accessoryminerals* Polytypes'
2 i / \ > 1 M + R1M > 2M11 M + RN A1 M + 2 M , + R1M:> 2M, + RN.A.N.A.1 M > 2 M j + RN.A.N.A.1 M > 2 M 1 + RN.A.1 M > 2 M 1 + H
1 M > 2 M 1 + R1 MN,A.1 M + R' I M + R
1 M + R1 M + R2M1 > 1M2M'
'Determined by xRD of bulk samples; R: random rotations of 60 and120'; N.A. : not analyzed-
with the sEM indicated idiomorphic quartz crystals intergrownwith sericite crystals. White samples contained pyrite, whereasbeige and brown samples contained jarosite, and sometimes goe-thite, lepidocrocite, or gypsum. The purest I/S (Table l) wereselected for further analysis. A <2-pm-grain-size separation re-moved quartz and dickite, and a sodium acetate buffer plusdithionite treatm€nt removed sulfate and iron hydroxides.
Snnrcrrr STRUCTURE
Structure of the expanding interlayers under variousconditions
xRD patterns of natural, air-dry, bulk, oriented prepa-rations had a series of basal reflections of varying width,an indication that the sericites are mixedlayered (e.g.,Fig. 2, Natural). Peak positions and intensities changedsubstantially after ethylene glycol solvation, indicating thepresence of expandable layers (e.g., Fig. 3, Natural). Nat-ural samples were identified as R > 3 ordered, mixed-layer I/S using the criteria ofSrodori (1984).
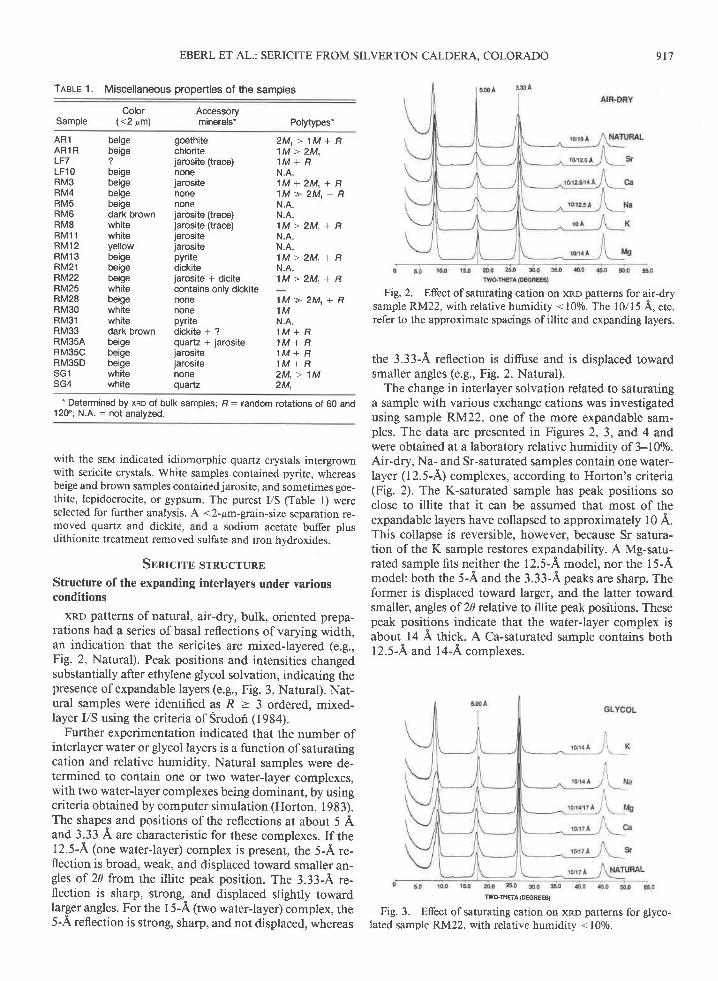
Further experimentation indicated that the number ofinterlayer water or glycol layers is a function ofsaturatingcation and relative humidity. Natural samples were de-termined to contain one or two water-layer complexes,with two waterJayer complexes being dominant, by usingcriteria obtained by computer simulation (Horton, 1983).The shapes and positions ofthe reflections at about 5 Aand 3.33 A are characteristic for these complexes. If the12.5-A (one water-layer) complex is present, the 5-A re-flection is broad, weak, and displaced toward smaller an-gles of 2d from the illite peak position. The 3.33-A re-flection is sharp, strong, and displaced slightly towardlarger angles. For the l5-A (two water-layer) complex, the5-A reflection is strong, sharp, and not displaced, whereas
Fig. 2. Efect of saturating cation on xRD patterns for air-drysample RM22, with relative humidity < 1006. The 10/15 A, etc.refer to the approximate spacings of illite and expanding layers.
the 3.33-A reflection is diffuse and is displaced towardsmaller angles (e.g., Fig. 2, Natural).
The change in interlayer solvation related to saturatinga sample with various exchange cations was investigatedusing sample P.Nd22, one of the more expandable sam-ples. The data are presented in Figures 2,3, and 4 andwere obtained at a laboratory relative humidity of 3-l0o/0.Air-dry, Na- and Sr-saturated samples contain one water-Iayer (12.5-A) complexes, according to Horton's criteria(Fig. 2). The K-saturated sample has peak positions soclose to illite that it can be assumed that most of theexpandable layers have collapsed to approximately l0 A.This collapse is reversible, however, because Sr satura-tion of the K sample restores expandability. A Mg-satu-rated sample fits neither the 12.5-A model, nor the 15-Amodel: both the 5-A and the 3.33-A peaks are sharp. Theformer is displaced toward larger, and the latter towardsmaller, angles of 2d relative to illite peak positions. Thesepeak positions indicate that the water-layer complex isabout 14 A thick. A Ca-saturated sample contains both12.5-A and 14-A complexes.
IWOffETA (DEGREES)
Fig. 3. Effect ofsaturating cation on xRD patterns for glyco-lated sample RM22, with relative humidity < 1090.
9 1 8 EBERL ET AL.: SERICITE FROM SILVERTON CALDERA, COLORADO
17 .6
17.5
1 7
oUUG(9UeFUIF
3F
l7 .7
17.3
'7.9;,426.5 26.6 26J 26.8 26.9 27.0
TWO -THETA (DEGREES}
Fig. 4. A net constructed from the calculations in Table 2,on which have been plotted 20 xno peak positions found forsample RM22 saturated with various cations. Open circles arefor air-dried samples. Solid circles are for glycolated samples.
When glycolated (Fig. 3), the K- and Na-saturated sam-ples have similar xRD patterns. All their peaks shift inthe opposite direction from that expected for I/S; insteadthey fit a model for illite/vermiculite (I/V) interstratifi-cation (Fig. 4). However, the vermiculite layers must bethinnerthan 14 A, because the 2-A reflection near 45 20shifts toward larger angles after glycolation, and the 3.33-Areflection is displaced only slightly toward smaller angles.xRD patterns of glycolated Sr and Ca samples (dithionite-treated, <2-pm fractions) resemble those of the natural,bulk samples (Fig. 3); they are identified as R > 3, mixed-Iayer I/S (Srodofi, 1984). The glycolated Mg samples havepatterns that are intermediate between those of I/S andi/V, thereby suggesting a three-component 10/14/17-Lsystem.
The previously discussed information is summarizedin Figuie 4 by plotting the precise 20 positions ofthe 5-Aand 3.33-A peaks of sample RM22 onto a theoreticaldiagram used to determine illite contents and glycol spac-ings for Rl and R3 I/S. Arrows in Figure 4 show thedirections that the peaks will shift from the illite position,
given various thicknesses for the expandable layers. Sev-eral other sericite samples were studied similarly, andthey confirmed the findings for RM22.
The discovery of vermiculite-like spacings for expand-able layers in the Na sample was a surprise, because pre-
vious studies of Na clays having similar expandabilitieshave determined that they behave like I/S (e.g., Srodori,1984, Figs. I and 2). A few samples from the cited studywere re-run and found to be I/V. It is tentatively con-
cluded that differences in relative humidity betweenDenver, Colorado, U.S.A. (<1070), and Krak6w, Poland(>4oo/o), are responsible for these differences in spacingsfor the expanded layers. It was known that relative hu-midity affects the thickness of smectite-type interlayershaving two glycol-layer complexes (Srodofi, 1980), butthis is the first report of the transition from a two glycol-
layer to a one glycol-layer vermiculiteJike complex, inresponse to a decrease in relative humidity.
Expandability measurements by xno (conventional
method)
Precise measurements of expandability (percentage of
swelling interlayers) for I/S depend on knowing accurate-ly the thicknesses of the illite and the smectite layers. The
illite-layer spacings of K-micalike layers in mixed-layerclays have been determined to depend on chemical com-poritioo; they may vary from t0 A for illite to 9.85 A for
leucophyllite (Sokolova et al., 1978). The spacings of
smectite layers have been determined to depend on sat-uration cation, layer charge, and relative humidity (Sro-
dori, 1980); they may vary several tenths of an Angstrdmfor two glycolJayers.
The spacings of illite layers were determined for eightsamples by saturating the clays with K, heating them forI h at 250"C, and X-raying them in a cell at 00/o relativehumidity. IlliteJayer spacings then were calculated fromthe average spacings determined from measurements of
the positions of the 002 through 004 xnp reflections.Spacings for the eight samples varied from 9.967 to 10.000A, with a mean of 9.99 A, a value that was used in allsubsequent calculations. The same value was determinedby plotting the positions of the 002 and 003 reflectionsfor all glycolated Sr samples onto a figure similar to Fig-
ure 4 (see Fig. 2 in Srodo6, 1984), and then by extrapo-lating these plots to a pure illite end member having aninfinite crystallite thickness.
Glycol spacings and expandabilities were determinedby plotting peak positions for Sr-saturated samples ontoa graph similar to Figure 2 in Srodori (1984), but modi-neO to reflect a spacing for illite layers of 9.99 A, a crys-
tallite thickness of40 to 50 layers (close to infinitely thickwith respect to the X-ray beam), maximum R3 ordering,0.8 K per half-unit cell, and no octahedral Fe (Fig. 4).These calculations were made using the computer pro-gram NEwMoo (available from R. C. Reynolds, Depart-ment of Earth Sciences, Dartmouth College, Hanover,NH 03755, U.S.A.), which is a version of the computerprogram described by Reynolds (1980), but modified to
1 7
EBERL ET AL.: SERICITE FROM SILVERTON CALDERA, COLORADO
TneLe 2. Calculated xno peak positions for l/S (Cu( radiation)
include a faster algorithm so that thicker crystallites canbe calculated (Bethke and Reynolds, I 986). The calculat-ed 002 and 003 peak positions from which Figure 4 wasconstructed are given in Table 2. Thicknesses for the ex-panded layers determined from Figure 4 ranged from I 6.5A to tz.3 A, with a mean value of 16.8 A.
Expandabilities measured by this method are given inTable 3 in the column labeled "conventional." Expand-abilities are reported to one decimal place, rather thanrounded offto whole numbers, because the one-decimal-place numbers result in better correlation coefrcients dur-ing regression analysis and because they are reproducible.AIso, as will be discussed below, small differences in ex-pandability for I/S result from big diferences in particlethickness as clays become increasingly illitic. For exam-ple, a change from 3.00/o to 2.5o/o expandable is equivalentto a change in mean particle thickness of about 70 A.Representative patterns ofSr-saturated VS having a rangeofexpandabilities are given in Figure 5.
Sr was chosen as the standard saturating cation formeasuring expandabilities, because the structure of inter-layers saturated with Sr2* is less sensitive to changes inrelative humidity than are those saturated with mono-valent cations. Also, Sr saturation gives a better measureof cation-exchange capacity, because Sr2* is less subjectto replacement by hydronium ions during washing anddialysis than are monovalent cations (Schramm andKwak, 1980) and because Sr2+ is less subject to the for-mation of interlayer, monovalent hydroxide species thanare divalent cations of greater ionic potential. Ba has alower ionic potential than Sr2+, but this ion is toxic, andis difrcult to analyze by nl,s; therefore it was avoided.
Expandability measurements by rnu
Expandability also can be calculated from rnu data ifit is assumed that X-ray diffraction effects for I/S resultfrom interparticle diffraction (Nadeau et al., 1984a,1984b). This concept proposes that illite particles stack
TneLe 3. xRD data for sericites
Expandability methods (%)
ScherrerKublerindex
TEM* lr (mm) Hb*26.
peaK
Glycol@mprex
Sample (A)Conven- Decon- 17"
tional volved peak
AR1AR1 RLF7LF1 ORM3RM4RM5RM6RM8R M 1 1RM12R M 1 3RM21RM22RM28RM30RM31RM35ARM35CRM35DSG1SG4
S 0 l 0 O t 5 0 m . O 6 0 3 0 0 S 0 4 O 0 4 5 J 5 O 0 S s O
MGNf,A PEGREES)
50 10.0 150 D.0 Eo S.0 0.0 S.0 50 0 S5.0
Fig. 5. Examples of xro patterns for samples having a rangeofexpandabilities. (A) Patterns for glycolated, Sr-saturated sam-ples. (B) Pattems for air-dried, Na-sarurated samples. Humidity< l0o/0.
on top of each other on the xnp slide, absorbing waterand glycol on external, plarar a-b interfaces, therebyforming "smectite" layers when examined by xno. rer"limages of individual illite particles are given in Figure 6.A reru image of illite particles showing a stacked config-uration is presented in Srodori and Eberl (1984, Fig. 3);such a configuration is diagrammed in cross section onthe left side of Figure 7. According to this model, ex-pandability is related to mean illite-particle thicknessparallel to c* (Tm, in ingstrdms) according to
Expandability (o/o) = 1000/Tm. (l)
A more rigorous expression is Expandability (0/o) : 100/(n + l), where n is the number of illite interlayers in aparticle, and n : (Tm - 9.2)/9.99, assuming that theparticles end in tetrahedral sheets. The 9.2 is the thick-ness ofa 2:l layer (pyrophyllite spacing).
reu expandabilities for four samples (Table 3) havebeen calculated from mean particle-thickness measure-ments (Table 4). The reu expandabilities generally arelarger than those determined by the conventional xRDmethod. Previously, Nadeau (1985) determined that reupredicts 5 to l5ol0 more smectite layers than does xno forI/S that is less than 400/o expandable. This is an important
EBERL ET AL.: SERICITE FROM SILVERTON CALDERA, COLORADO
arltrra{
o.5 lrmlirftll
-
Fig. 6. rru images of fundamental illite particles for twosamples. The bars are 0.5 pm.
observation, because if true smectite interlayers existwithin illite particles, rEM would predict /ess expand-ability than xno.
Expandability measurements by xno peak deconvolution
The discrepancy in expandabilities between xno andrsrrr determinations can be explained by enlarging on theoriginal concept of interparticle diffraction. xno may givesmaller expandability measurements, because the pro-portion of swelling basal surfaces between illite particles,as measured by xno, does not necessarily correspond tothe proportion of total free basal surfaces, as measuredby rrrrr. Some illite particles may not articulate with otherillite particles (right side ofFig. 7), thereby contributingto composite xRD peaks that owe their 20 position to thecombined diffiaction effects of both I/S and thin, non-swelling illite (i.e., the discrete illite peak pulls the I/Speak to lower apparent expandabilities). This situation ismodeled in Figure 8 for sample RMll. The resultantprofile was calculated by mixing an I/S pattern (l0o/o ex-pandable) with an illite pattern (00/o expandable) in theproportion 5:1.
If some illite particles are disarticulated and do notinteract with adjacent particles, then the position of theI/S peak used above to measure expandabilities by theconventional procedure (Table 3) is incorrect, because ofthe effect of the discrete illite peak. To measure expand-ability accurately, the composite peak between l7' andl8' 2d needs to be deconvolved into its I/S componentand its illite component. This deconvolved expandabilityis the expandability that would be measured by xno with-out deconvolution if all the diffracting illite particles wereperfectly articulated. If the interparticle-diffraction con-cept is correct, this expandability should equal the ex-pandability measured by rrrur (and be related to particlethickness by Eq. l) and should correlate better with sur-face properties, such as cation-exchange capacity (CEC)and surface area.
One problem with deconvolving peaks between l5' and
EBERL ET AL.: SERICITE FROM SILVERTON CALDERA, COLORADO 92r
Tnele 4. rEM particle thickness measurements for sericites (par-allel to C, in Angstroms)
Sample
Note.'Tm = mean particle thickness, S.D. : standard deviation, L :largest observation, S: smallest observation, n: number of observations.
20' 20 is that I/S has either one or two peaks in thisregion, depending on expandability. Two distinct VS peaksare present when expandability equals 150/o; one I/S peakwith a high-angle shoulder is present when expandabilityequals 100/o; and only one peak is present when expand-ability equals 50/o (Fig. 4.l2in Reynolds, 1980). The strat-egy adopted was to deconvolve three peaks between l5oand 20" 20 frxing the spacing for the illite peak at thepreviously determined 002 value of 4.995 A 1tl .l Sl" ZeyIf the position of the less-intense I/S reflection was de-termined by deconvolution to be on the low-angle sideof the 002 illite peak, then deconvolution for these sam-ples was repeated, using a two-peak model. The 003 peakat about 26.6" could not be deconvolved accurately, be-cause reflections for I/S and illite are spaced too closely;therefore the nondeconvolved position of this peak incombination with the deconvolved 002 peak was used tomeasure expandabilities listed in Table 3.
For three out of four samples, expandabilities mea-sured by deconvolution better match those determinedby rrvr than do expandabilities determined by the con-ventional xno procedure. xRD patterns were calculatedfor one sample (RMl l) for both the conventional modeland the deconvolution model (2'to 50" 20),but the pro-files looked so similar that they could not be used todistinguish which model is correct at the present level ofanalysis.
Expandability measurements by the Scherrer equation
It should be possible to eliminate xno peak broadeningcaused by swelling by preparing an oriented xno samplethat is so thin that it is composed of a single plane ofindividual illite particles, rather than ofthe stacks ofilliteparticles diagrammed in Figure 7. Then xno peak breadthat half height is a function of the average thickness ofillite particles parallel to c*, once the breadth has beencorrected for machine broadening. Illite-particle thick-nesses (Tm) can be calculated from such measurementsby using the Scherrer equation, and expandabilities canbe calculated from Tm by using Equation L
The Scherrer equation (Klug and Alexander, 1974) is
Tm : KVB cos 0, (2)
where K is a constant that is equal to 0.91 (Brindley,1980), I is the wavelength of CuK" radiation (1.54181A), and B is the xno peak width at half height in radians(1' : 0.01745 radians). B was corrected for machine
Fig. 7. Schematic diagram showing illite particles (see Fig.6), each composed of many illite layers, aligned in oriented ag-gregates on an xRD slide. Interparticle diffraction causes diftac-tion effects for I/S in aggregates in which the particles are artic-ulated, and diffraction effects for nonexpanding illite whereparticles are not articulated. The xRD pattern is the summationof diffraction from these two types of scattering domains.
broadening (Brindley, 1980) using the National Bureauof Standards mica powder as a standard. A very thin layerof oriented sample was dispersed on an Al slide in anattempt to remove peak broadening caused by mixed lay-ering. An Al rather than a glass slide was used to avoid
1 5 1 6 1 7 1 8 19 20TWO-THETA (DEGREES)
Fig. 8. Experimental xno profile (top) for sample RMl l (gly-colated and Sr saturated) and the suggested two-component model(bottom). Model was calculated using a modified version of thecomputer program of Reynolds (1980).
interference in the xnp pattern from the amorphous glasshump.
Results found from X-raying progressively thinnerpreparations of sample RM30A (a recollection of sampleRM30) are given in Table 5. The table shows that ap-parent expandabilities measured by the conventionalmethod remain constant at about 5.60lo for the first threeconcentrations. Then the apparent expandabilities de-crease regularly with decreasing concentration until a sec-ond plateau is reached at 3.60/o expandable. The last threeconcentrations give enatic expandabilities. Deconvolvedexpandabilities, however, remain constant at abott 7 .7o/oexpandable throughout the concentration range, until aconcentration is reached at which the peaks no longer canbe deconvolved. This concentration corresponds to the3.60lo plateau in the apparent expandabilities mentionedpreviously. Expandabilities calculated by the Scherrerequation for clay concentrations at this plateau, using thebreadth ofthe 17'peak, average 7.4o/o, an expandabilitythat corresponds favorably to 7.7o/o found by deconvo-lution. The breadth ofthe 26" peak gives an average ex-pandability of6.30/o at this plateau. Intensity ratios (Ir, tobe discussed below) along this plateau are close to 1.0(1 .1 t o 1 .2 ) .
These experimental results are explained as follows.The first plateau in the apparent expandabilities corre-sponds to a situation in which the clay preparation isthicker than the mean defect-free distance parallel to c*in the stacks of illite particles that diffract as I/S crystal-lites. As the preparation becomes thinner than the de-fect-free distance, however, the proportion of discretelydiffracting illite particles increases, thereby giving lowerapparent expandabilities, until the preparation is so thinthat it diffracts as though it is a single layer ofillite par-ticles. The 20 angle found for this second plateau (17.71",Table 5) is that expected for nonexpanding, very thinillite, after its peak position has been corrected for a shiftfrom the infinitely thick illite crystal (17.757). The shift
is caused by an interaction between peak broadening, re-Iated to fine particle size, and a rise in low-angle X-rayintensity, related to the Lorentz-polaization factor. Thelast three apparent expandabilities are erratic, becauseX-ray intensities are so small for these very dilute prep-arations that peak positions cannot be determined accu-rately. The deconvolved expandabilities remain constant,because deconvolution removes peak shifts related to dif-fraction from discrete illite, as was discussed above. Peakscannot be deconvolved when the second plateau in ap-parent expandabilities is reached, because only one peak,that for pure illite, is present. The presence of nonex-panding illite in these preparations also is indicated byan Ir that is close to 1.0 (see below). Expandabilities de-termined by deconvolution are approximately equivalentto those determined by the Scherrer equation, as is to beexpected ifthe theory is correct. An exact correspondencein expandabilities measured by the two methods is notalways to be expected, however, because the position ofthe illite peak that was assumed to be constanr ar 17 .7 57"during the deconvolution routine actually will vary withillite particle thickness, as was discussed above.
Similar analyses of two other samples (samples SG4and RMl3) indicated that a concentration of 0.10 mglcm2 was good for determining expandabilities from theScherrer equation for this suite of sericites. Al slides hav-ing this concentration of Na-saturated clay were X-rayedair-dry in the laboratory atmosphere using 3o divergenceand receiving slits, and 0.02" 20 steps, with l0 or 20 s perstep. The results are reported in Table 3 for both the 17"and the 26 20 peaks.
Expandabilities measured by deconvolution, by theScherrer equation, and by rEM are compared with ex-pandabilities measured by the conventional method inFigure 9. The curves for the xno techniques are nearlycoincident, but the rEM curve differs. The rnu curve isbased on only four data points, and the thickness mea-surements used to construct the curve have large standard
o =*rl,"o*u=i'o*ort".rroi, *,
1o
Fig. 9. Relation between expandability (exp.) measured bythe conventional method and expandabilities measured by theScherrer and peak-deconvolution methods.
deviations (Table 4). Therefore, we are reluctant to applythe rBrvr data quantitatively and have not emphasizedthem in subsequent discussions. More ruvr data would berequired to solve the problem of which experimentaltechnique gives the more accurate expandabilities. Cor-relation coefficients (R) for the curves in Figure 9 rangefrom 0.78 to 0.89 for the xno techniques; R is 0.97 forthe rer4 curve.
The Scherrer equation is the simplest method for mea-suring expandabilities for sericites. Deconvolution pro-grams and programs for calculating mixed-layer claystructures are not required. In addition, it is not necessaryto know the thickness of the glycol complex, or to makeassumptions during deconvolution about the 20 angle ofthe discrete illite peak. The method requires neither atransmission-electron microscope, nor many measure-ments of a single sample to insure an accurate determi-nation of mean particle thickness. An intensity ratio (seebelow) close to 1.0 and the determination of similar ex-pandabilities from the breadths oftwo or more xno peaksindicate that the sample is thin enough to avoid peakbroadening related to swelling.
Relation between expandability and intensity ratio (Ir)
Although peak shifts are small and difficult to detectfor samples having very small expandabilities, traces ofexpandability can be detected by using the intensity ratio(Ir) introduced by Srodori (1984):
Ir:(001)/(003),,..d".d/(001)/(003)d""",. (3)
Qualitatively, the intensity ratios in Table 3 favor thepeak-deconvolution and the Scherrer equation methodsfor measuring expandabilities, because a sample that gave0o/o expandable by the conventional peak-position meth-od of measurement (sample ARI) has Ir > 1.0, therebyindicating that it is expandable, a result that agrees withthe deconvolution and the Scherrer methods.
A plot relating expandabilities, measured by the Scher-rer method (using the 27' peak), and intensity ratios isgiven in Figure 10. The equation given in the figure prob-ably is valid for expandabilities less than about 80/o and
923
I
I
y= - 18 .53+25.96x-7 ,88x2 +0.78x3 R=0.97
TNTENSTTY RAT|O (r0
Fig. l0. Relation between expandability and the intensity ra-tio (Ir).
for sericites having chemistries similar to those examinedin the present study. The theoretical end point, Ir: 1.0,expandability : 00/0, is included in the regression analysisand has been measured for the Kaube sericite (Srodoriand Eberl, 1984). Equations for the correlation betweenIr and expandabilities measured by using the breadth ofthe I 7" peak and by peak deconvolution are very similarto the equation given in Figure 10. The equation relatingIr to expandabilities measured by reu, however, is y :-10.2 + l l.3x - 1.5x'?, with R : 0.98.
Relation between expandability and rneasurementsby infrared (n) spectroscopy
Infrared data from Sr-saturated samples (Table 6 andFigs. ll and 12) indicate an approximate correlation(R : 0.82) between expandability, measured by the Scher-rer method (26'peak), and the absorption band that mi-grates between 826 and 833 wave numbers. Correlationcoefficients for expandabilities measured by the breadthofthe 17'peak and by deconvolution are R: 0.80 andR: 0.81, respectively. The revr data (three points) givethe equation y: 1873.5 - 2.25x, with R: 0.98.
Relation between expandability and the Kubler index
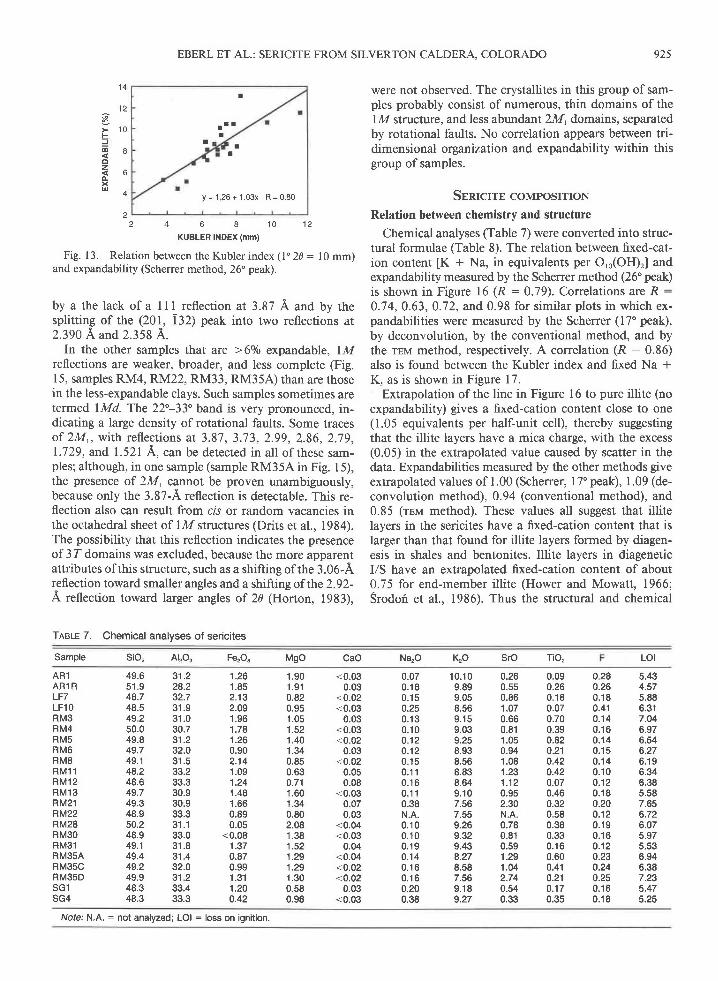
The Kubler index is the width at half height in milli-meters of the illite 001 xno reflection (see Kisch, 1983,for a review). Figure 2 indicates that the type ofsaturatingcation may influence this measurement. Kubler indicesfor <2 pm, Sr-saturated, air-dry sericites are listed inTable 3 and were calculated by assuming that l" 2d equalsl0 mm on the X-ray chart (see Kisch, 1983, Table 5-IV).The correlation between Kubler indices and expandabil-ities measured by the Scherrer method (26" peak) for ourexperimental system is shown in Figure 13 (R : 0.80).The relation is Expandability = 11o61"t index + 1.3. Ex-trapolation with this equation to 00/o expandable showsthat the relation must be nonlinear at very small expand-abilities. Other expandability methods used for measur-ing expandabilities for this correlation gave R : 0.70(Scherrer, 17" peak), 0.52 (deconvolution), 0.61 (conven-tional method), and 0.76 (rru method). A measurementthat is related to the Kubler index, Hb."' (the relative peakwidth at half height of the 001 illite peak with respect to
EBERL ET AL.: SERICITE FROM SILVERTON CALDERA, COLORADO
1 0
1 0s. 8
=. D aoz< 4rxu
0
F 1 2uit 1 0IF A
=IJJI
04O - cx -u.l
0
924 EBERL ET AL.: SERICITE FROM SILVERTON CALDERA. COLORADO
cu-1Fig. I 1. Sample infrared absorption spectra for two samples
having contrasting octahedral cations (see Table 8). Sample RMl2(top) and sample RM13 (bottom).
the 100 quartz reflection at 20.85"; see Kisch, 1983), alsois reported in Table 3.
Polytype analysis
Preliminary study of randomly oriented, natural sam-ples detected a range ofpolltypic varieties, including pureIM and 2M, polytypes, and mixtures of these poly"typeswith variable degrees of disorder. Data for different sizefractions (Fig. la) indicate that the (hk[) charucteristicsofthe sericites are independent ofgrain size, unlike illitesfrom shale that were determined to have an increase inthe 2M, component with increasing grain size (e.9., Sro-dof, and Eberl, 1984). In the sericites,2M, and lM claysare not physically separable by size, which implies thateither the two polytypes have the same grain size or theyexist as separate X-ray scattering domains within the samecrystalttes.
The only systematic variations detected with changinggrain size are a sharper rise in background at smallerangles and a more intense band between 22 and 33 20for the finer fractions (Fig. l4A). Computer simulation
TneLE 6. Infrared (rR) absorption data for sericites
I
T
!
I
II
I
y = 6 7 3 - 0 . 8 0 2 x R = 0 8 2
826 828 830 832 834
WAVE NUMBER (1/cm)
Fig. 12. Relation between expandability (Scherrer method,26 peak) and wave number for the infrared-absorption bandthat migrates between 826 and 833 cm '.
(Drits et al., 1984) has indicated that this band resultsexclusively from rotational stacking faults (+69" s1+ 120"). Thus, the density ofrotational faults increases inthe finer fractions of the sericites. In sample RM30, whichis a pure lM polytype, the appearance ofrotational stack-ing faults is negligible (Fig. laB).
For most samples polytypes were studied in the <2-prm fractions. The range ofvariation encountered is shownin Figure 15 and is listed in Table l Clays that arc <60/oexpandable (Scherrer method) are dominantly 2M, (e.g.,sample SG4 in Fig. l5). xnp reflectionsfor 2M, + lMmixtures are strong and sharp, indicating that the 2M'and lM domains must be relatively thick, although theheight of the 22'-33' 20 band sometimes indicates abun-dant rotational faults. Clays that arc >60/o expandable aredominated by lM structures. In two samples, perfect lMstructures were detected, as evidenced by the sharpnessofthe peaks and by the absence of the 22'-33'20 band(e.g., Fig. 14, sample RM30). Sample RM30 representsthe ?"variety ofillite (trans sites vacant in the octahedralsheet), as calculated by Drits et al. (1984), as is indicated
Note :d :d i f f use ; - : bandno t f ound ;O :qua r t z ; t r : t r ace ; sh : shou lde r ;< , : , >deno te re l a t i ve i n tens i t i e sa t9S5and9 l5 ;? : l acko tda ta .
T
l l I
II , t
I
Y = 1 2 6 + 1 . 0 3 x R = 0 . 8 0
2 4 6 I 1 0 1 2KUBLER INDEX (mm)
Fig. 13. Relation between the Kubler index (l'2d : 10 mm)and expandability (Scherrer method, 26 peak).
by a the lack of a I I I reflection at 3.87 A and by thesplitting of the (201, 132) peak into two reflections at2390 A and 2.358 A.
In the other samples that are >60/o expandable, lMreflections are weaker, broader, and less complete (Fig.15, samples RM4, RM22, RM33, RM35A) than are thosein the less-expandable clays. Such samples sometimes aretermed lMd. The 22-33" band is very pronounced, in-dicating a large density of rotational faults. Some tracesof 2M,, with reflections at 3.87, 3.73, 2.99, 2.86, 2.79,1.729, and 1.521 A, can be detected in all of these sam-ples; although, in one sample (sample RM35A in Fig. l5),the presence of 2M, cannot be proven unambiguously,because only the 3.87-A reflection is detectable. This re-flection also can result from cls or random vacancies inthe octahedral sheet of lM structures (Drits et al., 1984).The possibility that this reflection indicates the presenceof 37 domains was excluded, because the more apparentattributes of this structure, such as a shifting oftne 3.0e-Areflection toward smaller angles and a shifting of the 2.92-A reflection toward larger angles of 2d (Horton, 1983),
TABLE 7. Chemical analyses of sericites
925
were not observed. The crystallites in this group of sam-ples probably consist of numerous, thin domains of thelM structure, and less abundant 2M, domains, separatedby rotational faults. No correlation appears between tri-dimensional organization and expandability within thisgroup of samples.
Snnrcrro coMPosrrroN
Relation between chemistry and structure
Chemical analyses (Table 7) were converted into struc-tural formulae (Table 8). The relation between fixed-cat-ion content [K * Na, in equivalents per O,o(OHl] andexpandability measured by the Scherrer method (26'peak)is shown in Figure 16 (R : 0.79). Conelations are R :
0.74, 0.63, 0.72, and 0.98 for similar plots in which ex-pandabilities were measured by the Scherrer (17'peak),by deconvolution, by the conventional method, and bythe rBu method, respectively. A correlation (R : 0.86)also is found between the Kubler index and fixed Na +K, as is shown in Figure 17.
Extrapolation of the line in Figure 16 to pure illite (noexpandability) gives a fixed-cation content close to one(1.05 equivalents per half-unit cell), thereby suggestingthat the illite layers have a mica charge, with the excess(0.05) in the extrapolated value caused by scatter in thedata. Expandabilities measured by the other methods giveextrapolated values of 1.00 (Scherrer, I 7" peak), 1.09 (de-convolution method), 0.94 (conventional method), and0.85 (rrvr method). These values all suggest that illitelayers in the sericites have a fixed-cation content that islarger than that found for illite layers formed by diagen-esis in shales and bentonites. Illite layers in diageneticI/S have an extrapolated fixed-cation content of about0.75 for end-rnember illite (Hower and Mowatt. 1966:Srodori et al.. 1986).
.Itrus ihe structural and chemicai
EBERL ET AL.: SERICITE FROM SILVERTON CALDERA, COLORADO
1 4
1 2*> 1 0F
i az -< bxU ,
Sample sio, Al203 FerO" Mgo CaO Na"O KrO SrO Tio, LOI
/Vofei N.A. : not analyzed; LOI : loss on ignition.
926 EBERL ET AL.: SERICITE FROM SILVERTON CALDERA, COLORADO
18.0 ao 36.0 42.0
TWOTHETA (DEGREES)
Fig. 14. xRD patterns for randomly oriented sericite preparations having different grain-size fractions. (A) sample SGa; (B)
sampleRM30;Q:quar tz .
evidence indicates that the sericites may be, from theviewpoint of layer charge, very fine grained muscovite orphengite. (Phengite is a mica in which part of the layercharge is developed by Mg for Al substitution in the oc-tahedral sheet.) Their apparently low fixbd-cation contentin their structural formulae (0.66 to 0.88 equivalents inTable 8) is related to the presence of a large proportionof particle edges and, possibly, to a deficiency (<1.0) offixed cations in the micaceous interlayers.
The relation between cation-exchange capacity (CEC)and expandability (Scherrer method, 26 peak) for sericite
is evident in Tables 8 and 3 and in Figure 18 (R :0.87).
Plots of CEC (in meq Sr2* per 100-g oxide) vs. expand-abilities measwed by the Scherrer method (17'peak), bydeconvolution, and by the conventional method give R :
0.83, 0.73, and 0.73, respectively. The rsr'r method givesthe equation y : -3.3 + 1.5x, with R : 0.98. A goodcorrelation (R : 0.95) was found between CEC and theKubler index (Fig. l9).
No correlation was found between expandability andthe chemistry of the silicate layer (I"Al and/or 'IFe and
"'Mg), a correlation that has been reported for diagenetic
TWOTHETA @EGFEES)
EBERL ET AL.: SERICITE FROM SILVERTON CALDERA. COLORADO 927
Fig, 15. Sample xRD patterns for randomly oriented sericites (< 2 pm) that have a variety of polytypes. A: anatase; D =
dickite; Q : quartz. These phases are labeled in the sample patterns in which their lines are the strongest.
I/S formed both in shales (Hower et al., 1976) and inbentonites (Srodori et al., 1986). Also, the sericites areless phengitic than are diagenetic clays of similar expand-ability (0. I to 0.3 equivalents Fe + Mg in the sericites,vs. 0.3 to 0.5 in bentonites; Srodori et al., 1986).
Relation between chernistry and infrared (m) spectra
rR spectra of 20 pure samples (<2-pm fraction in theSr form) are given in Table 6. Samples are arranged in
this table according to the evolving nature ofthe absorp-tion bands in the 910 to 940 cm-lregion. Two represen-tative spectra are shown in Figure I l. All the spectra arecharacteristic of dioctahedral, aluminous clay mineralsthat are similar in composition to muscovite (Velde,1978); however, several subtle variations can be noted,the most pronounced of which is absorption between 910and 940 cm-1. In some samples, absorption in this regionis a single, sharp band at about 916 cm-'(Fig. l l); in
TeeLe 8. Structural formulae' and cation-exchange capacities (CEC)" for sericites
1 M > 2 M 1 + R
1 M > > 2 M 1 + R
1 M + 2 M 1 + R
Sample rvAl u'Mg 5r Charge
AR1AR1 RLF7LFlORM3RM4RM5RM6RM8R M 1 1RM12RM13RM21RM28RM30RM31RM35ARM35CRM35DsG1sG4
" Equivalents per half-unit cell.'. Cation-exchange capacity in meq Srr* per 100 g of fired clay
928 EBERL ET AL.: SERICITE FROM SILVERTON CALDERA, COLORADO
^ 1 0E=d "oz< Lcxu
2
E ^E v
xU -6 lzCEU 5
lo
Y 3
0.
l rI
I
y = 3 2 . 5 - 3 0 9 x R = 0 7 9
tf
I
y = 3 . + o x o 4 o R = 0 8 7
o %o'o* .*J,loo*ce crpr6r?9 t'"qrr oogi0'0
Fig. 18. Relation between cation-exchange capacity (CEC, inmeq per 100 g fired sample) and expandability (Scherrer method,26'peak).
who found nearly the same relation for a synthetic, Fe-free system, and by Hunziker et al. (1986), who foundthis relation for metamorphic illites from the Glarus Alps,Switzerland. The strong correlation reported by Hunzikeret al. (1986) between Mg + Fe and the position of the060 xno reflection, however, was not found for sericitesfrom the Silverton caldera.
Snnrcrrn rExruRES
Size separation performed without grinding yielded asmuch as 300/o by weight of the <2-prm size fraction. Nocorrelation was determined between this yield and ex-pandability. Illite crystallites in the bulk rock and in thevarious size fractions were determined by snvr to be com-posed ofaggregates ofvarious sizes; however, individualillite crystallites in the aggregates for a given sample wereall about the same size.
Crystallite size decreased with increasing expandabili-ty, as is illustrated in Figure 2l by samples SG4 (expand-ability of about 50/o) and RM35A (expandability of about100/o). Sample SG4 is composed of well-defined, flat crys-tallites that are l-5 pm in diameter and are up to 1000A thict<. These crystallites most commonly occur in par-
allel aggregates, but no preferred orientation ofthese ag-gregates in the rock was observed. Well-developed hklfaces are rare. Sample RM35A is composed of crystallites<2 pm in diameter and <500 A ttrict. Typically, the
Fig. I 9. Relation between cation-exchange capacity (CEC, inmeq per 100 g fired sample) and Kubler index.
E> 8F
J
. D A
oz< 4rxu ^
0
'10i
v d
xu2 0
;! coY 2
0
6 o . 7 0 8 0 9 1 . 0
FIXED K + Na (eq per half-unit cell)
Fig. 16. Relation between fixed-cation content and expand-ability (Scherrer method, 26' peak).
other samples, this band becomes diffuse towards largerwave numbers, and a second band appears at about 933cm '. This change in the 910 to 940 cm-l region is ac-companied by (1) a slight shift in the OH stretching vi-bration, from 3627 to 3634 cm '; (2) the appearance ofa band at725 cm ' and a shoulder at 885 cm ', whichappear simultaneously with the 935 cm-' band and grad-ually increase in intensity; (3) an increase in the depth ofthe valley between the 915- and 830-cm 'bands; (4) anincrease in intensity for the 805-cm ' band; (5) a changein the intensity ratio for the bands at 830 and 755 cm-'from 850 > 755, to 850 < 755; and (6) shifts in the Si-O bending vibrations, from 530 to 538, from 475 to 480,and from 420 to 417 cm-'.
All of the changes reported here can also be seen inspectra for synthetic micas lying on the muscovite-Mg-celadonite join (Velde, 1978); thus, these changes may berelated either to Al-for-Si substitution in the tetrahedralsheet, or to Mg-for-Al substitution in the octahedral sheet,or to a combination of the two. Our data (Tables 6 and8) indicate an approximate correlation between the de-scribed features and the sum of Fe + Mg in the octahe-dral sheet, and no correlation with tetrahedral Al. Themost sensitive measurement is the shift of the Si-O bend-ing vibration between 540-530 cm-'. The relation be-tween this wave number and octahedral Mg * Fe inequivalents per O,'(OH), is given in Figure 20. The effectof Mg and Fe content on this absorption band is identical.This conclusion is supported by Stubican and Roy (1961),
y = 3 0 3 2 - 2 9 8 4 x R = 0 8 6
I
I
0 7 0 . 8 0 9 1 0
FIXED K + Na (eq per hall-unit cell)
Fig. 17. Relation between fixed-cation content and the Ku-bler index.
1 l
61 '0 .
EBERL ET AL.: SERICITE FROM SILVERTON CALDERA. COLORADO 929
0 3 0
530 532 534 536 538 5
WAVE NUMBEB (1/cm)
Fig. 20. Relation between the wave number of the infrared-absorption band that migrates between 530 and 539 cm-r andthe sum of octahedral Fe + Mg [per O,o(OH)r].
crystallites are curved and stick to each other to formcurved surfaces on which individual particles are difficultto distinguish. Samples with expandabilities between thoseof samples SG4 and RM35A have intermediate texturesunder the snu. Thus, qualitatively, the thickness of illiteparticles seen with the srvr agrees with TEM data and fitsthe hypothesis that expandability is related to illite-par-ticle thickness.
The rnorphology of individual illite particles seen un-der the rBrvr is shown in Figure 6. Pt shadows, used tomeasure particle thicknesses parallel to c*, appear as brightareas on the left sides of the particles. Figure 6 ofersinsight into the reason why illitic material swells, where-as, for example, clay-size quartz does not. Illitic materialhas expandable layers because these particles have large,flat, electrically charged basal surfaces that can adsorbwater and/or organic molecules and can interact with ad-jacent, superimposed surfaces. Expandability can be de-tected by xRD, because the particles are so thin that thesesurfaces compose a significant proportion of the sample.
Snnrcrrn oRrcrNIt would be useful geologically to determine the con-
ditions that caused the subtly diverse mineralogies deter-mined for sericite. K-Ar ages and oxygen-isotope mea-surements were used to help solve this problem.
Time of formation
Previous work has shown that illitic material is a verygood K-Ar clock (Aronson and ke, 1986) and that theK-Ar technique can be used to date diagenetic events ina variety of geologic settings (Lee et al., 1985; Glasmann,1985; Lee, 1984; Aronson and Burtner, 1983; Law, 1983).The ages ofeight sericites from the Silverton caldera weredetermined by the K-Ar method; results are presented inTable 9. Two ages are represented: about 2l Ma for theRM samples and about 13 Ma for samples SG4 and ARl.In addition, one sample (sample RM28) had an inter-mediate age.
Previous work supports the K-Ar ages of the presentstudy. At least two ages for hydrothermal alteration were
Fig. 21. sen photographs of two sericites that represent arange of expandabilities. Sample RM35A (expandability of about100/o) is at the top, and sample SG4 (expandability of about 50/o)is at the bottom.
determined by Lipman et al. (1976) by dating a varietyof minerals in the Silverton caldera-Eureka graben area,both by K-Ar (sanidine and biotite phenocrysts) and byfission-track (zircon and apatite) methods. Their K-Arages centered around 11.3 and 22.6 Ma, with one inter-mediate age at 17 Ma; fission-track ages centered aroundl2.l and 2l.4Ma Casadevall and Ohmoto (1977) datedspecimens from the Sunnyside mine (located in the Sil-
930 EBERL ET AL.: SERICITE FROM SILVERTON CALDERA. COLORADO
Sample
TABLE 10. Oxygen-isotope data event that had little influence on the zircon fission-trackages, but that reset the apatite fission-track systematics.This interpretation also is supported by oxygen-isotopedata, to be discussed below.
Temperature of formation
Oxygen-isotope data (Table l0) indicate two groups ofd'8O values for sericite: the RM and LF samples havevalues that range between 0 and -t2.5qm (relative toSMOW), and the SG and AR samples have values thatare 2.5 to 8.57oo lighter. The data in Table l0 also indicatethat there may be two quartz populations: one with val-ues near }Vn, and the other with values from 8 lo ll%u,with two samples having intermediate values.
As discussed above, the two oxygen-isotope popula-tions of sericite (RM and SG-AR samples) are separatedin time of formation by 7 m.y. Assuming that the sericitesformed at isotopic equilibrium with the hydrothermalfluids, the difference in oxygen-isotope values for the twosets of samples requires either two isotopically differentformation waters or a large temperature difference at thetime of sericite formation. Temperatures and oxygen-iso-tope compositions of water were calculated from coge-netic quartz crystals, using the illite-water fractionationfactor from Eslinger and Savin (1973a) and the qtlartz-water fractionation factor from Clayton et al. (1972).
The diference in calculated oxygen-isotope composi-tions of water between samples SG4 and RM35A is small,about l%u (Table l1), and the water appears to have beenoxygen-shifted, meteoric water (see also Casadevall andOhmoto, 1977). Thus, the difference in isotopic compo-sition between the older and the younger sericites mostlikely is related to a difference in temperature at the timeof formation. The other sericite-quartz pairs listed in Ta-ble I I most likely are at isotopic disequilibrium, becausethe calculated temperatures for sericite formation are un-likely for I/S having the reported expandabilities (Hor-ton, 1985). These pairs most likely are mixtures of high-and low-temperature qvarlz or sericite or both.
Other minerals associated with the RM sericites alsoindicate that clays in the fractures have undergone twoperiods of hydrothermal alteration. An oxygen-isotopevalue for a dickite (sample RM25, Table l0), which oc-curs in veins and pods surrounded by sericite (sampleRM26), cannot be in isotopic equilibrium with any of the
verton caldera, about 10 km northeast of the town ofSilverton, between the locations of samples SG4 and ARl;see Fig. l) by the Rb-Sr method and determined an ageof 13 Ma for rocks that have large Rb/Sr weight ratios(16.6 Ma if rocks with small Rb/Sr ratios also are includ-ed).
The time of Silverton caldera formation was 27.5 Ma(Lipman et al., 1973), which was the time when fractureswere formed that would later be conduits for hydrother-mal fluids. The 2l-Ma hydrothermal event is approxi-mately the time of the formation of the Lake City caldera25 km to the northeast; of the intrusion of quartz latitedikes, plugs, and breccia pipes, with associated mineral-ization, in the Silverton caldera; and ofthe resurgence ofthe Red Mountain dome, the western margin of which islocated less than 1.5 km from the sampling sites for RM5and RM8. The l3-Ma hydrothermal event was a higher-temperature hydrothermal alteration associated withheated meteoric water that moved through the calderafrom south to north (Casadevall and Ohmoto, 1977).Thel7-Ma age probably results from a partial overprintingofthe older event by the younger event, an interpretationthat is supported by a set of samples from the Red Moun-tain resurgent dome (Lipman et al., 1976) in which zircongave old ages of 23 to 2l Ma and apatite gave consistentlyyounger ages of 12.9 to 12.3 Ma These data suggest thatthe Red Mountain area experienced a high-temperature
TABLE 11. lsotopic temperatures and water-of-formation compositions calculated fromquartz-illite pairs
Calculatedtempera-
A ture ofQuartz- formation
Sample illite fC)
Waterd'8O at
temperature Comments
RM35ASG4RM28RM3OAR1
6 64.6
1 0 43.0
13 .3
-6.0-7 .O
- 16 .03.5
-32.4
17832262
6651 6
21 -Ma lower-temperature event1 3-Ma higher-temperature eventmixture of 21- and 13-Ma sericitemixture of 21- and 13-Ma ouartzmixture of 21- and 13-Ma quartz
EBERL ET AL.: SERICITE FROM SILVERTON CALDERA, COLORADO 93r
RM sericites, based on the kaolinite-water fractionationfactor. Both the dickite and the disequilibrium q\artzmentioned before may have been formed by the younger,higher-temperature hydrothermal event that formed theSG and AR sericites. To test this possibility, the temper-ature of dickite formation was calculated using the ka-olinite fractionation factor from Taylor ( I 976), and a watercomposition calculated from sample SG4 (Table I l). Thecalculated temperature for dickite formation by thismethod is 312"C, which is similar to the temperature offormation of sample SG4 (322"C).
In addition, the sericite that has an intermediate age(sample RM28, Table 9) also has an intermediate d'EOvalue (Table l0) lying between that of the high- and low-temperature sericites. Thus, both stable- and radiogenic-isotope data support the conclusion that sample RM28is a mixture of the two generations of sericite.
Expandability measurements and polytype informa-tion support the conclusion drawn from the stable-iso-tope data that the temperature of the older alteration waslower than that of the younger alteration. The 20-Ma ser-icite (sample RM35A, 178"C, Table l1) is predominantlylM, with some random stacking (Table l), and has anexpandability of about 100/0. VS of this expandability wasreported to form in hydrothermally altered rocks at about175'C in Pliocene and Pleistocene sedimentary rocks fromthe Imperial Valley, California (Jennings and Thompson,1986), at about 185'C in borehole Elmore I in the SaltonSea geothermal field, California (McDowell and Elders,1980), and at about l95"C + l5'C (Fig. ll in Horton,1985) based on a compilation from several authors. Indiagenetically altered Carboniferous sedimentary rocksfrom central Poland, however, 100/o expandable I/S cor-responds to a temperature of about 110 to 120"C (Srodori,1984). The 13.8-Ma sericite (sample SG4, 322'C, Tablell)is2M, (Table l) and has an expandability of about 50/0.Its isotopic temperature agrees with a temperature rangeof 270 to 321"C inferred by Casadevall and Ohmoto(1977) for the formation of this generation of sericite atthe Sunnyside mine from measurements of the fillingtemperatures of fluid inclusions in quartz. Weaver andAssociates (1984), extrapolating the isotopic data of Es-linger and Savin (1973a,1973b), estimated that only the2M, polytype would exist in shale that had been heatedto 400"C. Mica-synthesis experiments have indicated thatthe following polytypes form with increasing temperature(Velde, 1965; Yoder and Eugster, 1955): lMd - lM -2Mr. This sequence also supports the present data.
According to a classification based on Kubler indices,all of the sericites except ARI (Table 3) fall into the "dia-genesis" grade of metamorphism (Kubler index > 4.2,assuming l'20 : l0 mm on the X-ray chart). In studiesof Alpine metamorphism, the diagenesis grade corre-sponds to temperatures <200'C (Frey, 1986). Based onthe isotopic temperatures discussed above, however, it isevident that the relation between temperature and Kublerindex for our hydrothermal sericites, especially for theyounger, higher-temperature suite, is not the same as that
found for the Alpine metamorphic illites. This lack ofcorrelation is not unexpected, however, because illites inshales may be a mixture of two phases: higher-tempera-ture detrital and lower-temperature diagenetic illite (Sro-dof and Eberl, 1984).
DrscussroNSericite from the Silverton caldera is composed of par-
ticles that contain muscovite or phengite layers. Its com-position and structure deviate significantly from those ofcoarser-grained micas, however, because its particle sizeis so small. The thinner the particles, the larger the pro-portion of exposed basal surfaces, the greater the CEC,the smaller the amount of fixed interlayer cations in thestructural formulae, and the larger the expandability.
Terminology for this material is confused, because itsname depends on how it is studied. The optical micro-scope reveals sericite, whereas the reu shows individualmica particles and xnp gives patterns for mixed-layer il-lite/smectite. Chemical analyses and expandability mea-surements (Scherrer method, Fig. l6) approximately givea full complement of fixed interlayer cations (1.0 equiv-alents per half-unit cell) for individual mica layers, anda lower fixed-cation content when particle edges are in-cluded in the structural formulae. Part of the terminologyproblem originates from the definition of the word "min-eral," which requires that crystal structure and chemicalcomposition be specified. This definition works well forlarger crystals, but for sericite a third parameter-particlethickness-influences the mineral's properties. Particleedges, which compose a significant proportion of themineral, do not have well-defined structure and compo-sition.
These hydrothermal illite/smectites differ from I/Sformed by diagenesis in shales and bentonites. The hy-drothermal clays show no correlation between 2:l layerchemistry and expandability, whereas I"Al increases asexpandability decreases in diagenetic clays. The hydro-thermal I/S have a larger, extrapolated, average contentof fixed interlayer cations per illite layer (0.85 to 1.0,depending on which expandability method is used) thando the diagenetic clays (0.75). Also, mixtures of hydro-thermal polytypes cannot be separated by grain size,whereas 2M, polytypes in shales frequently occur in acoarser size fraction than do lM and lMopolytypes. Thesedifferences between hydrothermal and diagenetic I/S maybe a function of mode of formation: precipitation fromsolution for the hydrothermal clays vs. alteration of pre-cursor smectite for the shales and bentonites.
Expandability measurements have proven to be usefulin understanding the geologic history ofrocks and sedi-ments. Expandability of I/S has been correlated with tem-perature (Perry and Hower, 1970; Hotrman and Hower,1979); with reaction time (Eberl and Hower, 1976); withthe charge density and chemistry of the original smectite(Srodori, 1976; Eberl et al., 1978); with the availabilityof K and with pH (Altaner et al., 1984; Srodofi and Eberl,1984; Eberl et al., 1986); with proximity to the thermal
932
effects of plutons, veins, and dikes (Nadeau and Reyn-olds, l98l; Horton, 1983, 1985; Lynch, 1985); with thevolume of subsurface water flow (Whitney and Northrop,1987); with the degree of leaching of pre-existing illite(Rimmer and Eberl, 1982; results of Chamley et al. sum-maized by Singer, 1984); and with the number of wettingand drying cycles experienced by smectite in the presenceof K (Eberl et al., 1986). Thus, accurate expandabilitymeasurements may be important for understanding thegeologic history ofdeposits that contain sericite.
Three xno methods for measuring the expandabilitiesof sericite were presented: the conventional method, thedeconvolution method, and the Scherrer method. TheScherrer method, which is the easiest method to apply,yields expandabilities that correlate best with other pa-rameters such as particle thickness, fixed-interlayer-cat-ion content, CEC, the Kubler index (thereby suggestingthat this "crystallinity" index is a funclion of illite-par-ticle thickness), the intensity ratio (Ir), and the wavenumber ofthe 824-834 cm ' infrared absorption band,especially when the breadth of the 26' peak is used.Therefore the Scherrer method (26" peak) may be themost precise xno method. The rBu method also gavevery good (although somewhat different) correlations.More reu measurements are needed to determine whichmethod is the more accurate.
Because expandability for sericite is a measure of meanparticle thickness (Eq. l), the expandability ofsericite inhydrothermal deposits could be a function of numerousfactors that can afect the growth of illite crystals parallelto c*. These factors could include the mechanism and therate of crystallization; the presence or absence of crystal-growth inhibitors and modifiers; the availability of nu-trient solutions; the availability of pore space; and thechemistry, structure, and solubility of precursor mate-rials, etc. The important petrologic question, therefore, isnot whether I/S of various expandabilities are thermo-dynamically stable, but, rather, what conditions give riseto the various particle-size distributions for illite?
Fluid-inclusion data for similar clays in the eastern SanJuan Mountains (Creede caldera) indicate that the mostimportant factor that influences expandability is temper-ature (Horton, 1985). This determination generally agreeswith our data, which indicate that the younger, higher-temperature sericites are the least expandable; however,an exact correlation between expandability and temper-ature cannot be made from the present data set.
Finally, one can speculate concerning the thermody-namic stability of sericites having a range of expandabil-ities. If expandability is simply a measure of mean par-ticle thickness, then, according to the traditional definitionof "mineral" that does not consider particle size, all ofthe mixedJayer I/S examined here is illite (or muscoviteor phengite, depending on how these terms are defined),as has been suggested previously by Nadeau et al. (1984a,1984b). An "ordered I/S" is an illite with a narrow par-ticle-size distribution; there is no smectite phase present,unless, for some applications, the edges of particles can
EBERL ET AL.: SERICITE FROM SILVERTON CALDERA, COLORADO
be considered to be a separate phase. (Values for the freeenergy of formation for sericite should be affected con-siderably by the proportion of these edges; see, for ex-ample, Page and Wenk, 1979.) From this viewpoint, I/Sof low expandability is neither a solid solution nor a mix-ture of phases (Garrels, 1984), but it is a single, thermo-dynamically stable phase that forms under a specific rangeof thermochemical conditions. Information concerningthis range of conditions, however, can be gained by ac-curately determining illite particle thickness (expandabil-itv).
AcrNowr-nocMENTs
This paper is dedicated to the memory ofour friend and colleague, RoyNorthrup.
We thank Barry Samuel for help during the early stages of the fieldwork and Eric Stenzel for help in the laboratory. The assistance of G.
Coulten-Bradley and T. Liebermann in helping to modify the computerprogram ofReynolds is gratefully acknowledged S. Altaner, V. A Drits,R Hall, D. Horton, W. T. Parry, R. Pollastro, and G. Whitney reviewedthe manuscript and offered helpful comments. J. M Tait helped with therEM measurements. Jan Srodorl acknowledges support from the USGS in1985 and from the Polish Academy ofSciences Program CPBP 05.03 inl 986 .
RnrnnnNcnsAltaner, S.P., Hower, J., Whitney, G, and Aronson, J. L. (1984) Model
for K-bentonite formation: Evidence from zoned K-bentonites in thedisturbed belt, Montana Geology, 12,412-425.
Aronson, J.L, and Burtner, RL. (1983) Mr dating of ill itic clays in
Jurassic Nugget Sandstone and timing of petroleum migration in Wy-oming Overthrust Belt: American Association of Petroleum GeologistsBul let in. 67.414
Aronson, J.L, and Lee, M. (1986) K./Ar systematics of bentonite andshale in a contact metamorphic zone, Cerrillos, New Mexico. Claysand Clay Minerals, 34, 483-487.
Beaufort, D., and Meunier, A. (1983) A petrographic study of phyllic
alteration superimposed on potassic alteration: The Silbert porphyry
deposit (Rhone, France). Economic Geology, 78, 1514-1527.Bethke, C.M., and Reynolds, R.C. (1986) Recursive method for deter-
mining frequency factors in interstratified clay diffraction calculations.Clays and Clay Minerals, 34,224-226.
Bonorino, F.G. (1959) Hydrothermal alteration in the Front Range min-eral belt, Colorado Geological Society of America Bulletin, 70, 5 3-90.
Brindley, G.W. ( I 980) Order-disorder in clay mineral structures. In G.W.Brindley and G. Brown, Eds., Crystal structures of clay minerals andtheir X-ray identification, p 249-303. Mineralogical Society, London
Burbank, W.S., and Luedke, R.G. (1961) Origin and evolution of ore andgangue-forming solutions, Srlverton caldera, Colorado. U.S GeologicalSurvey Professional Paper, 424-C, C7-Cll.
Casadevall, T., and Ohmoto, H. (1977) Sunnyside mine, Eureka miningdistrict, San Juan County, Colorado: Geochemistry of gold and basemetal ore deposition in a volcanic environment Economic Geology,72. 1285-1320.
Cathelineau, M (1983) Les min6raux phylliteux dans les grsements hy-drothermaux d'uranium. II. Distribution et 6volution cristallochimiquedes illites interstratifi6s, smectites et chlorites. Bullerin de Min6ralogie,106 ,553 -569
Clayton, R.N., and Mayeda, T.K. (1963) The use of bromine pentafluo-
ride in the extraction of oxygen from oxides and silicates for isotopicanalysis. Geochimica et Cosmochimica Acta, 27, 43-52.
Clayton, R.N, O'Neil, J.R., and Mayeda, T K (1972) Oxygen isotopeexchange between quartz and water. Journal ofGeophysical Research,77,3057-306't
Drils, V A., Plangon, A , Sakharov, B A., Besson, G , Tsipursky, S.I., andTchoubar, C (1984) Diffraction effects calculated for structural models
of K-saturated montmorillonite containing different types of defectsClay Minerals, 19, 541-561
Eberl, D D , and Hower, J. (1976) Kinetics of illite formation. GeologicalSociety of Amenca Bulletin, 87, 1326-1330.
Eberl, D, Whitney, G, and Khoury, H. (1978) Hydrothermal reactivityof smectite American Mineralogist, 63, 4Ol-409
Eberl, D D., Srodori, J , and Northrop, H.R. (1986) Potassium fixation insmectite by welting and drying In J.A. Davis and K.F. Hayes, Eds.,Geochemical processes at mineral surfaces. American Chemical SocietySymposium Series, 323, 296-326.
Eslinger, E.V., and Savin, S.M. (1973a) Mineralogy and oxygen-isotopegeothermometry of the hydrolhermally altered rocks of the Ohaki-Broadlands, New Zealand, geothermal area American Joumal ofSci-ence, 273, 240-267.
-(1973b) Oxygen-isotope geothermometry of the burial metamor-phism rocks ofthe Precambrian Belt Supergroup, Glacier National Park,Montana. Geological Society of America Bulletin, 84, 2549-2560
Frey, M. (1986) Very low-grade metamorphism of the Alps-An intro-duction Schweizerische Mineralogische und Petrographische Mittei-lungen, 66, l3-27.
Garrels, R M. (1984) Montmorillonite/illite stability diagrams Clays andClay Minerals, 32, 16l-166.
Glasmann, J R (1985) Smectite diagenesis in bentonites of the Shale WallMember of the Seabee Formation, North Slope, Alaska (abs.). Ameri-can Association of Petroleum Geologists Research Conference, Radio-genic isotopes and evolution of sedimentary basins, New Orleans, Lou-lslana.
Hendry, D.A.F. (198I) Chlorites, phengites, and siderites from the PrinceLyell ore deposit, Tasmania, and the origin of the deposit. EconomicGeology, 76, 285-303.
Hoffman, J., and Hower, J. (1979) Clay mineral assemblages as low grademetamorphic geothermometers: Application to thrust faulted disturbedbelt of Monrana, U S.A In P A Scholle and P.R Schluger, Eds., As-pecls of diagenesis. Society of Economic Paleontologists and Mineral-ogists Special Publication, 26, 55-79
Horton, D.G (1983) Argillic alteration associated with rhe Amethyst veinsystem, Creede mining district, Colorado Ph.D thesis, University ofIllinois. Urbana. Illinois.
- (l 985) Mixed-layer illite/smectite as a paleotemperature indicatorin the Amethyst vein system, Creede district, Colorado, USA. Contri-butions to Mineralogy and Petrology, 91, 17l-179
Hower, J , and Mowatt, T.C. (1966) The mineralogy of ill ites and mixed-layer illite-montmorillonites. American Mineralogist, 5 l, 825-854.
Hower, J., Eslinger, EV., Hower, M.8., and Perry, EA. (1976) Mecha-nism of burial metamorphism of argillaceous sediments: I Mineral-ogical and chemical evidence. Geological Society ofAmerica Bulletin,81. '725-737
Hunziker, J.C., Frey, M, Clauer, N., Dallmeyer, R.D, Friedrichsen, H.,Flehmig, W., Hochstrasser, K., Roggwiler, P., and Schwander, H (1986)The evolution of illite to muscovite: Mineralogical and isotopic dalafrom the Glarus Alps, Switzerland. Contributions to Mineralogy andPetrology, 92, 157-180.
Jackson, M.L. (l 975) Soil chemical analysis-advanced course. Publishedby the author, Madison, Wisconsrn
Jennings, S., and Thompson, G.R. (1986) Diagenesis ofPlio-Pleisrocenesediments of the Colorado River delta, southem Califomia. Joumal ofSedimentary Petrology, 56, 89-98
Kisch, H.J. (1983) Mineralogy and petrology ofburial diagenesis (burialmetamorphism) and incipient metamorphism in clastic rocks. In G.Larsen and G.V. Chilingar, Eds , Diagenesis in sediments and sedi-mentary rocks, Developments in Sedimentology 25B, p. 289-494. El-sevier. New York
Klug, H.P , and Alexander, L.E. (197 4) X-ray diffraction procedures. Wi-ley, New York.
Law, E (1983) Petrologic, geochronologic, and isotopic investigations ofthe diagenesis and hydrocarbon emplacement in the Muddy Sandstone,Powder River Basin. Ph.D. thesis, Case Western Reserve University,Cleveland. Ohio.
Le Bel, L (1979) Micas magmatiques e1 hydrothermaux dans I'environne-ment du porphyre cuprifEre de Cerro Verde-Santa Rosa, Perou. Bul-letin de Min6ralogie, 102, 35-41.
933
Lee, M ( I 984) Diagenesis of the Permian Rotligenedes Sandstone, NorthSea: K,/Ar, O l8/O 16, and petrologic evidence. Ph D. thesis, Case west-ern Reserve University, Cleveland, Ohio.
Lee, M., Aronson, J.L, and Savin, S.M. (1985) Mr dating of time ofgas emplacement in Rotliegendes Sandstone, Nethedands. AmericanAssociation of Petroleum Geologists Bulletin, 69, I 38 l- I 385.
Leedy, W P (l 97 l) Hydrothermal alteration of volcanic rocks in the RedMountains District of the San Juan Mountains, Colorado. Ph.D. thesis,State University of New York at Bufalo, Buffalo, New York
Lipman, P.W., Steven, T.A., and Mehnert, H.H. (1970) Volcanic historyofthe San Juan Mountains, Colorado, as indicated by potassium-argondating. Geological Society of America Bulletin, 8l, 2329-2352.
Lipman, P w , Steven, T A, Leudke, R.G., and Burbank, W.S (1973)Revised history of the San Juan, Uncompahgre, Silverton, and LakeCity calderas in the westem San Juan Mountains, Colorado. U.S. Geo-logical Suwey Joumal ofResearch, 1,627-642.
Lipman, P w , Fisher, F.S , Mehnert, H.H., Naeser, C.W., Luedke, R G.,and Steven, T A (1976) Multiple ages of mid-Tertiary mineralizationand alteration in the western San Juan Mountains, Colorado. EconomicGeo logy , T l , 571 -588 .
Lowell, J.D., and Guilbert, J.M. (1970) Lateral and vertical alteration-mineralization zoning in porphyry ore deposits. Economic Geology,65 .373 -408 .
Luedke, RG, and Hosterman, JW (1971) Clay minerals, Longfellowmine, San Juan County, Colorado U S. Geological Survey ProfessionalPaper 750-C, C104-Cl I 1
Lynch, L F, III (1985) The stoichiometry ofthe smectite to illite reactionin a contact metamorphic environment. Master's thesis, DartmouthCollege, Hanover, New Hampshire.
Marquardt, DM (1963) An algorithm for least-squares estimation ofnonlinear parameters. Journal ofthe Society for Industrial and AppliedMathematics, 11, 431-441.
McDowell, S D., and Elders, W A. (1980) Authigenic layer silicate min-erals in borehole Elmore l, Salton Sea geothermal field, California,USA Contributions to Mineralogy and Petrology, 7 4, 293-310.
Meunier, A, and Velde, B. (1982) Phengitization, sericitization and po-tassium-beidellite in a hydrothermally-altered granite Clay Minerals,r '7.285-299
Muller-Koelbl, G. (1986) Examples for the fit program. Siemens Appli-cation Note No 75, Siemens Energy & Automation, Inc., I ComputerDrive, Cherry Hill, N J 08034.
Nadeau, P H. ( I 985) The physical dimensions of fundamental clay par-ticles. Clay Minerals, 20, 499-514.
Nadeau, P.H., and Reynolds, R.C., Jr. (1981) Burial metamorphism inthe Mancos Shale. Clays and Clay Minerals, 29,249-259
Nadeau, P.H., Wilson, M.J., McHardy, W J., and Tait, J.M (1984a) In-terparticle diffraction: A new concept for interstratified clays. Clay Min-erals, 19,757-769
- (1984b) Interstratified clays as fundamental particles. Science, 225,923-925.
Nicot, E. (1981) Les phyllosilicates des terrains pr6cambriens du Nord-Ouest du Montana (U.S A.) dans la transition anchizone-6pizone Bul-letin de Min6ralogie, 104, 615-624.
Omelyanenko, B.T., Volovikova, I.M., Drits, Y.A, Zvyagin, B.B. An-dreev, O. V., and Sakharov, B.A. (1982) On the content of sericitenotion Izvestiya Akademii Nauk SSSR, Seriya Geologicheskaya no. 5,69-86
Page, R., and Wenk, H -R. (1979) Phyllosilicate alteration ofplagioclasestudied by transmission electron microscopy. Geology, 7, 393-397.
Parry, W.T., Ballantyne, J.M., and Jacobs, D.C. (1984) Geochemistry ofhydrothermal sericite from Roosevelt Hot Springs and the Tintic andSanta Rita porphyry copper systems. Economic Geology, 79,72-86.
Perry, E.A., and Hower, J. (1970) Burial diagenesis in Gulf Coast peliticsediments. Clays and Clay Minerals, 18, 165-177.
Reynolds, R C (1980) Interstratified clay minerals. In G.W. Bnndley andG Brown, Eds., Crystal structures of clay minerals and their X-rayidentification, p. 249-303, Mineralogical Society, London
Rimmer, S.M., and Eberl, D D. (1982) Origin of an underclay as revealedby vertical variations in mineralogy and chemistry. Clays and ClayMinerals. 30.422-430.
Schramm, L L., and Kwak, J C T. (1980) Application of ultrafiltration/
EBERL ET AL.: SERICITE FROM SILVERTON CALDERA, COLORADO
934 EBERL ET AL.: SERICITE FROM SILVERTON CALDERA, COLORADO
dialysis to the preparation of clay suspensions. Clays and Clay Min-erals. 28. 67-69.
Shirozu, H., and Higashi, S. (1972)X-ray examination of sericite mineralsassociated with the Kuroko deposits. Clay Science, 4,137-142.
Singer, A. (1984) The paleoclimatic interpretation of clay minerals insediments-A review. Earth-Science Reviews, 21, 251-293.
Sokolova, T.N., Sakharov, B.A., Drits, V.A., and Kremenetskaya, T.N.( I 978) Leucophyllite-montmorillonite mixedJayer minerals from theInder dome gypsum hat. Lithology and Mineral Resources, 13,722-| 5 5 .
Srodoi, J. (1976) Mixedlayer smectite/illites in the bentonites and ton-steins ofrhe Upper Silesian Coal Basin Prace Mineralogiczne,49, l-84.
- (1980) Precise identification of illite/smectite interstratificationsby X-ray powder diffraction. Clays and Clay Minerals, 28, 401-41 1.
- (1984) X-ray identification of illitic materials. Clays and Clay Min-erals.32.337-349.
Srodori, J., and Eberl, D.D. ( 1984) Illite. Mineralogical Society of AmericaReviews in Mineralogy, 495-544.
Srodori, J., Morgan, D.J., Eslinger, E.V., Eberl, D.D., and Karlinger, M.R.(1986) Chemistry of illite/smectite and end-member illite. Clays andClay Minerals, 34, 368-378.
Steiger, R.H., and Jager, E. (1977) Subcommission on geochronology:Convention on the use ofdecay constant in geo- and cosmochronology.Earth and Planetary Science Letters, 36,359-362.
Stubican, V., and Roy, R. (1961) Isomorphous substitution and the in-frared spectra oflayer lattice silicates American Mineralogist, 46, 32-5 1 .
Taggart,J.E., Lichte, F E., and Wahlberg, J.S. (1981) Methods of analysis
of samples using X-ray fluorescence and induction-coupled plasma
spectroscopy. U.S. Geological Survey Professional Paper 1250, 683-
687.Taylor, H.P., Jr. (1976) Oxygen and hydrogen isotope relationships in
hydrothermal mineral deposits. In H.L. Barnes, Ed', Geochemistry of
hydrothermal ore deposits, p.236-277. Wiley, New York.Van Loon. J.C.. and Parissis, C.M. (1969) Scheme of silicate analysis
based on the lithium metaborate fusion followed by atomic-absorption
spectrometry. The Analyst, 94, 1057-1062.Velde, B (1965) Phengite micas: Synthesis, stability, and natural occur-
rence. American Journal ofScience, 263, 886-913.-(1978) Infrared spectra of synthetic micas in the series muscovite-
MgAl celadonite. American Mineralogist, 63, 343-349'Weaver, C.E., and Associates. (1984) Shale-slate metamorphism in south-
ern Appalachians. Developments in Petrology, i0. Elsevier, New York.
Whitney, G., and Northrop, H.R. (1987) Diagenesis and fluid flow in the
San Juan Basin, New Mexico-Regional zonation in the mineralogy
and stable isotope composition of clay minerals in sandstone. Ameri-
can Journal of Science, 287 , 353-382.Yoder, H,S, and Eugster, H.P. (1955) Synthetic and natural muscovites.