Service Assessment U.S. Department of Commerce National Oceanic and Atmospheric Administration National Weather Service Silver Spring, MD April 1997 N A T I O N A L O C E A N I C A N D A T M O S P H E R I C A D M I N I S T R A T I O N U . S . D E P A R T M E N T O F C O M M E R C E July 5 –14, 1996
Transcript
Service Assessment
U.S. Department of CommerceNational Oceanic and Atmospheric AdministrationNational Weather ServiceSilver Spring, MD
AFOS Automation of Field Operations and ServicesAOC Aircraft Operations CenterASOS Automated Surface Observing SystemAST Atlantic Standard TimeAVN Aviation ModelCWA County Warning AreaDEMA Delaware Emergency Management AgencyECMWF European Center for Medium Range Weather ForecastingEDT Eastern Daylight TimeEMC Emergency Management CenterEMWIN Emergency Managers Weather Information NetworkERH Eastern Region HeadquartersET Electronics TechnicianEta Eta ModelFAA Federal Aviation AdministrationFEMA Federal Emergency Management Agencyft feetGFDL Geophysical Fluids Dynamical Lab ModelGOES Geostationary Operational Environmental SatelliteHLS Hurricane Local StatementHLT Hurricane Liaison TeamHPC Hydrometeorological Prediction Centerin inchIR Infraredkts knotsMAR Modernization and Restructuringmb millibarMIC Meteorologist in ChargeMPC Marine Prediction Centermph miles per hourMRF Medium-range Forecast ModelMRFX Medium-range Forecast Experimental ModelNAWAS National Warning SystemNCEP National Centers for Environmental PredictionNEXRAD Next Generation Weather RadarNGM Nested Grid ModelNHC National Hurricane Centernm nautical miles
v
NOAA National Oceanic and Atmospheric AdministrationNOGAPS Naval Operational Global Atmospheric Prediction SystemNOW Short Term ForecastNWR NOAA Weather RadioNWS National Weather ServiceNWSFO NEXRAD Weather Service Forecast OfficeNWSO NEXRAD Weather Service OfficeNWWS NOAA Weather Wire ServiceOM Office of MeteorologyPUP Principal User ProcessorQPF Quantitative Precipitation ForecastRDA Radar Data AcquisitionSOO Science and Operations OfficerSPC Storm Prediction CenterSRH Southern Region HeadquartersSSMI Special Sensor Microwave ImageryTPC Tropical Prediction CenterTWC The Weather ChannelUTC Coordinated Universal TimeVIS VisibleVITEMA Virgin Islands Territory Emergency Management AgencyWCM Warning Coordination MeteorologistWFO Weather Forecast OfficeWSH Weather Service HeadquartersWSR-88D Weather Surveillance Radar-1988 DopplerWV Water vapor
vi
Acknowledgments
This report was produced by having those responsible for each portion of the service providedwrite their own section. Each NWS field office and NWS Regional Office affected by Berthaconducted its own survey of the services they provided. Additionally, assessments were writtenby the National Centers that provided products and services related to Bertha. The ServiceAssessment Team is grateful to all those that provided valuable input into this document. Theindividuals primarily responsible for the Assessment are as follows:
Service Assessment Team
Rick Watling , Products and Services Manager, Meteorological Services Division, NWS EasternRegion Headquarters (ERH), Bohemia, New York
Scott Kiser, Technical Leader, Customer Service, Office of Meteorology (OM), Weather ServiceHeadquarters (WSH), Silver Spring, Maryland
NWS National Centers
Robert Burpee, Director, Tropical Predication Center (TPC), Miami, Florida
Miles Lawrence, Hurricane Specialist, NHC, Miami, Florida
Mike Schichtel, Meteorologist, Hydrometeorological Prediction Center (HPC), Camp Springs,Maryland
Dave Feit, Chief Marine Forecast Branch, Marine Prediction Center (MPC), Camp Springs,Maryland
Fred Ostby, Chief Operational Guidance Branch, Storm Prediction Center (SPC), Kansas City,Missouri
vii
Weather Service Headquarters
Rainer Dombrowsky, Customer Service, OM, WSH, Silver Spring, Maryland
Linda Kremkau , Technical Editor, Customer Service, OM, WSH, Silver Spring, Maryland
NWS Regions and Field Offices
Gary Woodall, WCM, Southern Region Headquarters (SRH), Fort Worth, Texas
Harvey Thurm , Synoptic Scale Meteorologist, ERH, Bohemia, New York
Brian Smith , WCM, NEXRAD Weather Service Forecast Office (NWSFO), Omaha, Nebraska
Steve Rich, Meteorologist in Charge (MIC), NWSO, Charleston, South Carolina
Jerry Harrison , WCM, NWSO, Charleston, South Carolina
Bernie Palmer, MIC, NWSFO, Columbia, South Carolina
Steve Naglic, WCM, NWSFO, Columbia, South Carolina
Richard Anthony, MIC, NWSO, Wilmington, North Carolina
Tom Matheson, WCM, NWSO, Wilmington, North Carolina
Tom Kriehn , MIC, NWSO, Morehead City, North Carolina
Dan Bartholf, WCM, NWSO, Morehead City, North Carolina
Steve Harned, MIC, NWSFO, Raleigh, North Carolina
George Lemons, WCM, NWSFO, Raleigh, North Carolina
Tony Siebers, MIC, NWSO, Wakefield, Virginia
Hugh Cobb, Science and Operations Officer (SOO), NWSO, Wakefield, Virginia
Bill Sammler, WCM, NWSO, Wakefield, Virginia
viii
Jim Travers, MIC, NWSFO, Sterling, Virginia
Gary Szatkowski, Deputy MIC, NWSFO, Sterling, Virginia
Barbara Watson, WCM, NWSFO, Sterling, Virginia
Chet Henricksen, MIC, NWSFO, Philadelphia, Pennsylvania
Joe Miketta, WCM, NWSFO, Philadelphia, Pennsylvania
Mike Wyllie , MIC, NWSFO, New York City, New York
Gary Conte, WCM, NWSFO, New York City, New York
Bob Thompson, MIC, NWSFO, Boston, Massachusetts
Dave Vallee, Service Hydrologist, NWSFO, Boston, Massachusetts
Glenn Field, WCM, NWSFO, Boston, Massachusetts
Al Wheeler, MIC, NWSFO, Portland, Maine
John Jensenius, WCM, NWSFO, Portland, Maine
Patricia Haas, Hydrologist, Mid Atlantic River Forecast Center, State College, Pennsylvania
Israel Matos, MIC, NWSFO, San Juan, Puerto Rico
Rafael Mojica, WCM, NWSFO, San Juan, Puerto Rico
Paul Hebert, MIC, NWSFO, Miami, Florida
Jim Lushine, WCM, NWSFO, Miami, Florida
Bart Hagemeyer, MIC, NWSO, Melbourne, Florida
Dennis Decker, WCM, NWSO, Melbourne, Florida
Steve Letro, MIC, NWSO, Jacksonville, Florida
Fred Johnson, WCM, NWSO, Jacksonville, Florida
ix
Executive Summary
Background
Hurricane Bertha was an early season Category 2 storm when it made landfall on the coast ofNorth Carolina on July 12, 1996. Twelve deaths have been directly attributed to Bertha withUnited States damages estimated at $270 million. Extensive evacuations of vulnerable areasoccurred in advance of Bertha, including 250,000 in North Carolina, 80,000 in South Carolinaand 20,000 in Georgia. Revenue losses to the tourist industry approached $40 million.
Bertha closely paralleled the southeast U.S. coast at a distance from 170 to 200 miles. Thiscreated multiple state involvement with almost all of the U.S. east coast involved with somewatch or warning. The NHC’s track forecast was very accurate with average forecast trackerrors 15 percent lower than the 10-year official track averages. Where the storm came ashore inNorth Carolina, watches and warnings were posted 65 hours and 47 hours before landfall,respectively, which far exceeds the NHC stated goals of 36 and 24 hours. Nevertheless, thecoordination between NHC and emergency managers, regarding the issuances of watches andwarnings, was frustrated by efforts to reconcile the meteorology of the event with state and localresponse requirements. Bertha’s anticipated turn from a northwest direction to north-northwestas it approached the southeast coast was agonizingly slow. This put a great deal of pressure onthe elected officials and Emergency Management Centers (EMCs) of Florida, South Carolina andNorth Carolina concerning what actions to take. This was also the first time the HLT had beenfully deployed at the NHC. A Service Assessment Team was dispatched to the NHC as well asthe impacted states to investigate these issues and to evaluate the HLT.
Issues
Bertha’s slow northward turn off the Florida coast caused the state of Florida to urge NHC toissue watches when NHC felt they were unnecessary. The major concern was that if the stormcontinued to move differently than forecast, sufficient response time would not be available ifwatches or warnings were issued at short notice. Similarly, South Carolina expressed the need forearly release of the official forecast track before NHC had completed the internal NWScoordination process. Several recommendations have been made in this report to help resolvethese issues.
A variety of communication/coordination issues were also revealed. NHC/state briefings werecomplicated by the fact that no single communication system was used to brief state emergencymanagement officials, adding to the workload of the hurricane specialists and confusion between
x
state EMCs and the NHC as to what method of coordination would be employed. Similar coordination problems occurred between NWS field offices and local EMCs as well as betweensome state and local EMC(s). Internal coordination between NWS offices posed difficulties asnot all necessary offices are connected to the Hurricane Hotline. This problem will continue toincrease as additional NWS offices spin up to full Weather Forecast Office (WFO) status.
The amount of meteorological information received by state and local EMCs to a large extentdepended upon the resources available to each office. Even though it is not considered anoperational system, Internet received high praise while the National Oceanic and AtmosphericAdministration (NOAA) Weather Wire Service (NWWS) continues to prove too costly for someEMCs. Additionally, NOAA Weather Radio (NWR) coverage is still lacking in some coastalareas. Accordingly, the NWS should seek to expand implementation of the EmergencyManagement Weather Information Network (EMWIN) as well as NWR.
This was the first time the HLT was used in an operational environment. This team is a jointventure between FEMA, the NWS and state and local emergency management officials. Theconcept is to supplement the NHC staff with Federal, state and local emergency managementpersonnel to provide information and coordination between the NHC and emergency managementdecision makers. As this is a new initiative, the HLT is still evolving in response to the needs anddesires of both the partners in the HLT and their customers. Questions remain regarding theultimate mission, function and operations of the HLT. Additionally, a larger resource pool ofavailable people to staff the HLT needs to be identified, and smoother procedures for setting upthe team’s hardware need to be established.
Some data acquisition problems were also noted. The St. Croix and St. Thomas AutomatedSurface Observing Systems (ASOS) were both powered down by the Federal AviationAdministration (FAA) when the airport towers were abandoned resulting in the loss of valuableground truth data. Due to the remoteness of the site, the San Juan Weather Surveillance Radar-1988 Doppler (WSR-88D) remote data acquisition (RDA) unit uses generator power sincecommercial power is not available. The generator produces irregular frequency fluctuationswhich puts the system out of service. The FAA electronics technician was able to keep thesystem operational throughout the storm, and a more permanent fix was employed after thepassage of Bertha. NWSFO Miami noted that without data off the southeast Florida coast, nowave information is available south of Melbourne. This forced the staff to estimate waves fromtheir wind forecasts.
Meteorology
Bertha was an early season Cape Verde hurricane which started as a tropical depression in thecentral tropical Atlantic on July 5. For 3 days, the depression moved west-northwest at 23 to29 miles per hour (mph) and strengthened to a hurricane on July 8 as the center moved across the
xi
Leeward and Virgin Islands of the northeast Caribbean. Bertha turned northwestward on July 9. Maximum sustained winds reached 115 mph at 2 a.m. Eastern Daylight Time (EDT), when Berthawas centered 138 miles north of Puerto Rico. The last hurricane to reach this strength this earlyin the season was Alma in 1966. Moving northwest, the center paralleled the Bahama islands. The track became north-northwest on July 10 and 11 as the center moved parallel to the coast ofFlorida and Georgia. With a forward speed of 17 mph, Bertha made landfall at 4 p.m. EDT onJuly 12 on the coast of North Carolina, midway between Wrightsville and Topsail Beaches.
Bertha quickly dropped below hurricane strength when it moved inland over eastern NorthCarolina. Highest wind gusts reported on land were 108 mph at Camp Lejeune and Jacksonville,North Carolina. The lowest observed sea-level pressure at landfall was 977 millibars (mb) at SurfCity, North Carolina. A value of 974 mb is assumed to be the minimum landfall pressure. Berthathen moved northeast along the U.S. east coast, producing 45 to 60 mph sustained winds overland from northern North Carolina to New England. Bertha was declared extratropical on July 14when the center moved from the Maine coast to New Brunswick, Canada.
Coastal storm surge flood heights, from Florida through New England, ranged from 1 to 4 feet,but values to 5 feet were estimated on the North Carolina coast from Cape Fear to Cape Lookout. A storm surge of 6 feet was indicated near Swansboro, North Carolina.
Rainfall associated with Bertha occurred from the eastern Carolinas to Maine with many locationsreceiving 2- to 4-inch amounts. Isolated reports of over 6 inches were reported from NorthCarolina to Massachusetts. The maximum was 7.20 inches at Billerica, Massachusetts. Bertha’srapid motion through the Northeast served to limit rainfall duration and amounts.
Six tornadoes have been confirmed with four in Virginia, one in North Carolina and one inMaryland.
xii
Summary of Findings and Recommendations
National Implementation
Finding 1a: Some confusion remains as to the purpose of the HLT.
Finding 1b: The workload for the hurricane specialists, with the HLT in place, wasnot reduced and in some instances increased.
Recommendation 1: In conjunction with FEMA, the functions and operations of the HLTmust be reviewed and refined. The results should be briefed at theNational Hurricane Conference and other suitable forums. FEMArepresentatives are encouraged to take an active role in theInterdepartmental Hurricane Conferences.
Finding 2: There are insufficient HLT members to support speciality functions(electronics, communications) to avoid burnout, turnover and absencesdue to sickness, annual leave, etc.
Recommendation 2: As part of the NWS/FEMA review, the specific tasks of the HLTmembers must be outlined and an adequate resource pool identified. TheNOAA/NWS Hurricane Conference should be the forum for discussingand validating HLT mission, membership and other requirements.
Finding 3: Hardware required to support the HLT is extensive and requiressignificant time and effort to set up.
Recommendation 3: FEMA must provide a complete set of instructions that will assist in theset-up process. Additionally, FEMA and NHC should identify electronicspecialist(s) who can set up and test the equipment prior to the arrival ofthe HLT. Given the location of the NHC on the Florida InternationalUniversity campus, NHC could explore the possibility of involvinguniversity resources to assist in the process.
Finding 4a: There was no single communication system used to brief state emergencymanagement officials. This led to confusion among the EMCs.
xiii
Finding 4b: NHC was required to conduct multiple briefings when more than onestate was impacted by Hurricane Bertha. This proved to be extremelytime consuming for the hurricane specialists.
Finding 4c: During teleconferences established by the HLT, the local NWS officeswere not always involved.
Finding 4d: Several times local emergency managers were tied into state and regionalbriefings coordinated through the HLT. The locals would then bebrought into a local conference call with their state and local NWSoffices. This was repetitive and not a good use of the local emergencymanagers limited time.
Finding 4e: NHC briefing calls to North Carolina state emergency managementofficials frequently came at times when these individuals were already inthe midst of a briefing by the NWSFO or with local emergencymanagement officials along the coast.
Recommendation 4: FEMA and the NWS must ensure that coordination methodologies andprotocols are firmly established before the next hurricane season. Thelocal NWS office(s) must be included in all NHC state conference calls toadd local expertise and to prepare for their coordination calls with localemergency managers.
Finding 5a: The Modernization and Restructuring (MAR) of the NWS has created agreater need for internal forecast coordination as the number of forecastoffices has increased.
Finding 5b: As Hurricane Bertha approached the Delmarva region, confusion arosewhen the wind forecasts from two NWS offices for adjacent forecastareas were significantly different.
Recommendation 5: The NWS needs to move quickly to establish an internal coordinationmechanism.
Finding 6: Some EMCs are having problems receiving weather information. NWRcoverage is incomplete and NWWS is too costly for some EMCs. Computer bulletin boards and the Internet received high praise.
xiv
Recommendation 6: The NWS should continue to seek partnerships to expand NWRcoverage in support of the Gore initiative and target resources to ensurereliable programming and maintenance of the new systems. The NWSmust actively support implementation of EMWIN and seek additionalpartnerships to ensure its availability from multiple sources. EMCsshould be reminded of other resources, such as the free redistribution ofNWWS from their state distribution point and the use of Packet Radio.
Finding 7a: A number of offices noted a truncation of some of the more lengthy
Hurricane Local Statements (HLS) on The Weather Channel (TWC). Moreover, it was also noted that some of the Short Term Forecasts(NOW) were cut off at six, as opposed to eight lines. This prematuretruncation of the HLS and NOW resulted in critical information not beingpassed on to the viewer.
Finding 7b: The “segmented” HLS format used by NWSFO San Juan marked animprovement over their HLSs issued during Hurricane Marilyn.
Finding 7c: NWSFO San Juan’s NOWs were informative, but some of them tendedtoward the radar narrative summary style of writing.
Recommendation 7: OM needs to work with TWC to resolve the truncation issue. All officesshould be reminded of the NOW’s primary function, to serve as aforecast of future conditions and impacts rather than a summary of pastevents.
Finding 8: Potentially valuable meteorological data was lost when the St. Croix andSt. Thomas ASOS units were powered down when the FAA abandonedtheir towers.
Recommendation 8: NWS and FAA officials should ensure that ASOS units remain in serviceduring the approach of a tropical cyclone.
xv
Finding 9: Rip currents associated with Bertha resulted in 3 deaths and over100 rescues along the Florida and southeast Georgia coasts. Heavy surfadvisories were canceled before two of the deaths occurred. Lack ofdata off the southeast Florida coast forced forecasters to estimate waveheights from local wind forecasts.
Recommendation 9: NWSFO Miami must redouble their efforts at seeking partnerships with Beach Patrol units and other organizations to secure critical wave height and surf reports.
Finding 10: Hurricane specialists were urged to change the location of watches andwarnings. This was exemplified when Bertha's slow northward turn resulted in Florida State officials requesting NHC to post watches on theFlorida coast when hurricane specialists felt that this was unnecessary.
Recommendation 10: NHC needs to remain sensitive to unique and special situations that occur which emergency managers must resolve during hurricane threats. State officials have the authority to issue mandatory evacuations forvulnerable coastal areas even when NHC may feel that meteorologicalconditions do not justify issuing hurricane watches or warnings. TheNWS and FEMA need to expand the present hurricane course foremergency managers and should develop a distance learning approach tothe present NHC resident course. As a part of this course, a moduleshould be developed for NWS personnel at both the NHC and at localoffices to ensure that they fully appreciate emergency managerrequirements.
Finding 11: The NHC was requested to release forecast points early.
Recommendation 11: NHC should not release forecast points prior to completion of forecast coordination. If the meteorology changes significantly and unexpectedlybetween the 6 hourly advisory forecasts, then NHC will issue a specialadvisory. However, in truly unique circumstances, some coordination ontrends and changes from the previous forecast can be discussed with thelocal NWSO and NWSFO so they can brief state or local EMCs prior tothe issuance of the new forecast. There is also a continuing need toeducate emergency managers and other customers about hurricaneforecasts and products and the uncertainties related to these products.
xvi
Finding 12: Hurricane strike probabilities are still not fully understood by state andlocal EMCs and are being misrepresented by the media. Theseprobabilities are especially confusing when a hurricane is paralleling thecoast.
Recommendation 12: The NWS and FEMA should develop new educational materials relatedto the use of hurricane strike probabilities as well as the use of forecastsand forecast uncertainties in the decision-making process. This should beincluded in the residence training at NHC as well as in distance learningmodules for emergency managers. These materials should also beprovided to coastal WCMs for outreach efforts to the local media. Similarly, NHC should investigate better ways of graphically depictingforecasts and forecast uncertainties.
Finding 13: Many NWS offices participate in post-storm local-level evaluations andcritiques, usually led by the WCM and/or the MIC.
Recommendation 13: This practice of local self-evaluation should be encouraged at all NWS offices, coastal or otherwise.
NCEP Implementation(National Centers for Environmental Prediction)
Finding 14: The Internet has become very popular, and the information available overthe Internet from NHC received very favorable comments. Naturally,when the hurricane was close to land, access to the NHC Homepage wasdifficult.
Recommendation 14: NHC should investigate the possibility of increasing their Internetcapabilities.
Finding 15: The NHC rarely sought input from the SPC nor made attempts to ensurethat the SPC was "on the line" during the hotline coordination. As aresult, field offices that were concerned with the tornado threat werenever sure that the SPC was on the line although the SPC makes it apractice to monitor the line continuously.
Recommendation 15: The NHC should include the SPC in its roll call list for coordinatingadvisories when a tropical cyclone threatens the U.S. mainland. In
xvii
addition, the NHC should make it a point to invite comments from theSPC in such situations.
Regional Implementation
Finding 16a: Due to the remoteness of the location, the San Juan WSR-88D RDAdoes not utilize commercial power.
Finding 16b: The RDA’s emergency generator produces an electric current withirregular frequency fluctuations.
Recommendation 16: Officials from the SRH and Puerto Rico emergency management shouldencourage the FAA to develop a plan for supplying the WSR-88D withstable commercial power and with stable, reliable emergency generatorpower.
Finding 17: The lack of reliable redissemination systems caused some delay in thereceipt of weather products necessary to the emergency managementdecision-making process in Delaware. The use of the fax blast was notalways reliable.
Recommendation 17: ERH should work with FEMA Region 3 and WSH to resolve this issue.
1
Chapter 1
Service Assessment Summary
Operations of the Hurricane Liaison Team
Traditionally, local emergency managers from Florida, as well as some FEMA regional personnel,volunteered to work at NHC to field calls from local emergency managers and to keep FEMAnational and regional offices apprised of the evolving situation from an emergency managementperspective. The 1996 hurricane season was the first real effort to formalize the ad hoc processand make it more of a functioning unit. This resulted from the highly active 1995 hurricaneseason where it became evident that something had to be done to take some of the externalpressure off of the NHC hurricane specialists. Accordingly, the HLT was formed at the requestof the State of Florida, FEMA and the NWS. The HLT was first activated during HurricaneBertha. Since this was the first official activation, some of its purpose and function were notclearly understood by all of the parties involved. It was expected that the HLT could relieve someof the external demands placed on the hurricane specialist. During Bertha, this was not the case. In fact, the workload was even greater due to the number of briefings that required participationof a specialist. The HLT concept is still under development and its functions and operations arebeing reviewed. A major concern is to ensure that the HLT does not detract from localemergency managers contacts with their local NWS offices and WCMs.
Prior to the start of the 1996 hurricane season, individuals were identified and chosen who had thenecessary skills and expertise. After working Hurricane Bertha, the team realized that, given theextended hours that are required and the possibility of a team member(s) being unavailable, asufficient number of skilled people were not identified to fill these positions.
In addition to staffing, a unique set of hardware is required to meet the operational requirementsof the HLT. Since the equipment was not prepositioned and there was no dedicated electronicsexpert assigned to assemble the hardware, some time was lost setting up the equipment.
The video conferencing between NHC and FEMA Headquarters ensured that FEMA seniormanagement and all organizations supporting the Federal Response Plan had the necessaryinformation to be proactive, making timely response actions. Video conferences were scheduledtwice a day for the Director of FEMA and were accomplished with minimal problems.
2
State and Local Coordination
Florida, South Carolina, North Carolina -- Unlike FEMA Headquarters and NHC, most stateEMCs currently do not have video conference capability but expressed a willingness to add thistechnology. However, due to high costs, video conferencing is not affordable to NWS fieldoffices. Most briefings are done via voice only with each state using differing communicationconferencing systems to speak to the NHC. Some use the National Warning System (NAWAS);others, such as Florida, have their own conference systems with a line to NHC. Some of theconference calls were done on NAWAS while others were made through existing Federal andstate teleconference systems but established by government operators. The South Carolina EMCmissed an NHC briefing since they were not sure whether the call was on NAWAS or some othersystem.
NHC and the states agreed that a universal conferencing system needs to be established ascoordination is too difficult with multiple systems. A single system would also help decrease theworkload for the hurricane specialist as all state EMCs could be conferenced together and briefedat once. Local NWS offices stated they were not always tied into conference calls between thestate EMCs and the NHC.
During Hurricane Bertha, many of the local EMCs were tied into HLT briefings along with theirstate EMCs. After this briefing, they would then participate in another conference call, involvingEMCs in the local area, the state EMC and the local NWS. In survey team discussions with localemergency managers, they expressed little interest in talking directly with NHC. They wouldrather be tied into a telephone conference call with their surrounding EMCs and local NWS office. They assume the state and local NWS offices will talk with the NHC and pass information to themduring their local conference call.
In interviewing local emergency managers, the survey team was told NWWS continues to provetoo expensive for local EMCs with limited funding. The EMWIN was discussed and could proveto be a viable alternative for users who currently have no level of support or can afford very little. North Carolina officials note that the NWR is still not available in some areas along theircoastline.
The use of Internet is increasing and South Carolina and North Carolina are using the Internet asone method to access the latest information. However, when Bertha approached the coastline,the Internet connection to the NHC was difficult or impossible to get.
Delaware and Maryland -- NAWAS was used as the primary communication and coordinationtool by Mt. Holly NWSFO during events of Hurricane Bertha. Delaware EmergencyManagement Agency (DEMA) felt the support provided during Hurricane Bertha did not meetthe level of support provided prior to the policy change. The use of a single conference call byseveral NWS offices for coordination among multiple states, as well as the loss of access to the
3
26 local municipalities on the DEMA bridge, was a major concern. Subsequent work between theOM, ERH and DEMA has found an equitable resolution using the DEMA bridge.
Delaware does not have an effective mechanism in place for the redistribution of both national andlocal weather information and guidance. This put county and municipal emergency managers at adisadvantage as they had no hard copies of NWS watches, warnings and statements. This forcedcoordination calls to be longer as they became a dissemination mechanism rather than acoordination tool. Delaware officials also noted several occasions where wind forecasts issuedfor adjacent areas by different NWSFOs were significantly different which caused confusion andraised the anxiety of many local emergency managers.
NWS Operations
As Hurricane Bertha paralleled the coast, it had the potential to make its initial landfall anywherefrom Florida to North Carolina. This put extreme pressure on NHC as well as the state EMCs. Although NHC’s forecast tracks for Bertha proved to be quite accurate, state EMCs urged NHCto change the location and timing of watches and warnings and to release the forecast tracksearly. This caused tension between NHC and their external users. The state EMCs thought theirinput and concerns were being ignored while NHC felt that they were being second guessed ontheir meteorology.
While the states agreed NHC is the technical leader and the recognized expert, the EMCscontinue to emphasize that watches and warnings are not purely a meteorological call but mustalso consider emergency response and public safety. The states agree they have the authority toissue mandatory evacuations for vulnerable coastal areas. They said that despite their efforts tomotivate people, the public will often not respond to recommendations or evacuation informationunless there is a watch or warning in effect.
Graphical representation of hurricane strike probabilities can be a useful tool, however, it wasnoticed during Bertha that these graphics were not fully understood by the public or the EMCs. In some cases, it lead to misinformation, and in others the media was incorrectly depicting strikeprobabilities. While strike probabilities work well with storms that strike the coastperpendicularly, they were confusing when a storm parallels the coast.
4
5
Chapter 2
National Perspectives
National Hurricane Center
Synoptic History
Hurricane Bertha originated from a tropical wave which moved from Africa to the Atlantic onJuly 1, 1996. A weak circulation was first detected on satellite imagery on July 3, centered about575 miles south of the Cape Verde Islands in the far eastern Atlantic Ocean. The track of thecirculation center begins on July 5, when the circulation is believed to have reached the surfaceand become a tropical depression in the central tropical Atlantic. This track is displayed inFigure 1 and listed in Appendix B, Table 1.
Bertha followed a fairly smooth curved path around the western periphery of the Atlanticsubtropical high pressure ridge. This ridge changed little during Bertha’s existence, and a weakmid-level trough persisted in the western North Atlantic. For three days, the depression movedtoward the west-northwest at the fast forward speed of 23 to 29 mph. It strengthened to ahurricane with 1-minute maximum sustained winds of 86 mph on July 8 as the center movedacross the Leeward and Virgin Islands of the northeastern Caribbean. The center moved betweenAntigua and Barbuda at 2 a.m. Atlantic Standard Time (AST) (0600 Coordinated Universal Time[UTC]) on July 8, across St. Barthelemy, Anguilla and St. Martin, just north of St. Thomas, andover the British Virgin Islands by 2 p.m. AST (1800 UTC).
The track gradually turned northwestward on July 9 as maximum sustained winds reached 115 mph at 2 a.m. AST (0600 UTC). Bertha was centered 138 miles north of Puerto Rico at thistime but earlier passed within 35 miles of the island. Since the strongest winds were located in thenortheast quadrant of the hurricane, most of Puerto Rico experienced only tropical stormconditions. The exception is the Puerto Rican island of Culebra, where hurricane-force winds arebelieved to have occurred. Moving northwestward at a slower forward speed of 17 to 23 mph, the center of Bertha movedparallel to the Bahama Islands, passing 45 to 70 miles northeast of the Turks and Caicos Islands, San Salvador, Eleuthera and the Abacos. Again, the strongest winds were located to thenortheast of the center, but 75-mph sustained winds might have reached some of the abovementioned islands.
Continuing on its gradual turn, the track became north-northwestward on July 10 and 11 as thecenter moved parallel to the coast of Florida and Georgia at a distance of 170 to 200 miles
6
Figure 1: Track of Hurricane Bertha, July 5-14, 1996 (extratropical track July 14-17).
7
offshore. During this time, the forward speed slowed to about 9 mph. Moving northward and re-accelerating to a forward speed of 17 mph, Bertha made landfall at 4 p.m. EDT (2000 UTC) onJuly 12 on the coast of North Carolina. At landfall, Bertha was a Category 2 storm on the Saffir-Simpson Hurricane Scale (see Appendix A) as the center crossed the coast midway betweenWrightsville and Topsail Beaches. The hurricane had been gradually weakening since its topspeed of 115 mph on July 9 to 81 mph on July 11. Then, 12 hours before landfall, the estimatedmaximum 1-minute winds increased to 104 mph. Bertha quickly dropped below hurricanestrength when it moved inland over eastern North Carolina. Bertha then moved northeastwardalong the U.S. east coast, producing 45 to 60 mph sustained winds over land from northern NorthCarolina to New England. Over the nearby Atlantic, 70 mph winds were the rule. Bertha wasdeclared extratropical on July 14 when the center moved from the Maine coast to NewBrunswick, Canada. The extratropical storm brought 45 to 60 mph winds to the CanadianMaritime Provinces and was tracked to just south of Greenland on July 17.
Meteorological Statistics
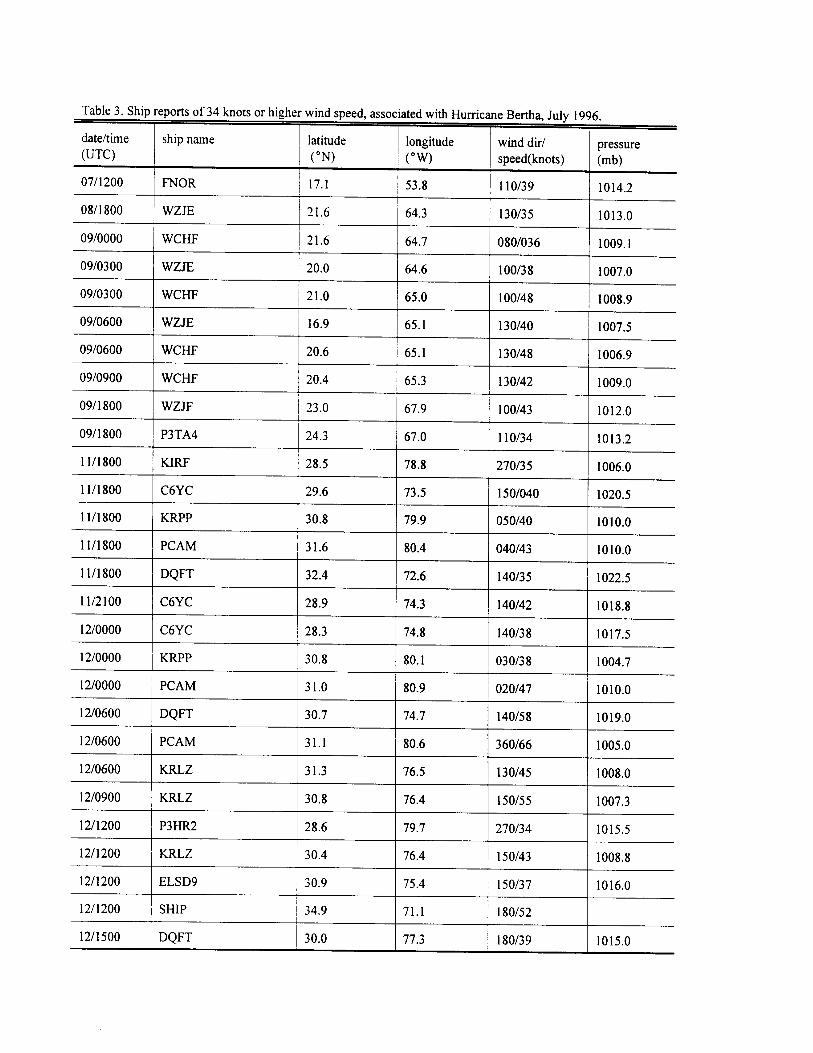
Figures 2 and 3 show a plot, versus time, of the various data used to estimate the minimumcentral sea-level pressure and the maximum 1-minute wind speed 33 feet above ground. Includedare data from reconnaissance aircraft and satellite Dvorak-technique wind speed estimates. Appendix B, Table 2, lists selected surface observations of lowest pressure, peak wind, stormsurge and rainfall values. Appendix B, Table 3, lists ship reports of 39 mph or greater that wereassociated with Bertha. The minimum pressure of 960 mb occurred at 2 a.m. EDT (0600 UTC)on July 9 and is based on a dropsonde measurement. The best track maximum sustained windspeed of 115 mph at the same time is based on a 700-mb flight-level wind speed of 140 mph,measured 22 miles east-northeast of the center.
Observations are incomplete from the Leeward and Virgin Islands, but because the circulareyewall was 20 to 35 miles across, it is believed that hurricane conditions with sustained windspeeds to 86 mph could have occurred on Antigua, Barbuda, Nevis, St. Eustatius, St. Barthelemy,Anguilla, St. Martin, and from St. Thomas northward through the U.S. and British Virgin Islands. Experience with Hurricane Marilyn in 1995 suggests that even higher sustained winds can occurover mountainous terrain as is found on many of these islands. Winds 40 to 45 mph wereexperienced over portions of Puerto Rico as indicated by the San Juan observations inAppendix B, Table 2.
A reconnaissance aircraft flight level wind speed of 127 mph in the northeast quadrant of thecirculation several hours before landfall is the basis for estimating sustained surface winds of104 mph on the coast at landfall. The lowest sea-level pressure observed at landfall was 977 mbat Surf City, North Carolina, and a value of 974 mb is assumed to be the minimum pressure atlandfall.
8
Figure 2: Curve of minimum central sea-level pressure versus time.
Figure 3: Curve of maximum 1-minute speed versus time.
9
Coastal storm surge flood heights, from Florida through New England, ranged from 1 to 4 feet,but values to 5 feet were estimated on the North Carolina coast from Cape Fear to Cape Lookout. A storm surge of 6 feet or a little higher was indicated near Swansboro, where 5 to 6 feet of waterwas “inside of businesses on the waterfront” (from Newport, North Carolina, National WeatherService Forecast Office Preliminary Storm Report). Values were forecast to be between 4-6 feet.
Six tornadoes (four in Virginia, one in North Carolina and one in Maryland) have been confirmedduring the passage of an outer rain band.
Casualty and Damage Statistics
There were 12 deaths related to Hurricane Bertha. Four in Florida included one from anevacuating military jet crashing into a house and three drownings from rip currents and high surf.Two deaths were reported in North Carolina (automobile accident and rip current drowning),while one surfer died in New Jersey. In Puerto Rico, one death occurred in an automobileaccident and another died while surfing. On the French half of St. Martin, one person waselectrocuted and another drowned after falling off a boat.
The U.S. Virgin Islands, along with North Carolina, has been declared a Federal disaster area. Surveys indicate that Bertha damaged almost 2,500 homes on St. Thomas and St. John. Formany, it was a second hit in the 10 months since Hurricane Marilyn devastated the same area.
It is likely that there was beach erosion on the north coast of the Dominican Republic as Berthapassed to the north. The Bahamas were also affected by the weak side of the hurricane, but thereare no damage figures available from either of these locations.
The primary effects in North Carolina were to the coastal counties and mostly due to storm surgeflooding and beach erosion, roof damage, piers washed away, fallen trees and damage to crops. Asurvey indicated more than 5,000 homes were damaged, mostly from storm surge. FEMAestimated 250,000 persons evacuated in South and North Carolina. Minor wind damage andflooding also spread along the path of the storm all the way to New England.
The Insurance Institute estimates $135 million in insured property damage, primarily along coastalNorth Carolina. A conservative ratio between total damage and insured property damage,compared to past land-falling hurricanes, is two to one. This would increase the total U.S.damage estimate to $270 million. No figures are available from the Caribbean.
Warning and Forecast Critique
Bertha moved on a fairly smooth track. The average official track forecast errors for Bertharanged from 92 miles at 24 hours (32 cases) to 169 miles at 48 hours (29 cases) to 258 miles at 72
10
hours (27 cases). These errors are 15 percent or more lower than the previous 10-year averagesof the official track errors and are from 15 to 40 percent lower than the CLIPER forecast errorsfor the same cases.
Overall, the track model guidance also performed very well. However, the 8 p.m. EDT (0000UTC) Aviation Model run on July 9, when Bertha was located just north of Puerto Rico,inexplicably showed the track recurving significantly further east than the previous run. All of thetrack guidance models that use the Aviation Model as a background environment also showed asimilar track. This resulted in rather large official track forecast errors on July 9, with a 705-mile,72-hour error on the 8 a.m. EDT (1200 UTC) forecast. The Aviation Model and some of thetrack guidance models recovered to an excellent forecast only 12 hours later. Fortunately, thisguidance problem occurred three days prior to landfall in North Carolina and did not have asignificant impact on U.S. warnings or on warnings for the Bahamas.
Appendix B, Table 4, lists the various watches and warnings that were issued. Hurricanewarnings were issued from Sebastian Inlet, Florida, to Chincoteague, Virginia, as well as for theBahamas and for the islands of the northeastern Caribbean Sea from Antigua through PuertoRico. Tropical storm warnings were issued from Sebastian Inlet to north of Deerfield Beach,Florida, and from north of Chincoteague to Watch Hill, Rhode Island. Almost all of the U.S. eastcoast was involved with some watch or warning which is the result of the storm track’s expectedclose passage to the southeast U.S. coast. The hurricane watch for the North Carolina landfallarea was issued 65 hours before landfall, and the hurricane warning was issued 47 hours beforelandfall. This is far more than the 36- and 24-hour lead times that the NHC strives for and is theresult of the forward motion decreasing at a faster rate than expected.
User Response
For about 2 days, Bertha aimed at the north-central Florida east coast. During that time, all of theNWS track guidance models were predicting a turn to the north, near 76 degrees west. This wasuncomfortably close to some of Florida's barrier islands and Cape Kennedy which have evacuationtimes exceeding 24 hours. At 11 p.m. EDT on July 9 and again during the early morning hours ofJuly 10, the State of Florida emergency management officials requested that NHC post ahurricane watch for the northern parts of their east coast, but NHC hurricane specialists felt thatthis was premature. On July 10, the governor issued mandatory evacuation notices at 10 a.m.EDT, and NHC put up hurricane warnings at 11 a.m. EDT for the state, north of Sebastian Inlet. Early that afternoon, Bertha began its recurvature toward the north in close agreement with theguidance models.
Similarly, South Carolina state officials became concerned about possible nighttime evacuationson the evening of July 10 and were in great need of the latest information prior to the 11 p.m.coordination call. The governor wanted to make a decision whether or not to order mandatoryevacuations before the 11 p.m. news. Working and coordinating closely with NWSFO Columbia,
11
NHC was called at 7:30 p.m. EDT on July 10, requesting additional forecast track information. This request was received more than an hour before the hurricane specialist was to beginpreparing the next forecast. The hurricane specialist and the HLT provided intermediateinformation on Bertha's location and strength, however, NHC could not release any track andintensity forecasts until the next NWS hurricane hotline call at 10 p.m. EDT, at which time thetrack and intensity forecasts would be coordinated and agreed upon. The HLT believed they keptstate officials well informed regarding Bertha from an emergency management perspective.
Hydrometeorological Prediction Center
Meteorology of Heavy Rainfall
Hurricane Bertha made landfall on the North Carolina coast on July 12 and was downgraded to atropical storm shortly thereafter. The storm accelerated north-northeastward across coastalsections of the Mid-Atlantic and northeast United States prior to moving off the eastern NewEngland coast late on July 13. Precipitable water values increased significantly to values in excessof 2 inches along the Eastern Seaboard as deep layered easterly flow developing in advance of thestorm advected tropical moisture inland. Heavy rain occurred from the eastern Carolinas toMaine with many locations receiving 2- to 4-inch amounts (see Figure 4). Coastal North Carolinaand southeast New York had isolated reports of over a half foot of rain. Amounts could havebeen much greater had Bertha's rapid motion not acted to limit rainfall duration.
Guidance Products
Primary guidance that aided HPC forecasters included varied output from numerical models(Geophysical Fluids Dynamical Lab [GFDL] model, Aviation Model [AVN], ETA Model [ETA],Nested Grid Model [NGM], Naval Operational Global Atmospheric Prediction System[NOGAPS], Medium-range Forecast Model [MRF], the MRF ensemble package, Medium-rangeForecast Model Experimental [MRFX], European Center for Medium Range WeatherForecasting [ECMWF], United Kingdom Meteorological Office [UKMET], meso-ETA, NHChurricane models, etc.), satellite imagery (Geostationary Operational Environmental Satellite[GOES]-8/9 Visible [VIS], Infrared [IR], Water vapor [WV], and Special Sensor MicrowaveImagery [SSMI] microwave data), NEXRAD data, surface and upper-air observations andaircraft reconnaissance data.
Model output was varied. While all models correctly indicated the potential for heavy rainfallover the eastern United States, the AVN forecast a Bertha track and associated quantitativeprecipitation forecast (QPF) that was shifted farther to the west than the ETA or NGM. TheAVN track implied that a significant upslope rain event was imminent in the favored upsloperegion on the eastern side of Appalachian Mountains. The ETA and NGM supported a heavyrainfall event farther to the east. Weather pattern recognition and upper-air data analysis
12
combined with trends from satellite imagery and radar to prompt HPC forecasters to prefer asolution close to but wetter than that depicted by the ETA. Subsequent observations deemed thatour model assessments were on the right track.
HPC staff produced an array of graphic products and accompanying narratives. These productsprovided an assessment of guidance and an excellent forecast of quantitative precipitation, flashflood potential and the sea level pressure pattern from current conditions up to five days(see Figures 5-7).
Internal Coordination
HPC forecasters participated in at least four regularly scheduled hurricane coordination calls eachday that included verbal input from NHC, SPC, MPC, WFO's, WSH, SRH, ERH, Naval AtlanticMeteorology and Oceanography Center at Norfolk, Virginia, and the Naval Meteorology andOceanography Facility at Jacksonville, Florida. Information discussed included Bertha's forecaststrength and track from zero to five days and associated QPFs. Routine coordination calls werealso performed with FEMA.
Marine Prediction Center
Marine Meteorology
As Bertha moved along the east coast recurving across the Maritimes and then well out to sea, itcreated significant marine meteorological conditions for an extensive segment of the MPC HighSeas area of responsibility. The most notable conditions are chronicled below.
# As Bertha passed near the Bahamas on July 10 at 8 a.m. AST (1200 UTC), well before thecenter entered MPC's area, 13-foot southerly swells had propagated as far north as 34N westof 69W.
# On July 11 at 8 a.m. AST (1200 UTC), while hurricane and tropical storm force windsremained south of 32N, the southern limit of the MPC forecast area, seas increased to 20 feet over the area south of 34N west of 70W. Near gale force winds extended out to 520 milesover the north semicircle.
# By July 12 at 8 a.m. EDT (1200 UTC), the center of Bertha had crossed 32N, approachingthe coast of the Carolinas. Packing maximum sustained winds of 104 mph, the stormgenerated a maximum wave height estimated at 39 feet just south of Frying Pan Shoals.
# On July 13, Bertha moved inland across eastern North Carolina and southeast Virginia,weakening to a tropical storm with sustained winds of 52 mph and gusts to 63 mph at 8 a.m.EDT (1200 UTC). Winds near tropical storm force and 13-foot seas also occurred within 485miles from the center.
# By July 14 at 8 a.m. EDT (1200 UTC), Bertha had lost most of its tropical characteristics andwas declared extratropical, becoming the sole responsibility of the MPC. Located along theNew Brunswick coast, storm force winds to 63 mph and seas to 20 feet occurred within 485miles over the southeast semicircle. Gale force winds and seas to 16 feet extended out to 620miles over the southeast semicircle and 345 miles over the northwest semicircle.
# On July 15 at 8 p.m. EDT (0000 UTC), former Bertha was downgraded from an extratropicalstorm to a gale, still packing winds to 52 mph with seas to 18 feet southeast of the center.
# As the low moved northeast across the open ocean, gale warnings were continued untilJuly 17 at 2 a.m. EDT (0600 UTC). Through its final weakening stages as a gale fromNewfoundland to just south of Cape Farewell, an extensive area of 13- to 21-foot seascontinued east and south of the center.
Forecast and Guidance Products
MPC forecast and analysis products are routinely broadcast to ships at sea. This is done throughthe U.S. Coast Guard high frequency communication facilities. The products consist of high seastext bulletins and graphic surface analysis and forecast products. In addition, voice broadcasts ofwarnings and forecasts which originate at the MPC are broadcast over station WWV, Boulder,Colorado. Although all of these products are produced according to a regular schedule, they allcontain warning and forecast information as provided in the official TPC bulletin.
The frequency of transmission for these products is every 6 hours and is based on the synopticreporting times (0000 UTC, 0600 UTC, 1200 UTC, 1800 UTC).
Coordination
Coordination took place using the Hurricane Hotline or through telephone calls. TPC'sconference calls were routinely monitored and telephone calls to TPC's Tropical Analysis andForecast Branch were made for purposes of coordination. In anticipation of the system becomingextratropical and to cover expected conditions in offshore waters, MPC provided input foradjustments of TPC's tropical force wind/12-foot seas radius as the storm crossed north of 32Nprior to making landfall along the southern North Carolina coast. The input was accepted andincorporated into the advisory.
16
Storm Prediction Center
Forecast and Guidance Products
Tornado watches associated with Bertha (see Appendix D).
The SPC participated in all hurricane hotline discussions concerning Bertha during its lifetime,however, this was due to the fact that SPC forecasters were monitoring the hotline. NHC failedto roll call the SPC nor did it invite input from the SPC. NHC should include the SPC in its rollcall list for coordinating advisories when a tropical cyclone threatens the U.S. mainland. Duringthe 10 a.m. EDT coordination on July 12, the SPC forecaster commented that the tornado threatfor the east coast was increasing and that he should probably issue a tornado watch (the first in aseries). The hurricane specialist suggested that the SPC handle the details off-line with theindividuals involved, and that he would mention the possibility of tornadoes in the next bulletin. After the hotline call ended, the SPC forecaster called the offices in Raleigh, North Carolina, andColumbia, South Carolina, to coordinate the tornado watch (No. 764) which extended fromnortheastern South Carolina into southeastern and east-central North Carolina.
During the course of the morning and early afternoon, several tornado warnings were issued inNorth Carolina with some occurring near the western and northern boundaries of the watch. Damage was reported with a thunderstorm near Raleigh. Since there was a strong surface high tothe north (1026 mb center), the resulting pressure gradient was producing relatively strong lowlevel flow (and shear) well to the north of the tropical storm center. Further, instability along andeast of a surface trough extending from eastern North Carolina into southeastern Virginia hadreached moderate values. These factors raised the concern that the tornado threat would bedeveloping northward along and east of the trough line during the afternoon hours and that awatch would be needed northward from the original watch into southeastern Virginia. To make itsimpler for the NWSFOs and NWSOs, the ending time 8 p.m. EDT (0000 UTC) was chosen to bethe same as that with the original watch. The SPC forecaster called NWSFOs Raleigh, NorthCarolina, and Sterling, Virginia, to propose the new watch (No. 765). SPC mentioned that therewas rotation with a cell on the Virginia/North Carolina border and that NWSO Wakefield,Virginia, had issued a tornado warning as a result. All agreed to the watch although Sterling was
17
a little hesitant. On several occasions, the SPC noted that it is apparent that during hazardousweather events when staffs at local offices are busiest, it can be difficult for them to stay abreastof evolving and immediate post-weather events in nearby NWSFOs/NWSOs areas ofresponsibility. Later in the evening, tornado watch Nos. 768 and 770 were issued as the tropicalsystem tracked north.
By early Saturday morning, July 13, the main east-west "spiral band" of isolated supercells whichwas over northern Virginia continued northward and had reached a northern Maryland/southernNew Jersey line by around daybreak. Two rotating storms on the far western end of this activitywere edging dangerously close to the western edge of the previous weather watch and nearing theeastern suburbs of Washington, D.C. Therefore, upon consultation with NWSFOs Sterling,Virginia; Philadelphia, Pennsylvania; and New York City, New York, the SPC forecaster decidedto issue a new watch (No. 771) which covered a bit more of the "western shore" region of the Chesapeake Bay. Shortly after the watch was issued, a new thunderstorm began to rotate alongthe same spiral band which had produced the rotating storms east of Washington. This latter cellmoved right across Baltimore and prompted a tornado warning from Sterling, but no tornadoeswere reported.
During the coordination call for Tornado Watch No. 771, NWSFO Philadelphia had no troubleaccepting the watch as there had already been isolated rotating storms over Delaware Bay earlier.These storms were well in advance of the Virginia/Maryland spiral band. On the other hand,NWSFO New York City really didn't want the watch (No. 771), but they were unaware of thefact that isolated supercells had been occurring as close to them as Delaware Bay earlier. Therewas good agreement with NWSFO Boston, Massachusetts, to the effect that any tornado threat inNew England would be delayed for a while due to the presence of cooler/drier air near the surface(dew points were in the 60s vs. low to mid 70s in Maryland). As has been pointed out in severalinstances, the long standing procedures of watch coordination with field offices were, in general,effective. The coordination process provided the field with opportunities to contribute and, inmost cases, coming to a consensus was not a problem. The SPC also noted the ability to dial intothe WSR-88Ds that were being affected proved to be a valuable tool in assessing the tornadothreat from Bertha.
18
19
Chapter 3
Regional Perspectives
Southern Region
## Puerto Rico and the U.S. Virgin Islands
Data Collection
WSR-88D
Performance of the San Juan WSR-88D, an FAA radar, was acceptable as Bertha moved acrossthe Virgin Islands and north of Puerto Rico. However, as of Saturday, July 6, the radar wasinoperative with no apparent plans to return it to service. Representatives from SRH, WSH,Office of Systems Operation, and the Operational Support Facility spent several hours during theevening of July 6 coordinating and attempting to isolate the problem. On the morning of July 7,the FAA electronics technician (ET) had identified the problem as irregular fluctuations in thefrequency of the generator used to power the RDA. Due to the remoteness of the site, the RDAdoes not have commercial power. The permanent fix to the generator’s problem was to install anelectronic governor on the generator, but this could not be done before Bertha’s arrival. TheFAA ET would attempt to temporarily stabilize the signal on a short-term basis but could notpromise any definite success. The efforts were in fact successful as the WSR-88D remainedoperational for the duration of the event. Once the scope of the WSR-88D problem was madeknown to the appropriate FAA representatives, they were cooperative and restored the radar toservice as quickly as possible.
Automated Surface Observing System (ASOS)
The ASOS units on St. Thomas and St. Croix functioned normally until Monday, July 8. On themorning of July 8, the control towers at both islands’ airports were abandoned. FAA personnelhave instructions to power down all equipment, including ASOS, when the towers are abandoned. Thus, no ASOS data were available as the storm impacted the islands, and no official wind orpressure data were available in real-time or after the event. The ASOS at San Juan remainedoperational, recording a maximum wind gust of 60 mph and a minimum pressure of 996.8 mb.
20
Warning and Forecast Services
NWSFO San Juan began issuing HLSs at 11:20 p.m. AST, Saturday, July 6. The HLSs wereissued at 6 hourly intervals through 5 p.m. on July 7, at which time they switched to 3 hourlystatements. The statements contained a great deal of information presented in a segmented formas recommended by the Hurricane Marilyn Disaster Survey Report. Separate sections of theHLS were used to describe preparedness actions, the storm’s position, storm surge, etc. Thisenabled customers to quickly find information regarding a particular aspect of the storm’s threat. As Bertha approached and moved by Puerto Rico, HLSs were composed and disseminated every2 hours. These HLSs were a marked improvement over those issued for Hurricane Marilyn.
NOWs were prepared by NWSFO San Juan throughout the event. The NWSFO staff utilizedinformation primarily from the WSR-88D when composing their NOWs. While the NOWs wereinformative, some of them were written in a style similar to the radar narrative summary (i.e., “Atxxx pm...radar indicated the center of Bertha...”). This had the effect of dating the products andfocusing customers’ attention to the storm’s history rather than its forecast track and impacts.
Dissemination and Coordination
NWSFO San Juan communicated information regarding Bertha in a variety of ways. The primarydissemination means were NWR and NWWS. Local EMCs and media took an active role inrelaying information to the citizens, using methods ranging from facsimile transmissions to livetelevision and radio broadcasts.
On St. Thomas, NWR broadcasts are provided through a service contract with radio stationWAH. Normally, WAH provides NWR service between 6 a.m. AST and midnight. However,with the approach of Bertha, WAH conducted 24-hour operations from one day before thestorm’s arrival to two days after Bertha’s impact. The St. Thomas office of the Virgin IslandsTerritory Emergency Management Agency (VITEMA) has the “state” NWWS drop provided bythe NWS. The system was operational until mid-afternoon Monday, July 8, when power was lostto the VITEMA facility. The VITEMA-St. Thomas office was in frequent contact with NWSFOSan Juan, as coordination calls were held at least five times daily starting on Friday, July 5.
On St. Croix, VITEMA officials were still not receiving all NWWS products from the drop on St.Thomas. However, the St. Croix staff obtained the necessary information via coordination callswith the NWSFO San Juan, the Internet, The Weather Channel, and the VIFreenet. TheVIFreenet is a free Internet-based service for Virgin Islands citizens. The service is maintained byprivate sources. VITEMA-St. Croix staff also gathered weather information from the FEMARegion I HF radio network. Although some problems were encountered with the NWWS, theVITEMA-St. Croix staff utilized multiple dissemination methods to receive information regardingBertha.
21
Preparedness
As in previous years, the staff at NWSFO San Juan conducted an aggressive hurricanepreparedness campaign. From October 1995 through June 1996, the office participated in48 conferences, workshops, seminars, presentations and interviews related to hurricanepreparedness. Among these activities was a 2-day workshop, conducted in cooperation withTPC/NHC, for VITEMA officials. The office also conducted an in-house hurricane seminarwhich was also attended by two members of the VITEMA-St. Croix staff. NWSFO continuestheir noteworthy preparedness efforts.
Customer Response
The local media was proactive, especially the print media outlets. The St. Croix Avis, the localnewspaper on the island, covered Bertha as their headline story beginning on Saturday, July 6. NWS Public Information Statements documenting preparedness activities were printed in theSunday and Monday (July 7 and 8) editions. VITEMA officials on both St. Thomas and St. Croixwere satisfied with the information they received during the event, including the forecast track andintensity. Although Bertha was a fast-moving storm as it approached the islands, VITEMA staffand citizens felt they had ample time to prepare. Thus, the VITEMA staff believed that theyreceived better services than during Hurricane Marilyn in 1995.
## Florida and Georgia
Data Collection
All of the data collection equipment in place along the Florida and Georgia coasts was operationalduring the event. The WSR-88D, ASOS, upper air equipment, and data buoys performed wellthroughout Bertha’s trip up the east coast.
However, NWSFO Miami, Florida, noted a problem with a lack of data off the southeast Floridacoast. Without the data, no wave information is available south of Melbourne, Florida. Waveheights can be estimated from local wind forecasts, but no observations of swells are routinelyavailable and no “ground truth” wind/wave data can be accessed by forecasters. The NWSFOMiami WCM has talked to the Beach Patrol units in southeast Florida, asking them to call inrough surf reports to the office. This practice is not consistently done.
Warning and Forecast Services
All coastal offices issued frequent HLSs for their areas of responsibility. The HLSs roughlycoincided with the release of advisory packages or intermediate advisories from TPC/NHC.
22
Because Bertha remained well away from the coastline, none of the Florida coastal offices neededto document the storm’s progress in short term forecasts (NOW).
During the evening of July 9, Bertha approached southeast Florida and TPC/NHC issued theTropical Storm Warning from Deerfield Beach, Florida, northward. This was upgraded to aHurricane Warning from Sebastian Inlet northward during the morning of July 10. NWSFOMiami, NWSO Melbourne, and NWSO Jacksonville, Florida, began issuing HLSs at aroundmidnight on July 10. The HLSs were issued about every 3 hours until the warnings werediscontinued (5 p.m. EDT on July 10 for Miami, 5 a.m. on July 11 for Melbourne, and 5 a.m. onJuly 12 for Jacksonville). Overall, the offices’ HLSs were detailed and accurate. In cases wherethe HLSs were lengthy, a segmented approach was used. As at NWSFO San Juan, the Floridaoffices’ segmented HLSs contained separate paragraphs discussing topics such as the storm itself,evacuation instructions, and tide information. It should be noted that all of Florida’s coastal NWSoffices issued timely and informative HLSs as Bertha passed offshore.
In addition to the HLSs, NWSFO Miami issued heavy surf advisories and statements advising ofrough surf conditions and potential strong rip currents through July 12. Unfortunately, one deathoccurred on July 10 due to a rip current off Jacksonville Beach. Later in the week, due to thelack of wave/swell data from off the southeast coast, the heavy surf advisory was prematurelycanceled. Two more people were drowned and more than 100 were rescued along Dade Countybeaches on July 12 and 13 due to rip currents caused by swells from Bertha. The NWSFO Miamialso issued a wind advisory on the morning of July 10 for inland portions of central and southernFlorida with winds forecast to 35 mph. The wind advisory was extended to portions of north-central Florida during the late morning of July 10.
Internal and External Coordination
Although Bertha’s meteorological impacts on the Florida and southeast Georgia coasts wereminimal in the form of heavy surf and minor beach erosion, the storm was the subject of tensecoordination between NHC and the State of Florida EMC. Because the NHC forecasters felt thatthe storm would turn to the north and eventually to the northeast, no watches or warnings wereoriginally issued for the coast. By Tuesday, July 9, the storm still had not made an appreciableturn to the north. During a coordination with the state EMC on the evening of July 9, the stateEMC virtually insisted that a watch or warning be issued so that their coastal county EMCs couldinitiate their hurricane plans. The storm still had not made an appreciable turn by the morning ofJuly 10. During the 10 a.m. EDT conference call between NHC and the local offices, it wasagreed that an upgrade to a hurricane warning was the best course of action. Bertha finallyslowed and started to turn north by the afternoon of July 10, but the warnings were left up forprecautionary reasons. In retrospect, the NHC official forecasts were accurate in depictingBertha’s decrease in forward speed and turn to the north. Although the turn did occur, theuncertainty involved with the forecast made coordination with the State of Florida EMC difficult.
23
The local offices along the coast were active in coordinating with their local emergencymanagement officials. Staffs at the offices were involved with both the NHC coordination callsand the State of Florida conference calls as well. Offices utilized telephone and amateur radiocommunication when needed to elaborate on the information contained in HLSs.
Customer Response
Despite the coordination issues which occurred during Bertha’s approach, local customers weresatisfied in general with the services they received. The Palm Beach County EMC was supportiveof the NWS warnings and forecasts and expressed displeasure only at the tenseness of thecoordination between NHC and the state EMC. The Broward County EMC was concerned aboutthe breakpoint chosen for the tropical storm warning (north of Deerfield Beach) since DeerfieldBeach is in Broward County but the warning was for the area north of Broward County.
Along the central Florida coast, there was some second-guessing of the warnings and evacuations. These concerns were especially evident in the local print media. However, the majority of thecustomers in the area felt that the actions taken were prudent considering the history and pasttrack of the storm. The NWSO Melbourne WCM has engaged in ongoing meetings with localemergency managers to evaluate the communication and coordination issues. In northeast Florida and southeast Georgia, customers were satisfied as well with the servicesfrom NWSO Jacksonville, Florida. The regional media were centrally located in the DuvalCounty EMC. On the afternoon of July 10, the NWSO Jacksonville MIC relocated to the DuvalCounty, Florida, EMC to field media inquiries and to enhance coordination with Duval Countyand other local emergency management officials. Community response in the coastal areas wasimmediate upon issuance of the hurricane warning. NWSO Jacksonville received a letter ofappreciation from the Camden County, Georgia, EMC, and several other local agencies gaveverbal compliments to the office. As in east-central Florida, the NWSO Jacksonville WCM andSOO have engaged in frequent evaluation meetings with local customers.
Eastern Region
Impacts
Hurricane Bertha was an unusual early season Category 2 hurricane which made landfall nearWrightsville Beach, North Carolina. Bertha was the first significant hurricane to directly affectthe state between Wilmington and Morehead City since Hurricane Donna in 1960.
The American Insurance Association estimates that $135 million of insured property lossesoccurred during Bertha with $100 million having occurred in North Carolina, $25 million inVirginia, and $10 million in South Carolina. Claims represent insured losses resulting fromfactors other than tidal inundation (i.e., mostly wind).
24
The hardest hit area was just to the east of the eye at landfall...Topsail Beach and Swansboro,North Carolina. Water was 5 to 6 feet deep in waterfront businesses in Swansboro. Highest windgusts reported on land were 108 mph at Camp Lejeune and Jacksonville and 95 mph atWrightsville Beach (all in North Carolina). Wind gusts of 80 mph were observed at NWSONewport, North Carolina. In Wilmington, North Carolina, just to the west of the eye, windsgusted to 70 mph. Over water, the Frying Pan Shoals C-Man tower, 35 miles off the NorthCarolina coast, registered a gust to 115 mph. NWSO Wilmington, North Carolina, recorded5.66 inches of rain during Bertha's passage.
In North Carolina, moderate to severe amounts of beach erosion occurred in areas of Bertha'sgreatest impact. Mason Inlet lost 50 feet of land, leaving the inlet that much closer to Shell IslandResort. At Emerald Isle, the dunes dropped vertically 8 to 10 feet at the erosion line. At KureBeach, there was 4 feet of vertical erosion against the boardwalk, leaving the strand narrower by40 feet. On the Outer Banks, more than 150,000 people (mostly tourists) evacuated back to themainland. Further south, well over 100,000 people evacuated to the west of I-95 and out ofharms way.
Outside the areas of greatest impact, Bertha's effects were much less dramatic. In South Carolina,the highest measured wind was at the downtown Charleston Handar with a peak gust of 58 mph. Higher peak gusts likely occurred along the barrier island beachfronts. No significant beacherosion occurred as the maximum tide departure occurred near the time of low tide. Rainfall wasgenerally between 1 and 2 inches. Widespread power outages occurred over North Carolina withas many as 250,000 customers without power in the eastern portions of the state. About 80,000people were evacuated in South Carolina and 20,000 in Georgia. Revenue losses due toevacuations of tourists and residents were estimated to be about $40 million. One persondrowned off Myrtle Beach in advance of the storm while attempting to surf the large waves andswells.
In Virginia, four tornadic storms associated with Bertha resulted in much of the damage acrosseastern portions of the state. The strongest tornado struck Northumberland County, Virginia, andresulted in nine injuries. Rainfall totals ranged from 3 to 6 inches on the Virginia Capes and thelower Maryland shore to 2 to 4 inches over inland sections of Virginia east of Interstate 95. Mostly minor to locally moderate tidal flooding and beach erosion occurred. Extensive poweroutages occurred over eastern Virginia, with as many as 115,000 customers without power in theeastern sections of the state. In the NWSO Wakefield, Virginia, county warning area (CWA),nearly 1,800 people were evacuated.
Inland portions of Delaware and Maryland experienced heavy rain and gusty winds from what wasnow Tropical Storm Bertha although the most significant impact was from several weaktornadoes. There was some attendant wind damage associated with the stronger thunderstorms inBertha's rain bands. The Patuxent River, Maryland, Naval Air Station recorded a gust of 48 mphand 4.03 inches of rain. Rainfall totals ranged from 4 to 4.5 inches along the western shore of theChesapeake Bay and 1 to 2.5 inches across metropolitan Washington, D.C. In Bertha's aftermath,
25
about 2,000 homes were without power in northern Virginia, 5,000 around the District ofColumbia and surrounding Maryland suburbs, and 10,000 in and around Baltimore.
In New Jersey, the most significant impact from Bertha was the heavy rain with 2- to 4-inch stormtotals common in coastal sections, with a few isolated reports greater than 6 inches. One suchreport was 6.69 inches in Estelle Manor, New Jersey. Generally, coastal and flash flooding werenot a problem although moderate wave action was responsible for one surfing fatality. HarveyCedars, New Jersey, reported a 63-mph gust with some downed trees and resultant poweroutages which were a consequence of the area's experiencing strong gusty winds and saturatedsoils.
On Long Island, winds gusted to 64 mph on Babylon Village, New York. Rainfall totals were ashigh as 4.65 inches at Pomona in Rockland County, New York. In New York City and LongIsland, rainfall amounts ranged from 0.76 inches in Quogue to 2.49 inches at Mt. Sinai (both onLong Island). Mostly minor to locally moderate beach erosion occurred.
In southern New England, most of Bertha's adverse effects were minimal and resulted in onlyminor coastal flooding. One strong band of convection, however, resulted in strong winds andnumerous power outages across Rhode Island and southeast Massachusetts. The highest reportedgust was 87 mph in New Bedford, Massachusetts. The maximum reported rainfall was7.20 inches at Billerica, Massachusetts. Rainfall totals exceeded 5 inches at several locations innorthern Rhode Island, northeast Connecticut and interior parts of eastern Massachusetts.
The remainder of New England essentially had to deal with the locally heavy rains associated withBertha's remnants. Total rainfall across the area was generally in the 2- to 4-inch range withlower amounts in northern Maine and northern New Hampshire. There were several reports ofwater over the roads in the areas covered by flood warnings, but no significant problems ordamage was reported. (See Appendix E for the Aerial Survey.)
Warning and Forecast Services
Timely hurricane watches and warnings were posted commensurate with the threat posed byBertha. However, intensity forecasts prior to landfall in North Carolina were not on target. Information from NHC indicated that Hurricane Bertha had weakened as she approached theNorth Carolina coast. The hurricane had been gradually weakening since its top speed of115 mph on July 9 to 81 mph on July 11. Then 12 hours before landfall, the estimated maximum1-minute winds increased to 104 mph. Information relayed to eastern North Carolina emergencymanagers mirrored information received from the NHC. Forecast wind speeds, especially inland,were too low.
Forecasts of sound-side flooding of the Outer Banks were based on a numerical model developedat North Carolina State University. The forecast based on the late afternoon advisory on July 11
26
called for a 6- to 8-foot surge. This forecast did not take into account decreasing wind speeds asBertha moved north through eastern North Carolina. As a result, the surge forecast was too high. Actual surges were on the order of 1 to 2 feet. South of this area from Cape Lookout to CapeFear, the storm surge was between 5 and 6 feet and was forecast to be between 4 and 6 feet.
Some lower Maryland Eastern Shore emergency managers expressed concern with the lack of aHurricane or Tropical Storm Watch north of the Hurricane Warning area. It was their feeling thata Watch would have afforded them the freedom to take action commensurate with the level ofthreat they perceived existed.
Further north, local NWSFO and NWSO products were excellent and accurately depicted thehazards posed by the now weakening tropical storm. Early on in the event, there was some initial forecast disagreement across southern New Hampshire. This was subsequently resolved by a jointtelephone call with the New Hampshire Office of Emergency Management by staffs at NWSFOsat Taunton, Massachusetts, and Gray, Maine. Generally, the accurate and timely NWS warningsand forecasts allowed customers both on land and water to adequately prepare for Bertha.
Internal and External Coordination
Internal NWS and external coordination during Bertha's passage through Eastern Region wentwell in most instances. Timely notification to Federal, state, county and local agencies wereinitiated by local NWS offices well in advance of the official watches and warnings. This ensuredthat users were well-prepared days in advance of the hurricane's impact.
External coordination was accomplished primarily via telephone. Some users in the heart ofBertha's path obtained information through a bulletin board system at NWSO Newport, NorthCarolina. The primary backup system at the NWSO, amateur radio operators, was used to gatherinformation but was not needed for coordination purposes since the telephone system did not fail.
Internal NWS coordination was accomplished primarily via telephone, the hurricane hotline, andAFOS.
Some user complaints were also received regarding the utility of the inland winds model. Asnoted earlier, this largely resulted from the forecast of strong inland winds in the NHC marineadvisory not reflecting observed conditions.
In northeast North Carolina, the hurricane revealed some coordination problems with regard tothe timely dissemination of important weather information between NWSO Wakefield, Virginia,and the emergency managers of the coastal counties within Wakefield’s CWA. The MIC andSOO met with the emergency managers and resolved these issues. Additionally, emergencymanagement officials stated they continue to have tight budgets and cannot afford NWWS. EMWIN was emphasized while the use of Internet and the bulletin board service was mentioned.
27
In North Carolina, some problems were noted regarding NHC initiated calls to the EMC. When ahurricane warning is posted for the North Carolina coast, the NWSFO Raleigh MIC and WCMbrief the state EMC in person when each new advisory is issued. State emergency managementofficials also call the NWSFO as appropriate, between visits by the MIC or WCM, to getintermediate updates on the hurricane's progress. NHC briefing calls frequently came at timeswhen state officials were already in the midst of a briefing by the NWSFO or with localemergency management officials along the coast.
At a number of NWS offices, HAM radio SKYWARN volunteers received and passed alonginformation. In at least one instance (NWSO Wilmington, North Carolina), Packet Radio wastheir primary communication device. Local emergency management officials with Packet Radiooften received the hurricane advisories and local office statements more than a half hour beforethey were received by other means. Additionally, the Packet Radio also provided them withDoppler (WSR-88D) radar images from the radar coded message product.
Data Collection and Communication
The coastal portion of the NWSO Morehead City, North Carolina, CWA is covered with datacollection devices ranging from ASOS sites, Datalogger, and DARDC wind equipment. Mostunits failed once power was lost. Amateur radio operators were used to gather informationthroughout the storm and proved to be NWSO Morehead City's most reliable data-gatheringsource. Generally, though, the sparsity of land and over water real-time observations proved onceagain to be an obstacle as Bertha slammed onshore and traversed through eastern North Carolina.
Local NWS office work on fine-tuning the WSR-88D rainfall estimates continued during Bertha. With the passage of each tropical system through the region, more radar data are helping localoffices to fine tune the most accurate reflectivity (Z-R) relationship to utilize. This will aidNWSFO/NWSO assessments of the (rainfall) flooding potential during future tropical systempassages.
WSR-88D level II, III, and IV data were archived by NWS offices in Bertha's path. Unfortunately, the archive level II data at NWSO Morehead City was inoperative throughout theevent. In addition, many NWSFOs and NWSOs archived upper level plots, surface observationsand model gridded data during the hurricane.
In North Carolina, the New Bern and Cape Hatteras NWR failed for a time as the hurricane wasreaching peak strength. This is a problem which the Region is attempting to minimize for futurehurricanes and other severe weather episodes through the use of NWS-owned and operateduninterruptible power supply and back-up generator equipment at NWR transmitter locations.
A number of offices noted a truncation of some of the more lengthy HLS on TWC. Moreover, itwas also noted that some of the NOWs were cut off at six, as opposed to eight lines. Obviously,
28
this premature truncation of the HLS and NOW will result in need-to-know information not beingpassed on to the viewer and as such needs to be resolved with TWC.
A telephone company problem led to the NWR's Blue Hill transmitter, which serves the GreaterBoston area, being off the air for several hours during the height of the storm. Additionally, theProvidence ASOS temperature and dew point sensor went out of service during Bertha's passagethrough the area.
User Response
User response was quite good. The successful evacuations and low casualty rates reflect thegrowing sophistication and team efforts of the NWS and the emergency management communityalthough a number of false perceptions as pertains to the hurricane's perceived threat linger.
Emergency management personnel in North Carolina are well trained and made the appropriateevacuation decisions. All used either the "HurrTrak" or "Hurrevac" computer software to aid intheir decision-making process. Conference calls that included all emergency managers as well asNWSO Morehead City and NWSO Wakefield personnel were initiated by the North CarolinaArea A Coordinator (includes northeastern North Carolina counties). Occasional conference callswere initiated by the Area C Coordinator (central and southeastern North Carolina counties).
The media and public responded quite well. Most tourists evacuated when ordered, however, themajority of the year-round residents remained on the North Carolina barrier islands.
Further north, the states of Maryland and Virginia were contacted after the event to assess theirreaction. Feedback from the state level was strongly positive. Some concern was expressed byone emergency manager on the Maryland Eastern Shore, regarding the NWS use of one of thehurricane break points during the event.
Just to the south of Bertha's greatest impact, individuals who were not allowed to return toevacuated areas immediately after the hurricane and subsequently saw only limited damage notedthat they would not evacuate when the next hurricane approached. This attitude is a continuingproblem that the NWS and FEMA will have to resolve in present and future educational outreachefforts.
Preparedness
The true measure of a warning program's effectiveness is the degree of response that the warningelicits from the public and local officials. The NWS must work closely with emergency managers,officials and the media to gain their trust and to ensure that their requirements for technical
29
information are met. Similarly, active public awareness campaigns conducted with local officialsand the media foster heightened awareness of hazards presented by hurricanes.
Numerous pre/early season hurricane preparedness activities were conducted throughout theRegion prior to Bertha making landfall in North Carolina and then moving up the east coast, ashort distance inland. Most individuals knew how to respond to Bertha's threat, and therebydemonstrated that NWS community preparedness/outreach efforts indeed paid off. It wasinteresting to note, however, that North Carolina Preparedness Week was scheduled in NorthCarolina for the week following Bertha’s passage. Needless to say, the week's activities werecanceled in lieu of the "real-life" experiences associated with this early season hurricane.
In South Carolina, working relations with local and state emergency managers are in excellentcondition thanks to regular South Carolina Hurricane Task Force meetings and workaccomplished through the local NWSO Charleston and NWSFO Columbia preparednessprograms. Similar actions at other Eastern Region coastal NWSFOs/NWSOs translated tosuccessful local preparedness efforts during the days leading up to Bertha's passage through theRegion.
During state conference calls, the state and local officials displayed reasonable expectations andasked pertinent questions of the local office NWS participants. These emergency managersseemed to understand well the role local NWSFO and NWSO offices play and used NWS-provided information to their full advantage.
Finally, Eastern Region NWSFOs and NWSOs were well prepared internally for Bertha withappropriate staffing changes initiated well in advance of the hurricane/tropical storm. Thisensured that local NWS offices were properly staffed to meet the challenges posed by thishurricane. Externally, shelters were opened where needed, and again, no preparedness problemswere noted.
A-1
Appendix A
Saffir-Simpson Hurricane Scale*
Category Definition—Likely Effects
ONE Winds 74-95 mph: No real damage to building structures. Damageprimarily to unanchored mobile homes, shrubbery, and trees. Also, somecoastal road flooding and minor pier damage.
TWO Winds 96-110 mph: Some roofing material, door, and window damage tobuildings. Considerable damage to vegetation, mobile homes, and piers. Small craft in unprotected anchorages break moorings.
THREE Winds 111-130 mph: Some structural damage to small residences andutility buildings with a minor amount of curtainwall failures. Mobile homesare destroyed. Flooding near the coast destroys smaller structures withlarger structures damaged by floating debris. Terrain may be flooded wellinland.
FOUR Winds 131-155 mph: More extensive curtainwall failures with somecomplete roof structure failure on small residences. Major erosion ofbeach areas. Major damage to lower floors of structures near the shore. Terrain may be flooded well inland.
FIVE Winds greater than 155 mph: Complete roof failure on many residencesand industrial buildings. Some complete building failures with small utilitybuildings blown over or away. Major damage to lower floors of allstructures located near the shoreline. Massive evacuation of residentialareas may be required.
In operational use, the scale corresponds to the 1-minute average sustained wind speed as*
opposed to gusts which could be 20 percent higher or more.
B-1
Appendix B
Meteorological Tables
C-1
Appendix C
Fujita Tornado Intensity Scale
Category Definition-Effective
(F0) Gale tornado (40-72 mph): Light damage. Some damage to chimneys; breakbranches off trees; push over shallow-rooted trees; damage sign boards.
(F1) Moderate tornado (73-112 mph): Moderate damage. The lower limit is thebeginning of hurricane wind speed; peel surface off roofs; mobile homes pushed offfoundations or overturned; moving autos pushed off the roads.
(F2) Significant tornado (113-157 mph): Considerable damage. Roofs torn offframe houses; mobile homes demolished; boxcars pushed over; large trees snappedor uprooted; light-object missiles generated.
(F3) Severe tornado (158-206 mph): Severe damage. Roofs and some walls torn offwell-constructed houses; trains overturned; most trees in forest uprooted; heavycars lifted off ground and thrown.
(F4) Devastating tornado (207-260 mph): Devastating damage. Well-constructedhouses leveled; structure with weak foundation blown off some distance; carsthrown and large missiles generated.
(F5) Incredible tornado (261-318 mph): Incredible damage. Strong frame houseslifted off foundations and carried considerable distance to disintegrate; automobilesized missiles fly through the air in excess of 100 yards; trees debarked; incrediblephenomena will occur.
D-1
Appendix D
Storm Prediction CenterTornado Watch Areas
OM
OM
E-1
Appendix E
Aerial Survey
Introduction
Hurricane Bertha struck the North Carolina coast on the afternoon and evening of July 12, 1996. I arrived in Wilmington, North Carolina, on Monday, July 15. During the afternoon of July 15, aflight was made on the NOAA Aircraft Operations Center (AOC) DeHavilland Twin Otter. Anaerial flight was made along the coastline from Cape Fear to Cape Lookout, North Carolina. This3 ½ hour flight was spent examining wind damage along the coast and intercostal waterway area.
On Tuesday, July 16, no flight was scheduled as U.S. Geological Survey was flying on a stormsurge mission. A ground survey of agricultural damage was conducted in the afternoon fromWilmington northward to just south of Warsaw, North Carolina.
Wednesday, July 17, a trip was made with the MIC and WCM of NWSO Wilmington to observethe damage at Carolina Beach and Kure Beach, North Carolina. Both locations lost piers. Therewere some structures with portions of roofs torn off, but most structures survived well. In theafternoon, another flight was made with the Twin Otter. This flight concentrated on inlanddamage from the hurricane. Damage was mainly confined to crops and trees and extended as farnorth as Goldsboro, North Carolina.
Coastal Damage
Wind damage was visible from the air from just north of Bald Head Island near Cape Fear toAtlantic Beach, south of Morehead City, North Carolina. The most intense damage with peakwind gusts estimated at 110 mph was located between North Topsail Beach and Emerald Isle,North Carolina. In this area, many beach homes suffered roof damage. The roof damage variedfrom torn off shingles to whole roofs lost. There were very few total failures to structures due towind. Of those that did fail, it appears they were modular home or mobile home structures.
Visible coastal erosion was found, especially to beach sand dunes and to a coastal road at NorthTopsail Beach. However, the damage was not as severe as in other recent landfalling hurricanes,such as Opal in 1995.
Further inland along the edge of the intercoastal waterway, the primary damage was to trees. Numerous trees fell with most falling in the area northeast of the eye from west of Surf Citynortheastward to just east of Swansboro, North Carolina. This area extended northward to the
E-2
southern portions of Jacksonville. Wind gusts in this area were estimated to be between 80 and100 mph.
Inland Agricultural Areas
Agricultural areas were particularly exposed to high winds from Hurricane Bertha. Much of thedamage was to corn and tobacco crops. Both of these crops are vulnerable to high wind gusts. Much of the agricultural damage was west of the eyewall rather than east. This is due in part tomuch of the corn and tobacco crops being grown further west rather than along the easterncoastal areas. The storm tracked slowly northward along the North Carolina and South Carolinacoastline before making landfall. Thus, crops were exposed to strong northeast winds for anextended period of time, and this caused crops to weaken significantly. The agricultural damageextended as far as 40 miles west of the eye and as far north as Goldsboro, North Carolina, whichis approximately 75 to 80 miles inland. Most of the damage occurred in unprotected (no blockageby trees or buildings) areas along the edge of fields. Some fields had more widespread damagewhere a streak of particularly high wind toppled several rows of corn or tobacco.
Tornadoes
The initial SPC log of tornadoes associated with Bertha indicated at least six touched down. Three of these reported tornadoes were investigated by air. There was no visible evidence oftornado damage in the three locations of New Bern, Newport, and near Winnabow, NorthCarolina. It is possible that some of these tornadoes either blended in with the hurricane damageor were not visible from the air. East of Jacksonville, North Carolina, a tornado track wasidentified from the air and was rated an F1 on the Fujita Tornado Intensity Scale (Appendix C)with a path length of approximately 1 ½ miles. The one area that a tornado most likely did notoccur was near Winnabow.
Conclusions and Acknowledgments
The most severe wind damage associated with Hurricane Bertha was along the coast and east ofthe eye center, typical of most hurricanes. The peak wind speeds estimated from the aerial surveywas 110 mph. Although damage to structures was minimal in this hurricane, agricultural damagewas extensive.
The author would like to thank the AOC and their fine pilots, Lieutenants Pickett andLongenecker. The author would also like to extend thanks to the Office of the FederalCoordinator for their help in making this survey possible and to Richard Anthony and TomMatheson from the NWSO Wilmington, North Carolina, for their assistance in conducting thesurvey.