Service level Benchmarks for Urban Transport Introduction The challenges of the urban sector in India are growing rapidly, and government agencies at various levels are taking steps to address the gaps in service delivery. One of the important steps towards this is introduction of appropriate systems for information management, performance monitoring, and benchmarking. Benchmarking is now well recognized as an important mechanism for introducing accountability in service delivery. It can help Urban Local Bodies (ULBs) and utilities in identifying performance gaps and effecting improvements through the sharing of information and best practices, ultimately resulting in better services to people. It provides • Common minimum framework for monitoring and reporting on service level benchmarks. • Guidelines on how to operationalize this framework in a phased manner. Ministry of Urban Development (MoUD) wants to address institutional and operational aspects for ensuring long term sustainability of the benchmarking activity. Accordingly all JNNURM mission cities are advised to undertake the process of service level benchmarking. In addition, the initiative will facilitate development of Performance Improvement Plans using information generated by the benchmarking exercise. It will address both, performance monitoring for internal decision making and reporting to higher levels of government and external stakeholders. Need System for measuring performance of urban transport activities and taking further action on them has not been institutionalized in urban agencies. It is therefore important that the
Transcript
Service level Benchmarks for Urban Transport
Introduction The challenges of the urban sector in India are growing rapidly, and government agencies at various levels are taking steps to address the gaps in service delivery. One of the important steps towards this is introduction of appropriate systems for information management, performance monitoring, and benchmarking. Benchmarking is now well recognized as an important mechanism for introducing accountability in service delivery. It can help Urban Local Bodies (ULBs) and utilities in identifying performance gaps and effecting improvements through the sharing of information and best practices, ultimately resulting in better services to people. It provides
• Common minimum framework for monitoring and reporting on service level benchmarks.
• Guidelines on how to operationalize this framework in a phased manner.
Ministry of Urban Development (MoUD) wants to address institutional and operational aspects for ensuring long term sustainability of the benchmarking activity. Accordingly all JNNURM mission cities are advised to undertake the process of service level benchmarking. In addition, the initiative will facilitate development of Performance Improvement Plans using information generated by the benchmarking exercise. It will address both, performance monitoring for internal decision making and reporting to higher levels of government and external stakeholders.
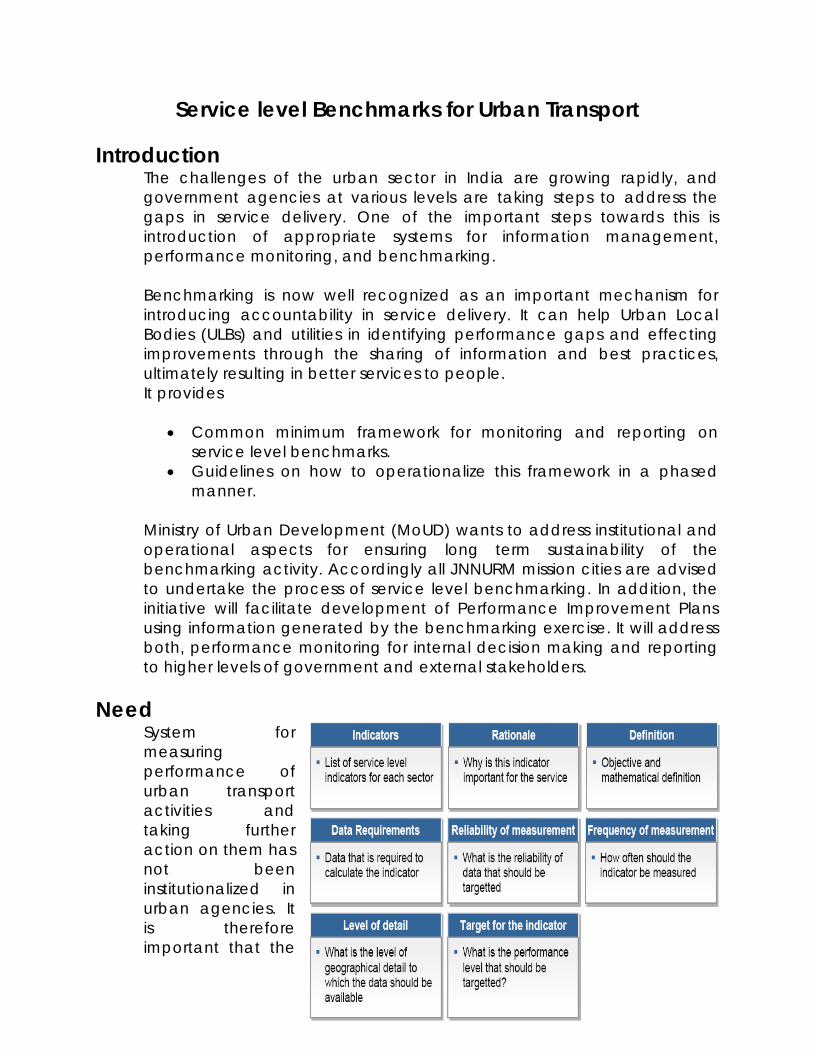
Need System for measuring performance of urban transport activities and taking further action on them has not been institutionalized in urban agencies. It is therefore important that the
basic minimum standard set of performance benchmarks are commonly understood and used by all stakeholders. Depending on the specific needs of a city, performance parameters can be defined and used to improve the quality of urban transport.
Objective and Approach
The following areas need to be focused for the assessment of overall level of service:
• Quality and Financial sustainability of a Public transport • Pedestrian / NMT safety and infrastructure facilities • ITS facilities in a city • Land use transport integration • Parking system and Pollution levels in a city
To facilitate comparison between cities and changes in performance over time, it is important that the performance levels are monitored against set benchmarks. It is in this context, that the MoUD has initiated an exercise to define Service Level Benchmarks (SLBs). Benchmarking is a long term process which involves a number of successive steps as shown in the ‘benchmarking wheel’ below.
. MoUD constituted a ‘Core Group’, comprising of experts from various institutions to arrive at the SLBs. Drawing on the experiences of various initiatives in measuring service level performance, the Core Group arrived at a set of performance benchmarks for urban transport. After much deliberation, the benchmarks, their definitions, means of measurement, frequency and reporting, etc. were finalized. The Handbook on Service Level Benchmarks is a ready reckoner of sorts to enable ULBs and other city level parastatal agencies implement systems for measuring, reporting and monitoring the SLBs.
Performance Benchmarks for urban transport
Service level performance benchmarks have been identified for the following areas of intervention:
a. Public Transport in a city b. Pedestrian Infrastructure facilities c. Non Motorized Transport facilities d. Usage of Integrated Transport System (ITS) facilities e. Travel speed along major corridors f. Road Safety g. Availability of Parking facilities h. Pollution levels i. Land Use Transport Integration j. Financial Sustainability of Public Transport
The parameters highlight the performance as would be monitored by the ‘Urban Local Bodies’ / ‘Development Authority’. These performance measurements will need to be carried out by the service delivery agencies themselves, reported to higher levels of management and also disseminated widely. Clear definitions and methodologies are expected to eliminate bias in measurement and reporting. Typically, four levels of service (LOS) have been specified, viz. ‘1’, ‘2’, ‘3’, and ‘4’ with ‘1’ being highest LOS and ‘4’ being lowest to measure each identified performance benchmark . Therefore, the goal is to attain the service level 1.
Role of different stakeholders The role of different stakeholders and the next steps they will need to pursue are briefly mentioned below. a) Central Government: The Ministry of Urban Development, Government
of India will take the lead disseminating these service level performance benchmarks. Further SLBs will also be institutionalized through the Jawaharlal Nehru National Urban Renewal Mission (JNNURM) and other programmes of this Ministry through more ways than one, viz.
• SLBs will be an integral part of City Development Planning processes, both for assessment of current situation, and for setting targets under their plans.
• Where ever appropriate, SLBs will be dovetailed with the commitment on reforms, and subsequent process of appraisal of reforms
• The relevant SLBs should be part of Detailed Project Reports for related projects in urban transport. The DPR should indicate both the current situation and what change the project will bring about to increase the level of service (LOS). Subsequent process of monitoring the implementation of the project will examine this change in LOS. .
• Under the JNNURM, support may be extended to enable ULBs to establish systems in their respective institutions for periodic measurement, reporting and analysis of SLBs.
b) State Governments and its agencies: State Governments and its nodal
agencies in the urban sector have a critical role in driving performance of ULBs. State Government will need to periodically examine the SLBs as an input for its decisions related to policy, resource allocations, providing incentives and penalties, channelising technical and manpower support SLBs will also be an important input to State Finance Commissions in the course of their work.
c) Urban Local Bodies: ULBs are the most important stakeholders for
institutionalization of SLBs. As service delivery institutions, ULBs will find it useful to institutionalize systems for performance management using SLBs. Benchmarking with other cities within the State, or with similar cities would facilitate a healthy competitive environment for continuous improvement. The Directorate of Local Bodies / Department of Municipal Administration will need to play a key role in this process through constant inter-city comparisons.
Performance Management System
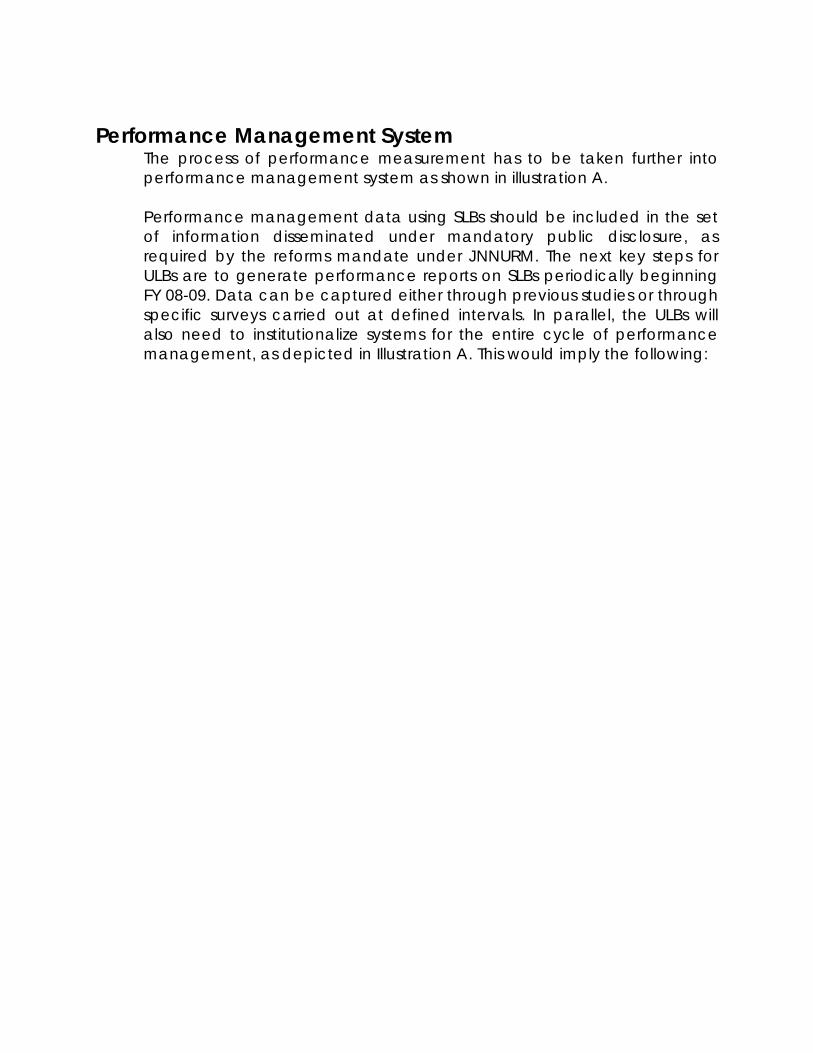
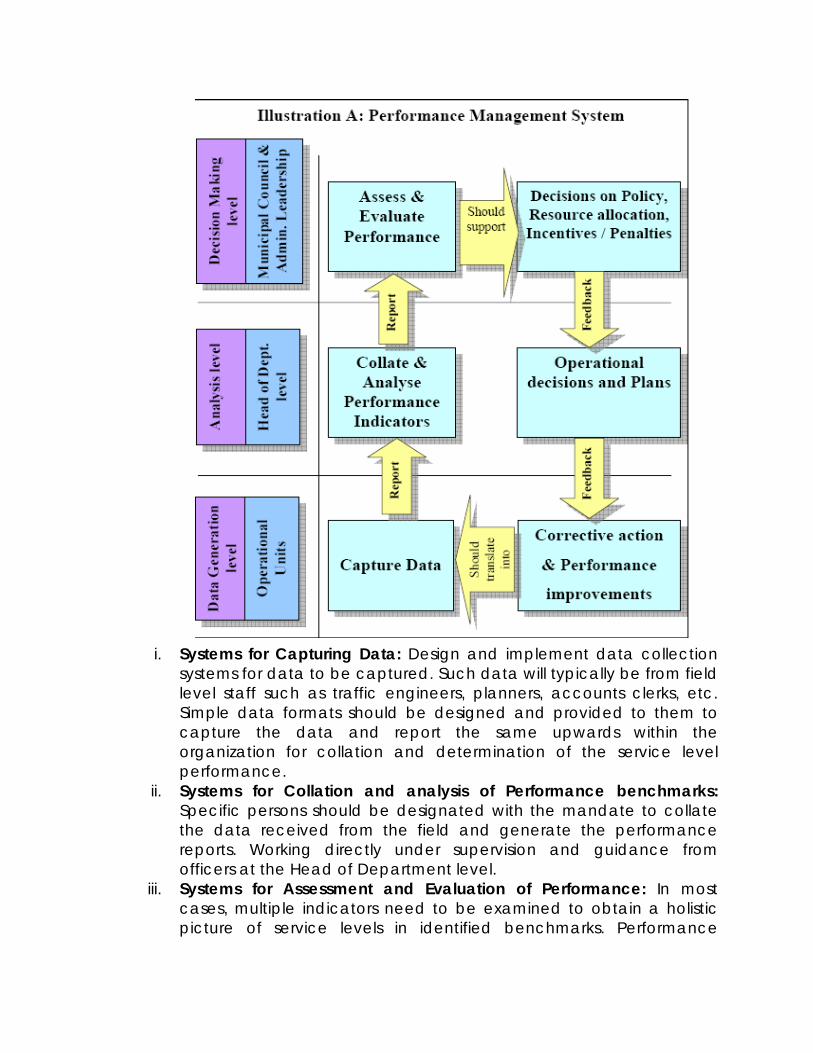
The process of performance measurement has to be taken further into performance management system as shown in illustration A. Performance management data using SLBs should be included in the set of information disseminated under mandatory public disclosure, as required by the reforms mandate under JNNURM. The next key steps for ULBs are to generate performance reports on SLBs periodically beginning FY 08-09. Data can be captured either through previous studies or through specific surveys carried out at defined intervals. In parallel, the ULBs will also need to institutionalize systems for the entire cycle of performance management, as depicted in Illustration A. This would imply the following:
i. Systems for Capturing Data: Design and implement data collection systems for data to be captured. Such data will typically be from field level staff such as traffic engineers, planners, accounts clerks, etc. Simple data formats should be designed and provided to them to capture the data and report the same upwards within the organization for collation and determination of the service level performance.
ii. Systems for Collation and analysis of Performance benchmarks: Specific persons should be designated with the mandate to collate the data received from the field and generate the performance reports. Working directly under supervision and guidance from officers at the Head of Department level.
iii. Systems for Assessment and Evaluation of Performance: In most cases, multiple indicators need to be examined to obtain a holistic picture of service levels in identified benchmarks. Performance
benchmarks reported by department level should be closely examined at the management level of the ULB.
iv. Systems for decision making: All ULBs do have systems for decision making; however, many decisions end up being considered in the absence of quality data. To address such gaps, systems such as - periodically tabling the performance reports in the Council / to the Standing Committees should be instituted.
v. Systems for Operational decisions and plans: Decisions and plans will need to be periodically reviewed in light of the performance achieved. Additional capital inflow and revenue expenditure may be required. A process of annually review and follow-up of decisions will need to be instituted.
Limitations and Challenges
It is recognized that this initiative has a number of limitations. Performance management in ULBs is being triggered from the Central Government, however, the acceptance and capacity at the State and city levels is what will sustain this initiative. While this handbook has attempted to address issues of definition and methodology for the SLBs, it is anticipated that a number of complexities will arise in the course of actual implementation. The possible challenges will include:
• Extensive surveys would be required for each SLB • Collection of secondary information from the various sources as the
same may not be readily available on its usable format. • Available of staff with adequate technical knowledge to carry out
the analysis. • The entire loop of performance management will be sustainable
only if - disclosure, reporting, monitoring and performance management feedback, incentives and disincentives are also brought into the cycle. Else the system of measurement and disclosure of SLBs may not sustain itself.
Standardization of Service Level Benchmark
With a view to the definition and computation methodology of the selected SLBs, the following details have been provided: a. Title, Units and Definition: The specific name, the unit of measurement
in which the performance is to be measured, and definition for the bencmarks is provided.
b. Data requirements: The specific surveys and area which need to be covered for each benchmark are given in the following table:
SLB Area to be covered Primary Survey Required
Public Transport Key public transport corridors along the city
• Boarding Alighting • Passenger count
Pedestrian Infrastructure facilities
Arterial roads / major roads / Key Public transport corridors along the city
• Pedestrian count • Measurement of intensity of
street light by lux meter • Footpath length having
minimum width of 1.2m or more
Non Motorized Transport facilities
Arterial roads / major roads / Key Public transport corridors along the city
• Dedicated NMV track having minimum width of 1.5m or more
• Measurement of parking area on Cycle track
• Signalized Intersection count Usage of Integrated Transport System (ITS) facilities
City Municipal area / Planning boundary
• Count of Signalized intersections, bus stops, terminals, metro stations etc
Travel speed along major corridors
Arterial roads / major roads / Key Public transport corridors along the city
• Speed and delay • Journey time of bus
Road Safety City Municipal area / Planning boundary
• Collect the total number of fatalities recorded in road accidents within city limits in the given calendar year
Availability of Parking facilities
Arterial roads / Collector roads/ major roads / Key Public transport corridors along the city
• Parking survey
Pollution levels City Municipal area / Planning boundary • Pollution level
Land Use Transport Integration
City Municipal area / Planning boundary
• Land use observation survey (land use and Building height)
Financial Sustainability of Public Transport
Arterial roads / major roads / Key Public transport corridors along the city
• Number of Buses in a city
c. Rationale for the benchmark: For each performance benchmark, the
overall significance and rationale for assessing and monitoring has been provided. The benchmark value has been specified in all cases.
d. Reliability of measurement: The performance assessment can be scaled on reliability wherein casually collected information from secondary sources would result in lowest level of reliability (D) and information collected by conducting detailed survey on the field would qualify as being the highest / preferred level of reliability (A).
e. Frequency of measurement: For each benchmark, the minimum frequency at which the performance should be measured is annually. The same can then be reported at the same frequency.
f. Jurisdiction of measurement: This refers to the geographic jurisdiction for which performance should be measured. The Jurisdiction area for measurement is as follows:
i. Class 1 cities – Planning Boundary ii. Class 2 and 3 cities - Municipal area boundary
Structure
Section 1: Service level Benchmark – This section provide details regarding each of selected SLBs such as Quality of available data, effort required in data collection and significance of the benchmark. Section 2: Performance Report Card- It provides the sample of performance reports of Service level benchmarks that each ULBs can use to set and track their performance improvement.
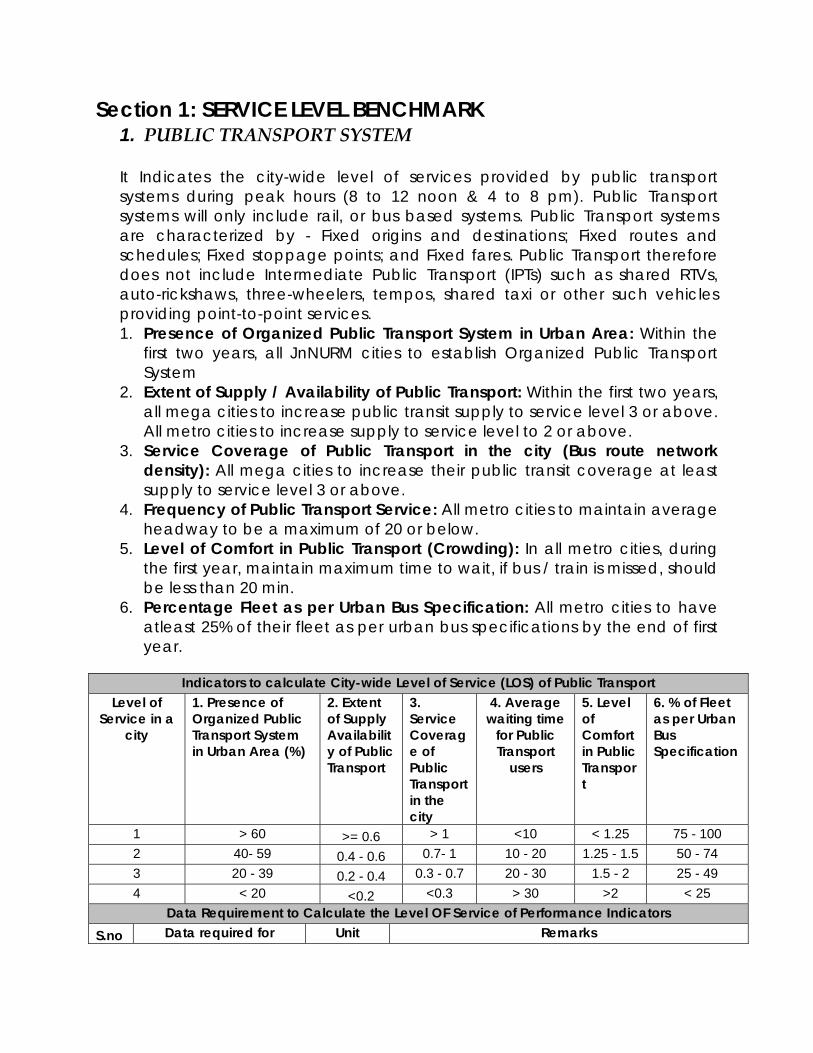
Section 1: SERVICE LEVEL BENCHMARK 1. PUBLIC TRANSPORT SYSTEM
It Indicates the city-wide level of services provided by public transport systems during peak hours (8 to 12 noon & 4 to 8 pm). Public Transport systems will only include rail, or bus based systems. Public Transport systems are characterized by - Fixed origins and destinations; Fixed routes and schedules; Fixed stoppage points; and Fixed fares. Public Transport therefore does not include Intermediate Public Transport (IPTs) such as shared RTVs, auto-rickshaws, three-wheelers, tempos, shared taxi or other such vehicles providing point-to-point services. 1. Presence of Organized Public Transport System in Urban Area: Within the
first two years, all JnNURM cities to establish Organized Public Transport System
2. Extent of Supply / Availability of Public Transport: Within the first two years, all mega cities to increase public transit supply to service level 3 or above. All metro cities to increase supply to service level to 2 or above.
3. Service Coverage of Public Transport in the city (Bus route network density): All mega cities to increase their public transit coverage at least supply to service level 3 or above.
4. Frequency of Public Transport Service: All metro cities to maintain average headway to be a maximum of 20 or below.
5. Level of Comfort in Public Transport (Crowding): In all metro cities, during the first year, maintain maximum time to wait, if bus / train is missed, should be less than 20 min.
6. Percentage Fleet as per Urban Bus Specification: All metro cities to have atleast 25% of their fleet as per urban bus specifications by the end of first year.
Indicators to calculate City-wide Level of Service (LOS) of Public Transport
Level of Service in a
city
1. Presence of Organized Public Transport System in Urban Area (%)
2. Extent of Supply Availability of Public Transport
3. Service Coverage of Public Transport in the city
Data Requirement to Calculate the Level OF Service of Performance Indicators S.no Data required for Unit Remarks
calculating the indicator
1. Presence of Organized Public Transport System in Urban Area
a) Calculate the total number of buses in the city
No. Total number of buses operating on road
b)
Calculate the total number of buses under the ownership of STU/SPV or under concession agreement.
No.
Organized Public Transport may be identified as that which is run by a company or SPV formulated specifically for the operation of public transport within the city or under concession agreement. The intercity bus services would not be included as part of urban public transport operations
c) Presence of Public Transport System in Urban Area (%)
% Calculate= [b / a]*100. Compute LOS as mentioned in indicator 1 i.e. Presence of Public Transport System in Urban Area (%)
2. Availability of Public Transport
a) No of Buses/ train coaches available in a city on any day
No.
This should indicate the number of vehicles operating on road, which may be lower than the number of vehicles owned by the utility or that authorized to ply. Daily average values over a time period of a month may be considered.
b) Total Population of the city No.
Current population should be considered. Past census figures should be used as base, and annual growth rate should then be used to arrive at current population.
c) Availability of Public transport per 1000 population.
Ratio Calculate= [a / b]. Compute LOS as mentioned in indicator 2 i.e. Availability of Public Transport
3. Service Coverage of Public Transport in the city
a)
Total length in route kms of the corridors along with public transport systems ply in the city.
route kms
Total length of the corridor within the urban limits should be considered. Corridors along which the service frequency is one hour or less should only be considered. Public transport systems may be road or rail or water based, and include public or private transport service providers.
b) Area of the urban limits of the city.
Area in sq. kms
Area of the urban limits should be considered. This may correspond the urban limits demarcated by the development authority / metropolitan area, or any other such urban planning agency which need to be covered by public transport. This need not be restricted to municipal boundaries.
c) Service Coverage route kms / sq. km
Calculate = [a / b]. Compute LOS as mentioned in indicator 3 i.e. Service coverage [route bus road length per sq.km of area]
4. Average waiting time for Public Transport users
a) Delineate the key corridors for public transport in the city.
No.
With help of city maps, routes of all public transport corridors should be plotted. Identify the key routes of public transport in the city (R1, R2, …. Rn) which covers the whole city.
b) Average waiting time for Public Transport users - survey to be carried out on each of the identified bus
routes during morning & evening peak hour and off
peak hour in both directions.
Min Collect the data on the waiting time in minutes for all the passengers boarding the bus of each route.
Min From the data collected, calculate the average waiting time for that particular route. Repeat the exercise for all the selected routes.
%
Create a frequency distribution of average waiting time of all routes for the LOS categories mentioned in indicator 4. Average waiting time for Public Transport users and calculate the cumulative frequency, where it crosses 50% mark, take that range as the LOS for indicator. Example: say the frequency distribution for the average waiting time is < 10 = 20%, 10-20 = 15%, 20-30 = 30% and > 30 = 35%. in this case the cumulative frequency crosses 50% mark at 20-30min range. Therefore the LOS for the indicator is 20-30min, which is 3.
c) Average waiting time for Public Transport users
1 / 2 / 3 / 4
Compute LOS as mentioned in indicator 4 i.e. Average waiting time for Public Transport users
5. Level of Comfort in Public Transport
a) Identification of key nodes / traffic origin points
No.
With help of city maps, routes of all public transport corridors should be plotted. Identify the key routes of public transport in the city (R1, R2, …. Rn) which covers the whole city.
b) Passenger count on bus at key identified routes No.
Passenger count survey should be carried out on bus of each identified route during morning & evening peak hour and off peak hour in both directions.
c) Seats available in the bus Count the number of seats available in a bus of each
identified route.
d) Passenger comfort- Load factor (passengers per seat)
1 / 2 / 3 / 4
Calculate= [b / c] for each route and calculate the average load factor of all routes and compute LOS as mentioned in indicator 5 i.e. Level of Comfort in Public Transport
6. % of Fleet as per Urban Bus Specification
a) Total number of buses in the city No. Calculate the total number of buses in the city
b) Total number of buses as per urban bus specification in the city
No. Calculate the total number of buses as per urban bus specification (Urban bus specification given in website :urbanindia.nic.in"
c) % of Fleet as per Urban Bus Specification %
Calculate [b / a * 100 ]. Compute LOS as mentioned in indicator 6 i.e. % of Fleet as per Urban Bus Specification
THE OVERALL LEVEL OF SERVICE OF PUBLIC TRANSPORT The overall Level of Service of Public Transport can be calculating by adding the LOS values received for each of the indicator identified above. Overall LOS of Public Transport = (LOS1 + LOS2 + LOS3 + LOS4 + LOS5 + LOS6)
Overall Level of Service
Calculated LOS Comments
1 < 12 The City has a good public transport system which is wide spread and
easily available to the citizens. The system provided is comfortable and overall sustainable.
2 12 - 16
The City has an public transport system which may need considerable improvements in terms of supply of buses/ coaches and coverage as many parts of the city are nor served by it. the frequency of the services available need improvements. The system provided is comfortable and sustainable
3 17 - 20
The City has a public transport system which may not need considerable improvements in terms of supply of buses / coaches and coverage as most parts of the city are nor served by it. the frequency of the services available need improvements. The system provided is not comfortable as there is considerable over loading and sustainability is dependent on the fare box revenue.
4 21-24 The city lacks an public transport system Reliability of measurement
Reliability Scale Description of method Lowest level of reliability
(D) Based on some information collated from secondary sources.
Intermediate level ( C ) Only information collected from city authorities / different agencies without any checks.
Intermediate level (B) Only surveys are undertaken
Highest/preferred level of reliability (A)
All the data for above mentioned performance parameters is collected / measured as mentioned above. Field observers should be properly trained, data formats provided, and observations be properly tabulated. Population data should be from Census records. Actual surveys are undertaken which are either carried out by or verified by the independent agencies.
2. AVAILABILITY OF PEDESTRIAN FACILITIES It indicates the percentage of road length along the arterial and major road network or Public Transport corridors and at intersection that has adequate barrier free pedestrian facilities. The indicators to calculate the adequate pedestrian facilities are as follows:
1. Signalized intersection delay (s / pedestrian): All metro cities to target
level of service 2 2. Street Lighting (Lux): All metro cities to target level of service 2 3. % of City Covered with footpaths (wider than 1.2 mtrs): All metro cities to
target level of service 2.
Indicators to calculate City-wide Level of Service (LOS) of Pedestrian facility
Level of Service 1) Signalized intersection delay ( s/ pedestrian)
Data Requirement to Calculate the Level oF Service of Performance Indicators
S.No Data required for calculating the
indicator Unit Remarks
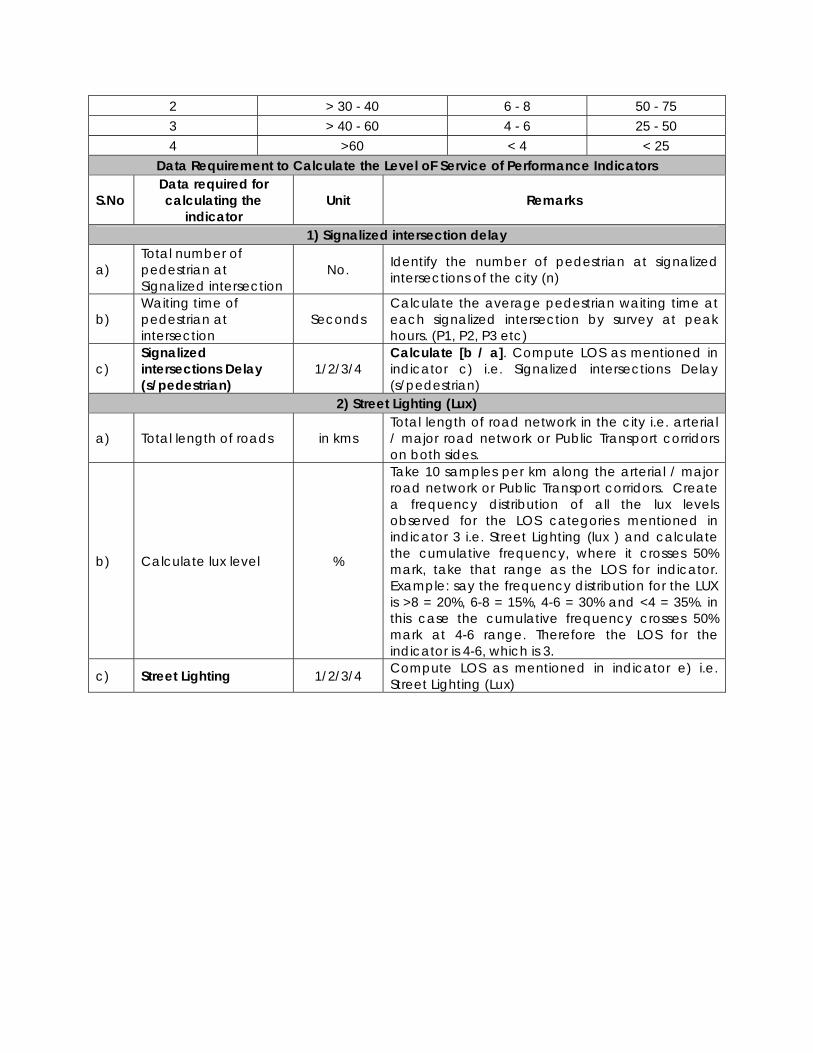
1) Signalized intersection delay
a) Total number of pedestrian at Signalized intersection
No. Identify the number of pedestrian at signalized intersections of the city (n)
b) Waiting time of pedestrian at intersection
Seconds Calculate the average pedestrian waiting time at each signalized intersection by survey at peak hours. (P1, P2, P3 etc)
c) Signalized intersections Delay (s/pedestrian)
1/2/3/4 Calculate [b / a]. Compute LOS as mentioned in indicator c) i.e. Signalized intersections Delay (s/pedestrian)
2) Street Lighting (Lux)
a) Total length of roads in kms Total length of road network in the city i.e. arterial / major road network or Public Transport corridors on both sides.
b) Calculate lux level %
Take 10 samples per km along the arterial / major road network or Public Transport corridors. Create a frequency distribution of all the lux levels observed for the LOS categories mentioned in indicator 3 i.e. Street Lighting (lux ) and calculate the cumulative frequency, where it crosses 50% mark, take that range as the LOS for indicator. Example: say the frequency distribution for the LUX is >8 = 20%, 6-8 = 15%, 4-6 = 30% and <4 = 35%. in this case the cumulative frequency crosses 50% mark at 4-6 range. Therefore the LOS for the indicator is 4-6, which is 3.
c) Street Lighting 1/2/3/4 Compute LOS as mentioned in indicator e) i.e. Street Lighting (Lux)
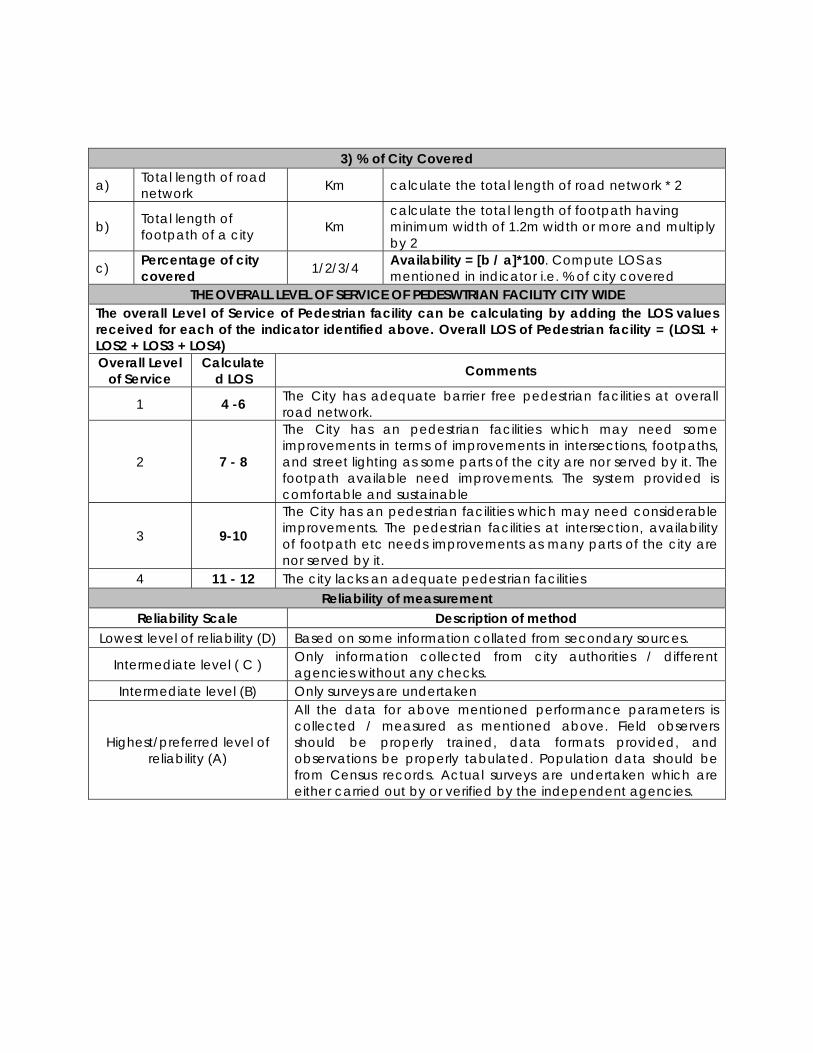
3) % of City Covered
a) Total length of road network Km calculate the total length of road network * 2
b) Total length of footpath of a city Km
calculate the total length of footpath having minimum width of 1.2m width or more and multiply by 2
c) Percentage of city covered 1/2/3/4 Availability = [b / a]*100. Compute LOS as
mentioned in indicator i.e. % of city covered THE OVERALL LEVEL OF SERVICE OF PEDESWTRIAN FACILITY CITY WIDE
The overall Level of Service of Pedestrian facility can be calculating by adding the LOS values received for each of the indicator identified above. Overall LOS of Pedestrian facility = (LOS1 + LOS2 + LOS3 + LOS4) Overall Level
of Service Calculate
d LOS Comments
1 4 -6 The City has adequate barrier free pedestrian facilities at overall road network.
2 7 - 8
The City has an pedestrian facilities which may need some improvements in terms of improvements in intersections, footpaths, and street lighting as some parts of the city are nor served by it. The footpath available need improvements. The system provided is comfortable and sustainable
3 9-10
The City has an pedestrian facilities which may need considerable improvements. The pedestrian facilities at intersection, availability of footpath etc needs improvements as many parts of the city are nor served by it.
4 11 - 12 The city lacks an adequate pedestrian facilities Reliability of measurement
Reliability Scale Description of method Lowest level of reliability (D) Based on some information collated from secondary sources.
Intermediate level ( C ) Only information collected from city authorities / different agencies without any checks.
Intermediate level (B) Only surveys are undertaken
Highest/preferred level of reliability (A)
All the data for above mentioned performance parameters is collected / measured as mentioned above. Field observers should be properly trained, data formats provided, and observations be properly tabulated. Population data should be from Census records. Actual surveys are undertaken which are either carried out by or verified by the independent agencies.
3. AVAILABILITY OF NON MOTORIZED VEHICLE (NMV) FACILITIES
Indicates the percentage of dedicated cycle track / lane along the arterial & collector road network or public transport corridors with a minimum of 1.5 m width. It is characterized by Continuous length, encroachment on NMV lanes, and parking facilities. The indicators to calculate the adequate NMV facilities are as follows:
1. Presence of NMV Track: All JnNURM cities to have NMV tracks on all major roads.
2. NMV Coverage (% network covered): At least 25% network. 3. Encroachment on NMV roads by Vehicle Parking (%): More than 30% NMV
network to be free of encroachment. 4. NMV parking facilities at Interchanges (%): Create NMV parking near all
terminals.
1. Presence of NMV track in Urban Area 1 Available
1. Presence of NMV Track 2 Not Available
Indicators to calculate City-wide Overall Level of Service (LOS) of Non Motorized facilities (NMV)
Data Requirement to Calculate the Level OF Service of Performance Indicators
S.No Data required for calculating the
indicator Unit Remarks
2. % of city covered
a) Total length of road network KM calculate the total length of road network
b) Total Length of NMT network KM calculate the total length of NMV network
c) % of city covered 1/2/3/4 Calculate = [ b / a]*100. Compute LOS as mentioned in indicator 2 i.e. % of city covered
3. Encroachment on NMV roads by Vehicle Parking (%)
a) Total length of the Parking on Cycle Track KM Calculate Total road length where Parking on Cycle
Track is present
b) Total length of NMT network KM calculate the total length of NMT network
c) % of on street parking on cycle track 1/2/3/4 Calculate = [ a / b]*100. Compute LOS as mentioned
in indicator 4 i.e. Encroachment on NMV roads by
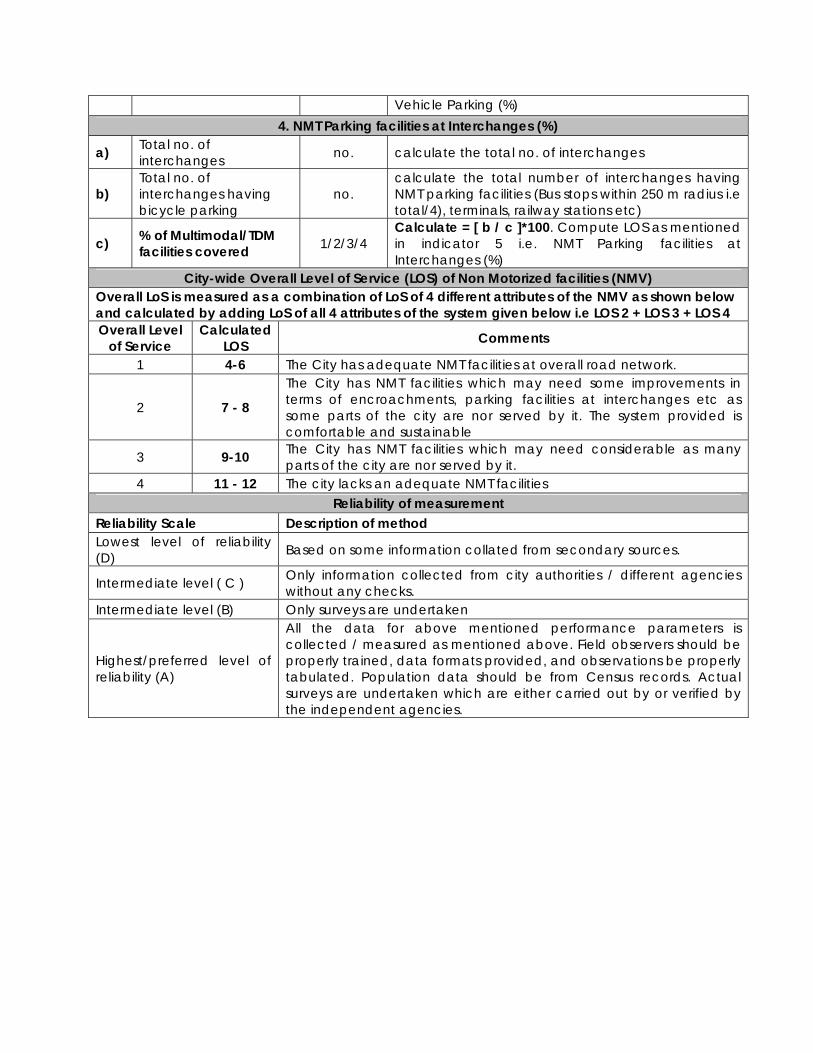
Vehicle Parking (%) 4. NMT Parking facilities at Interchanges (%)
a) Total no. of interchanges no. calculate the total no. of interchanges
b) Total no. of interchanges having bicycle parking
no. calculate the total number of interchanges having NMT parking facilities (Bus stops within 250 m radius i.e total/4), terminals, railway stations etc)
c) % of Multimodal/TDM facilities covered 1/2/3/4
Calculate = [ b / c ]*100. Compute LOS as mentioned in indicator 5 i.e. NMT Parking facilities at Interchanges (%)
City-wide Overall Level of Service (LOS) of Non Motorized facilities (NMV) Overall LoS is measured as a combination of LoS of 4 different attributes of the NMV as shown below and calculated by adding LoS of all 4 attributes of the system given below i.e LOS 2 + LOS 3 + LOS 4 Overall Level
of Service Calculated
LOS Comments
1 4-6 The City has adequate NMT facilities at overall road network.
2 7 - 8
The City has NMT facilities which may need some improvements in terms of encroachments, parking facilities at interchanges etc as some parts of the city are nor served by it. The system provided is comfortable and sustainable
3 9-10 The City has NMT facilities which may need considerable as many parts of the city are nor served by it.
4 11 - 12 The city lacks an adequate NMT facilities Reliability of measurement
Reliability Scale Description of method Lowest level of reliability (D) Based on some information collated from secondary sources.
Intermediate level ( C ) Only information collected from city authorities / different agencies without any checks.
Intermediate level (B) Only surveys are undertaken
Highest/preferred level of reliability (A)
All the data for above mentioned performance parameters is collected / measured as mentioned above. Field observers should be properly trained, data formats provided, and observations be properly tabulated. Population data should be from Census records. Actual surveys are undertaken which are either carried out by or verified by the independent agencies.
4. Level of Usage of Intelligent Transport System (ITS) facilities ITS refers to efforts to add information and communications technology to transport infrastructure and vehicles in an effort to manage factors that typically are at odds with each other, such as vehicles, loads, and routes to improve safety and reduce vehicle wear, transportation times and fuel consumption. The indicators to calculate the ITS facilities used by Public transport and Intermediate public transport (IPT) in the city are:
1. Availability of Traffic Surveillance System: In all Metro Cities, all rapid transit stations and all transit terminals will be equipped with CCTVs (Year-1).
2. Passenger Information System (PIS): In all Metro Cities, all rapid transit stations and all transit terminals will be equipped with PIS system (Year-1).
3. Usage of Global Positioning System: In all JnNURM cities, all new transit vehicles will be equipped with GPS systems (Year-1). Older transit vehicles in these cities will be covered with GPS system in Year 2. Intermediate public transport systems will be covered with GPS in the years 3 to 5.
4. Signal Synchronization: In all metro cities, in the first 2 years, all the junctions on major roads will be signalized and synchronization will be undertaken (50% in year1 and 50% in year 2).
5. Integrated Ticketing System: In all metro cities, all public transit systems and sub-systems will be covered Automatic Ticketing System in the next 3 years (in a phased manner). All cities with rapid transit systems (Metro/BRT) to introduce integrated ticketing system during the next 3 years (To include integration of ticketing between sub-systems and parking).
Indicators to calculate City-wide Level of Service (LOS) of Intelligent Transport System (ITS)
Data Requirement to Calculate the Level OF Service of Performance Indicators
S.No Data required for calculating the indicator Unit Remarks
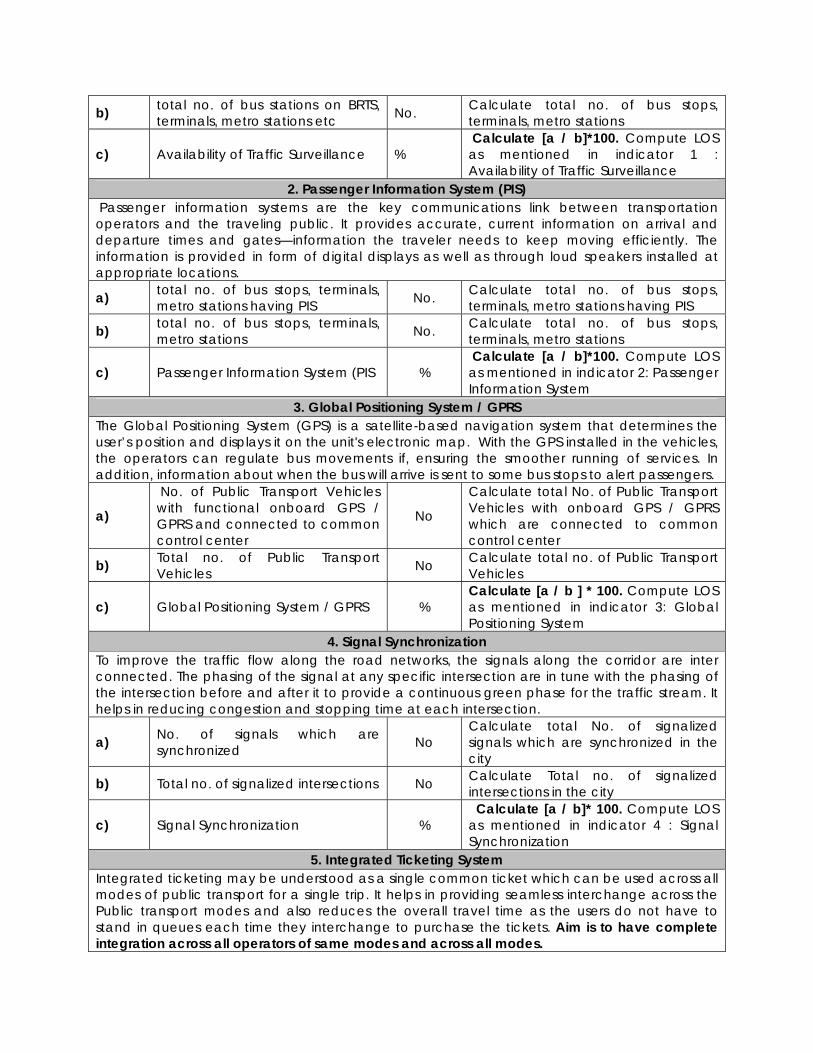
1. Availability of Traffic Surveillance Detection of movement of persons for the purpose of security, incidence management and also to get real time information regarding pedestrian flow.
a) total no. of bus stations on BRTS, terminals, metro stations having CCTVs
No. Calculate total no. of bus stops, terminals, metro stations having CCTVs
b) total no. of bus stations on BRTS, terminals, metro stations etc No. Calculate total no. of bus stops,
terminals, metro stations
c) Availability of Traffic Surveillance % Calculate [a / b]*100. Compute LOS as mentioned in indicator 1 : Availability of Traffic Surveillance
2. Passenger Information System (PIS) Passenger information systems are the key communications link between transportation operators and the traveling public. It provides accurate, current information on arrival and departure times and gates—information the traveler needs to keep moving efficiently. The information is provided in form of digital displays as well as through loud speakers installed at appropriate locations.
a) total no. of bus stops, terminals, metro stations having PIS No. Calculate total no. of bus stops,
terminals, metro stations having PIS
b) total no. of bus stops, terminals, metro stations No. Calculate total no. of bus stops,
terminals, metro stations
c) Passenger Information System (PIS % Calculate [a / b]*100. Compute LOS as mentioned in indicator 2: Passenger Information System
3. Global Positioning System / GPRS The Global Positioning System (GPS) is a satellite-based navigation system that determines the user’s position and displays it on the unit's electronic map. With the GPS installed in the vehicles, the operators can regulate bus movements if, ensuring the smoother running of services. In addition, information about when the bus will arrive is sent to some bus stops to alert passengers.
a)
No. of Public Transport Vehicles with functional onboard GPS / GPRS and connected to common control center
No
Calculate total No. of Public Transport Vehicles with onboard GPS / GPRS which are connected to common control center
b) Total no. of Public Transport Vehicles No Calculate total no. of Public Transport
Vehicles
c) Global Positioning System / GPRS % Calculate [a / b ] * 100. Compute LOS as mentioned in indicator 3: Global Positioning System
4. Signal Synchronization To improve the traffic flow along the road networks, the signals along the corridor are inter connected. The phasing of the signal at any specific intersection are in tune with the phasing of the intersection before and after it to provide a continuous green phase for the traffic stream. It helps in reducing congestion and stopping time at each intersection.
a) No. of signals which are synchronized No
Calculate total No. of signalized signals which are synchronized in the city
b) Total no. of signalized intersections No Calculate Total no. of signalized intersections in the city
c) Signal Synchronization % Calculate [a / b]* 100. Compute LOS as mentioned in indicator 4 : Signal Synchronization
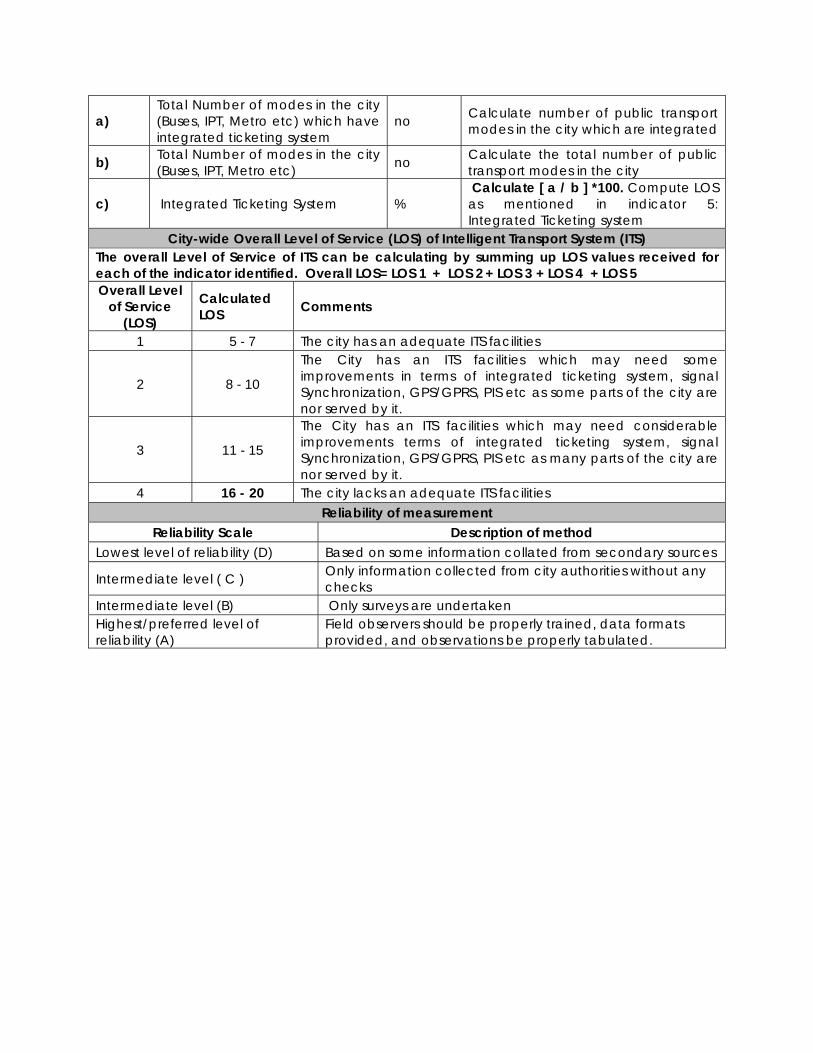
5. Integrated Ticketing System Integrated ticketing may be understood as a single common ticket which can be used across all modes of public transport for a single trip. It helps in providing seamless interchange across the Public transport modes and also reduces the overall travel time as the users do not have to stand in queues each time they interchange to purchase the tickets. Aim is to have complete integration across all operators of same modes and across all modes.
a) Total Number of modes in the city (Buses, IPT, Metro etc) which have integrated ticketing system
no Calculate number of public transport modes in the city which are integrated
b) Total Number of modes in the city (Buses, IPT, Metro etc) no Calculate the total number of public
transport modes in the city
c) Integrated Ticketing System % Calculate [ a / b ] *100. Compute LOS as mentioned in indicator 5: Integrated Ticketing system
City-wide Overall Level of Service (LOS) of Intelligent Transport System (ITS) The overall Level of Service of ITS can be calculating by summing up LOS values received for each of the indicator identified. Overall LOS= LOS 1 + LOS 2 + LOS 3 + LOS 4 + LOS 5 Overall Level
of Service (LOS)
Calculated LOS Comments
1 5 - 7 The city has an adequate ITS facilities
2 8 - 10
The City has an ITS facilities which may need some improvements in terms of integrated ticketing system, signal Synchronization, GPS/GPRS, PIS etc as some parts of the city are nor served by it.
3 11 - 15
The City has an ITS facilities which may need considerable improvements terms of integrated ticketing system, signal Synchronization, GPS/GPRS, PIS etc as many parts of the city are nor served by it.
4 16 - 20 The city lacks an adequate ITS facilities Reliability of measurement
Reliability Scale Description of method Lowest level of reliability (D) Based on some information collated from secondary sources
Intermediate level ( C ) Only information collected from city authorities without any checks
Intermediate level (B) Only surveys are undertaken Highest/preferred level of reliability (A)
Field observers should be properly trained, data formats provided, and observations be properly tabulated.
5. TRAVEL SPEED (MOTORIZED AND MASS TRANSIT) ALONG MAJOR CORRIDORS This level of service provides an indication of effective travel time or speed of Public or private vehicles by taking into account indications of congestion or traffic density. This level of service is along corridors, and not indicative of overall level of service from origin to destination. Level of service (LoS) may be measured along key corridors and then aggregated for the city. - Year 1 target is to arrest worsening of the situation in the initial period - Subsequently target to improve the service conditions to a reasonable level Level of Service is defined in terms of average travel speed of all through vehicles on the key corridors. It is strongly influenced by the number of vehicles along the corridor, number of signals per kilometer and the average intersection delay.
Indicators to calculate City-wide Level of Service (LOS) of Traffic Density
Data Requirement to Calculate the Level of Service of Performance Indicators
S.No Data required for calculating the indicator Unit Remarks
1. Travel speed of Personal vehicles along key corridors
a)
Delineate the key corridors of road traffic (personal vehicle) in the city.
No.
Identify the key corridors using motorized transport in the city (C1, C2, …. Cn). These corridors may be within the city, or moving radially outwards.
b) Compute running time on the key corridors
This can be determined by either through field data using the Moving observer method. The given equation to determine the average speed along the arterial can be represented by the equation:- Arterial Speed in kmph= (3,600 x length)/ [(Running time per km in seconds x Length) + Total intersection approach delay]. Where 3,600 is the conversion factor of second into hours. The speeds should be observed during peak hours on working days and an average of the peak hour speeds for each corridor should be used for determining the
LOS.
c) Level of Service for personal vehicle along each corridor
1 / 2 / 3 / 4
On the basis of characterization of Level of Service mentioned above, determine the LoS along each corridor. The LoS along the corridors may be denoted as say LoS1 for C1, LoS2 for C2, .... LoSn for Cn
d) Weights of each corridor based on volume of personal traffic
Ratio
Weightages of each corridor should be determined on basis of length of the corridor as share of the total length (say W1 for C1, W2 for C2, W3 for C3, …. Wn for Cn)
e) City-wide Level of Service of motorized vehicles 1 / 2 / 3 / 4
Computed as weighted aggregate of Level of Service density i.e. = [(W1*LoS1) + (W2*LoS2) + …….. (Wn*LoSn)], rounded off to the next whole number
2. Travel speed of Public Transport along key corridors
a) Delineate the key corridors of public transport in the city.
No. Identify the key corridors using public transport in the city (C1, C2, …. Cn). These corridors may be within the city, or moving radially outwards.
b) Compute running time on the key corridors Compute (Destination time - Origin Time ) of
Public Transport corridors
c) Level of Service for public transport along each corridor
1 / 2 / 3 / 4
On the basis of characterization of Level of Service mentioned above, determine the LoS along each corridor. The LoS along the corridors may be denoted as:-say LoS1 for C1, LoS2 for C2, .... LoSn for Cn
d) Weights of each corridor based on volume of passengers
Ratio
Weightage of each corridor should be determined on basis of length the corridor as share of the total length (say W1 for C1, W2 for C2, W3 for C3, …. Wn for Cn)
e) City-wide Level of Service of motorized vehicles 1 / 2 / 3 / 4
Computed as weighted aggregate of Level of Service density i.e. = [(W1*LoS1) + (W2*LoS2) + …….. (Wn*LoSn)], rounded off to the next whole number
THE OVERALL LEVEL OF SERVICE OF TRAVEL SPEED CITY WIDE The overall Level of Service of travel speed can be calculating by adding the LOS values
received for each of the indicator identified above. Overall LOS = (LOS1 + LOS2) Overall Level
of Service Calculated
LOS Comments
1 2 -3 Primarily free flow- operations at average travel speeds usually about 70% of the free flow speed for the key corridors
2 3 -4 Small increase in flow may cause substantial increases in approach delay and hence, decrease in arterial speed.
3 4 -6
Significant approach delays and average travel speed of 1/3 of free flow speed or lower. Such operations are caused by some combination or adverse progression, high signal density, extensive queuing at critical intersections and inappropriate signal timing.
4 6 -8
Key corridors at extremely low speeds below 1/3 to 1/4 of the free flow speed. Intersection congestion is likely at critical signalized locations, with high approach delays resulting. Adverse progression is frequently a contributor to this condition.
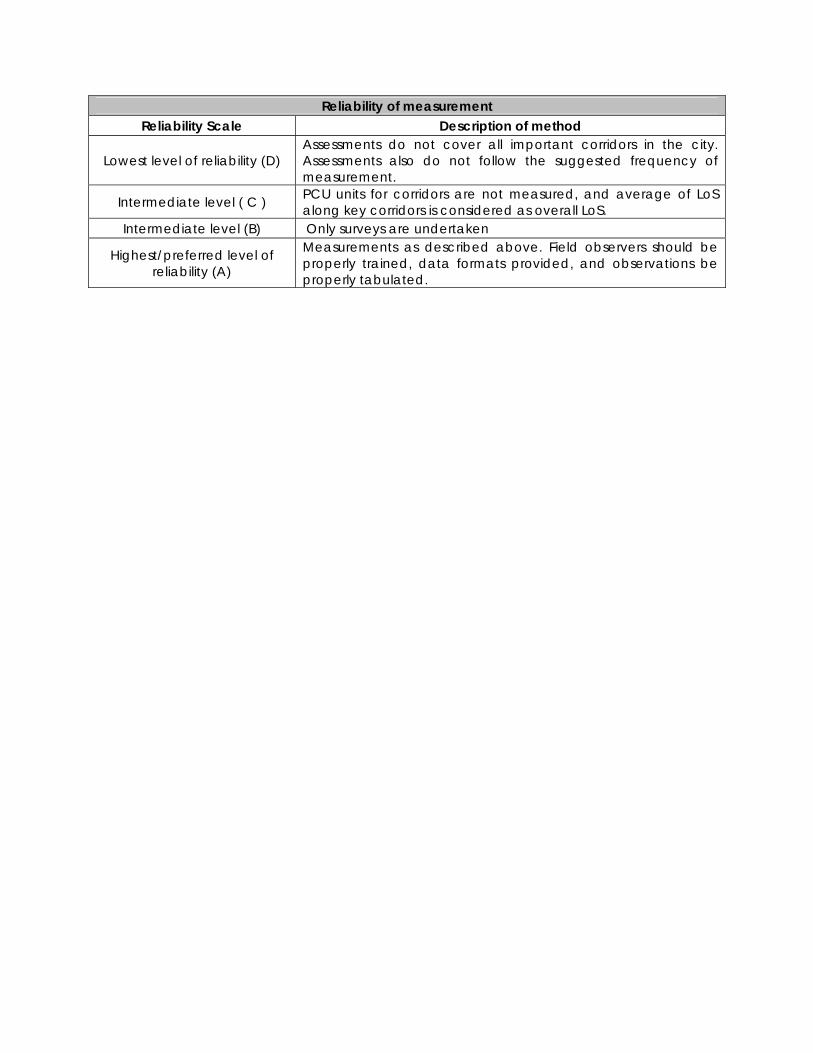
Reliability of measurement Reliability Scale Description of method
Lowest level of reliability (D) Assessments do not cover all important corridors in the city. Assessments also do not follow the suggested frequency of measurement.
Intermediate level ( C ) PCU units for corridors are not measured, and average of LoS along key corridors is considered as overall LoS.
Intermediate level (B) Only surveys are undertaken
Highest/preferred level of reliability (A)
Measurements as described above. Field observers should be properly trained, data formats provided, and observations be properly tabulated.
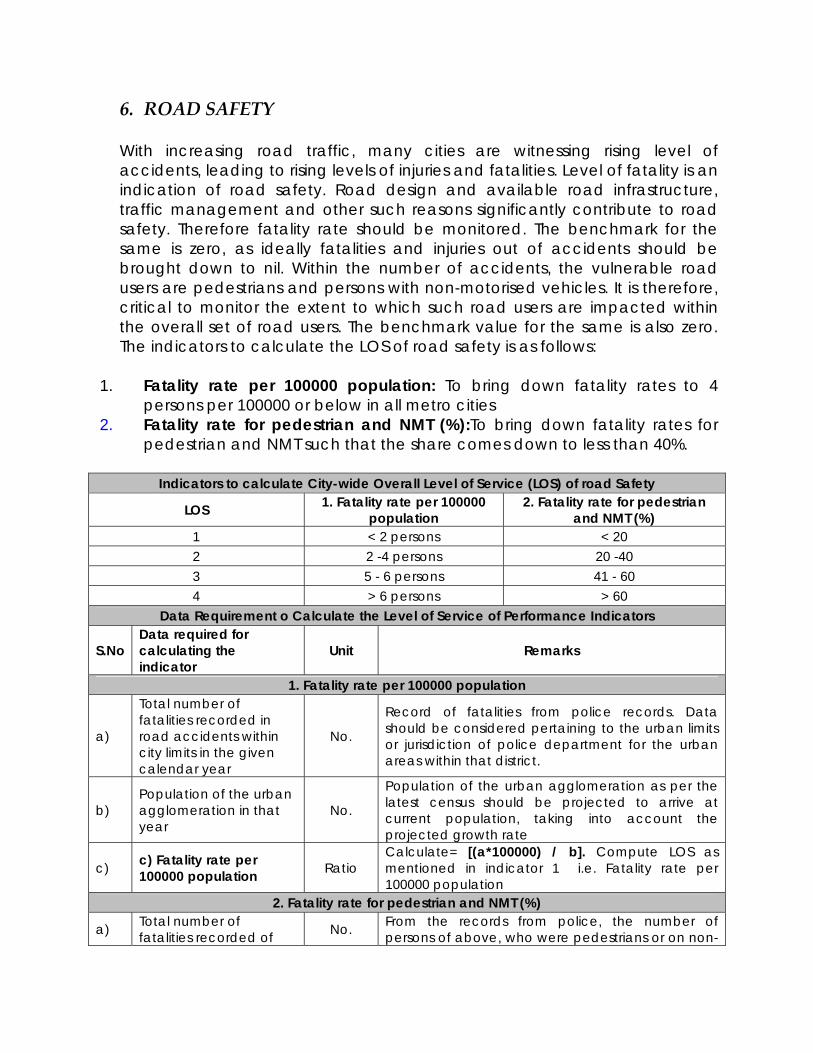
6. ROAD SAFETY
With increasing road traffic, many cities are witnessing rising level of accidents, leading to rising levels of injuries and fatalities. Level of fatality is an indication of road safety. Road design and available road infrastructure, traffic management and other such reasons significantly contribute to road safety. Therefore fatality rate should be monitored. The benchmark for the same is zero, as ideally fatalities and injuries out of accidents should be brought down to nil. Within the number of accidents, the vulnerable road users are pedestrians and persons with non-motorised vehicles. It is therefore, critical to monitor the extent to which such road users are impacted within the overall set of road users. The benchmark value for the same is also zero. The indicators to calculate the LOS of road safety is as follows:
1. Fatality rate per 100000 population: To bring down fatality rates to 4
persons per 100000 or below in all metro cities 2. Fatality rate for pedestrian and NMT (%):To bring down fatality rates for
pedestrian and NMT such that the share comes down to less than 40%.
Indicators to calculate City-wide Overall Level of Service (LOS) of road Safety
Data Requirement o Calculate the Level of Service of Performance Indicators
S.No Data required for calculating the indicator
Unit Remarks
1. Fatality rate per 100000 population
a)
Total number of fatalities recorded in road accidents within city limits in the given calendar year
No.
Record of fatalities from police records. Data should be considered pertaining to the urban limits or jurisdiction of police department for the urban areas within that district.
b) Population of the urban agglomeration in that year
No.
Population of the urban agglomeration as per the latest census should be projected to arrive at current population, taking into account the projected growth rate
c) c) Fatality rate per 100000 population Ratio
Calculate= [(a*100000) / b]. Compute LOS as mentioned in indicator 1 i.e. Fatality rate per 100000 population
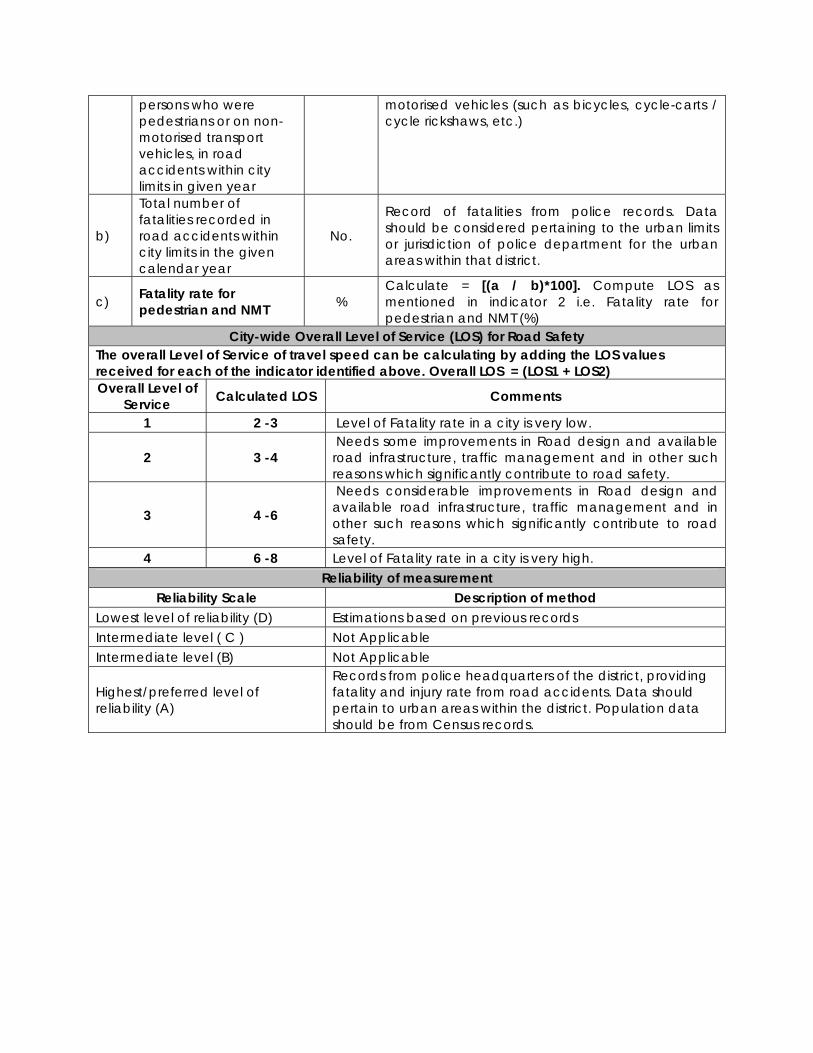
2. Fatality rate for pedestrian and NMT (%)
a) Total number of fatalities recorded of No. From the records from police, the number of
persons of above, who were pedestrians or on non-
persons who were pedestrians or on non-motorised transport vehicles, in road accidents within city limits in given year
motorised vehicles (such as bicycles, cycle-carts / cycle rickshaws, etc.)
b)
Total number of fatalities recorded in road accidents within city limits in the given calendar year
No.
Record of fatalities from police records. Data should be considered pertaining to the urban limits or jurisdiction of police department for the urban areas within that district.
c) Fatality rate for pedestrian and NMT %
Calculate = [(a / b)*100]. Compute LOS as mentioned in indicator 2 i.e. Fatality rate for pedestrian and NMT (%)
City-wide Overall Level of Service (LOS) for Road Safety The overall Level of Service of travel speed can be calculating by adding the LOS values received for each of the indicator identified above. Overall LOS = (LOS1 + LOS2) Overall Level of
Service Calculated LOS Comments
1 2 -3 Level of Fatality rate in a city is very low.
2 3 -4 Needs some improvements in Road design and available road infrastructure, traffic management and in other such reasons which significantly contribute to road safety.
3 4 -6
Needs considerable improvements in Road design and available road infrastructure, traffic management and in other such reasons which significantly contribute to road safety.
4 6 -8 Level of Fatality rate in a city is very high. Reliability of measurement
Reliability Scale Description of method Lowest level of reliability (D) Estimations based on previous records Intermediate level ( C ) Not Applicable Intermediate level (B) Not Applicable
Highest/preferred level of reliability (A)
Records from police headquarters of the district, providing fatality and injury rate from road accidents. Data should pertain to urban areas within the district. Population data should be from Census records.
7. AVAILABILITY OF PARKING SPACES It indicates the restriction of free parking spaces for all vehicles in a city. The indicators to calculate the parking facilities are as follows: 1. Availability of paid public parking spaces (%): To cover at least 50% of on
street public parking spaces under ‘paid parking’ 2. Difference in Maximum and Minimum Parking Fee in the City: To keep
maximum and minimum parking fee difference to at least 2:1.
Indicators to calculate City-wide Overall Level of Service (LOS)
LOS 1. Availability of on street paid public parking spaces (%)
2. Difference in Maximum and Minimum Parking Fee in the City
Data Requirement o Calculate the Level of Service of Performance Indicators
S.No Data required for calculating the indicator Unit Remarks
1. Availability of paid public parking spaces
a)
Total available on street paid parking spaces in (Equivalent Car Spaces) ECS allotted for all vehicles
ECS Total available on street paid parking spaces= number of parking spaces for (cars x1 + two wheelers x 0.25)
b)
Total available on street parking spaces in (Equivalent Car Spaces) ECS allotted for all vehicles
ECS Total available on street Parking Spaces= number of parking spaces for (cars x1 + two wheelers x 0.25)
c) Availability of paid public parking spaces %
Calculate = [a / b] * 100. Compute LOS as mentioned in indicator 1 i.e. Availability of paid public parking spaces (%)
2. Difference in Maximum and Minimum Parking Fee in the City In the CBD of the city, the land is generally available at a premium, which makes it difficult to provide for organized parking spaces in these areas. One of the management measures for reducing parking demand in the CBD is high parking charges, which discourages the use of private vehicles. The parking fee being charge by private parking operators may also be considered.
a) Maximum parking fee being charged per 10 hours in the city
Rs A very high premium is being charged for land in CBD
b) Minimum parking fee being charged per 10 hours in the city
Rs Some premium is being charged for land in CBD
c) No of parking spaces in Cars under the Maximum parking fee
No. Very Nominal premium is being charged for land in the CBD
d) No of Parking Spaces in No. No premium is being charged for land in the
Cars under the minimum parking Fee
CBD
e) Ratio of Maximum to Minimum Fare Ratio
Calculate = (a x c) / (b x d). Compute LOS as mentioned in indicator 2 i.e. Difference in Maximum and Minimum Parking Fee in the City.
City-wide Overall Level of Service (LOS) for Parking in the City The City wide LOS is derived by adding the LOS of Availability of paid public parking spaces and LOS of difference in maximum and minimum parking fee. = LOS 1 + LOS 2
Level of Service
Parking City Wide Comments
1 <2 Paid parking spaces are available in the city and the demand is well managed by incorporating differential parking rates for the CBD.
2 2 - 4
Paid parking spaces are available in the city and the demand is well managed by incorporating differential parking rates for the CBD. However some improvements may be required
3 4 - 6
Paid parking spaces provided in the city need to be improved upon and to cater to the demand some differential parking rates for the CBD have been adopted. The city authorities need to imitative considerable improvements measures.
4 6 - 8 The city authorities need to initiate immediate actions with respect to providing paid parking spaces and demand management for parking. Reliability of measurement
Reliability Scale Description of method
Lowest level of reliability (D) The parking capacities have been estimated as per the information from secondary source
Intermediate level ( C ) Parking capacity is based on information from concerned offices only and no survey has been conducted for validation
Intermediate level (B) Parking capacity is measured from field surveys only and not verified from concerned offices
Highest/preferred level of reliability (A)
Parking capacity should be measured by proper field surveys, and marked on maps to scale. Latest data from concerned offices of RTO should be collected.
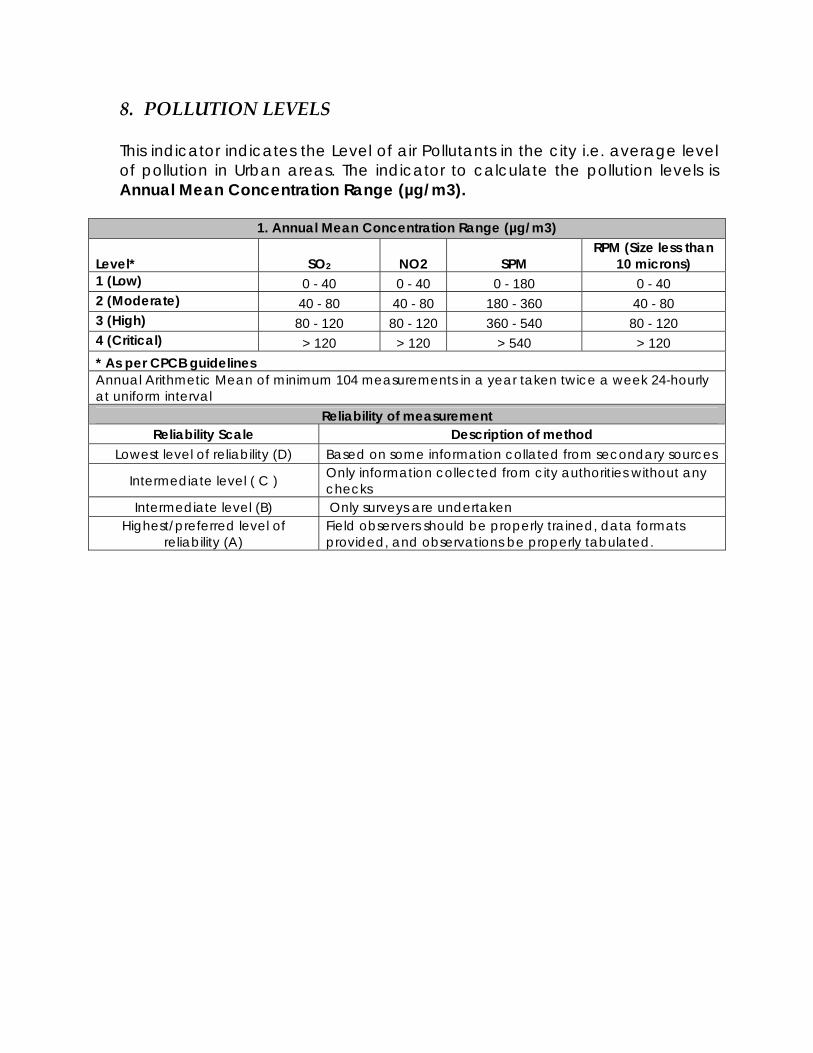
8. POLLUTION LEVELS This indicator indicates the Level of air Pollutants in the city i.e. average level of pollution in Urban areas. The indicator to calculate the pollution levels is Annual Mean Concentration Range (µg/m3).
1. Annual Mean Concentration Range (µg/m3)
Level* SO2 NO2 SPM RPM (Size less than
10 microns) 1 (Low) 0 - 40 0 - 40 0 - 180 0 - 40 2 (Moderate) 40 - 80 40 - 80 180 - 360 40 - 80 3 (High) 80 - 120 80 - 120 360 - 540 80 - 120 4 (Critical) > 120 > 120 > 540 > 120 * As per CPCB guidelines Annual Arithmetic Mean of minimum 104 measurements in a year taken twice a week 24-hourly at uniform interval
Reliability of measurement Reliability Scale Description of method
Lowest level of reliability (D) Based on some information collated from secondary sources
Intermediate level ( C ) Only information collected from city authorities without any checks
Intermediate level (B) Only surveys are undertaken Highest/preferred level of
reliability (A) Field observers should be properly trained, data formats provided, and observations be properly tabulated.
9. INTEGRATED LANDUSE‐TRANSPORT SYSTEM
It Indicates the effectiveness of land use-transport arrangements and Identify the level of Land use transport integration expected to result in overall trip reduction and mode shift in favor of public transit The indicators to calculate the Land use transport integration is as follows:
1. Population Density - Gross (Persons/Developed area in hact) 2. Mixed Landuse on Major Transit Corridors/Network (%) 3. Intensity of Development - City (F.S.I (Floor Space Index - Master Plan/DP) 4. Intensity of development- Ratio of FSI on Transit corridor to city FSI 5. Pattern and Completeness of the network 6. Road Network Density (Kms/Sq.kms) 7. Percentage network having exclusive ROW for Transit network
Cities with deficiencies in the above aspects will, in their Master Plan/Development Plan, attempt to improve LOS to 2 or above.
Indicators to calculate (LOS) of Integrated land use Transport System Level of
Service in a city
1. Population Density - Gross (Persons/Developed area in hact.)
2. Mixed Land-use on Major Transit Corridors / Network (%)
3. Intensity of Development - City (F.S.I (Floor Space Index - Master Plan/DP)
4. Intensity of development- Ratio of FSI on Transit corridor to city FSI
5. Pattern and Completeness of the network
6. Road Network Density (Kms / Sq.kms)
7. %ge network having exclusive ROW for Transit network
1 >175 >30 > 2 >3
Clear pattern (ring-radial or grid-iron) and complete network
>11 >3
2 150-175 15-30 1.5-2.0 2-3
clear pattern (ring-radial or grid-iron) but not complete network
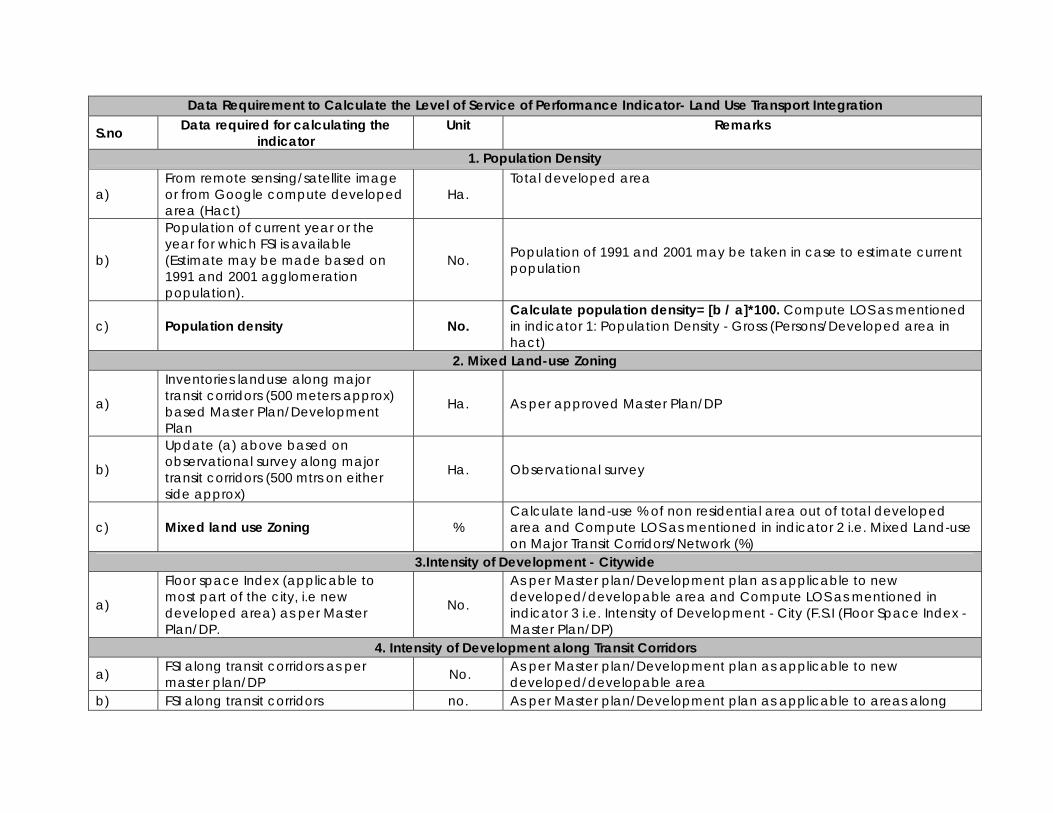
Data Requirement to Calculate the Level of Service of Performance Indicator- Land Use Transport Integration
S.no Data required for calculating the indicator
Unit Remarks
1. Population Density
a) From remote sensing/satellite image or from Google compute developed area (Hact)
Ha. Total developed area
b)
Population of current year or the year for which FSI is available (Estimate may be made based on 1991 and 2001 agglomeration population).
No. Population of 1991 and 2001 may be taken in case to estimate current population
c) Population density No. Calculate population density= [b / a]*100. Compute LOS as mentioned in indicator 1: Population Density - Gross (Persons/Developed area in hact)
2. Mixed Land-use Zoning
a)
Inventories landuse along major transit corridors (500 meters approx) based Master Plan/Development Plan
Ha. As per approved Master Plan/DP
b)
Update (a) above based on observational survey along major transit corridors (500 mtrs on either side approx)
Ha. Observational survey
c) Mixed land use Zoning % Calculate land-use % of non residential area out of total developed area and Compute LOS as mentioned in indicator 2 i.e. Mixed Land-use on Major Transit Corridors/Network (%)
3.Intensity of Development - Citywide
a)
Floor space Index (applicable to most part of the city, i.e new developed area) as per Master Plan/DP.
No.
As per Master plan/Development plan as applicable to new developed/developable area and Compute LOS as mentioned in indicator 3 i.e. Intensity of Development - City (F.S.I (Floor Space Index - Master Plan/DP)
4. Intensity of Development along Transit Corridors
a) FSI along transit corridors as per master plan/DP No. As per Master plan/Development plan as applicable to new
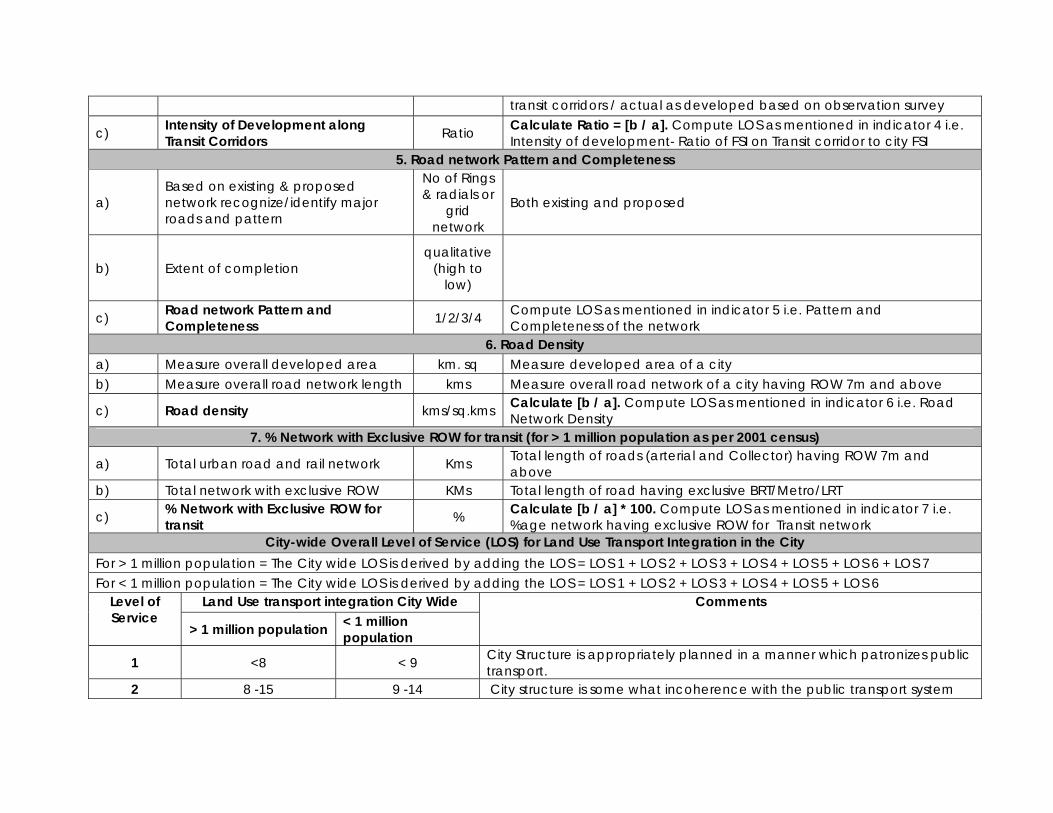
developed/developable area b) FSI along transit corridors no. As per Master plan/Development plan as applicable to areas along
transit corridors / actual as developed based on observation survey
c) Intensity of Development along Transit Corridors Ratio Calculate Ratio = [b / a]. Compute LOS as mentioned in indicator 4 i.e.
Intensity of development- Ratio of FSI on Transit corridor to city FSI 5. Road network Pattern and Completeness
a) Based on existing & proposed network recognize/identify major roads and pattern
No of Rings & radials or
grid network
Both existing and proposed
b) Extent of completion qualitative
(high to low)
c) Road network Pattern and Completeness 1/2/3/4 Compute LOS as mentioned in indicator 5 i.e. Pattern and
Completeness of the network 6. Road Density
a) Measure overall developed area km. sq Measure developed area of a city b) Measure overall road network length kms Measure overall road network of a city having ROW 7m and above
c) Road density kms/sq.kms Calculate [b / a]. Compute LOS as mentioned in indicator 6 i.e. Road Network Density
7. % Network with Exclusive ROW for transit (for > 1 million population as per 2001 census)
a) Total urban road and rail network Kms Total length of roads (arterial and Collector) having ROW 7m and above
b) Total network with exclusive ROW KMs Total length of road having exclusive BRT/Metro/LRT
c) % Network with Exclusive ROW for transit % Calculate [b / a] * 100. Compute LOS as mentioned in indicator 7 i.e.
%age network having exclusive ROW for Transit network City-wide Overall Level of Service (LOS) for Land Use Transport Integration in the City
For > 1 million population = The City wide LOS is derived by adding the LOS = LOS 1 + LOS 2 + LOS 3 + LOS 4 + LOS 5 + LOS 6 + LOS 7 For < 1 million population = The City wide LOS is derived by adding the LOS = LOS 1 + LOS 2 + LOS 3 + LOS 4 + LOS 5 + LOS 6
Land Use transport integration City Wide Level of Service
> 1 million population < 1 million population
Comments
1 <8 < 9 City Structure is appropriately planned in a manner which patronizes public transport.
2 8 -15 9 -14 City structure is some what incoherence with the public transport system
3 16 - 22 15 - 20 Faint coherence between city structure and public transport system
4 22- 28 21 - 24 Inconsistency in the city structure and public transport system leading to leaser ridership and high dependence on personalized motor vehicles
Reliability of measurement Reliability Scale Description of method
Lowest level of reliability (D)
Based on some information collated from secondary sources.
Intermediate level ( C ) Only information collected from city authorities / different agencies without any checks. Intermediate level (B) Only surveys are undertaken Highest/preferred level of reliability (A)
All the data for above mentioned performance parameters is collected / measured as mentioned above. Field observers should be properly trained, data formats provided, and observations be properly tabulated. Population data should be from Census records. Actual surveys are undertaken which are either carried out by or verified by the independent agencies.
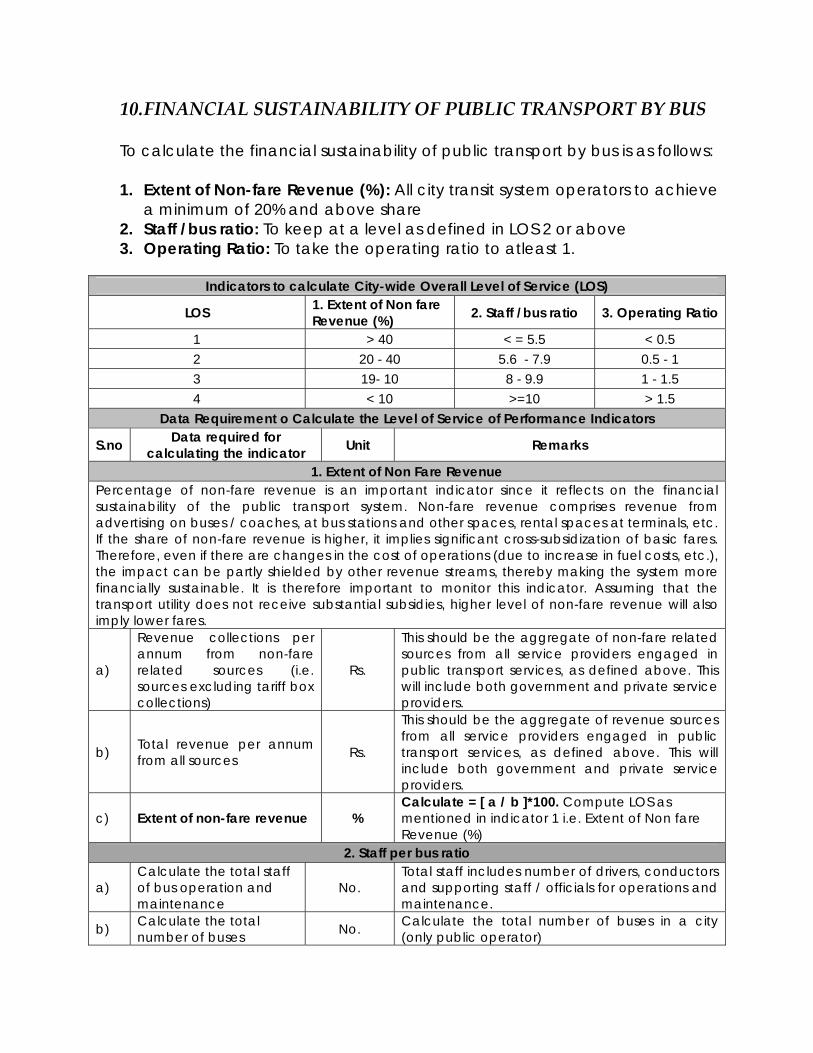
10. FINANCIAL SUSTAINABILITY OF PUBLIC TRANSPORT BY BUS
To calculate the financial sustainability of public transport by bus is as follows:
1. Extent of Non-fare Revenue (%): All city transit system operators to achieve a minimum of 20% and above share
2. Staff /bus ratio: To keep at a level as defined in LOS 2 or above 3. Operating Ratio: To take the operating ratio to atleast 1.
Indicators to calculate City-wide Overall Level of Service (LOS)
LOS 1. Extent of Non fare Revenue (%) 2. Staff /bus ratio 3. Operating Ratio
Data Requirement o Calculate the Level of Service of Performance Indicators
S.no Data required for calculating the indicator Unit Remarks
1. Extent of Non Fare Revenue Percentage of non-fare revenue is an important indicator since it reflects on the financial sustainability of the public transport system. Non-fare revenue comprises revenue from advertising on buses / coaches, at bus stations and other spaces, rental spaces at terminals, etc. If the share of non-fare revenue is higher, it implies significant cross-subsidization of basic fares. Therefore, even if there are changes in the cost of operations (due to increase in fuel costs, etc.), the impact can be partly shielded by other revenue streams, thereby making the system more financially sustainable. It is therefore important to monitor this indicator. Assuming that the transport utility does not receive substantial subsidies, higher level of non-fare revenue will also imply lower fares.
a)
Revenue collections per annum from non-fare related sources (i.e. sources excluding tariff box collections)
Rs.
This should be the aggregate of non-fare related sources from all service providers engaged in public transport services, as defined above. This will include both government and private service providers.
b) Total revenue per annum from all sources Rs.
This should be the aggregate of revenue sources from all service providers engaged in public transport services, as defined above. This will include both government and private service providers.
c) Extent of non-fare revenue % Calculate = [ a / b ]*100. Compute LOS as mentioned in indicator 1 i.e. Extent of Non fare Revenue (%)
2. Staff per bus ratio
a) Calculate the total staff of bus operation and maintenance
No. Total staff includes number of drivers, conductors and supporting staff / officials for operations and maintenance.
b) Calculate the total number of buses No. Calculate the total number of buses in a city
(only public operator)
c) Staff per bus ratio Ratio Calculate= [ a / b ]. Compute LOS as mentioned in indicator 2 i.e. Staff /bus ratio
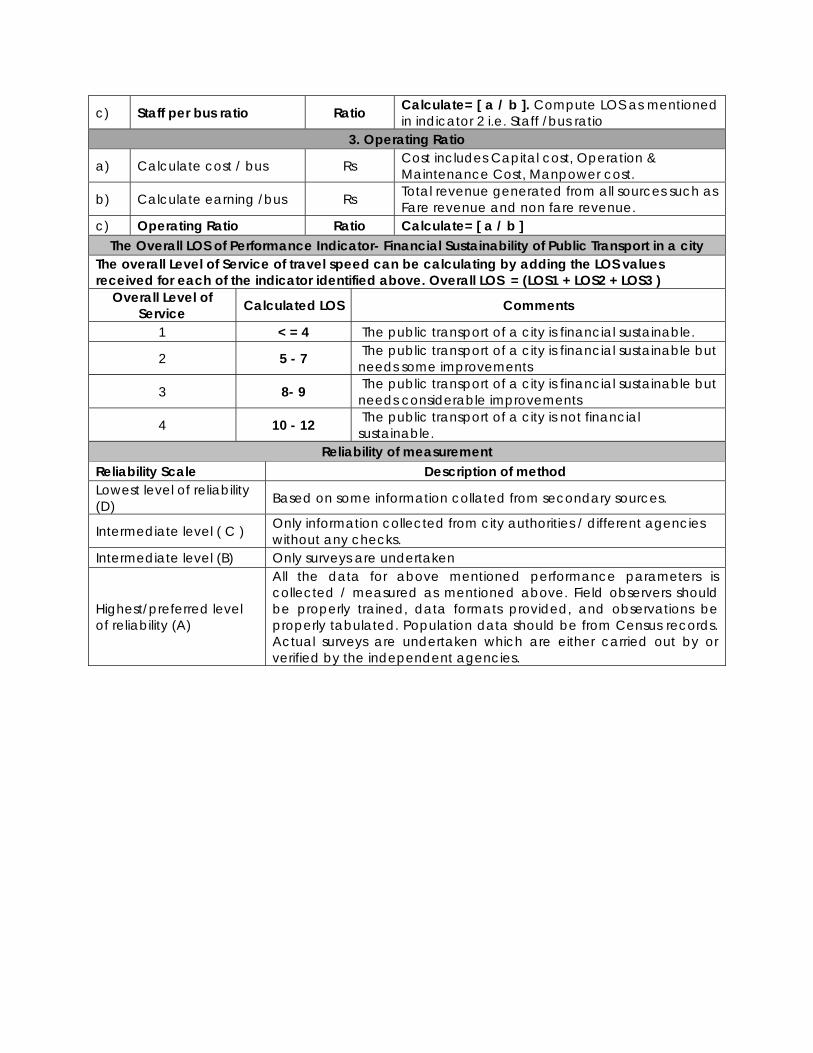
3. Operating Ratio
a) Calculate cost / bus Rs Cost includes Capital cost, Operation & Maintenance Cost, Manpower cost.
b) Calculate earning /bus Rs Total revenue generated from all sources such as Fare revenue and non fare revenue.
c) Operating Ratio Ratio Calculate= [ a / b ] The Overall LOS of Performance Indicator- Financial Sustainability of Public Transport in a city
The overall Level of Service of travel speed can be calculating by adding the LOS values received for each of the indicator identified above. Overall LOS = (LOS1 + LOS2 + LOS3 )
Overall Level of Service Calculated LOS Comments
1 < = 4 The public transport of a city is financial sustainable.
2 5 - 7 The public transport of a city is financial sustainable but needs some improvements
3 8- 9 The public transport of a city is financial sustainable but needs considerable improvements
4 10 - 12 The public transport of a city is not financial sustainable.
Reliability of measurement Reliability Scale Description of method Lowest level of reliability (D) Based on some information collated from secondary sources.
Intermediate level ( C ) Only information collected from city authorities / different agencies without any checks.
Intermediate level (B) Only surveys are undertaken
Highest/preferred level of reliability (A)
All the data for above mentioned performance parameters is collected / measured as mentioned above. Field observers should be properly trained, data formats provided, and observations be properly tabulated. Population data should be from Census records. Actual surveys are undertaken which are either carried out by or verified by the independent agencies.
Section 2: Performance Report Card The minimum frequency of computation of the performance indicators is annually and the geographic jurisdiction for which it should be measured is municipal limits or planning boundary. On the basis of the above framework, ULBs should prepare Performance Report Cards, which would form the basis for reporting and monitoring performance. The Report Cards should necessarily contain the following information:
• Municipal Areas / Development Authority • The time period for which performance is being reported • Current baseline and actual accomplishment of performance as
time passes • Targeted performance levels for subsequent time periods
(annually). • The Measure of reliability of the systems, on the basis of which the
indicator has been measured (viz. either 1 or 2 or 3 or 4) • Brief plan of action for achieving the targeted performance level
for each of the forthcoming time periods. Illustrative Performance report card Submitted to State / Central Govt. Demographic details-
• Population: • Population density:
Total area in sq km: Reporting Frequency: Annual Time Period: FYI 08-09 Reporting Jurisdiction: Limits of Municipal Boundary / Planning Boundary S.No SLB LOS Actually
achieved LOS Targeted Action Plan to achieve the target
1 Public Transport
2 Pedestrian Infrastructure facilities
3 Non Motorized Transport facilities
4 Level of usage of Integrated Transport System (ITS) facilities