UPPSALA UNIVERSITY Department of Business Studies Business administration D Master thesis, spring term-11 2011-06-03 Service Level Classification - How IKEA secures availability of the most important articles Authors: Joanna Molin Edlund Elinore Åsell Supervisor at Uppsala University: Susanne Åberg
Transcript
UPPSALA UNIVERSITY
Department of Business Studies
Business administration D
Master thesis, spring term-11
2011-06-03
Service Level Classification - How IKEA secures availability of the most important articles
Authors: Joanna Molin Edlund
Elinore Åsell
Supervisor at Uppsala University: Susanne Åberg
1
Abstract
The thesis title Service Level Classification - How IKEA secures availability of
the most important articles
Authors Joanna Molin Edlund and Elinore Åsell
Supervisors At IKEA, Jonas Engström
At Uppsala University, Susanne Åberg
Key words Service level, availability, product classification, prioritisation,
buying situations and customer service.
Purpose The purpose of this master thesis is to investigate the possibilities
to extend or change the base of IKEA‟s SL classification and give
1.1 Background and Problem Discussion “Availability of products is the new battleground in the fast moving consumer goods
industry” (Corsten and Gruen, 2003, p.605), and the winner of this battle will get a strong
competitive advantage. This is something that Bloomberg, LeMay and Hanna (2002) also
emphasise; that no matter how effective an advertising campaign or sales force is, there will
not be any sales without the product available on the shelf and this requires a well structured
supply chain. The concept of on-shelf availability (OSA) is something Grant and Fernie
considers “a key challenge for all retailers” (2008, p.661). This challenge gets more complex
the more global an organisation is (Bloomberg, LeMay and Hanna, 2002). An example of a
global retailer facing these challenges is the Swedish home-furniture company IKEA. Every
day, IKEA provides thousands of customers in hundreds of stores around the world with over
9 000 different articles from more than 1 000 suppliers.
Some authors equalise OSA to customer service (Trautrims et al., 2009) while others claim
that it is an important part of it; a customer survey rates OSA as the third most important
factor, only lower prices and shorter queues were considered more important (Grant and
Fernie, 2008). A high availability is one of IKEA‟s most important goals in order to satisfy
their customers.
Since it is expensive (and sometimes physically impossible) for organisations to have all
products in stock at all times, the organisations will have to trade-off between carrying cost,
plus other logistics related costs, and availability (Trautrims et al., 2009). Due to this issue
organisations need to make priorities, since all products within an organisation cannot be
managed with equal attention and have the same level of availability (Chu et al., 2008; Ng,
2007; Rudberg, 2008). To control all products efficiently, a classification system is
traditionally used to organise the products into different groups (Ng, 2007). A classical model
of classification is the ABC analysis which is based on the Pareto principle, where 20% of an
organisation‟s products stand for 80% of the turnover. These products will often be classified
as group A and are considered the most important products for the organisation to have
available. The C articles consist of a large amount of products with a low turnover and group
B form a group in between (Rudberg, 2008).
8
After the rise of the ABC analysis, decades ago, there have been developments of product
classifications (Boyla et al., 2008). Most models have had a focus on only one parameter;
turnover. The question is if turnover really is a good base for prioritising the articles? Zinn et
al. (2002) claim that it is time for companies to change focus towards the customer and build
a measurement that captures the customer‟s interest. To use a multiple criteria classification
model is something that has been brought up by some researchers but there has not been a lot
of research concerning the subject (Bhattacharya et al., 2007; Ramanathan, 2006; Flores and
Whybark, 1987). IKEA uses a product classification system called “Service Level
classification” (SL classification) which divides the articles into four different groups. The
classification is mainly based on turnover on either a global or a local level.
1.1.1 Purpose The purpose of this master thesis is to investigate the possibilities to extend or change the
base of IKEA‟s SL classification and give recommendations concerning potential
improvements.
1.2 Outline of the Thesis This thesis is structured as follows; chapter 1 gives a general introduction of the subject and
the problem that many companies, including IKEA, face. Chapter 2 is the methodology
chapter which explains the method used and the limitation of the study. Chapter 3 consists of
a brief description of the IKEA organisations, the supply chain and the supplying process.
Chapter 4 concludes the empirical findings which is organised into four different themes; how
IKEA works with SL, the purpose of SL, customer service and suggestions to the design of
the SL classifications, as well as a short summary of the most crucial findings. Chapter 5 is a
description of the theoretical framework, with a short summary of the most prominent
classification models and a description of the relationship between customer service and SL.
The concept on-shelf availability will be described as well as the customer reaction on out of
stock and the different buying situations that influence the customer perception of availability.
Next follows a description of how to measure availability and lastly the theory ends with a
short conclusion. Chapter 6 presents the analysis which is divided into three parts;
classification models with a presentation of our own model adapted to IKEA, an analysis of
customer service and SL in the context of IKEA, as well as a discussion of how to best
measure SL. The thesis ends with a description of the most important conclusions as well as
our recommendations to IKEA (chapter 7).
9
2. Methodology
2.1 Research Strategy This thesis has an inductive research strategy since data has been collected to build theory
rather than the other way around (Bryman and Bell, 2007). To be able to fulfil our purpose, a
qualitative study were chosen where the relationship between theory and research gradually
grows stronger (Bryman et al., 1997). We started the study by spending four weeks at IKEA
of Sweden in Älmhult to learn about the company and what was expected from us. During
these weeks interviews were conducted with employees at IKEA and other internal
information were gathered. First after collecting the empirical data we started to look into
different theories and models that could help us improve IKEAs classification system.
2.2 Empirical Data Gathering Information about IKEA has been gathered from the IKEA intranet, which is available only to
IKEA co-workers. Some documents, books about IKEA and verbal information have been
given by our supervisor.
45 employees were e-mailed and 33 were booked for an interview, which is a relatively high
response rate (about 73%). The contact was initially established by our supervisor at IKEA
who first sent out an e-mail to explain who we were and what the purpose of the study was.
After that we scheduled interviews with the employee‟s that had accepted our request. Before
the first interview our supervisor and one of his colleagues reviewed the questions to see if
there were any ambiguities. This enabled us to make changes before we started the interviews,
which made the interviews run more smoothly.
To be able to draw conclusions from the study it is, according to Trost (2001), important to
investigate a representative sample of the population, which we tried to have in mind when
we chose our interviewee‟s. The sample size is not big enough to secure that the opinions are
representative for the whole population but we tried to make sure that as many functions as
possible were represented in the study and that people with a connection to the SL
classification, in these functions, was contacted. One limitation with the research is the fact
that two functions were only represented by one person and because of that we chose to not
present the number of how many employees were interviewed in each function in the table
10
below. The functions that are highly affected by the SL classification got a bigger
representation in the number of people interviewed and vice versa. It became clear that a lot
of answers were similar among the employees in the same function which gave us a reason to
not continue further with the number of interviewees in the same function.
Table 1. A summary of which functions that was represented in the interviews.
Organisation Function IKEA of Sweden; BA Supply Manager,
Home Furnishing Businesses Need Planner,
Sales Responsible,
BA Business Navigator
Trading Service Office Logistics Manager
Global Retail Logistics Integration Manager
Retail Sales SE Sales Manager
Retail In store Logistics Integration Manager
Regional Supply Team Financial Manager,
Supply Chain Manager
DS Operations Business Navigation Manager
3 different stores; Barkarby,
Kungens Kurva and Uppsala Sale Support Supply Manager,
Logistics Manager
The interviews were face-to-face and held in Swedish. Four exceptions were made where the
interviews were in English. Two interviews had two respondents each. We also e-mailed 3 of
the interviewees to complement the information after the interview. The interviews were
semi-structured and the respondents could answer the question as they wished. We had a
series of open ended questions in a general form which we, during the interviews, were able
to decide the order of. This made it possible to ask complementing questions as the interview
went on. The structure also ensured that the respondents understood the questions and if not,
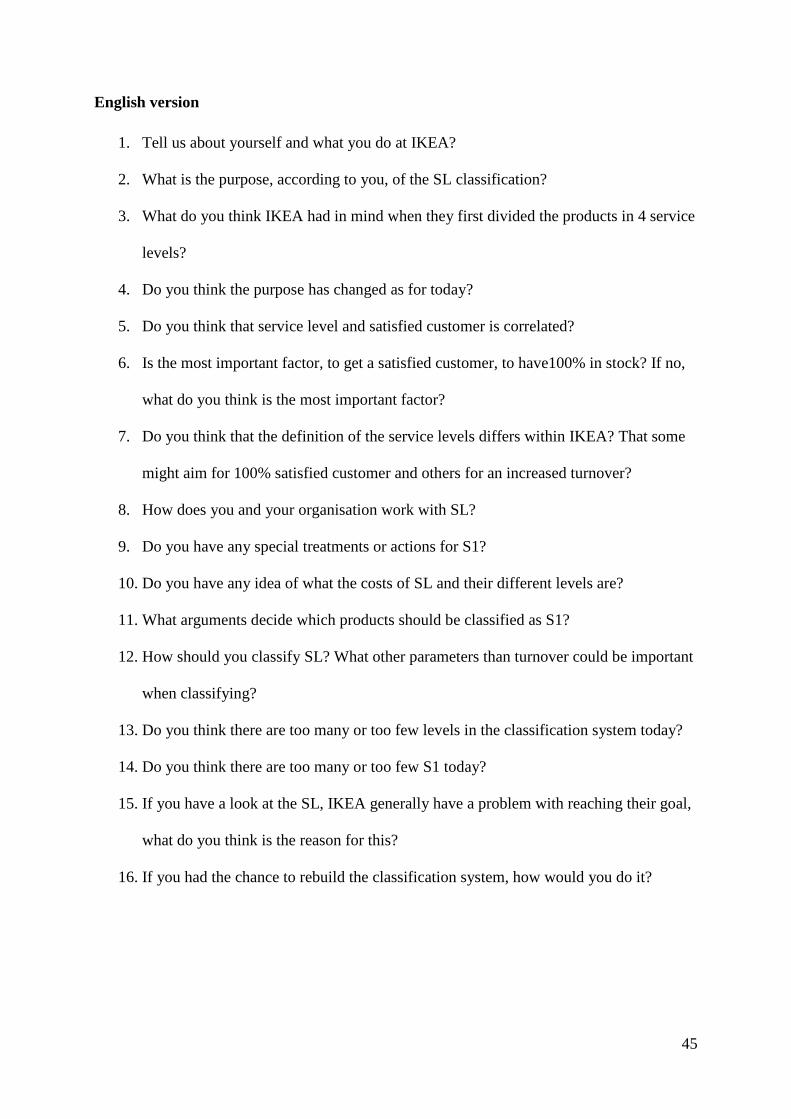
we were able to explain the question in more detail (Bryman and Bell, 2007). Questions such
as how the organisation work with SL classification, what the purpose is and problems with
the classification, were asked (see appendix 1).
The interviews were held at the IKEA of Sweden (IOS) office in Älmhult, except 4 that were
held in Helsingborg at the Swedish Service Office and at the Global Retail Office. Interviews
have also been held at different stores (Barkarby, Kungens Kurva and Uppsala). All the
interviews took place in a smaller meeting room where both of us took notes during the
interviews. In interviews with, according to us, key persons we also decided to tape-record the
11
interviews to make sure we did not miss any critical information. After each interview we
discussed and wrote down the answer to make sure we had understood and perceived
everything in the same way, if there were any ambiguities we tried to clear them right away.
This helped us in creating a stronger internal reliability1.
2.3 Trustworthiness of the Study
2.3.1 Research Strategy Even though IKEA is the organisation that requested this study, we do not believe that we had
any problems to stay objective and not get too affected by IKEA and our supervisor‟s
opinions. We did have the opportunity to influence the scope of the study and how to go about
the research. Our supervisor at IKEA helped us to initiate contact with different employees
but has not been present during the interviews.
2.3.2 Empirical Data The type of interview structure used was considered to be the best in order for us to fulfil our
purpose and to get a better understanding of the SL classification. A negative aspect of
conducting qualitative research is that it is hard to replicate and therefore the external
reliability tend to be a hard criterion to meet. On the other hand, qualitative research is strong
in internal validity where we tried to match our observations as well as we could to our ideas
that we developed (Bryman and Bell, 2007).
During the whole process we have tried to stay objective and gather all the information before
drawing any conclusions. We also tried to remain critical and not get affected by our
supervisor and his opinions during our regular meetings. We solved this problem by first
gathering all the empirical data before we started to process it and without having any
theoretical knowledge in the subject. That gave us a valuable advantage since we got a good
overview of the data and where not affected by any preconceptions.
1 Internal reliability aims to show how well two, or more, observers agree on what they have seen and heard
during an interview for example (Bryman and Bell, 2007).
12
3. IKEA Organisation
3.1 Background IKEA is a global organisation with a total of 320 stores in 38 countries today, and employs
over 127 000 people. The vision of IKEA is to ”create a better everyday life for the many
people”, resulting in a business idea which “offers a wide range of well-designed, functional
home furnishing products at prices so low that as many people as possible will be able to
afford them” (About IKEA, 2011).
An important part of the IKEA concept is the culture within the organisation that consists of
shared values and norms which help create identity, togetherness and strength among IKEA
co-workers all around the world. With this in mind Ingvar Kamprad2 created the “Testament
of a Furniture Dealer” in 1976 (see appendix 2) which could be seen as IKEA‟s core values
(IKEA concept description, 2000). According to Mikael Olhsson, President and CEO of
IKEA, the organisation strives for cost-consciousness, simplicity and togetherness, as was the
goal from the beginning set by Ingvar Kamprad. According to Olhsson the organisation‟s
long term direction also includes being the leader in life at home, where IKEA has to develop
a better knowledge and understanding of the challenges people meet in their daily living
situations, to better connect to the customers‟ needs and dreams. Another part of the long
term direction is sustained and long term profitability where the profitability must be a result
from lower costs since IKEA is a low price company (Growing IKEA Together, 2011).
3.2 IKEA Supply Chain The figure below describes how the supply chain within IKEA is set up into different
organisations. The organisations will be described in more depth in the sections below,
following the order of the supply chain.
Figure 1. IKEA Supply Chain.
2 The founder of IKEA.
IKEA of Sweden
TradingRegional Supply Team
Retail Logistics
Distribution Store
13
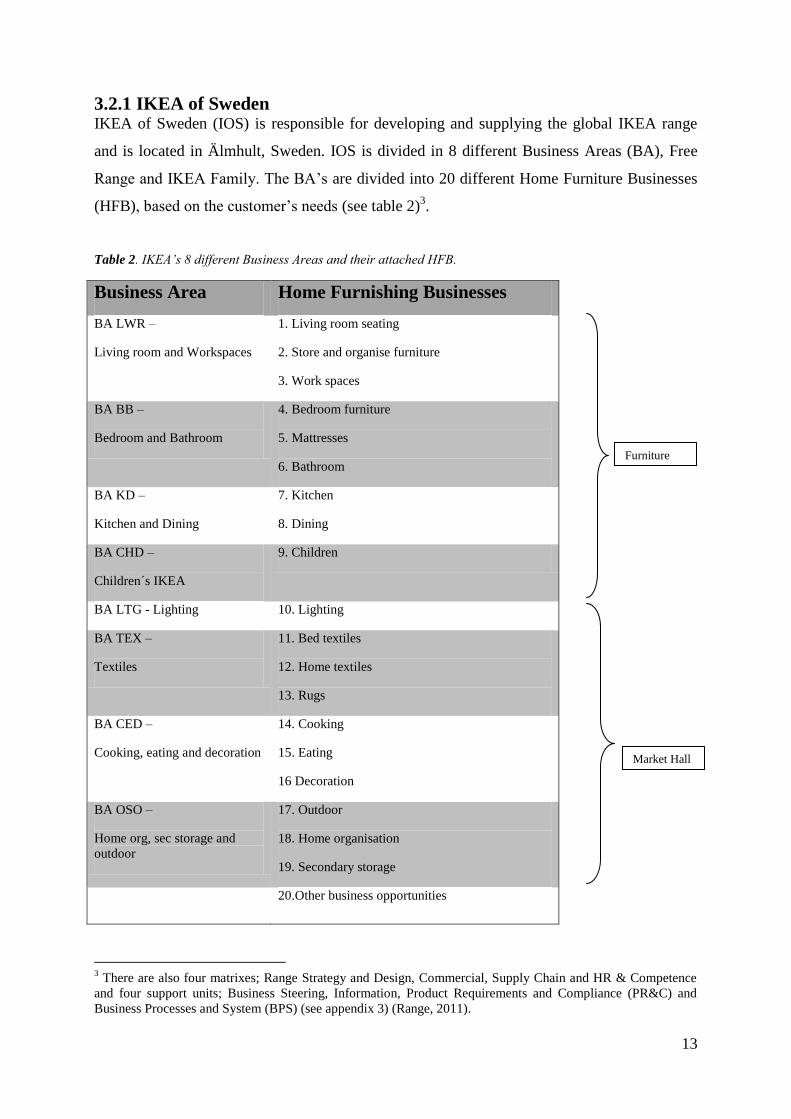
3.2.1 IKEA of Sweden IKEA of Sweden (IOS) is responsible for developing and supplying the global IKEA range
and is located in Älmhult, Sweden. IOS is divided in 8 different Business Areas (BA), Free
Range and IKEA Family. The BA‟s are divided into 20 different Home Furniture Businesses
(HFB), based on the customer‟s needs (see table 2)3.
Table 2. IKEA’s 8 different Business Areas and their attached HFB.
Business Area Home Furnishing Businesses
BA LWR –
Living room and Workspaces
1. Living room seating
2. Store and organise furniture
3. Work spaces
BA BB –
Bedroom and Bathroom
4. Bedroom furniture
5. Mattresses
6. Bathroom
BA KD –
Kitchen and Dining
7. Kitchen
8. Dining
BA CHD –
Children´s IKEA
9. Children
BA LTG - Lighting 10. Lighting
BA TEX –
Textiles
11. Bed textiles
12. Home textiles
13. Rugs
BA CED –
Cooking, eating and decoration
14. Cooking
15. Eating
16 Decoration
BA OSO –
Home org, sec storage and
outdoor
17. Outdoor
18. Home organisation
19. Secondary storage
20.Other business opportunities
3 There are also four matrixes; Range Strategy and Design, Commercial, Supply Chain and HR & Competence
and four support units; Business Steering, Information, Product Requirements and Compliance (PR&C) and
Business Processes and System (BPS) (see appendix 3) (Range, 2011).
Furniture
Market Hall
14
3.2.2 IKEA Trading IKEA Trading (Trading), the purchasing organisation is a link between production
development, distribution and the stores. The purpose of Trading is to secure functional
production with good quality at the lowest possible costs. Through long-term commitments
and strong relations with competent suppliers, Trading makes sure that the right amount of
products end up on the shelves.
3.2.3 Regional Supply Team The purpose of the regional supply teams is to create a bridge between trading/suppliers and
IKEA‟s stores. The regional supply teams at IKEA consist of three different groups, Asia
Pacific, Europe and North America.
3.2.4 Retail Logistics IKEA Retail Logistics purpose is to make sure that the availability is constantly stable and
high for IKEA‟s customer at the lowest cost possible. They are trying to fulfil this by
integrating the supplying process into the retailing business, ensuring an efficient logistics
operation in the store, and providing an efficient service operation for customers who request
other options for picking or delivery of products.
3.2.5 Distribution Service Operations The purpose of Distribution Service Operations is to handle all movements of goods from
suppliers, warehouses, stores or customers. The distribution service operations is divided into
three processes; store distribution, customer distribution and transport. They consist of five
distribution services areas, three of them located in Europe.
3.2.6 Store There are 321 stores in 38 countries, out of which the IKEA Group owns 284, the rest being
owned by IKEA retailers outside the IKEA Group (through franchising).
3.3 IKEA Supplying Process “IKEA supplying represents the heart of the global organisation and one vital purpose is to
ensure product availability; to have the products that customers want to buy, when they want
to buy them” (IKEA Tillsammans, 2011-02-28). IKEA is a product oriented retailer with
products made for large scale production and cost efficiency. Every day, huge volumes of flat
15
packages travel the world by train, ship and truck, sometimes with a quick stop at distribution
centres or warehouses before arriving at one of IKEA‟s 321 stores on four continents. The flat
packages let every customer be part of the supply chain by collecting and transporting their
purchases home themselves. IKEAs responsibility for this last important step is to secure
availability (IKEA supplying, an essence of the IKEA concepts, 2007).
3.3.1 Availability To create customer satisfaction, products need to be available for immediate take-away in the
IKEA store. This is done through common sales planning, forecasting and ordering
throughout the supply chain. Only products that need to be stocked are stocked (IKEA
supplying, an essence of the IKEA concepts, 2007), and the products are prioritised based on
SL classification. “By measuring service level we are able to identify possible availability
issues in order for us to improve our work in achieving high availability of articles and to
secure sales growth” (Available to Customer, 2011).
3.3.2 Service Level Classification “A product‟s „service level‟ is the percentage of time that a product is in stock and available
for customers. It would be too expensive for us to ensure that each and every one of our 9 450
articles are in stock all the time. So we focus our resources and set priorities by working with
four target levels” (IKEA Tillsammans, 2011-02-28). The SL classification is an important
key performance indicator (KPI) for all parts of the supply chain, from the supplier all the
way to the store where the final measures take place4. An average of the weekly result is put
together, based on the availability in all stores worldwide without any internal weighing.
The work of classifying articles at IKEA started in 1985 when IKEA decided to measure the
customer service of the supplier to the stores. Ten years later the management decided that
they wanted the service level to measure the ability to serve the customer and changed the
way of measuring to the last bridge in the supply chain (see figure 2).
IKEA 1985 1995
Figure 2. How IKEA used to measure SL 1985 and how they measure SL today, changed in 1995.
4 IKEA measures what they have in stock (with) divided by what they want to have in stock (want)
= with / want stock.
16
In the beginning the prioritisation was mainly based on the products that were showed in the
IKEA catalogue but over the years it was developed towards prioritising the top sellers. Key
components that enabled to sell a system product were added to the list of products with high
priority. There were three groups of products that had a target level of availability of 95, 90
and 85%.
The purpose of the classification system today is “to give priority to the right articles in the
whole supply chain to achieve high availability for our customer and to secure the sales”
(Rules for Service Level classification, 2010). The calculation is made in the same way but
the products are divided into four levels S1, S2, S3 and S4 with minimum service levels of 99,
97, 95 and 90%. The S1s are articles that fulfil the requirements of being; an ad-, front- or
back page in the catalogue, a key article for a product system or a global top seller. Every
HFB has a set frame of S1s to fill which makes up the total number of S1s to 980 out of 9450
articles (10,4%). The S2 are locally classified (for each country) with “other top sellers,
sufficient to reach the goal of 75% of turnover in each country when added to S1 articles”. S3
are other catalogue articles not already classified as S1 or S2, and S4 are other articles (Rules
for Service Level classification, 2010).
The classification is done to work as a guideline for prioritisation in all parts of the chain;
always prioritise a S1 product before a S2, followed by S3 and S4. The same system is used
for determining safety stocks; a S1 product will get a higher safety stock than a S2 and so on
(see Appendix 4). This is done automatically by a system but can be changed manually if
needed. Every HFB at IOS is responsible for classifying its products according to the “Rules
for Service Level classification”.
The business steering department at IOS is the process owner of the SL classification; they set
the rules and control the usage of the system. The classification is done once a year but the
S2-S4 can be changed an additional three times. The sales responsible at each HFB at IOS are
responsible for setting the SL classification, for the articles within their business area, with
data input from business navigators.
In 2010 IKEA developed a working method to use as a guideline for how to focus and work
with the S1 products; “Always available”. It aims to create a mindset for the co-workers to
17
strive for 100% availability for S1. The method consists of 17 rules for how to work with S1
including back-up capacity plans, accurate safety stock that can ensure availability and
routines for the employees, so that a S1 article never goes OOS.
The next chapter will describe the service level in practice and in order to create a better
structure and to get an overview of the conflicting interests in the different functions the data
is divided into four themes; how IKEA works with SL, the purpose of SL, customer service
and suggestion to the design of the SL classification. The most prominent issues will be
described as well as the most common improvement proposals. Some functions of the
organisations had a greater impact, in numbers of interviewees, and are therefore given more
space in the thesis. This because they are more involved in the work of SL classification
compared to other organisations in IKEA.
4. Service Level in Practise
4.1 How IKEA works with Service Level Classification 4.1.1 IKEA of Sweden After conducting the interviews it became clear that different HFBs at IOS work differently
with the SL classification. Some people try to follow the guidelines strictly while others tend
to consciously design their own working method, that better suit their HFBs needs. It has also
become clear that some of the different HFBs see themselves as exceptions among the other
HFBs when it comes to certain rules and therefore stretch the boundaries. This is something
that is widely known within IOS and creates a lot of frustration among the employees. As an
example, employees suspect each other to not follow the rules and consciously downgrade the
SL of specific articles to be able to reach the service level goals better. “Rules are meant to be
challenged” is a common expression at IKEA.
There are no strict guidelines of appropriate working methods for every SL, apart from the
“Always available” concept regarding the S1, which has been requested by some of our
interviewees. The use of “Always available” differs within the different HFBs. A major part
of the HFBs has not yet implemented the rules and some HFBs have chosen to implement just
a few of them, even though everyone is well informed about the concept and the issue
regarding availability, which is more important than ever, according to many interviewees.
18
Very few are willing to take the costs for implementing all the rules of the concept, e.g. to
make sure to have a back up supplier if anything would happen to the existing one, since the
costs would be too high. This is because every HFB wants to present the best results possible.
4.1.2 IKEA Trading SL classification within Trading is used as a prioritisation tool when shortages occur. Trading
strives to allocate the S1 products to the most trusted suppliers and senior employees in
Trading, as one step to better secure capacity. The suppliers are well informed about the
IKEA‟s SL classification but it is Trading‟s job to make sure that they follow the guidelines.
Trading‟s suppliers that have been involved with IKEA production for a very long time are
independent and follow the guidelines with hardly any interfering or support from Trading,
while others are more demanding and need to be controlled more often. It is also widely
known that some suppliers tend to “forget” the IKEA SL classification and focus more on the
products that provide the most profit for them. SL classification is also used as a KPI, to
evaluate the suppliers as well as the Trading organisation itself, for bonuses etc.
4.1.3 Distribution Service Operations The Distribution Service Operation is a link between the other organisations and focus on
finding the best solutions to transport the products from A to B. The system tells them what
SL the products have so that they can reorganise in case of problems in the traffic. But since
the containers are mixed with products with different service levels, it is sometimes hard to do
any changes. According to the interviewee they can not affect the availability in any other
way then they do today; by transporting goods the way they should.
4.1.4 Retail Logistics Retail Logistics works at the borderline between selling and supplying. They are not involved
in the classification of the products but they monitor the availability and check if the
classification is done right. If the classification is not done correctly according to Retail
Logistics, they can contact IOS and try to solve the problem.
4.1.5 Stores The respondents at store level with logistics positions are aware of the SL classification but
they do not work that closely with it. The sales-people in the stores are not informed about the
SL classification and use the selling guide “Sell This”, provided by each Service Office,
19
instead. “These products are the ones that will be prioritised by the sales people, and
unfortunately, they are not taken into consideration and prioritised as S1 or S2 by IOS. The
sales people in the store might be confused when we encourage them to sell specific products
and then can‟t ensure their availability”, says a respondent at Retail Logistics.
A problem that has been highlighted within the stores is the difficulties in handling the new
articles since they are often classified as S4 and frequently sell out. The stores get mixed
signals from IOS, on the one hand the news is important and on the other hand they are not
that important since they have been classified as an S4. A similar issue exists concerning
seasonal articles or activity campaigns, where the logistics personnel at the store need to do
manual work in order to secure availability, which can be difficult if you do not have the
experience, since the products are usually classified as S4. The interviewees request better
communication and information from IOS and the retail organisation so that they can teach
the sales people about SL. Better information and communication is requested from all parts
of the organisation.
4.2 The Purpose of Service Level Classification
4.2.1 Perceptions within the Organisation A summary of the answers from the interviewees from all the different organisations shows
that the perceived purpose of SL classification seems to be almost as many as the respondents.
Apart from making sure to secure availability of important key articles for system products
and ad-, front- and back pages in the catalogue, the answers, among others, were ; “to
prioritise in the supply chain”, “to create customer satisfaction”, “secure the products with the
highest turnover”, “a measure of how well we secure our availability”, “prioritise the most
important products for the customer”, “make a prioritisation of products that have the highest
turnover, because IKEA does not have the capacity or the money to prioritise every product”,
“secure the customer promise” (what IKEA shows in the catalogue) and “secure availability
of the icon products”.
In summary, the two most prominent, but conflicting according to many, purposes is to give
priority in supply chain in order to; 1. secure the products with the highest turnover and 2.
create satisfied customers. One interviewee explained that the classification is set up to be as
specific as possible at store level but also as globally effective as possible for the suppliers,
20
which is a hard combination. Retail services work closely with the stores in the different
countries and can also register a sense of frustration that the classification is too global and
general to capture the local needs of the countries. “There are sometimes even big differences
within stores in the same country, how could IKEA assume that people have the same taste
and needs all over the world?” On the other hand IKEA has tried to use a more local
classification but it did not work out well since it created a lot of problems in the prioritisation
for the suppliers.
4.2.2 Interests within the Organisation The respondents that did not know how the classification is done requested better information
in order to make sure that everyone in the organisation works with the same goal in mind. The
need of a common goal is requested from all parts of the organisation. One employee at IOS
explained the picture he had of the different interests among the different functions at IKEA;
“trading and the logistic functions want to have as few S1 as possible on a global level to be
able to prioritise more efficiently, IOS wants to boost turnover and secure icon products, the
retail function wants to be as local as possible to suit different needs in different countries and
have different priorities for different countries, and the stores want to boost sales and high
marginal products. What should be the purpose of SL?” Another respondent argues that
“different functions have different interests and due to the fact that some organisations get
commission and bonuses when reaching the SL goals, they sometimes try to affect the result
in the wrong way”. Another request from the interviewees was to create clearer definitions of
the selected base for the different levels so that there will be fewer discussions about what
level a product should be classified as. Many interviewees expressed a frustration of the
system where “the HFB that complains or argues the most will get the highest number of S1”
and hope that a more clearly stated purpose would make people cooperate more and stop sub-
optimising in the way they do today. One respondent also argued that the suppliers do not
need to be involved in and measured by the SL classification, instead they should be
measured on how well they can deliver what they are set up to deliver.
4.3 Customer Service
4.3.1 Buying Situations All the interviewees stated on-shelf availability as one of the most important factors for
creating a satisfied customer, either in direct correlation with the SL or in some way
21
influenced by it. Some had the impression that the level of customer expectation varies for
different types of products as well as the level of disappointment when a product is out of
stock. One part of the interviewees claimed that the products in the catalogue need to be
available, because this is a “customer promise” created by IKEA, while the other part claimed
that the most popular products for the customers are important for good customer service.
Some employees brought up the different buying situations at the furniture departments
versus the “market hall” (see table 2 on p. 13). One respondent at IOS said that “it often takes
preparations and planning when buying furniture compared to the impulse buying that often
occurs at the market hall. Even if you plan to buy something at the market hall, for example a
butter knife, you will not get that disappointed if the one you had in mind was out of stock
and you had to buy another one. Or more likely, you don‟t even know what kind of butter
knives exist in the range and will perceive the availability to be good as long as the store
looks well stocked and have one type of butter knife”. Sales responsible at the market hall
explain that sales steering and relocations at the sales area can make customers perceive good
availability. Relocations can also, hopefully, present a substitute to a product that is OOS and
direct the customer to buy another one instead; “We should try to use the knowledge of how
effective sales control is; that people buy what they see, and be better in selling what is
available instead of complaining of what is not.” The interviewee adds that it might be easier
to direct sales at the market hall than at the furniture department.
But the issue with the buying situation at the market hall is that if the customer does not find
the product at all he will probably not come back, while a customer that plans to buy a
specific sofa might be able to wait a week and come back, argues a respondent. IKEA does
not consider the buying process at all in the SL classification today. Another respondent
expressed that “IKEA should try to prioritise products with high expectations from the
customers. The acceptance level for OOS is different for different products but IKEA also
want to generate revisits”.
4.3.2 Prioritisation One respondent points out that the commercial part of the purpose (customer service) cannot
be interpreted or measured in any way with the SL classification that exists today, since it
does not say anything about the customer‟s expectations and reactions. To be able to say
anything about what the customers actually expect, IKEA will have to ask them, in other
words conduct in-depth customer surveys; “Customers expect to find products in the store on
22
a regular day. It is strange that we do not react more to the situation today regarding the
availability, says a respondent at the Swedish Service office.” The interviewees at Retail
Logistics are worried that the classification focuses too much on IKEAs interest when putting
turnover as the prioritising base for the SL‟s. One employee claims that IKEA needs to focus
more on the customer need and the products that most customer buy; “By focusing on the
most frequently bought products, instead of the products with the highest turnover, IKEA
could better serve the interest of the customer.” At the same time they know that the stores are
profit seeking and try to boost the top selling products. “The end result is only as good as
what everyone is doing, including the stores.” There are still employees that assume that the
products IKEA wants to prioritise and sell are the same products that the customers want to
buy.
4.4 Design Suggestions for the Service Level Classification
4.4.1 Formation A proposition that came up during our interviews was if “enablers”
5 were to be separated into
its own group as the most important articles, since they enable a purchase. These types of
articles are most common in the HFBs that include furniture, since those products most often
needs to be put together. The people arguing for this extra level emphasised the importance of
these articles and meant that these should always be available, no matter what.
Opinions regarding the optimal number of S1 differ quite much, some think that the number
of S1 is good and should not be changed, while others think it should be reduced in order for
them to be more manageable. “If everything is considered important, nothing will be
important”, therefore it is vital to reduce the numbers of S1 so they can be given the right
prioritisation and time. Some respondent requested that the number of S2 should be controlled
in some way as the S1 with a specific frame and not be as flexible as today, since the number
of S2 often is very high, in order to cover the goal of 75 % of the turnover.
Also, some employees wish to increase the goal of S4 from 90 % to 93 %, since these
products are important for many customers as well. The customers have no idea of IKEA‟s
product classification and should not be satisfied with such a “low” level of availability.
5 For example, if you would like to buy a book shelf you would also need to buy a cross brace to be able to put it
together, within IKEA this cross brace is an “enabler”, since it enables the book shelf to be put together. Without
the cross brace, the customer probably won‟t buy the book shelf.
23
When discussing the number of levels in the classification, a great part of the respondents
have expressed a wish of introducing a fifth level, S5, which would include the products that
are discontinued from the range. These are the articles that IKEA do not want to measure and
therefore some respondents feel that it is unfair to let these articles decrease the SL since they
are not important. Others think the opposite; every article should be measured until they are
not in the range any more. One solution, given by a respondent at IOS, is to measure the
availability of the discontinued and the new articles together for a period of time (given that
the new article is a substitute for the discontinued) to be able to make sure that at least
something is available for the customers. Another similar concern that some interviewees
highlight regarding this, is the fact that discontinued products are replaced by new products
four months before the new catalogue is released. This results in a broken “customer
promise”, because customers expect to find the discontinued products in store, since they are
presented in the current catalogue. This is also something that affects the level of availability
because it will create shortages for these discontinued products.
Yet another improvement that was brought up was the idea of creating a more flexible
classification system that handles more seasonal products as for example Christmas
decorations, candles and outdoor furniture but also activity articles, which are important only
during a certain time of the year. The problem with these seasonal- and activity articles is that
they are often classified as S4 which gives them no priority at all within the supply chain.
This results in a lot of manual work for many employees in order to get the products
prioritised. A few different solutions to this problem were highlighted and almost all of them
recommended a flexible group where the articles would have a time limitation, either within
the different HFBs or as an own group beside all the HFBs. Another interviewee argued that
the activity article also should be managed in a special way, and should probably be handled
as if they were classified as S0 because they are most likely more important than the S1.
4.4.2 Measurements There are a lot of different suggestions of things that could be improved in the SL
classification. A major part of the respondents argue that it would be good to develop another
system or measurement to be able to say something about customer satisfaction. There is a
tendency amongst employees at IKEA to include too much into the SL classification, as one
respondent said “there is only one tool in the toolbox that we try to use for a lot of different
purposes”. The SL today says nothing about how satisfied a customer is, it only tells you
24
which products are available in the stores. To be able to capture the customers‟ satisfaction in
a more correct way, a few respondents thought it would be a good idea to enrol more in depth
customer surveys in the stores and to conduct them more frequently than is done today.
4.4.2 How to Measure Service Level Some respondents argue that the measurement of SL is done in the wrong way today; it takes
place at opening time, when a more correct number would be given if it was measured at
closing time. They also argue that the SL is measured in the wrong place; today the measure
tells you if the article is available somewhere in the store, whereas it should be measured at all
sales location (one product can be placed at different locations in the store) to see if it is
actually available to the customer where it should be. Some also believe that it would be
better to forecast the SL instead of measuring it when it is in fact too late to do anything about
it. Another issue raised by some respondents is the fact that it only takes one article in stock to
show availability; this article may be stolen, damaged or not available for some other reasons;
a chair may not be bought alone but only with three other chairs and so on, which will create a
“false” availability. A solution to this could be to raise the minimum quantity to have in stock
at stores resulting in a more accurate availability being shown.
4.4.3 Working Methods Finally, many employees expressed that all they want is clear and simple information about
the purpose, the working method and the classification base. They also expressed the needs
for a more user friendly system to work with when doing the classification, as well as a
system that reports reasons for shortages in an easy and understandable way. The feeling
perceived during the interviews is that people at IKEA are willing to make changes as long as
they are informed why these changes are being made. In summary, information and
communication is first and last.
4.7 Empirical Conclusions The main conclusion of the interviews is that there are two different purposes of the SL
classification; a prioritising purpose to secure turnover and a commercial purpose in order to
satisfy customers. This is something caused by, most likely, lack of information and
communication, which many respondents mentioned as areas of improvements. Without
relevant and clear information it is possible for the employees to interpret the purpose in a
way that suits them and their business best.
25
Another problem raised is the fact that IKEA tries to measure and interpret too much in the
SL. It does not say anything about the customers‟ expectations or how satisfied customers are,
it only tells IKEA in how many situations, out of a hundred, the customer will find the article
available on the shelf, or more correct, if it is located somewhere in the store. Some also think
it is important for IKEA to consider the buying process for the customers and the fact that it
differs depending on what type of product is being bought. Another suggestion requested
from the respondents was the need for a more flexible system that considers seasonal- and
activity articles as well as the issue of discontinued articles by extending the classification
with additional levels and also try and create a more user-friendly system.
In the chapter that follows, our theoretical frame will be described. The theory has been based
on our empirical findings in order to find the best solution for IKEA to extend or change the
base of the SL classification.
5. Theory
5.1 Classification Models To facilitate decision making and to be able to prioritise and focus on the most important
articles, different classification systems have been developed. The articles are divided into
different groups depending on how important they are considered to be (Boyla et al., 2008)
based on certain specific parameters (Tsai and Yeh, 2008). There are a lot of different
classification models and methods in which organisations can chose from depending on the
objective of the classification (Lumsden, 2006). For customer service and service level
reasons, the most common model according to researchers is the ABC-analysis. Another
widely used model, according to Bloomberg et al. (2002), is the Critical Value Analysis.
These two models regard product classification from different angles, the company interest
versus the customer interest.
5.1.1 ABC Analysis Every article in a range cannot be treated with the same amount of attention, therefore it is
highly recommended to classify the articles into different groups, in this case, A, B and C,
thereof the name ABC analysis. This classification is based on a parameter decided by the
organisation, for example cash flow, lead time, criticality, sales volume or profitability and
the most common parameter; turnover. Important when implementing this classification is to
26
clarify what the purpose of the classification is. Everyone needs to know which articles in a
range are the most important ones and why, for example because article A has a higher
turnover than article B (given that turnover is the parameter which the classification is based
on). After the parameter is chosen the articles are ranked and break points are often chosen for
the A-, B- and C-classes. These break points often coincide with the “80-20” rule, which
originate from Pareto, where 80 % of the turnover is brought in by 20 % of the articles (see
figure 3 for an example) (Lumsden, 2010; Olhager, 2000; Bloomberg et al., 2002).
According to Silver et al. (1998), the appropriate number of categories to use depends on the
organisations‟ circumstances and size, and to what extent they like to differentiate the
different categories. In other words, it does not have to be three categories, but it is usually the
minimum.
Figure 3. Example of how the products in an ABC-analysis could be divided.
The ABC analysis is one of the most widely used inventory classification techniques
employed by organisations. According to many researchers, a problem with this classification
is the fact that it only takes one parameter in consideration. Researchers argue that this view
of inventory classification is often too simple, especially for larger organisations, and that
different factors vary in importance for different organisations. In an attempt to make the
ABC analysis a better working and more flexible tool, many researchers have tried to develop
the method by adding more parameters when classifying the inventories (Flores and Whybark,
1987; Ramanathan, 2006; Bhattacharya et al., 2007; Ng, 2007; Chu et al., 2008; Tsai and
Yeh, 2008).
Percentage of total turnover
C -articles
100
A -
articles
B -articles
80
50
20
Percentage of total articles 20 50 80 100
27
Turnover
High
Sales
volume Low
Low High
5.1.2 Multiple Criteria ABC Analysis In the last 20 years, there has been a development in research literature regarding decision
tools for multi-criteria inventory classification (Ng, 2007). Rudberg (2008) developed the
double ABC analysis, where he combines two parameters when classifying the articles in a
range. The two parameters used are turnover and sales volume, where the most important
article (AA) will have both a high turnover and high sales volume (see figure 4). By
classifying the articles based on this double ABC analysis Rudberg argues that it is easier to
avoid mistakes and get another picture of different ways to differentiate among the articles
within an organisation. He also argues that this tool is flexible because the organisations can
choose themselves which parameters to use.
Figure 4. Double ABC analysis (Rudberg, 2008).
Flores and Whybark (1986) claim that the criterion for what is most important in respect to
inventory items can change, depending on what part of the organisation is concerned.
Criticality and frequency are classification criteria that can be important to take into account.
Being out of stock on specific articles implies a very high cost even though its sales are
relatively low (Silver et al., 1998) and, according to Partovi and Burton (1993), some of
these articles can weigh even more heavily than dollar usage for the company. Other items are
important because they are used as components in many different products (Flores and
Whybark, 1986). Duran et al. (2007) mention the need for flexibility in the systems to be able
to deal with variability, uncertainty and changes in the business environment.
AA AC AB
BC BB BA
CA CB CC
28
5.1.3 Critical Value Analysis According to Bloomberg et al. (2002), Critical Value Analysis (CVA) is another important
classification model, which could be described as a complement model to the ABC analysis.
The model ranks its articles similar to the ABC analysis, but instead of using turnover as the
base, frequency is being used. The CVA analysis often consists of more than three categories
but not more than five, where the top category, with the highest prioritised articles, never
permits stock out, and where it is more acceptable for the category with the lowest
prioritisation to go out of stock on a wide basis.
This model differs from the ABC analysis in the way that it considers the customer
perspective rather than the organisation‟s perspective. This is done by classifying the items
most frequently bought by costumers as the most critical articles for the organisation, where a
OOS is not permitted (Bloomberg et al., 2002).
5.2 Customer Service and Service Level There are many definitions of the logistics concept in the literature. One of them is the Seven
R‟s rule, which defines logistics as: “ensuring the availability of the right product, in the right
quantity and the right condition, at the right place, at the right time, for the right customer, at
the right cost” (Shapiro and Heskett, 1985, cited by Lumsden, 2006, p. 22). The definition
indicates the essential activities of logistics and the role of logistics in interfacing with
availability. The revenue making part of logistics is the customer service part of the chain that
faces the customer, which Lumsden (2006) explains as the mix of different parameters; the
speed of delivery, delivery accuracy, quality, flexibility, information and service level.
Exactly what the relation between customer service and revenue looks like for every company
is hard to determine. It is expensive to provide a high level of customer service and it can be
hard to estimate the optimal level. An increased customer service has to result in increased
revenue to cover the costs (Lumsden, 2006).
One of the parameters included in the concept of customer service is service level, the
proportion of the total demand that can be met and delivered from the warehouse (Segerstedt,
2009), in percent. The element is critical when using a cash and carry system (Lumsden,
2006) because “if a product isn‟t on the store shelf then you can‟t sell it...!” (Grant, Lambert,
Stock and Ellram, 2006). The service level is also directly correlated to the size of safety
stock (see appendix 4).
29
Another parameter affecting customer service is information. Segerstedt (2009) brings up an
interesting result from a study by Linkoping‟s tekniska högskola where the customer service
(the speed of delivery, and delivery accuracy) was consciously impaired but the information
was improved which, resulted in a perceived improvement in customer service by the
customer.
5.2.1 On-Shelf Availability As mention earlier, high on-shelf availability (OSA) is important for retailers (Grant and
Fernie, 2008; McKinnon et al., 2007) especially for the ones using a cash and carry system
(Lumsden, 2006). Grant and Fernie (2008) argue that items that are out of stock (OOS) result
in customer dissatisfaction and that OSA/OOS are important customer service issues. They
refer to research on European consumers, made by ECR UK (2004), which rates OSA/OOS as
the third most important parameter after low prices and shorter queues. Towill (2005) states
availability as a market winner for “fashion goods”6 but claims that price is more important
for commodities.
Defining an optimum service level is hard to do since it is unique for every category and
product; a low service level is enough for some products while other products are expected to
always be available. It is always a trade-off between additional sales for higher OSA and the
cost of availability. Thus, it is widely known that the cost is not very transparent and hard to
measure (Corsten and Gruen, 2003) and therefore the trade-off is also difficult to analyse
(Bloomberg et al., 2002). Both components are strongly influenced by the customer‟s reaction
to an OOS which is specific to each buying situation and product (Trautrims et al., 2009).
According to Corsten and Gruen (2003) there are potentialities to boost the earnings per share
with up to 5 % by addressing the stock outs. “Where else can a retailer find so much potential
revenue without spending to attract new customers?”(p. 605) Trautrims et al. (2009) bring up
a test case where the UK retailer Marks & Spencer (M&S) investigates whether OSA of food
products could be improved by simply overstocking one store during four weeks. The
overstocking lowered the OOS by two-thirds and made the sales rise by about 1.7%. But it
also caused an increase in expired product waste of about 3.1%. The store first noticed an
6 Fashion products have a short life cycle and high demand uncertainty, therefore exposing the supply chain to
the risks of both stock out and obsolescence. A good example of a fashion product is trendy clothing (Mason-
Jones, Naylor and Towill, 2000). Other examples in the article by Towill (2005) are DVD-players and laptops.
30
increase in customer satisfaction but after a while the level of complaints raised when the food
was not as fresh as usual. The M&S trial shows that a higher OSA does not automatically lead
to more customer satisfaction. The cost of increasing OSA strongly depends on the method
used and OSA always means a trade-off between additional sales and costs.
5.2.2 Customer Reactions on Out Of Stock According to Corsten and Gruen (2003) “retailers have been struggling with considerable out-
of-stocks for decades- with little evidence of improvement” (p. 605). They present a research
project on customers reactions of OOS in fast moving consumer goods, showing that
customer face an average OOS rate of 8.3% on a word wide base. The international studies of
customer reactions on OOS in fast moving consumer goods industry identify five main
consumer reactions (see figure 5):
Figure 5. Consumer response to Out-of-stock (Corsten and Gruen, 2003).
Consumers seem to switch more in some categories rather than others (Grant and Fernie,
2008). Thus, Zinn et al. (2002) claim that according to their research there are usually
differences between what the customer intends to do and the actual behaviour.
Substitutability and product loyalty strongly influence a consumer‟s reaction towards an OOS.
High substitutability helps satisfy consumers even if their favourite product is OOS. Loyal
customers are more likely to actually delay or quit the search when facing a stock-out. Store
loyal customers are also less likely to follow-up on a stated intention to go to a competing
store in response to a stock-out. Bloomberg et al. (2002) refer to studies that have shown that
customers actually accept lower service level than most firms offer. Silver et al. (1998) argue
that in some situations customers are willing to wait a short time for delivery. Apart from that,
31
shortages are usually more expected in stores that offer a large variety of products compared
to stores with a smaller range (Schragenheim et al., 2009).
Trautrims et al. (2009) claim that retailers have the power to create a feeling of availability by
giving products more shelf space or putting it in a more visited area and as a result control and
increase the sales. Unfortunately shelf space allocation usually follows merchandising reasons
dissimilar to the optimisation of OSA.
Another insight is that customers perceive OOS to be higher in promotional rather than non-
promotional items (Trautrims et al., 2009). Promotions influence fluctuations in the demand
for particular products and their impact is usually difficult to forecast (McKinnon et al.,
2007). Trautrims et al. (2009) argues that increased sales and costs are strongly influenced by
the customer‟s reaction to an OOS. The reactions relates to the specific product characteristics
and to the particular situation.
5.2.3 Buying Situations No matter if a product was a planned purchase or bought on impulse, customers are constantly
in a process of evaluating the products they buy to see if they are satisfied or not. Solomon
(2010) argues that customer satisfaction has an impact on profitability.
5.2.3.1 Planned Buying
As mentioned earlier, there are usually differences between what the customers intend to do
and the actual behaviour in cases of OOS. The difference between impulse buying and
planned buying is that consumers with a specific item to purchase in mind are more likely to
match intended and actual behaviour, regardless of what the stated intention was. Consumers
who perceive the item as unique are more likely to follow-up on an intended behaviour to
delay the purchase and less likely to follow-up on a stated intention to go to a competitor
(Zinn et al., 2002).
5.2.3.2 Impulse Buying
Schragenheim et al. (2009, p.148) state that in case of spontaneous sales, disappointment is
not really relevant. “Customers aren‟t likely to be troubled by not finding a certain item in the
store if they weren‟t specifically searching for it”. But a situation of OOS can still result in
lost sales for the store, since some products are “targets of opportunity”, when customers
32
without a specific idea in mind start to purchase impulsively. They are only browsing, but the
availability of products to buy can convey to the customer an attractive variety of products
and make them buy spontaneously.
5.3 Measure Availability How to measure availability is yet another subject that has been discussed in the literature
(McKinnon et al., 2007; Grant and Fernie, 2008; Zinn et al., 2002). The issue goes beyond the
scope of this thesis, but some important implications will be explained.
“If a firm adopts a 97% in-stock availability policy, does this mean all customers receive 97%
service? Or is it more likely that 97% is an average, with some customers receiving above
average service and others below average service?” (Zinn et al., 2002, p. 19) These are
questions raised by researchers who argue that the received service for an individual customer
will wary depending on the mix of products bought by that customer, since different articles
within a range usually are assigned with different service levels. According to these
researchers, the usual measurement of availability does not capture the experienced service
level of individual customers. McKinnon et al. (2007, p.255) describe an example of a
situation from a customer standpoint; an average service level of 96,5 % across 200 high-
selling product lines may seem high, though a consumer shopping for many items would
perceive the level of availability to be much lower. For example, if they were planning to buy
20 items, there would be a 50 % chance that not all of the items would be available on the
shelf.7 The larger the basket of planned gods to buy is, the lower the chance is to get
everything right (Green, 2004). According to Hoff (2008), organisations which are able to
incorporate both distribution-centric and customer-centric strategies effectively will derive the
greatest benefit. “The greatest challenge, however, is not technology based but it is
organisational” (Hoff, 2008, p.43).
Other general deficiencies in analysis and measurements, compiled by McKinnon et al.
(2007), are that in-store inventory records rarely indicate the location of the stock within the
store and that it makes no reference to customer reactions and as a consequence- no
information to the management about the impact of stock-outs on total sales or profitability.
7 0,965^20=50%
33
According to Zinn et al. (2002) many measurements make a fatal service failure when
considering an item available as long as only one item is available.
In the next chapter our analysis will be presented, with focus on classification models
including our own suggested model. The analysis will also describe two other interesting
findings, relevant for IKEA to look in to, regarding the customer service and its connection to
SL, and how to measure the availability in a good way.
6. Analysis
6.1 Classification Models No company can afford to have all products available at all times, which IKEA also
emphasises, therefore some products will be considered to be more important than others.
This is where a lot of important questions arise. Which products are the most important and to
whom? What is the purpose of the classification?
According to Lumsden (2010) the most common approach for companies is to prioritise the
products with the highest turnover, which is what IKEA has done since 19858. The model
used is similar to an ABC-model where at IKEA the S1 and S2 should cover 75 % of the
turnover in every country, equivalent to A in the model. The S3 represents the B and the S4
represents the C with a larger number of not prioritised articles. In other words, the purpose of
the classification is to secure the sales. But the formulation in the “Rules of SL classification”
(“to give priority to the right articles in the whole supply chain to achieve high availability for
our customers and to secure the sales”) enables the employees to interpret the purpose in
many different ways, which became clear in the interviews. We think that the part; “high
availability for our customers” makes many employees believe that the products prioritised
are the products that most customers want to buy, or at least that the products have some
connection to the customers. This is where IKEA falls through today; considering the answers
from our respondents, the true purpose of the classification is not well known in the
organisation and other suggestions are very common. Many respondents think that the
purpose is to try and achieve more satisfied customers which, according to the researchers
(Lumsden, 2006; Segerstedt, 2009), is not guaranteed to be the outcome when the base of the
8 Apart from ad-, front- or back page in the catalogue and key articles for a product system.
34
classification is turnover. SL alone does not say much about customer satisfaction, but it is
considered to be an important parameter among others, when trying to get satisfied customers
(Ibid). This is also something that some of the interviewees at IKEA were aware of; “the SL
today says nothing about how satisfied a customer is, it only tells you which products are
available in the stores”, but it seems like the majority of the respondents are not familiar with
this fact.
According to many researchers (Lumsden, 2010; Olhager, 2000; Bloomberg et al., 2002), it is
important to clarify the purpose of the classification before trying to implement it, since it is
important that everyone knows which articles are the most important and why. It is therefore
very important that the information about the purpose becomes clear so everyone can work
towards a common goal. This was an issue that almost every respondent brought up; the need
of a clearer purpose and better guidelines to follow, communicated in an easy and
understandable way. “Simplicity is a virtue” is one commandment at IKEA.
We suggest that IKEA should change the classification model in order to try and fulfil the two
purposes; secure the sales and increase customer satisfaction (by increasing the perception of
availability). In order for IKEA to fulfil these two purposes we have developed a new model
(see figure 6 on page 37) which does not only consider turnover but also how to best satisfy
the customer by looking at frequency and the buying situation. This is suggested because
customer service has an impact on profitability (Solomon, 2010). According to Trautrims et
al. (2009), increased sales and costs are strongly influenced by the customer‟s reaction to
OOS. The reactions relates to the specific product characteristics and to the particular
situation.
6.1.1 Our Suggested Model The new model is a mix of the ABC analysis, which is similar to what IKEA uses today with
turnover as the base, and the CVA model which considers the customer perspective and uses
the stock out rate (frequency) as a base. According to Bloomberg et al. (2002), frequency is a
better base if you want to focus on the articles which are popular (sold most frequently)
amongst the customers, while turnover will give expensive products more focus than less
expensive products. As an example from how it works today; a dinner table that costs 4000
SEK and only one customer buys will get priority over a chair that costs 50 SEK and is
35
bought by 75 customers9. We claim that the core values of IKEA;”to create a better everyday
life for the many people” and that “IKEA should offer a wide range of well-designed,
functional home furnishing products at prices so low that as many people as possible will be
able to afford them”, suggest that frequency should be taken into consideration when
classifying the articles, so that less expensive and more popular products will get a higher
priority.
The new model will also take into account the different buying situations that customers face
when buying different types of products at IKEA, as well as the customer reactions on OOS,
which are parameters that recently have been highlighted by many researchers as very
important for consumer perception of availability and customer service (Corsten and Gruen,
2003; Grant and Fernie, 2008; Bloomberg et al., 2002; Schragenheim et al., 2009; Zinn et al.,
2002).
The first suggestion for IKEA is to sort out the “Key components” (the articles that enable a
product to be sold) and form a top group to prioritise; S0. This is a suggestion that many of
the interviewees highlighted, as well as Flores and Whybark (1986) who explain the
importance of securing availability of components used in many different products. Another
group of articles that deserves more focus, according to us, as well as several interviewees,
are products that are presented to customers through ad campaigns. “If a customer is attracted
to the store by an ad campaign, it is more important than anything else to have these products
available for that period of time” one respondent argued. Customers perceive OOS to be
higher in promotional rather than non-promotional items according to Trautrims et al. (2009),
and Lumsden (2006) argues that information is directly correlated to customer service, and to
give false information will harm the customer perception of the customer service at IKEA.
But, because of the campaigns‟ limited validation, this group of highly prioritised products
needs to be flexible in order to give them priority during a specific period of time and make
sure not to create substantial levels of safety stock of these products. The same logic applies
for seasonal products; no one is interested in Christmas decorations in January. There is a lot
of manual work done today by the employees to secure these products that usually classify as
S4. Duran et al. (2007) argue that flexibility in the system is important, i.e. to be able to deal
with variability, uncertainty and changes in the business environment. This is also something
9 The dinner table will stand for 4000 SEK, while the chair will stand for only 3750 SEK.
36
that some respondents touched upon during the interviews; “it is important to be able to
follow the fluctuations in the market”.
The next suggestion is to divide IKEA into two parts, “Furniture” (with 9 HFBs) and “Market
Hall” (with 10 HFBs), (see table 2 on page 13) because of the different buying situations;
planned buying at Furniture and impulse buying at Market Hall. Schragenheim et al. (2009)
claim that negative customer reactions on OOS for a planned good is much higher than for an
impulse buy and because of that, it is more important that customer satisfaction is the
“purpose” and goal for Furniture. The most frequently bought articles are the ones that should
be prioritised, because a stock out on these will create great dissatisfaction. At the Market
Hall availability is equally important, but for another reason. According to Schragenheim et
al. (2009), “customers aren‟t likely to be troubled by not finding a certain item in the store if
they weren‟t specifically searching for it”, but a situation of OOS will result in lost sales for
IKEA, which is why secure the sales should be the “purpose” and goal at the Market Hall.
One sales-responsible at the Market Hall claims that relocations can make a customer
perceive good availability which will make the customer satisfied. If the customer was
planning to buy a specific product, it is easier to present a substitute at the Market Hall
compared to Furniture according to an interviewee, but if the customer does not find any
substitute, the probability that he will come back to IKEA is considered to be low and sales
opportunities will be lost. High substitutability helps satisfy customers even if their favourite
product is OOS. To be able to be even more specific about the buying situations and the
customer reactions on OOS an advice for IKEA is to perform a deeper analysis as the
example by Corsten and Gruen (see figure 5 on page 30).
The optimal number of levels and number of products in each level depends on different
circumstances, according to Silver et al. (1998), but three categories is usually the minimum.
The apprehension perceived from a majority of the interviewees is that the number of S1s
should decrease in order to give them a better focus. The number of S2 could be reduced too,
because of the wide range of products at IKEA. Some respondents requested a set number of
S2, in the same way as the S1s. In accordance with the researchers and the interviewees, we
do not see any reasons to change the way of classifying the S3 and S4.
37
Figure 6. Our own suggested model for IKEA to use.
What percentage of availability that is optimal for every SL is hard to decide, because it is
unique for every category and product (Corsten and Gruen, 2003) but as table 3 in Appendix 4
shows, a small raise in SL will lead to a big increase in the safety stock. On the other hand,
OOS will lead to lost sale opportunities and other costs for the company. As Lumsden (2006)
argues, a cash and carry company would not be much without products available. As the
example by Trautrims et al. (2009) show, when a store raise the level of availability the sales
rises by 1.7 % but new costs arose and the final result became a decrease in profitability. This
test case was made in the grocery industry where costs of wasting old food are critical. It
would be interesting to implement a similar test at IKEA to see if the results will be any
different.
One request that was brought up by some respondents was to create clearer guidelines of how
to work with the articles in the different SLs. The use of the 17 rules in “Always available” is
not implemented fully by any of the employees that were interviewed and the impression
perceived was that the employees thought that is was impossible (too expensive) to
implement, which harms its credibility. Therefore it might be a good idea to look over those
rules again to make them more concrete and possible to implement.
S4- Other articles;
Turnover Frequency
S3- Other catalogue articles;
Turnover Frequency
S2- Good selling products; Turnover Frequency
S1- Top selling products;
Turnover Frequency
S0- Key components,
flexible group of seasonal and
activity products
Furniture Market hall
38
6.1.2 Customer Service and Service Level As Lumsden (2006) argues; “customer service is the revenue making part of logistics and
included in customer service is SL and information; the only parameters that a Cash and Carry
company can affect”. We think that IKEA has great potential in increasing customer service
and customers‟ perception of availability by improving information. As Segerstedt (2009)
showed by presenting the study by Linköping‟s tekniska högskola where the customer service
was consciously impaired but the information was improved, the result was a perceived
improvement in customer service. This is an interesting result which, together with the fact
that customers are willing to wait a while for delivery in some situations (Silver et al., 1998),
could result in the fact that IKEA could get away with a lower service level on some goods,
without hurting the customer relation, if they could secure good information10
. It takes a
deeper investigation to decide exactly in what way the information should be improved, but
according to the interviewees working in the store, an accurate stock balance is an important
area to look into.
6.1.3 Measure Availability As mentioned in the theoretical background good logistics is defined as: “ensuring the
availability of the right product, in the right quantity and the right condition, at the right
place, at the right time, for the right customer, at the right cost” (Shapiro et al, 1985, cited by
Lumsden, 2006, p. 22). If IKEA were to implement these R‟s in order to measure the
availability in a more accurate way, they would have to change a few things concerning the
measurement of some of the R‟s. The problem with the system in the stores today is that it
shows an article as available as long as the store has at least one article in stock, therefore a
better measurement concerning the “right quantity” is needed. One suggestion that was
mentioned by an interviewee was to calculate the average number of pieces an article often is
sold in, by having a look at the receipts, and base the minimum quantity according to that
number. Another respondent also emphasised the importance to measure the availability at the
“right place”, in other words at the sales location rather than “somewhere” in the store, where
the article may not be available to the customer. Lastly we also think that it is important to
measure the availability at the “right time”, not only before opening time as is done today but
maybe a few times during the day and after closing time. Finding a system that could measure
10
In support for this, it was said during an interview that almost 70% of the kitchen customers chose home
delivery, which could be interpreted as if customers are willing to wait some time for their kitchen, as in this
case.
39
it more accurately would be to prefer since only doing it in the mornings can create a belief of
a better availability when that may not be the case. As McKinnon et al. (2007) state; an
incorrect measuring system will make the management believe that the SL is fine when it is
not.
Another important issue for IKEA to take into consideration is the fact that qualitative surveys
need to be done in order to be able to say anything about how satisfied a customer is. The
closest IKEA gets to this is their own customer survey (CSI) which we have understood, from
our respondents, does not ask the optimal type of questions in order to be able to analyse the
customer satisfaction regarding availability. To be able to capture this point of view we think
it is important to ask the right type of questions, do it more frequently and analyse it more
thoroughly.
7. Conclusion and Recommendations The purpose of this master thesis was to investigate the possibilities to extend or change the
base of IKEA‟s SL classification and give recommendations concerning potential
improvements. After conducting 33 interviews with employees at different parts of the
organisation it became clear that the purpose of the classification was not perceived in the
same way within the company. According to Lumsden (2010), Olhager (2000) and
Bloomberg et al. (2002), it is very important that everyone who is working with the
classification has the same goal in mind in order to reach that goal. IKEA needs to improve
the internal communication so that everyone knows why they are supposed to act in certain
ways. We also believe that a clear purpose will increase the motivation and unify the
company in a better way.
Amongst the many different suggestions of what the purpose of the classification is, the two
most common proposals were to secure the sales and increase customer satisfaction (by
increasing the perception of availability). The classification used by IKEA today can only
fulfil the first one, when using turnover as the base for the classification. We have developed
a model which is a mix of the ABC classification (similar to what is used today) and the CVA
model by Bloomberg et al. (2002), which also takes into account the different products,
buying situations, and customer reactions on OOS, which are important parameters for
consumer perception of availability and customer service. We believe that this model better
40
suits IKEAs goal of “having the products that customers want to buy, when they want to buy
them” (IKEA Tillsammans, 2011-02-28) and the core values “to create a better everyday life
for the many people”.
Unfortunately there is no ultimate SL for all companies to use and it is always a trade off
between costs and increased sales (as well as increased customer service). We have referred to
research (Corsten and Gruen, 2003) made on customer reactions on OOS in the grocery
sector, so it is hard to give any certain statements more than the fact that the reactions differ
between planned and impulse buying. According to Zinn et al. (2000), loyal customers have
more tolerance when it comes to product OOS, which could be beneficial for IKEA compared
to the grocery cases described.
Recommendations of how to improve the way of measure SL have been given in order to get
a better result, but one important conclusion is that IKEA needs to develop a better way of
measuring customer satisfaction; by using a more developed customer survey. In other words,
we believe that our model can fulfil the two purposes but it requires two different
measurements for evaluation of the results.
To be able to increase customer service, information is another important part. If a product is
OOS, accurate information can be a way to keep a customer satisfied. According to our
interviewees in the stores, there is a substantial possibility of improvement in the work of
sales control. Trautrims et al. (2009) claim that retailers have the power to create a feeling of
availability by putting it in a more visited area and, as a result, control and increase the sales.
Unfortunately, shelf space allocation usually follows merchandising reasons dissimilar to the
optimisation of OSA, which also is the case at IKEA. If the stores could get better information
about SL classification and its purpose and if their sales guide “Sell This” were synchronised
with the classification, it could ease the work of selling the products with high availability and
avoid situations of OOS.
One final recommendation that we want to make is for IKEA to try and work with the internal
synchronisation of the different organisations. As we understood by compiling the response
from the interviews, IKEA is built up in this way to create a healthy competitive environment,
but in this case, regarding SL, collaboration is needed. The recurring expression “rules are
41
meant to be challenged” is not a good way to work with SL classification. If IKEA states a
clear purpose of the classification and rules for the employees to follow, the result will not be
very good if no one cares about the rules and makes his or her own case. As one interviewee
said; “IKEA consists of a group of creative entrepreneurs”. This can be positive in some
situations, but not in this one where it is important that everyone takes one step back in order
to see the big picture and stop sub optimise for their own good, and follow in the direction of
one of IKEA‟s long term goals, “working together”. If people suspect each other of breaking
the rules, we do not believe that the probability of each HFB doing the right thing themselves
is very high, and that the credence of the system will get hurt. However, we are optimistic
about this issue because we got the impression that the employees requested stricter
guidelines and clear information and that many of them are willing to change their behaviour,
as long as they know for what purpose and reason.
SL classification is an important KPI at IKEA and by putting more effort in to the internal
communication, trying to create a more user friendly working tool for the employees and
improving the information to the customer, we believe that IKEA can secure sales and
increase customer satisfaction.
42
8. Sources
8.1 Books and Articles Anon, 2010. A rule-based multi-criteria approach to inventory classification. 7107-7126.
Bhattacharya, A., Sarkar, B. & Mukherjee, S.K., 2007. Distance-based consensus method for
ABC analysis. International Journal of Production Research, 45, 3405-3420.