117
Service Monitoring for a Mobile Money System Master degree in Computer Science – Mobile Computing Diogo Manuel Santos Correia Leiria, April of 2020

Service Monitoring for a Mobile Money System
Master degree in Computer Science – Mobile Computing
Diogo Manuel Santos Correia
Leiria, April of 2020

Service Monitoring for a Mobile Money System
Master degree in Computer Science – Mobile Computing
Diogo Manuel Santos Correia
Internship Report under the supervision of Doctor Anabela Moreira Bernardino, professor
at the School of Technology and Management of the Polytechnic Institute of Leiria and co-
supervision of Doctor Eugénia Moreira Bernardino, professor at the School of Technology
and Management of the Polytechnic Institute of Leiria.
Leiria, April of 2020

iii
Originality and Copyright
This internship report is original, made only for this purpose, and all authors whose studies
and publications were used to complete it are duly acknowledged.
Partial reproduction of this document is authorized, provided that the Author is explicitly
mentioned, as well as the study cycle, Master degree in Computer Science – Mobile
Computing, 2019/2020 academic year, of the School of Technology and Management of the
Polytechnic Institute of Leiria, and the date of the public presentation of this work (when
applicable).

iv
Dedication
I want to dedicate this document to my family and friends for all the motivation,
encouragement and support during all my academic studies.

v
Acknowledgements
First of all, I would like to thank all my colleagues that helped me during all my
academic studies.
I also want to thank WIT Software and my supervisor Tiago Marto for the opportunity
of working on this project, and also my fellow internship colleague Ruben Pereira as well as
M-Pesa team for the insights and help provided during all the internship period
I am thankful to my coordinators for their help, patience, and support.
Finally, I want to thank my family for their constant concern and support throughout this
academic journey.

vi
Abstract
Mobile applications are gaining more and more market share and virtually everyone
today has smartphones. This reality is no different in Africa, where the use of mobile
payment systems has grown and allowed people without access to bank accounts to use their
phones to perform banking operations.
Currently, WIT Software provides these countries with a Mobile Money System solution
providing a Backend and Mobile Application, that allows users to make and receive
payments, lend money and pay into mortgages, check statements, and transactions’ history.
Still, another important aspect is the availability and functionality so that users can use it
without interruption.
In this way, was proposed to design a monitoring platform that will allow users to
perceive the health status of the total system from the users' side, to detect problems either
in applications, servers or even in network components that may be running. Prevent the
correct functioning of this system that allows millions of people to have their bank account
associated with their mobile phone number.
This report describes all the work carried out for nine months at the company WIT
Software, which involves the design and implementation of a Monitoring Platform for a
Mobile Payments System.
Keywords: monitoring, mobile payments system, M-Pesa

vii
Contents
Originality and Copyright ........................................................................................... iii
Dedication ..................................................................................................................... iv
Acknowledgements ....................................................................................................... v
Abstract ......................................................................................................................... vi
List of Figures ............................................................................................................... ix
List of Tables ............................................................................................................... xii
List of Abbreviations and Acronyms ....................................................................... xiii
Introduction ............................................................................................................... 1
1.1. Goals and Motivation ............................................................................................ 1
1.2. Host Institution ....................................................................................................... 3
1.3. Structure of the Document .................................................................................... 3
Background ............................................................................................................... 5
2.1. Mobile Money System ............................................................................................ 5
2.2. Monitoring Problems ............................................................................................. 6
2.3. Existing Monitoring Solutions .............................................................................. 8
2.3.1. Nagios .............................................................................................................. 9
2.3.1. Zabbix ............................................................................................................ 10
2.3.2. Pingdom ......................................................................................................... 11
2.3.3. Cabot .............................................................................................................. 12
2.3.4. Prometheus ..................................................................................................... 13
2.3.5. Spring Boot Actuator ...................................................................................... 14
2.3.6. Conclusion and Considerations ....................................................................... 15
Methodology and Planning .................................................................................... 17
3.1. Methodology ......................................................................................................... 17
3.2. Planning ................................................................................................................ 19
Architecture ............................................................................................................. 22
4.1. Mobile Money System Architecture ................................................................... 22
4.2. Monitoring Solution Architecture ...................................................................... 25
4.2.1. Backend Architecture ...................................................................................... 27
4.2.1. Frontend Architecture ..................................................................................... 34
Implementation and Development Process .......................................................... 37

viii
5.1. Requirement Analysis ......................................................................................... 37
5.2. Technologies ......................................................................................................... 40
5.2.1. Angular ........................................................................................................... 40
5.2.2. Java and Spring Boot ...................................................................................... 41
5.2.3. Oracle Database .............................................................................................. 41
5.2.4. MongoDB ....................................................................................................... 42
5.2.5. GIT .................................................................................................................. 42
5.2.6. Other Tools/Frameworks ................................................................................ 42
5.3. Prototypes ............................................................................................................. 43
5.4. Monitoring Solution Functionalities .................................................................. 46
5.4.1. Authentication & Security .............................................................................. 47
5.4.2. User Management ........................................................................................... 52
5.4.3. Services/Third Parties ..................................................................................... 56
5.4.4. Operations ....................................................................................................... 65
5.4.5. Alarms............................................................................................................. 71
5.4.1. Notifications ................................................................................................... 72
5.5. Mobile Money System Functionalities ............................................................... 80
5.5.1. WIT Backend .................................................................................................. 80
5.5.2. Monitoring Server ........................................................................................... 83
5.6. UI/UX Updates ..................................................................................................... 83
5.7. Continuous Integration/Docker .......................................................................... 84
5.7.1. Pipelines .......................................................................................................... 86
5.7.2. Docker............................................................................................................. 86
Conclusion ............................................................................................................... 88
Bibliography ................................................................................................................ 90
Appendices .................................................................................................................. 94

ix
List of Figures
Figure 1 - Countries operating M-Pesa in 2016 [1] ........................................................................................... 6
Figure 2 - Example of Nagios Dashboard ....................................................................................................... 10
Figure 3 - Zabbix dashboard ............................................................................................................................ 11
Figure 4 - Pingdom, monitoring the availability of a website ......................................................................... 12
Figure 5 - Example of a Prometheus endpoint, of a Spring Boot microservice, displaying the Java and
RabbitMQ metrics for instance ....................................................................................................................... 13
Figure 6 - Integration of Prometheus + Grafana, Dashboard (source [3] ) ...................................................... 14
Figure 7 - Spring Boot Health Actuator Request example .............................................................................. 14
Figure 8 - Spring Boot Actuator Shutdown and Not Allowed......................................................................... 15
Figure 9 - Issues Burnup Chart ........................................................................................................................ 19
Figure 10 - Gantt Diagram with the developed tasks and activities ................................................................ 21
Figure 11 - System Architecture ...................................................................................................................... 22
Figure 12 - M-Pesa User Requests Flow ......................................................................................................... 23
Figure 13 – Middle System Architecture with an example of a request made from the application's user ..... 26
Figure 14 - Final Architecture ......................................................................................................................... 26
Figure 15 – pom.xml example ......................................................................................................................... 27
Figure 16 - Backend Architecture Diagram..................................................................................................... 28
Figure 17 - Aggregation Example ................................................................................................................... 33
Figure 18 – Relationship of Entities Diagram ................................................................................................. 34
Figure 19 - Angular Component-Based approach ........................................................................................... 35
Figure 20 - Marvel App Monitoring Platform Prototype Screens ................................................................... 44
Figure 21 - Example of a Mockup Screen, Dashboard Screen ........................................................................ 45
Figure 22 - Services Monitoring Mockup ....................................................................................................... 45
Figure 23 - Alerts/Notifications Mockup ........................................................................................................ 46
Figure 24 - User Login DTO ........................................................................................................................... 48
Figure 25 - Login API response when user details are valid, AuthTokenResponse object ............................. 48
Figure 26 - Login Method ............................................................................................................................... 49
Figure 27 - Login Page .................................................................................................................................... 50

x
Figure 28 - Decoding a JWT token .................................................................................................................. 50
Figure 29 - Set a password ............................................................................................................................... 51
Figure 30 - User enters the Platform, authenticates, selects an Environment/Location and gets information in
real-time ........................................................................................................................................................... 52
Figure 31 - Method for users with the admin role ............................................................................................ 53
Figure 32 – Method for users with Admin and Management Roles ................................................................ 54
Figure 33 - User with Management/Admin Role ............................................................................................. 54
Figure 34 - User with Normal Role .................................................................................................................. 55
Figure 35 - Error Interceptor ............................................................................................................................ 56
Figure 36 - Example of the JSON Response from the Health endpoint ........................................................... 57
Figure 37 – Services ......................................................................................................................................... 59
Figure 38 - Service Settings ............................................................................................................................. 60
Figure 39 - Custom Response Time Threshold for a Service Item .................................................................. 60
Figure 40 - Fetching information about external Services and trigger an Alarm (Backend Flow) .................. 61
Figure 41 - Authenticated User gets services listing with real-time updates (Backend + Frontend flow) ....... 61
Figure 42 - Example of data aggregation ......................................................................................................... 62
Figure 43 - WebSocket Service and Observable .............................................................................................. 63
Figure 44 – Component code that subscribes to a certain observable and updates the Service Table with Service
Item updates ..................................................................................................................................................... 64
Figure 45 - Service Item Information Tab ....................................................................................................... 64
Figure 46 - Services Item Charts Tab............................................................................................................... 65
Figure 47 - Operations, create a new endpoint, receive operations entry and update the Monitoring Platform UI
......................................................................................................................................................................... 66
Figure 48 - Connection Endpoint for the Monitoring Server to send the entries ............................................. 67
Figure 49 - List of applications and gateways on the selected environment .................................................... 68
Figure 50 - Operations in the worst condition .................................................................................................. 69
Figure 51 - Available configurations for the Operations chart ......................................................................... 69
Figure 52 - List of Operations of an example Application ............................................................................... 70
Figure 53 - Details of a Request ....................................................................................................................... 71
Figure 54 - List of latest Alarms ...................................................................................................................... 72
Figure 55 - Alarms filter by Severity and data interval .................................................................................... 72

xi
Figure 56 - Details of an Alarm ....................................................................................................................... 73
Figure 57 - Send SMS using Nexmo REST API ............................................................................................. 74
Figure 58 - Send an email using the Java Mail Sender and Template Engine ................................................. 74
Figure 59 - HTML Template ........................................................................................................................... 75
Figure 60 - Send an Operation Health Change to a specific channel .............................................................. 76
Figure 61 - Sending Alarm Notification through multiple communication channels ...................................... 76
Figure 62 - Alarm Notification on the platform. ............................................................................................. 77
Figure 63 - Subscribe to the WebSocket with JWT Auth, and subscribe to Current Location Channel ......... 77
Figure 64 - Change Location and update Notifications ................................................................................... 78
Figure 65 - Update the User Muted notifications (Operations/Services) ......................................................... 79
Figure 66 - Disable Platform Notifications ..................................................................................................... 79
Figure 67 - Example email of a new triggered Alarm ..................................................................................... 79
Figure 68 - Example of SMS notifications ...................................................................................................... 80
Figure 69 - WIT Backend external services health check mechanism ............................................................ 82
Figure 70 - JSON Response by the Health API of the WIT Servers ............................................................... 82
Figure 71 - Initial Dashboard Design .............................................................................................................. 84
Figure 72 - UX/UI Refresh implemented Dashboard ...................................................................................... 84
Figure 73 - Continuous Integration Process .................................................................................................... 85
Figure 74 - Backend Dockerfile ...................................................................................................................... 87
Figure 75 - Frontend Dockerfile ...................................................................................................................... 87

xii
List of Tables
Table 1 - Must, Should and Nice To Have ....................................................................................................... 39
Table 2 - List of technologies and platforms used along with the development .............................................. 40
Table 3 - Roles Based Table ............................................................................................................................ 53
Table 4 - Connection Information Table .......................................................................................................... 58
Table 5 - Service Status Information................................................................................................................ 58

xiii
List of Abbreviations and Acronyms
AWS Amazon Web Services
CI
CPU
CSS
Continuous Integration
Central Processing Unit
Cascading Style Sheets
DBaaS
DEV
DNS
Database as A Service
Development
Domain Name System
DR Disaster Recovery
EC2 Elastic Cloud Computing
ESTG Escola Superior de Tecnologia e Gestão
FCM Firebase Cloud Messaging
HTML
HTTP
HiperText Markup Language
Hypertext Transfer Protocol
IDE Integrated Development Environment
IPL Institute Polytechnic of Leiria
JEE Java Platform Enterprise Edition
JSON JavaScript Object Notation
JWT JSON Web Tokens
MaaS
MMS
Monitoring as a Service
Mobile Money System
MSISDN Mobile Station Internal Subscriber Directory Number
OAT Operational Acceptance Testing
ORM Object Relational Mapping
PIN
PoC
POP3
Personal Identification Number
Proof of Concept
Post Office Protocol 3
PR Production
RAM Random Access Memory
RDBMS Relational Database Management System
RDS Relational Database Service

xiv
SIM
SMS
SNMP
SSH
SSL
UAT
Subscriber Identity Module
Short Message Service
Simple Network Monitoring Protocol
Secure Shell
Secure Socket Layer
User Acceptance Testing
UI User Interface
USSD Unstructured Supplementary Service Data
WWW World Wide Web

Service Monitoring for a Mobile Money System
1
Introduction
The following report describes the work developed along with the internship of the
curricular unit Internship of the master’s in computer science – Mobile Computing, lectured
by the School of Technology and Management of the Polytechnic of Leiria
The report goal consists in describing the work developed during the internship at WIT
Software that took place from October of 2018 to July of 2019.
In the first section (section 1.1) is described the goals and motivation of the internship,
in the second section (section 1.2) is detailed the internship entity and in the third section
(section 1.3) it is described the organization of this document.
1.1. Goals and Motivation
Mobile Money System that allows using the mobile phone as a payment solution is
increasing around the world, with the improvement of the technology. Currently, the mobile
phone can replace the credit cards or even the ATM and would allow the users to perform,
withdraw, and receive payments.
M-Pesa is one of those Mobile Money Systems and allows to underbanked people1 to
have an account under their phone number that allows to receive the wage, make and receive
payments. M-Pesa is rapidly growing and allows millions of people around the world to
perform essential and critical transactions, and a straightforward thing as a malfunction on
the system or even a downtime could impact many people. So one of the main motivations
of this internship is helping to prevent and detect those malfunctions, and help to identify
which element might be compromising the whole system quickly.
The main goal of the internship is to successfully develop a monitoring solution that can
detect malfunctions on the services of a Mobile Money System, and by recognising those
problems, being able to trigger alerts and identify the current and past states of the system.
To detect which services underperform it is required that the solution knows the state of
the system to compare with reference values, to verify if the values are surpassed. In case
1 People or organizations who do not have sufficient access to mainstream financial services and products
typically offered by retail banks and thus often deprived of banking services such as credit cards or loans.

Service Monitoring for a Mobile Money System
2
that is verified, it will raise one alarm and store it to build a timeline about the system's health
and to identify potential system failures or malfunctions. However, some of the information
required to know the state of the system might not be available, or when available is not
easily accessed, so it was needed to architect and implement a solution able to fetch those
values from all the system components (internal and external) and use it to detect
inconsistencies on the system and to possible took some actions (raise alarms).
With all the necessary tools and required information, it is then possible to know the
state of the system, and by continuously analysing the stream of data, the implemented
solution mechanisms can identify and record which elements of the system are degrading.
By identifying and documenting those failures and performance breaks, it is then
possible to maintain a timeline of the system health over time, and quickly determine which
services are not working correctly.
Some of the characteristics that the monitoring platform should have to achieve the goals
can be having multiple users and locations on the platform. This allows keeping track of
existing environments and locations that are part of the mobile money system. For example,
multiple countries and each country contain multiple environments, and each environment
has different monitoring requirements like a production environment that should have strict
monitoring requirements and a development environment that should have less strict
requirements.
Other important characteristics are that all the obtained data should be centralized, being
able to display summarized information about the system health status, allow to present and
get details about the triggered alarms, and being able to customize alarms.
Data centralization is an essential aspect of the platform since it enables the data to be
accessible through only one platform, for example, getting the details of triggered alarms,
consult the statistics (graphs and average data) in only one platform instead of using multiple
tools.
Summarized information is also an essential aspect since it allows to know the overall
system and system services state, quickly knowing if the system is up, identifying elements
that can be bottlenecking the system.

Service Monitoring for a Mobile Money System
3
Should also be provided detailed information about the triggered alarms, list the alarms
on a specified date, consulting, and comparing the information with other days.
Finally, the last aspect of the platform is allowing to customize threshold and being able
to send alerts via multiple propagation channels, to notify the platform users about changes
in the system.
1.2. Host Institution
WIT Software is a Portuguese software development company specialized in rich and
unified communications for mobile operators and mobile internet companies and has as
clients some of the most reputed companies in the world like Vodafone, T-Mobile, Orange,
Telefonica, Bell, TeliaSonera and many others [1].
The company was founded in Coimbra in 2001 as a spin-off of the Instituto Pedro Nunes
and from the University of Coimbra. Currently has its headquarters based in Lisbon, with
multiple development facilities in multiple Portuguese cities, like Coimbra, Porto, Leiria,
Aveiro, and an office on the United Kingdom. WIT employs over 300 employees distributed
around all the facilities.
1.3. Structure of the Document
The present document is organized into five chapters. In the first chapter is described
the theme of the internship and presented an introduction to the developed work with its
motivation and objectives.
Throughout the second chapter, it is given a brief contextualization, where it is intended
to describe the Mobile Money System used as a reference, a short description of monitoring
and the importance of monitoring, also some related monitoring services that were taken into
consideration during the development.
During the third chapter, it is presented and described the methodology used along with
the planning of the internship.
Throughout the fourth chapter is explained the system architecture of the implemented
solution, and in the fifth chapter, it is described some of the technologies used, the initial
mockups, the implementation process with a description of the functionalities and examples,
the UI/UX changes and the continuous integration implementations that were implemented.

Service Monitoring for a Mobile Money System
4
The sixth and final chapter is the conclusion, and through this chapter are presented the
conclusions, as well as the reached results and future work.

Service Monitoring for a Mobile Money System
5
Background
This chapter contains a brief presentation about the Mobile Money System that was used
as a reference to build a monitoring system that was able to monitor the services and display
information about the system's health.
In section 2.1, it is made a brief presentation about the Mobile Money System that will
be used as a reference for this proof-of-concept project.
Throughout the section 2.2, it is presented some monitoring problems that were
contextualized by the WIT Development Team along with the internship, and that this
solution intends to solve or minimize.
Finally, in section 2.3, will be presented multiple existing monitoring solutions along
with a brief description of how some aspects of these monitoring solutions could be
implemented and used on the development of the monitoring platform.
2.1. Mobile Money System
The MMS (Mobile Money System) used as a reference for the monitoring platform
development was the M-Pesa MMS. M-Pesa mainly operates on the African continent and
was launched initially in 2007 by Vodafone for Safaricom and Vodacom, the largest mobile
network operators in Kenya and Tanzania.
In 2010, M-Pesa was operating in 10 different countries, Albania, Democratic Republic
of Congo, Egypt, Ghana, India, Kenya, Lesotho, Mozambique, Romania and Tanzania, and
served almost 30 million active users.
M-Pesa enables millions of peoples that do not have or have limited access to a banking
account, to send and receive money using their mobile phones. To access M-Pesa, the users
need to have a mobile phone with a valid phone number and to deposit money in their
accounts. They can go to authorised agents and deposit cash in exchange for electronic
money which can be sent to family or friends or even pay bills. These operations are
protected by a PIN (Personal Identification Number), and both parties receive an SMS
confirming that the amount has been transferred. The recipient receives the electronic money
in real-time and can redeem it for cash by visiting another agent.

Service Monitoring for a Mobile Money System
6
Figure 1 - Countries operating M-Pesa in 2016 [1]
To use the M-Pesa MMS, the users can use Android or iOS applications for smartphones,
and in case they do not have smartphones it is also possible to use the USSD (Unstructured
Supplementary Data) codes and also using SIM (Subscriber Identity Module) Toolkit
applications.
According to Vodafone, “On 31 December of 2016, M-Pesa was live in 10 countries,
had almost 30000 agents, 29.5 million active users, 614 million transactions per month, and
529 transactions per second” [1].
2.2. Monitoring Problems
At the start of the internship, the development team responsible for the mobile
applications and Backend development of the mobile app component of the Mobile Money
System solution identified and described some of the challenges encountered along the years
and reported by the markets, that caused the system not work as expected. These
opportunities for improvement are identified and described in the following paragraphs.
One of the first items identified was the inability of knowing the health state of the
system, this problem was reported by both parties (WIT Development Team and Markets),
since sometimes the application suddenly stopped working, not triggering any alarms but by
simply not working. Every time this happened, WIT was informed and the development

Service Monitoring for a Mobile Money System
7
team would need to search through all the logs generated by the multiple servers running the
Backend and also the logs triggered by the mobile applications, to figure out what caused
the system to stop working correctly.
It was not possible to know when the system was down since there is no way of checking
it. To our knowledge, there is no platform that allows to check the state of the system during
an interval and check any spikes on performance or failures that shut down the system.
When a system/infrastructural malfunction happens, for example, like when there is a
problem on network layer/communication layer, the system automatically detects and
triggers alarms (SNMP Traps - Simple Network Management Protocol) that will be
forwarded for support teams that will analyse and take correctional measures to keep the
system from malfunctioning. Still, these triggered alarms can be cleared by another node,
which is working correctly or simply by the monitoring team, not noticing quickly enough
the triggered alarms. A few examples of alarms that were cleared or ignored can be found in
the following paragraphs:
• DNS Problems and Binary alarms, the requests generated by the application before
they reach the Server need to pass by DNS (Domain Name System) servers and load
balancers, and there were multiple problems encountered, for example, multiple
users could access and perform a transition through the application, but sometimes,
those requests failed. After searching in-depth, the requests logs, the requests passed
by one of three DNS servers, and for some reason, one of those servers was rejecting
packets, when those packets were rejected, alarms were raised, but on the other hand,
when another request passed by the DNS server working correctly, the raised alarms
were cleared, resulting on intermittent alarms.
• Ignored alarms by the support teams, it was also verified most of the time, when a
new alarm was raised, the support teams did not notice the alarms causing them to
be ignored. This alarm alerts the support teams that something was wrong with
infrastructure or application, and by clearing the alarm the source of the problem was
not identified, even if the application was working correctly and the source problem
was not detected on time. The problem was them reported to WIT being an
application problem, which eventually, figured out the source of the problem was not
related nor the WIT application nor the WIT Backend.

Service Monitoring for a Mobile Money System
8
• Infrastructure Problems, the Mobile Money System works via the internet, and most
of the countries where the application is working have poor internet access. In some
remote areas, access is limited to GPRS, which causes the application not to work.
• Existing information is scattered, information about the system malfunction is only
available on log files, and in the form of SNMP Trap alarms that are sent to the
support teams and are recorded to check the system state.
Also, the unavailability of monitoring tools, the lack of monitoring tools that allow
checking the overall system status, or existing tools that enable getting the overall system
status but currently are only available for the support teams, and like was mentioned above,
can be misunderstood muffled and cleared by another node working correctly or simply by
not being noticed in time by the monitoring teams.
The MMS also depends on multiple external services, that did not have any form of
monitoring, and when down, can stop the whole system from working correctly. Also, the
currently existing tools cannot actively check the state of each external service in “real-
time”, but only between particular time intervals.
2.3. Existing Monitoring Solutions
This section describes the different types of monitoring as well as examples of some
solutions for each monitoring type. For each solution, is presented a summary of some
functionalities, advantages, and disadvantages.
For fetching existing monitoring solutions, it was conducted a research, where it was
analysed some monitoring solutions. When researching monitoring solutions, it was also
taken into consideration the monitoring of infrastructure and availability monitoring.
Infrastructure Monitoring Tools:
Infrastructure Monitoring tools capture the availability of the IT infrastructure
components that reside in a data-centre in which they are hosted. These tools monitor and
gather the availability and resource utilization metrics of servers, networks, databases,
hypervisors, storages, and much more.

Service Monitoring for a Mobile Money System
9
The tools collect the data in real-time and perform historical data analysis to check the
state of the elements being monitored. It is also able to trigger alarms based on the
performance and availability of the services.
Availability Monitoring:
Availability monitoring consists of tracking and monitoring the availability of a service
or application; this can be obtained by checking the uptime and response time of the
applications, that is reported as every minute goes by. Unlike the Infrastructure Monitoring,
there is the need to have a specified software running on the infrastructure/hardware to know
the overall system state. Availability monitoring only needs a valid endpoint to test the
availability and performance of the application.
Availability monitoring is an essential factor on every website, product, or service that
is on the internet. It allows to keep track of the status of the system in real-time, by having
the site to be “tested” and checked if it is answering correctly, and also allows testing from
multiple locations allowing to mislead problems that can only be happening from a certain
location.
2.3.1. Nagios 2
Nagios is a free and open-source monitoring tool, first launched in 1996 by Ethan
Galstad. This monitoring tool offers to monitor and alerting services to servers, switches,
and applications. It was initially designed to run under Linux, but it can also run in other
Unix variants [2].
To start monitoring with Nagios, it is required to install Nagios on a machine, and within
the Nagios infrastructure, it can be monitored multiple servers, switches, and other
applications. It can also monitor networks services like DNS (Domain Name System), SMTP
(Simple Mail Transfer Protocol), POP3 (Post Office Protocol), HTTP (HyperText Transfer
Protocol) and others, can monitor server resources (CPU – Central Processing Unit, RAM –
Random Access Memory, disk usage, network load/usage), remote monitoring using SSH
(Secure Shell) or SSL (Secure Socket Layer) tunnels and also allows integrations with
multiple plugins.
2 https://www.nagios.org/about/

Service Monitoring for a Mobile Money System
10
This tool is more indicated for infrastructure monitoring and not service monitoring. In
Figure 2 is presented a Nagios Dashboard panel, containing information about servers in a
network.
Figure 2 - Example of Nagios Dashboard
2.3.1. Zabbix 3
Zabbix is an open-source monitoring software tool, developed in 2001 by Zabbix LLB.
Zabbix provides monitoring to several IT components like servers, virtual machines, and
cloud services. Like Nagios, this tool is required to be installed on an infrastructure (on a
server or virtual machine), and it can be configured to monitor multiple services (Server,
Network appliances, and much more), also providing the following monitoring metrics: CPU
usage, RAM, disk usage, and Network usage.
Zabbix can monitor and verify the availability by using HTTP or SNMP checks without
having to be installed any software. On UNIX and Windows, there are available agents, that
can be installed and allow to monitor a particular host and fetch vital statistics like CPU load,
network utilization, disk space, and others.
3 https://www.zabbix.com/

Service Monitoring for a Mobile Money System
11
In Figure 3 is presented the Zabbix dashboard.
Figure 3 - Zabbix dashboard
2.3.2. Pingdom 4
Pingdom is an availability and a website monitoring tool, developed in 2005 by the
Swedish Pingdom AB company and acquired in 2017 by the American company
SolarWinds.
Pingdom contains multiple servers located around the world that are used to measure the
latency of the websites that it monitors. To monitor a website or application, the user can set
a time interval and will check the state, reporting to the user if it is down. By containing
multiple servers around the world, it can verify on various locations the accessibility to the
website, allowing to check if the problem is related to a network problem (routing, DNS,
and much more) or if the server is down. In Figure 4 it is possible to observe Pingdom
4 https://www.pingdom.com/

Service Monitoring for a Mobile Money System
12
monitoring a website, the type of request (HTTP), the current uptime percentage, and the
response time/outages graphics (spikes indicate an increase of response time).
Figure 4 - Pingdom, monitoring the availability of a website
Along with availability, monitoring Pingdom can also monitor the website/application
performance, by tracking, for example, the time it takes to fully load (images, scripts, and
much more).
Pingdom also provides a REST API, that can be implemented and allows to create health
checks to certain websites using the REST API, get a list of alarms (all, recent and much
more), get the list of servers, and monitoring details and much more.
2.3.3. Cabot 5
Cabot is a free, open-source, self-hosted infrastructure monitoring platform that provides
some of the best features of PagerDuty, Server Density, Pingdom, and Nagios without their
cost and complexity.
Monitor services (e.g. "Stage Redis server", "Production ElasticSearch cluster") and
send telephone, SMS, or email alerts to the on-duty team if those services start misbehaving
or go down - all without writing a line of code.
5 https://cabotapp.com/

Service Monitoring for a Mobile Money System
13
2.3.4. Prometheus 6
Prometheus is an open-source system monitoring and alerting toolkit, built initially by
SoundCloud in 2012. It is widely used to monitor micro-services, by collecting metrics from
each service and allowing to create rules based on the values or in a combination of values,
that will trigger alerts, an example of a Prometheus output can be found in Figure 5, this
particular example is from a Spring Boot microservice.
Figure 5 - Example of a Prometheus endpoint, of a Spring Boot microservice, displaying the Java and RabbitMQ
metrics for instance
Prometheus also provides multiple integrations with multiple third-party applications,
and one leading example is the integration with Grafana7, to provide the data visualization
of the metrics gathered by Prometheus, as shown in Figure 6.
The primary purpose of Prometheus is to collect metrics from configured targets, and
according to defined rules, display alerts if some defined condition is observed to be true.
6 https://prometheus.io/
7 https://grafana.com/

Service Monitoring for a Mobile Money System
14
Some of the key features of this monitoring system are a multi-dimensional data model,
flexible query language, and no dependency on distributed storage.
Figure 6 - Integration of Prometheus + Grafana, Dashboard (source [3] )
2.3.5. Spring Boot Actuator
Spring boot provides an actuator to monitor and manage the application. An actuator is
a tool that contains HTTP endpoints. These endpoints can be defined by the user/developer
and can be responsible, for example, for returning the state of the system, reboot or shut
down the system, between others.
An example of the Spring Boot Health Check actuator can be found in Figure 7, along
with the response about the system health.
Figure 7 - Spring Boot Health Actuator Request example

Service Monitoring for a Mobile Money System
15
This solution is most common on a microservice architecture, where a Gateway
application is responsible for getting the state of the services of that microservice
architecture.
The use of an actuator is not limited to know the health of a system, it is also possible to
implement an actuator on spring boot that returns disk usage, the health of a database, status
of a database connection, or even an actuator that can shutdown/restart the service/server.
Figure 8 represents the shutdown actuator.
Figure 8 - Spring Boot Actuator Shutdown and Not Allowed
The actuator can also be protected, to be accessed by authorized users or by users with
a specific role.
2.3.6. Conclusion and Considerations
After reviewing the multiple monitoring solutions and analysing the requirements for
the monitoring solution, it was concluded that the monitoring platform, should not only
fetch, but also analyse and trigger alerts based on the existing monitoring solution (that at
this point only collects information about the application and server logs). There is also a
real need to get the status of each external service being used to fetch critical data for the
users, allowing to know in real-time, the state of each external service and some metrics,
such as response time.
Since the monitoring of the infrastructure was not required (since the infrastructure
monitorization is currently on the client side since he provided the infrastructure) the
utilization of Nagios, Zabbix and Cabot were discarded on the later stage. It was then decided
to build a solution that fetches, periodically, the data and information of the connected
external services, like Pingdom. It will also gather and display the data collected by other
existing monitoring tools (more precisely the Monitoring Server also developed by WIT).
It was opted to build a similar approach to the Spring Boot Actuator that consisted on
implementing a REST endpoint that gathered information about the state of all the services
on the system, and every x seconds or minutes if the service was not updated, an internal
request was triggered to verify if the service was up or if the response timeout or returned an
error. This information was then stored locally, and the endpoint returned a JSON response,

Service Monitoring for a Mobile Money System
16
which displays all the gathered services and their status OK or NOK (Not OK). If the service
answered the request successfully, the response time was calculated and sent as a field on
the health endpoint response.

Service Monitoring for a Mobile Money System
17
Methodology and Planning
Along the following sections, it is described the used methodology along with the
internship (section 3.1), and also the development stages of the service monitoring solution
(section 3.2).
3.1. Methodology
In this section is described the methodology used along with the internship, which
helped to develop a service monitoring solution for a Mobile Money System. The chosen
methodology for the development process of the internship was based on Agile, which
allowed to evolve the platform incrementally from the start of the internship until the end.
Agile is a project management methodology characterized by building products using
short cycles of work that allows for rapid production and constant revision when necessary.
A group of seventeen people developed the core of the Agile methodology in 2001 in a
written form. The written file was called the Agile Manifest of Software Development, and
it enables a ground-breaking mindset on delivering value and collaborating with customers
[4].
Agile four main values are expressed as:
• Individuals and interactions over processes and tools;
• Working software over comprehensive documentation;
• Customer collaboration over contract negotiation;
• Responding to change over following a plan.
In WIT it is strongly recommended to use Scrum, and multiple teams employ Scrum as
their methodology. Scrum is one of the implementations of the agile methodology in which
incremental builds are delivered to the customer at the end of each development period, more
known as Sprints.
Since the internship was focused on building a proof-of-concept monitoring platform,
the use of Scrum like approach would help the development process. Still, since only one
developer would compose the team, there was no need to use all the features of a strict
Scrum, and it was decided that it would be used a Scrum Based approach, where some
elements of the Scrum would be adapted to optimize the development process.

Service Monitoring for a Mobile Money System
18
For instance, on Scrum, the development required that the incremental builds are
delivered to the customers every two to three weeks, in this specific case the Sprints were
adapted into development cycles, that were composed by four weeks each. In-between
cycles, it was realized quick presentations displaying the implemented features and the
overall platform. In each presentation was discussed the current developed work, required
improvements, and a discussion about the work for the following development cycle.
To replace the daily stand up meetings that occur on the Scrum, it was sent a list with
the implemented features, and fixed bugs.
Since WIT required that all the interns perform presentations along with the internship
to display the developments, there were three different presentations along with the
internship, and these presentations acted as a sprint retrospective and sprint review. These
presentations would serve to inform other WIT employees and interns about the developed
work. In the end, some appointments and feedback were received to improve the solution
being developed by each intern.
Like it was mentioned above, the development was divided into three stages, the initial
stage was responsible for the research and evaluation of existing monitoring tools (that
already exist on the project and external tools), it was also conducted a technical
specification and prototyping of the solution.
The second stage was mainly occupied by the development stage. The software was built
incrementally and according to the feedback received from the meetings that occur in
between the development cycles. The requirements on the backlog were readjusted to assure
that the new changes in requirements were concluded with success.
In Figure 9, it is represented the burnup chart. The figure was extracted from the tool
used to keep track of the progress of the development, Redmine.
The Burnup Chart provides a visual representation of a sprint completed work compared
with the total scope [5], the vertical axis represents the amount of work, and in Figure 9 it is
represented by the number of issues, and the horizontal axis represents the time in days.
The remaining work can be identified by the distance between the Created and Closed
lines, and when the project has been completed, the two lines should meet. In this specific
case, on the beginning of the project it was created multiple issues, and some of the initially

Service Monitoring for a Mobile Money System
19
created issues were not implemented, since they do not belong to the main scope of the
internship, and could be taken in consideration to a future iteration of the project.
By looking at the chart, it is also possible to identify that, along with the project
development, were added new issues. The added issues were new changes on the scope, new
features, and bugs that required fixes.
Figure 9 - Issues Burnup Chart
3.2. Planning
The internship with a duration of nine months, took place from 8 of October of 2018 and
with the conclusion on 8 July of 2019, and in Figure 10 it is presented the chronogram with
the carried-out tasks during the thirty six weeks of the internship.
The chronogram available in Figure 10, allows identifying the three main stages of the
internship, the research stage, the development stage, and the final stage.
In the initial stage, it was made the initial identification of the monitoring requirements
on the Mobile Money System. It was also studied the code and architecture (the code of the
Backend, existing tools, logs, between others) of the current Mobile Money System and were
fetched the sources of information on the system that could be analysed to provided
information about the system health.

Service Monitoring for a Mobile Money System
20
During this stage, it was also researched some monitoring tools and each of their positive
and negative features. At the end of this stage, it was also specified and defined the initial
requirements and user stories and based on those user stories it was built a prototype and
UI/UX documents (User Interface/User Experience) that would allow the designers to create
an interface.
The next stage was the development stage, and this took most of the time of the
internship. It was analysed the technologies already used by the development team of the
Mobile Money System and based on the tools already used it was selected the tools
(databases, frameworks, languages, between others) that would be used along the internship
to implement the monitoring solution. Through this stage, it was required to update and
realign the requirements and user stories, that lead to incremental updates on the solution.
The development stage, like it was mentioned before, was the stage that took the most time
of the internship, taking almost six months from start to finish.
The final stage it was when the arrival of the final UI/UX took place, and it was needed
to update and realign the monitoring solution, it was also made some usability tests, and it
was performed some bug fixes. This final stage took around two months from start to
completion.

Service Monitoring for a Mobile Money System
21
Figure 10 - Gantt Diagram with the developed tasks and activities

Service Monitoring for a Mobile Money System
22
Architecture
This chapter, describes and explains not only the architecture of the developed solution
but also the general architecture of the mobile payments service used as a reference.
In section 4.1, some insight into the system architecture of the Mobile Money System
used as a reference is described. Along this section, is explained the overall architecture,
services consumed, and existing monitoring solutions. In section 4.2, it will be presented the
proposed architecture for the monitoring solution, along with a detailed description of the
document structured and entities diagram.
4.1. Mobile Money System Architecture
The Mobile Money System architecture can be observed in Figure 11. This figure
presents a brief representation of the system architecture and its components.
Figure 11 - System Architecture
It is presented in Figure 12, the diagram that represents the flow when a user makes a
request from the application and receives the results. The example portraits the
communication flow between the application and the server when a user makes a simple
request for getting his account balance and is represented in the figure all the necessary steps

Service Monitoring for a Mobile Money System
23
to the system communicate with several services, internal and external to show the user his
account balance.
Figure 12 - M-Pesa User Requests Flow
The internal services are available through the WIT Backend. That is responsible for
fetching the application structure (existing functionalities, application screens, user contacts
list), and work like a bridge between the application and the external services.
The external services are the services that were not developed by WIT but are used in
the project to send the notifications (Firebase Cloud Messaging), for doing money-related
operations (Payments Processor API) and for other operations related with the project
business logic.
The internal services were developed by WIT, and these services contain endpoints that
will be used by the M-Pesa application to communicate with the external services. Most of
the external services contain their endpoints closed and can only be called through internal
services.
Another way to monitor the system is to use the Monitor Server, which is already
developed and deals with information generated by the applications and servers (report_logs
and gw_report_logs). When a user uses the application and makes a request, for example,
get_user_balance, the application records the initial timestamp and will record the final
timestamp. When the request with the user balance returns, the application sends the logs
into the WIT Backend to be stored into a database and generates materialize views within a
configured time interval, which are analysed by the Monitoring Server. On the Monitoring

Service Monitoring for a Mobile Money System
24
Server, the values will be compared with reference threshold values, and if any of the
threshold values are surpassed, alarms will be generated.
WIT Backoffice
The M-Pesa Backoffice is a tool that allows managing the whole Mobile Money System,
from adding new configurations for the mobile applications (screens positioning,
translations), getting logs (from applications and the Backend), enabling/disabling the whole
system, and so on.
Besides allowing to configure the mobile applications completely, it also allows adding
global properties that can be accessed by the WIT Backend.
WIT Backend
WIT Backend is a set of Java EE applications, that is responsible for handle monetary
and non-monetary operations, is responsible for the database connections, connection to non-
monetary services like user bundles, dispatching notifications, storing logs from the
applications, providing REST API for the mobile applications.
The monetary operations are performed using an external service, the Payments
Processor API.
External Services
The external services are the services consumed by WIT Backend. These external
services are not developed by the WIT development team and are implemented to help the
flow of the application; for example, Google FCM will allow pushing notifications into the
application.
One of the essential services being consumed is the Payment Processor API. This service
is responsible for the monetary transactions, holding user accounts information, between
others.
Other services that are not monetary provide information of the users, like custom users
bundle (example: Buy Mobile Data), information about other users, conversion rates,
between others.

Service Monitoring for a Mobile Money System
25
4.2. Monitoring Solution Architecture
The architecture of the monitoring solution will be divided into two different sections,
the Backend, and the Frontend. The Backend is divided into three distinct layers, the Data
Access Layer, the Service Layer, and the Presentation Layer. The Frontend solution will also
contain a representational layer (templates and components), the service layer (services
consuming the REST API and dependency injection into the components) and the model
layer (including the models, and enumerations).
The original architecture consisted of using a monitoring tool already developed by WIT
to monitor hourly data, provided by the applications and analysed by the monitoring server.
This will leave a gap in the system since the data is only monitored hourly. It was required
to have a system that was able to monitor the state of external services, and the first solution
was to use external availability monitoring solutions (for example, Pingdom or Uptrends) to
monitor these external services. So on the initial system architecture, the monitoring solution
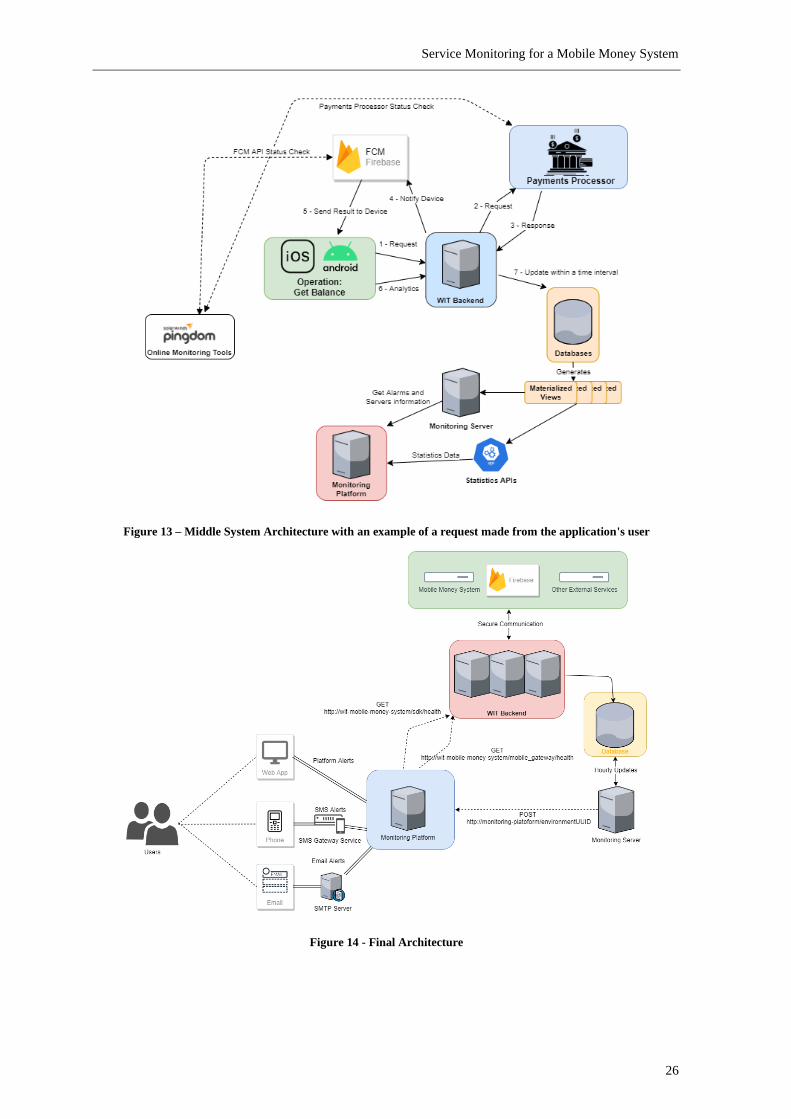
(that can be observed with the name “Monitoring Platform” in Figure 13) will be able to
receive the alarms and information from the monitoring server that indicate the system health
state from the application point-of-view, and the integration with external monitoring tools,
that will check the health of the external services within a certain amount of minutes.
However in this solution, after some discussion with the development team, it was
discovered a major point of failure, since most of the external services used by the MMS
solutions are deployed over a secure network and can only be accessible inside the network
and are not exposed to the Internet, it was required to improve the architecture, to monitor
the external services within the WIT Backend and not by external availability monitoring
solutions like Pingdom or Runscape.
The solution to this problem was to create a kind of service that will consume the
information provided by the WIT Backend, as the external monitoring services would do.
Figure 14 contains the final system architecture. The differences from this architecture
with the architecture presented in Figure 13 are that the external services that the MMS
connects and communicates to obtain information, is under a secure network, that is only
accessible within the WIT Backend). Furthermore, to achieve the API Monitoring Service,
it was required to modify the WIT Server to monitor the availability of the connected
external services.
Service Monitoring for a Mobile Money System
26
Figure 13 – Middle System Architecture with an example of a request made from the application's user
Figure 14 - Final Architecture

Service Monitoring for a Mobile Money System
27
4.2.1. Backend Architecture
The Backend architecture will be responsible for fetching the data from the all from the
Mobile Money System, analyse the data and make it available for a final user to understand
the state of the system.
The selected framework for developing the solution was Spring Boot since it makes it
easy to create stand-alone Spring-based applications to run. To build the code is also required
to use a build tool, the build tool of choice was Maven, and with Maven comes a
configuration file named pom.xml responsible for the configuration aspects of the project
(Figure 15).
<?xml version="1.0" encoding="UTF-8"?>
<project xmlns="http://maven.apache.org/POM/4.0.0" xmlns:xsi="http://www.w3.or
g/2001/XMLSchema-instance"
xsi:schemaLocation="http://maven.apache.org/POM/4.0.0 https://maven.apache
.org/xsd/maven-4.0.0.xsd">
<modelVersion>4.0.0</modelVersion>
<groupId>com.example</groupId>
<artifactId>myproject</artifactId>
<version>0.0.1-SNAPSHOT</version>
<!-- Inherit defaults from Spring Boot -->
<parent>
<groupId>org.springframework.boot</groupId>
<artifactId>spring-boot-starter-parent</artifactId>
<version>2.2.6.RELEASE</version>
</parent>
<!-- Add typical dependencies for a web application -->
<dependencies>
<dependency>
<groupId>org.springframework.boot</groupId>
<artifactId>spring-boot-starter-web</artifactId>
</dependency>
</dependencies>
<!-- Package as an executable jar -->
<build>
<plugins>
<plugin>
<groupId>org.springframework.boot</groupId>
<artifactId>spring-boot-maven-plugin</artifactId>
</plugin>
</plugins>
</build>
</project>
Figure 15 – pom.xml example
Along the pom.xml file can be added dependencies that enable features like Spring
Security (for handling security aspects for example), Spring Websocket (for the WebSockets
implementation), Spring Data JPA (for managing database repositories) and other

Service Monitoring for a Mobile Money System
28
dependencies that already provide an abstract implementation that can be implemented or
by merely configuring properties on the application.properties file.
Figure 16 presents the Backend Architecture Diagram, representing the three layers
described above.
Figure 16 - Backend Architecture Diagram
The actual Backend architecture is split into three layers:
• Presentation Layer – Contains all the controllers and provides information to the
Frontend (in this case by REST APIs and JSON), this layer will also contain the
resources and the security of the application:
o Resources Layer – Rest Controllers and declaration of the endpoints;
o Security Layer – User authentication and authorization to access
protected resources;
• Logic Layer – Contains the Business Logic;
• Data Layer – Communicates with physical databases, handling the persistence.
For databases communication, it will be used the JPA (Java Persistence API) and
Hibernate ORM (Object Relational Mapper):
o Domain Layer – Mapping Layer, responsible for transforming the
domain classes to the final objects that are sent to the client's applications;
o Repositories Layer – Repositories responsible for CRUD (Create, Read,
Update, Delete) operations to interact with the database.

Service Monitoring for a Mobile Money System
29
The controllers will use the HTTP protocol for communicating with the Client and will
be used alongside with REST (Representational State Transfer) API endpoints. These
endpoints will be used to authenticate and manage users, send data that will be treated and
displayed into the Frontend. The REST API and WebSocket channels will use JSON
(JavaScript Object Notation) for transporting data.
4.2.1.1. Services
The services will be responsible for handling the business logic, each service is
responsible for a specific task, and there are eight different services. Each service will have
its purpose; for example, the notification service is reliable to handle the way a notification
is sent. It is responsible for connecting to the multiple external services (SMS Gateway,
Email Gateway, WebSockets).
• Operations Services – Responsible for handling operations data, communicates
with MongoDB and Oracle repositories to put data into the databases, perform
aggregation operations to display information along the time for a particular
operation.
• External Parties Service (External Services) – Responsible for handling external
services data, communication with databases, aggregation of information, add
new data, analysing data, processing data, and triggering alarms.
• User Service – Responsible for handling the business logic related to the user.
• Management Service – Handling the logic related to the management side,
handle user accounts (adding users to locations, remove permissions), handle
locations. Communicating with the database layer and other services like user
service, location service, operations, and services service.
• Location Service – Handling Environments and Locations, allowing to create
new locations and environments, managing connections to each physical
environment (endpoints for each environment).
• Scheduler Service – Responsible for scheduling HTTP requests to the external
services in multiple locations and environments to check the health of the
external services. Configurable by Location and Environment would allow
within a specific interval of time to perform requests to a given endpoint and
collecting the data and redirecting to another service (more specifically Services
Service). Internally uses a combination of HashMap’s and asynchronous threads

Service Monitoring for a Mobile Money System
30
(Scheduler Executer) to control each Service Scheduler (stop, start, apply new
configurations, reset all, among others).
• Alarm Service – Responsible for handling the business logic of the alarms,
connected to the notifications service to perform in real-time notifications, also
will have database tier connection for fetching and updating entries.
• Notification Service – Responsible for propagating notifications, sending SMS,
emails, and handling WebSockets information for the proper channels. This
service is responsible for connecting with the multiple external communications
gateways used. For example, it handles connecting with the Emails and SMS
providers and integrates SDK (Software Development Kits) used to
communicate with those third parties.
Since each service is responsible for a specific task, it was also used the Spring Boot
dependency ejection feature. One example of this feature is once again the Notifications
Service, and more specifically, we can inject the notifications service on the alarms service
to send multiple alarms, but we also want to send a verification email whenever a new user
is created, so this service is also injected in the User Service.
4.2.1.2. Security
For handling the Backend security, it was used the already existing features of the Spring
Boot framework, the dependency itself is called Spring Security, and it is only required to
add the dependency to the project parent pom.xml file and implement the implementation
features.
To authenticate and identify the user and the role of the user was also used the JWT
(JSON Web Token). JWT is an open standard that defines a compact and self-contained way
for securely transacting information between parties [6]. The JWT will be used to authorize
a user since each request will contain the JWT in the header, and also allows changing
information between the Frontend and the Backend. Since the token will provide user
information in the body, like roles, username, and token expiration date.
Three parts represent the structure for the JWT:
• Header: The header will specify the type of the token (in this case jwt) and the
signing algorithm used (SHA254 or RSA).

Service Monitoring for a Mobile Money System
31
• Payload: It can contain the claims. Claims provide information about an entity
and additional data. There exist three types of claims, registered, public and
private claims.
o Registered claims are optional, but are recommended to use, due to
providing useful information. A few registered claims: iss (issuer), exp
(expiration time), sub (subject).
o Public claims can be defined and consulted at will when using JWTs, but
in order to avoid collisions, they should set in the IANA JSON Web
Token Registry or set as a URI that contains a collision resistant
namespace.
o Private claims are custom and can be created to share information
between two parties.
• Signature: This part of the JWT is used to verify if the message was not changed
during the communication between the two parties.
Each token should be generated by the backend whenever a user authenticates in the
platform, and from this step, all the communications will send the token in the Authorization
field using the Bearer Schema:
Authorization : Beader <Token>
On the Backend, the combination of Spring Security and a filter, it will have as the main
purpose to verify the requests headers to verify the user. Still, some exceptions can be applied
to allow some requests that do not require authentication.
4.2.1.3. WebSockets
Websockets is a bi-directional, full-duplex, and persistent connection between a web
browser and a server. Once the connection is established, it stays open until the client or the
server decides to close the connection, allowing having multiple users to communicate with
each other.
To achieve real-time notifications was used WebSockets. The implementation only
required to import into the pom.xml the Spring Messaging and Spring WebSocket
dependencies that enable the use of WebSockets in the project.
The WebSocket protocol is low-level, and it defines how a stream of bytes transforms
into frames. Each frame can contain a text or binary message. Since the message does not

Service Monitoring for a Mobile Money System
32
provide information on how to route it is challenging to implement complex applications
without writing additional code. But WebSocket specification allows to use sub-protocols
that operate on a higher application level, and STOMP is one of them [7] [8].
STOMP allows for clients that may be written in different programming languages to
send and receive messages, to and from each other.
To enable the WebSockets is required to create a message broker where a destination
prefix is defined, for example “/topic”. This prefix will be subscribed by the client and will
allow carrying messages to all the clients using the pub-sub model. For setting up private
messages, was configured another prefix, “/private”.
The use of JWTs was implemented to prevent unauthenticated and unauthorized users
from subscribing to protected channels. To achieve this feature, was required to send the
JWT in a header when a user was subscribing to a channel, and if the token were invalid, the
connection would be right away closed.
4.2.1.4. Data persistence
For the persistence of data, it was chosen two databases, a relational database, OracleDB,
and a non-relational database, MongoDB.
During the beginning of the project, it was only taken into consideration the use of a
relational database. During the initial project analysis, it was designed and created the
platform relationships and entities. On that early stage, there was no need of using a non-
relational database, on Figure 18 it is the diagram of entities for the SQL database and the
relations between them.
After all the entities and relationships were implemented, it was made a retrospective
and functionalities assessment that lead to considering the use of a non-relational database,
due to new types of data that would be stored. Still, the collected data were from thirds
parties and did not have a yet defined structure (for example, JSON Objects), so it was
selected to use a non-relational database, that would allow storing data with different fields
after the original structure was defined. The type of data that would also be stored into the
non-relational databases was all metrics collected, and one of the significant strengths of the
selected non-relational database was Big Data analytics, this would not be used on the course
of the internship but would be a nice feature for future developments.

Service Monitoring for a Mobile Money System
33
return mongoTemplate.aggregate(Aggregation.newAggregation(
match(where("servicesItem").is(serviceItemId).andOpe
rator(where("createdAt").gte(start).andOperator(where("createdAt").l
te(end)))),
project()
.and("failRate").as("fr")
.and("responseTime").as("rt")
.and("isDown").as("dw"),
project("hour","day","year","minute","month","fr","r
t","dw")
.andExpression("minute - minute % " + timeIn
terval + "").as("interval"),
group("year","month","day","hour","interval")
.avg("fr").as("avgFailureRate")
.max("fr").as("maxFailureRate")
.min("fr").as("minFailureRate")
.avg("rt").as("avgResponseTime")
.max("rt").as("maxResponseTime")
.min("rt").as("minResponseTime")
.count().as("total"),
sort(Sort.Direction.ASC,"year","month","day","interv
al").and(Sort.Direction.ASC,"hour")
), ServicesItemHealthChecks.class, ServiceSummary.class).get
MappedResults();
Figure 17 - Aggregation Example
For fetching data from the database that would allow analysing metrics on charts and
graphics quickly, was used data aggregation. The aggregation process consisted of grouping
data between two dates within a specified time interval; this allowed to group statistical data,
allowing for quicker processing time and extracting multiple metrics from the database.
Figure 17 shows an example of an aggregation operation, that will fetch within a date interval
and time interval average, maximum, and minimum metrics from a particular Object.
This process helps to reduce the time required by the frontend to process and analyse the
massive amounts of data into the charts since the data would not come organised and would
not be necessary to sort and do calculations to fetch metrics like average, minimum, max
and count.

Service Monitoring for a Mobile Money System
34
Figure 18 – Entitiy Relationship Diagram
4.2.1. Frontend Architecture
For the Frontend architecture, was used a SPA (Single Page Application) Architecture.
As the name says, SPA or Single Page Application only loads a single HTML page and
dynamically updates that page while the user interacts with it. One of the advantages of this
approach is the client-side routing and data rendering on the client-side, less bandwidth is
used, no full-page refreshes occur while the user is navigating, easier to deploy (minimum
of three files, index.html, CSS bundle, and JavaScript bundle).

Service Monitoring for a Mobile Money System
35
The framework used for the Frontend was Angular 8, and for communicating with
external parties (Backend REST API, handlinglLocalStorage, etc.), was used Services.
Service is typically a class with a narrow, well-defined purpose.
For the logic and representation of the frontend, it recurred to the angular modules.
Inside each module, it was used components for handling the business logic and templates
for representing the information and implementing the UI. Due to the Angular framework
being Dependency Injection friendly, each service can be injectable into the components has
a dependency, allowing the components to the access services functions and objects, Figure
19 represents the frontend implementation that was taken in consideration during the
implementation of the Frontend.
Figure 19 - Angular Component-Based approach
For fetching information from the Backend application, it was used services. The
services are responsible for making the HTTP request to the endpoint and parse the JSON
response.
The implementation of feature Lazy Loading across the Frontend architecture allows to
dynamically load modules along with the user usage, instead of loading all the modules on
the start-up of the application, and it was delayed the loading of a module until it was needed.

Service Monitoring for a Mobile Money System
36
To prevent unauthorized users, the Backend implements an authentication mechanism.
This mechanism consists of JWTokens to authenticate and authorize the users. To ensure
that this token is sent to the Backend were used Angular HTTPInterceptors, which allows
injecting the JWT into the header. The HTTPInterceptors were also used in order to listen to
error codes sent by the Backend and to display this information to the user.
To manage the storage of the Frontend was created a shared service across all the
components, that is responsible for adding and retrieving data from the browser localStorage.
It was used the Angular Material component library for designing the interface of the
application. Angular Material is an implementation of Material Design and principles for
angular, which provided multiple User Interface (UI) components that can be used out of the
box.

Service Monitoring for a Mobile Money System
37
Implementation and Development Process
Throughout this chapter is explained the implementation process, along with a brief
introduction to the used technologies, the defined requirements for the solution, the existing
functionalities, and the implementation process.
In the first section is presented the Requirement Analysis identified by the section 5.1,
and in this section is presented the problems identified, and a list of requirements and user
stories that helped to fix some of those identified problems.
After the Requirement Analysis, section 5.2 presents a brief description of each of the
technologies used along with the internship.
In section 5.3 is presented the prototypes stage.
In section 5.4, are described the existing functionalities. This section contains the core
of the platform (data persistence, authentication, security, REST API, and notifications) and
a brief description of the implemented functionalities.
In section 5.5 is presented the changes required to be made on the existing systems in
order to communicate with the mobile application.
Throughout section 5.6 are discussed, the interface changes applied.
Finishing the chapter, it is presented the section 5.7. This section addresses some aspects
of integration.
5.1. Requirement Analysis
After the beginning of the internship, it was explained that there was a real need in a
monitoring tool that would gather information about the Mobile Money System and their
third-parties. This monitoring tool would allow to monitor the state of the multiple services
of an environment and collects data from the mobile applications.
This information would be accessed from a single platform and would allow comparing
multiple metrics along certain periods of time, in order to know what might be the factors
that cause downtime or what measures could be applied to mitigate those downtimes.

Service Monitoring for a Mobile Money System
38
According to the information gathered at the beginning of the internship by the mobile
application, and Backend developers of WIT, it was selected a couple of requirements for
the monitoring tool:
• It is required a platform that allows monitoring the state of the system – to monitor
the multiple third-parties used by the Backend and to know the state on the current
time;
• Able to trigger alerts if the received values are above reference values (in platform
alerts, email alerts, SMS alerts);
• Administration and User Roles – simple role-based access to the platform, with three
differentiated roles, with different permissions:
o Administrator – allowed to manage all the platform, manage users and
locations;
o Management – would be responsible for managing one or multiple locations;
o Normal – normal user, will only be able to analyse data and metrics from
assigned locations;
• Multi Locations/ Multitenancy – WIT provides this Mobile Money System for
multiple countries, so it was nice to have the option to have the possibility to add
each country as a location, and each country will have multiple environments, like
development environment, production, disaster recovery, UAT (User Acceptance
Testing) environment, and much more;
• Converge existing data into a single platform – fetch information from the existing
tool into this platform;
• Quickly check the system status/system health status – display information on a
dashboard that would inform the user about the main crucial information about the
system;
• Display information about metrics during a certain amount of days (Last 24 Hours,
Last 7 days, Last Week, Last Month).
Initial Requirements were defined based on three aspects:
• Initial Problem Understanding;
• Development Team Difficulties;
• Product Owners.

Service Monitoring for a Mobile Money System
39
Along the development process, it was reached with the product owner that the
developed solution was lacking some essential features, for this reason, it was made updates
the list of initial requirements and features, adding new important and replacing other less
relevant features from the existing list. Because of this new set of features, it was required
to change the initial requirements and update them. Some of the user stories initially planned
were ruled out, and new user stories were inserted, matching the newer requirements.
In Table 1 is presented the Must, Should and Nice to have features. The features shown
in Green were the ones that were successfully implemented, and in red, the features not
implemented.
The only feature not implemented, was the “Export Data into CSV”, mainly due to the
end of the development being focused on refactoring the visual of the platform with the UI
specification provided by the UI designers, that took place on scheduled time to the export
data feature.
Table 1 - Must, Should and Nice To Have
Must-Have Should Have Nice to Have
Platform Notifications Email Notifications SMS Notifications
Multitenancy User Service and Operations
Settings
Export Data into CSV
Fetch Service Data
automatically and check if
any alarms should be
triggered
Custom Search alarms (On a
data interval, Alarm
Severity)
Receive Operations Data
and trigger alarms in real-
time
Show Service Items and
Operations Requests Details
with a custom time interval
Trigger and Store alarms
As an admin I want to set
services and operation
settings
Services Items Details on
the last 24 hours

Service Monitoring for a Mobile Money System
40
Operations Requests Details
on the last 24 hours
The specific user stories that were gathered on the initial analysis of the problem and
that were used to produce the requirements analysis can be found more detailed on the
Appendice A, along with an explanation of the available roles.
5.2. Technologies
This section describes all the technologies used during development.
The technologies are divided into three different groups. Each group represents different
parts; for example, the Frontend represents all the tools used for the development of the UI
(User Interface), from the prototyping until the final implementation. The Backend group
contains the technologies used for creating the programming languages used to build the
REST API, databases, services.
The deployment group includes the technologies used to deploy into the internet the
developed work, the database hosts and the build tools. In Table 2 is referenced all the tools
and technologies used along with the internship, the table is divided into three columns; each
column specifies the different technologies used for the development of the multiples stages.
Table 2 - List of technologies and platforms used along with the development
Frontend Backend Deployment
Angular 7 Java EE Amazon AWS
Typescript Spring Boot ScaleGrid
Material Design MongoDB Amazon AWS RDS
Marvel App Oracle Jenkins
CentOS 7
Docker
5.2.1. Angular
Angular is a framework that allows developing dynamic web pages, is a TypeScript
based open-source framework developed by the community and Google [9].

Service Monitoring for a Mobile Money System
41
The Angular latest version is Angular 8 since Angular 2 it was started to be used
Microsoft TypeScript (a superset of ECMAScript 6). It supports modularity, syntax binding,
and uses a hierarchy of components as its primary architectural characteristics [9].
The Angular framework brings multiple advantages to web development allowing to
create webpages quickly, using features like a component-based system that delivers a
modular approach to the project, and allows reducing code usage and leads to a more
straightforward way to manage a project.
5.2.2. Java and Spring Boot
Java is a POO (Programming Oriented Language) developed in the 1990s by a team of
developers of the company Sun Microsystems and in 2008 Java was acquired by Oracle [10].
Over the years, Java has been updated, and the latest stable long-term support version is 11
[11]. However, along with the development of the monitoring solution, the Java 8 version
was used.
Spring Boot is an open-source micro-framework that was developed by Pivotal Team
and is used to build stand-alone and production-ready spring applications. Spring Boot is
built on top of the Spring framework and provides a simpler and faster way to set up,
configure, and run developed applications. Spring Boot, unlike Spring Framework, does
smart management of dependencies and avoid the necessity of setting all the configuration
files.
5.2.3. Oracle Database
Oracle Database is a proprietary multi-model database management system from the
Oracle Corporation [12]. Along with the internship it was used relational and non-relational
databases, and the used relational database was the Oracle database version 11c. The
motivation that leads to the choice of this specific proprietary technology instead of an open-
source (PostgresSQL, MariaDB, and many others) was because the team already used oracle
databases in the projects, so the know-how was already available and was able to support
along with the internship.
To manipulate the Oracle Database using Spring Boot, was used an ORM (Object
Relational Mapping), more precisely the Hibernate ORM.

Service Monitoring for a Mobile Money System
42
Hibernate helps an application to achieve persistence, by allowing to map objects from
Java classes into relational database RDBMS (Relational Database Management System).
The mapping from the classes into the database tables is made using annotations or via XML
archives [13].
Hibernate is also an implementation of the JPA (Java Persistence API) specification, as
such, it can be easily used in an environment supporting JPA, including Spring boot, Java
EE, between others.
5.2.4. MongoDB
MongoDB is an open-source and multiplatform non-relational database developed by
Mongo Inc. MongoDB allows storing data in a flexible JSON like documents, meaning that
documents can vary from document to document and data structure can be changed over
time without compromising the integrity of the data [14].
5.2.5. GIT
Git is a free and open-source distributed version control system for tracking changes in
source code during software development [15].
One of the advantages of using Git software is that it allows keeping backups locally
and remotely of the developed work, multiple ramifications and can be created locally or
remotely (known as branches), and these ramifications can be created, updated, merged or
deleted in a matter of seconds and allowing the developed work to be conflict-free.
5.2.6. Other Tools/Frameworks
Marvel App is an application that helps to design and create prototypes for mobile and
web applications [16].
Material Design 2 is a design language developed by Google in 2014. Material Design
was initially encountered on the expanding cards that debuted on Google Now. Material
Design can be found on multiple Google applications, including Gmail, Youtube, Google
Maps, and much more [17]. Material Design was initially used on Android devices, but it
was gradually extended throughout Google array of web and mobile products, providing a
consistent experience across all platforms and applications.

Service Monitoring for a Mobile Money System
43
Jenkins 8 is an open-source Continuous Integration server, written in Java, that is capable
of orchestrating a chain of actions that help to achieve the Continuous Integration process in
an automated fashion. Jenkins by default comes with a limited set of functionalities, that can
be extended by installing new plugins (that can be searched within the Jenkins Settings).
One example of the plugin that can be installed is the integration with the Maven tools9.
Amazon Web Services or AWS provides multiple cloud computing services on a
metered pay-as-you-go basis [18]. During the development and implementation process, the
company made available a virtual machine to deploy the platform and to test in a real
environment. Some of the used services:
• Amazon Elastic Computing Cloud (Amazon EC2) - provides a resizable compute
cloud capacity on the AWS Cloud [19];
• Amazon Relational Database Service (Amazon RDS) - provides a Database as a
Service [20].
Scale Grid is a Database hosting service, DbaaS (Database as a Service), it allows
hosting multiple types of databases like MongoDB [21].
Redmine is a free and open-source project management software that provides a flexible
project management web application.
Docker is an open-source software platform that allows creating, deploying, and
managing virtualized application containers on a common operating system. Docker is a
Linux container management toolkit, that enables users to publish container images and
consume images uploaded by others.
5.3. Prototypes
After establishing the initial requirements and user stories, the design of the prototypes
started, along with the implementation of the prototypes, on the prototyping platform,
MarvelApp (see Figure 20). It was also developed a UI document that has the goal to
associate each requirement/user story to a screen, and the primary purpose of this document
would be to allow the UI Designer to build a final interface.
8 https://jenkins.io/ 9 https://plugins.jenkins.io/maven-plugin/

Service Monitoring for a Mobile Money System
44
To generate/elaborate the prototypes it was used the Marvel App tool, besides, the tool
allowing the user to create prototypes, it also allows to test the User Interaction and User
Experience, by connecting the screen prototypes to each other and simulating the interaction
on the platform.
Figure 20 - Marvel App Monitoring Platform Prototype Screens
In Figure 21 is possible to observe a prototype of the initial dashboard. In this prototype,
it was taken into consideration the user to have multiple locations (top right corner) where
the user would be able to select the current location. It was also important to display a list of
the latest Alarms and Anomalies on the server, that would be clickable and would redirect
to the details page. And it was also presented elements that would allow getting the health
of the system.

Service Monitoring for a Mobile Money System
45
Figure 21 - Example of a Mockup Screen, Dashboard Screen
In Figure 22 is presented the mockup for the services monitoring feature. The mockup
would take into consideration the need for monitoring external APIs that later on was
refractor to the Services functionality. And on this mockup, the primary goals consisted of
allowing the user to check the health of the service and provide essential details like endpoint
name and API, average metrics (response time, fail rate, and update), and also some buttons
that would lead to the details page.
Figure 22 - Services Monitoring Mockup
Figure 23 presents the mockup for the notification system. In this mockup, the main
objective was to display a triggered alarm or malfunction on the system, using a pop-over
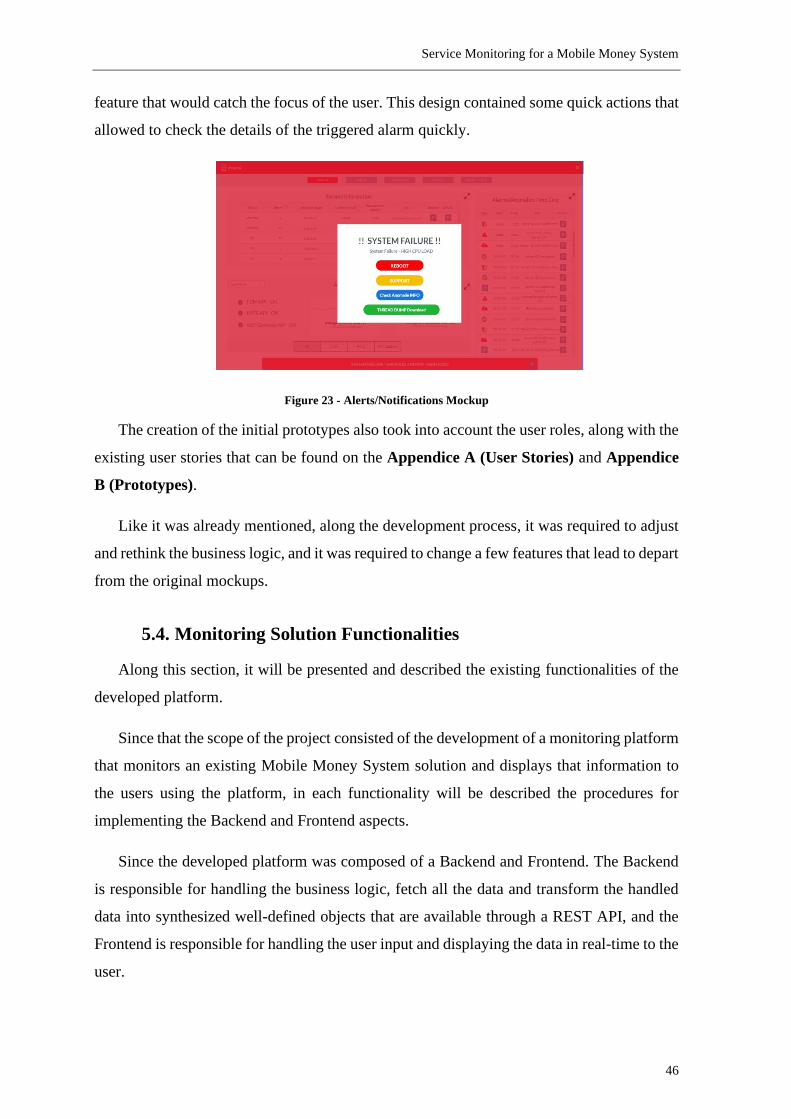
Service Monitoring for a Mobile Money System
46
feature that would catch the focus of the user. This design contained some quick actions that
allowed to check the details of the triggered alarm quickly.
Figure 23 - Alerts/Notifications Mockup
The creation of the initial prototypes also took into account the user roles, along with the
existing user stories that can be found on the Appendice A (User Stories) and Appendice
B (Prototypes).
Like it was already mentioned, along the development process, it was required to adjust
and rethink the business logic, and it was required to change a few features that lead to depart
from the original mockups.
5.4. Monitoring Solution Functionalities
Along this section, it will be presented and described the existing functionalities of the
developed platform.
Since that the scope of the project consisted of the development of a monitoring platform
that monitors an existing Mobile Money System solution and displays that information to
the users using the platform, in each functionality will be described the procedures for
implementing the Backend and Frontend aspects.
Since the developed platform was composed of a Backend and Frontend. The Backend
is responsible for handling the business logic, fetch all the data and transform the handled
data into synthesized well-defined objects that are available through a REST API, and the
Frontend is responsible for handling the user input and displaying the data in real-time to the
user.

Service Monitoring for a Mobile Money System
47
The following sections will present the functionalities of the MMS, and the text will
explain both Backend and Frontend for each feature.
5.4.1. Authentication & Security
To authenticate a user, it was needed to login with valid credentials (a combination of
email and password), and after the user credentials were validated a JWT (JSON Web
Token) was returned, allowing to continue to operate on the platform.
The Authentication and Security implementation of the Backend involves the
construction and exposure of the authentication APIs. To authenticate the user, is required
to send the user data via REST Post to the login endpoint.
POST http://monitoringPlatformEndpoint/auth/login
The structure of the endpoints is constituted by the controller, in this case, /auth/ will
correspond to the Authentication Controller, and /login will correspond to the method inside
of the controller.
The request object of this endpoint will be expecting an object, in this case, the user data,
the object will have the name LoginUserDto, where DTO (Data Transfer Object) is a type
of object responsible for transfer data from remote interfaces, allowing to separate the
models that represent the domain of the application and the models that represent the data
received and handled by the API. An example of the expected object by this API is presented
in Figure 24. This DTO Object will also allow validating the received data, in this specific
case the user name and password are required and will be validated by the Spring Boot
annotation @NotNull, this annotation will validate if the fields received are not null, and in
case they are empty it will be sent an error to the user.
This approach is not only used on this specific controller and endpoint, being widely
used along with the platform APIs.

Service Monitoring for a Mobile Money System
48
Figure 24 - User Login DTO
On the authentication side of this API, after the data received is validated, the data will
then be processed and verified if the user is valid and will be allowed to access to the
platform. On this step, it was used one of Spring Boot dependencies, more precisely, Spring
Security, when this dependency is added to the pom.xml file the Spring Boot application
automatically requires authentication for all HTTP endpoints. This implementation can be
customizable by extending a WebSecurityConfigurerAdapter and defining which endpoint
required authentication.
The outcome of this step is the user being allowed to enter the platform or the user data
being invalid/non-existing. For the first outcome, an object with user information will be
returned, stating that the user exists, then it will be generated a JWT with information about
the user (role, name, expiration of the session) being returned along with the API response,
represented by Figure 25.
Figure 25 - Login API response when user details are valid, AuthTokenResponse object
For the second outcome, where the user data is invalid, or the user is non-existent, it will
be triggered an exception, that will be handled by the application sending an error code as a
response with the proper status code.

Service Monitoring for a Mobile Money System
49
This process of authenticating a user can be identified in Figure 26, where is presented
the login method.
Figure 26 - Login Method
When creating a user, it will be sent a URL to the user that is responsible for the setup
of the password. Since a user can only be created by a Manager or Administrator of the
platform, when a new user is added to the platform, an email will be sent to this user, which
will allow the user to generate its password.
The password/create endpoint is responsible for creating a new password for a recently
created user, and when a user is created, the platform generates a token and adds the token
to the database, the token is then sent to the user-defined email, and allows the user to
activate and define a password of its own choice. This prevents the administrator that created
the account to set a password for the user or by generating a password on the Backend and
sending it to the user in plain text.
POST http://monitoringPlatformEndpoint/auth/password/create
The previous REST endpoint is also a POST and will receive a Reset Password DTO,
the object will contain a token (token generated by the Backend and stored in the database),
the username and the new password the user wants to add. If the token does not match the
one in the database, the password will not be updated/stored on the database.
In Figure 27 is presented the login screen responsible for receiving the email and
password of the user that will be used to authenticate the user using the Login API endpoint.
The Login API will send the user details and receives JWT if the details are valid, or an error
message, in case the details are invalid. In Figure 25 is presented the token returned by the
Login API in a successful event (user details are valid).

Service Monitoring for a Mobile Money System
50
Figure 27 - Login Page
If the details are valid and a token is received, the token will then be decoded by the
login method inside the LoginService in the Frontend application, and some details on the
token will be used. In Figure 28 is represented the information that a token contains, this
information will be stored on the Frontend.
The subfield represents the username and the scope of the role of the user. According to
the role field, the platform will show information to the user, but if the user is able to edit
the field manually (for example, changing from the ROLE_USER to ROLE_ADMIN), the
next request received from the endpoint will indicate the user tampered their permissions,
forcing the Frontend to automatically redirect the user to the initial Login Page.
Figure 28 - Decoding a JWT token
If a user forgets and wants to reset the password, he would be allowed to perform that
operation. To reset a password, the user will receive an email that will contain a URL with
a token. This token is connected to the user account and will have a validity of 24 hours.

Service Monitoring for a Mobile Money System
51
When the user clicks on that URL, he will be redirected to the change password Frontend
functionality and will be allowed to reset and change the password (see Figure 29). To
validate that the user that received the email is resetting the password, the user will be
required to add the email address that will be verified by the Frontend to check if the token
belongs to that email.
Figure 29 - Set a password
This functionality is also reused and is used by a recently created user to create its new
password (when an Administrator or Management user creates a new user).
In Figure 30 is presented a flow diagram, that represents the login flow of a user and the
selection of a location and environment, and the internal mechanism that is done internally
to login a user and present to him information about a specific location.
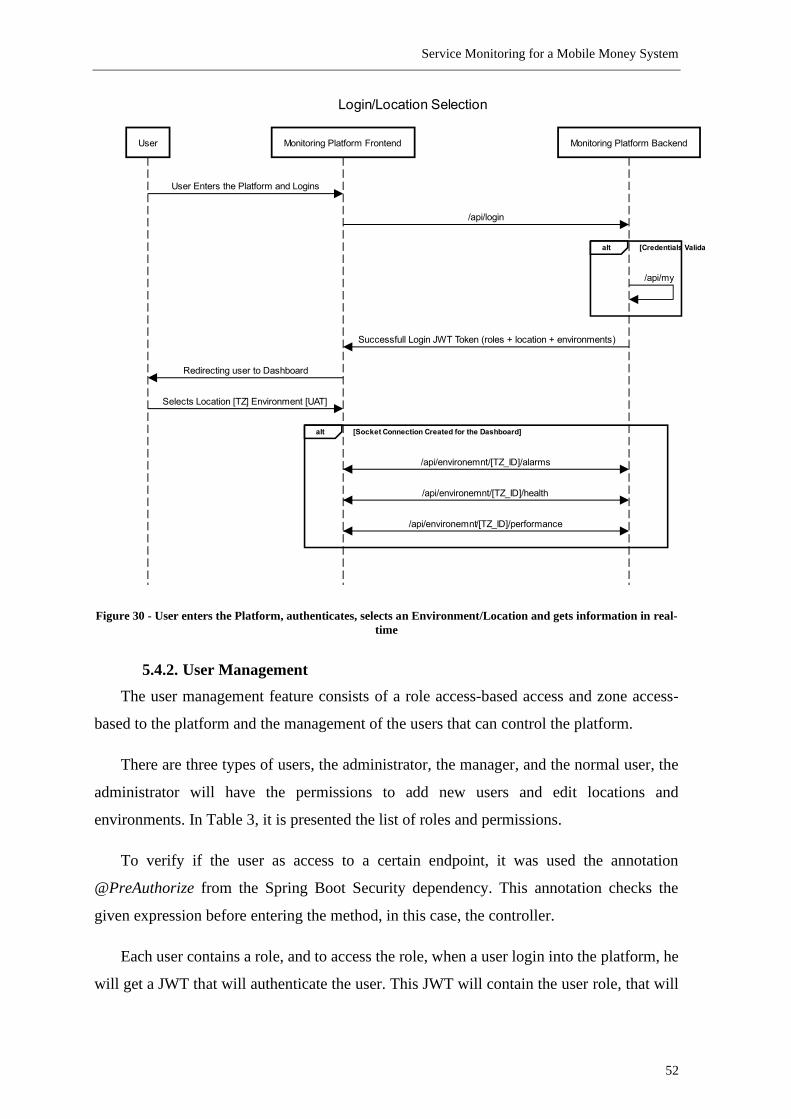
Service Monitoring for a Mobile Money System
52
Figure 30 - User enters the Platform, authenticates, selects an Environment/Location and gets information in real-
time
5.4.2. User Management
The user management feature consists of a role access-based access and zone access-
based to the platform and the management of the users that can control the platform.
There are three types of users, the administrator, the manager, and the normal user, the
administrator will have the permissions to add new users and edit locations and
environments. In Table 3, it is presented the list of roles and permissions.
To verify if the user as access to a certain endpoint, it was used the annotation
@PreAuthorize from the Spring Boot Security dependency. This annotation checks the
given expression before entering the method, in this case, the controller.
Each user contains a role, and to access the role, when a user login into the platform, he
will get a JWT that will authenticate the user. This JWT will contain the user role, that will

Service Monitoring for a Mobile Money System
53
be used by the @PreAuthorize annotation to check if equals to the role required to access
the method.
Table 3 - Roles Based Table
Role Admin Management Normal
Add/Edit Users Full Control Only allowed to add
users to Locations
Not Allowed
Access to
Locations/Environments
Full Access Fully Access Only to
assigned
locations
Control
Services/Operations
Settings
Full Control Only assigned
locations
View only
In Figure 31 is presented a method that only allows users whose role is admin.
Figure 31 - Method for users with the admin role
Figure 32 presents a method that only allows users with an admin role.
In case the @PreAuthorize annotation is not defined, all the roles are accepted to use
that method.
To verify that the token is valid and not tampered was implemented a series of methods
that verify the token validity, for example, when a request enters on the platform the
JWTAuthenticationFilter will check the token validity, the class TokenProvider, will fetch
the claims from the token, getting the expiration data, scopes, and other fields.

Service Monitoring for a Mobile Money System
54
Figure 32 – Method for users with Admin and Management Roles
The first way of checking if the token is valid is checking the expiration date, if the
expiration date is before the current date, it will be triggered an unauthorized exception, and
an error message is shown on the Frontend, and the user is redirected to the login page.
On the Frontend, the user roles will be obtained from the JWT, and the views will adapt
to each role. For example, in Figure 33, we can see that a user with admin and management
roles can get the service settings for a certain service.
Figure 33 - User with Management/Admin Role
In Figure 34 is possible to see a user with the normal role, in this case, the view adjusts
to the user and only makes available the user service settings option.

Service Monitoring for a Mobile Money System
55
Figure 34 - User with Normal Role
Also when a user tries to force the access to a particular method which he does not have
permissions or when the user deliberately tampers the JWT to achieve access to a certain
functionality that he does not have permission, this will trigger an exception on the server-
side that will be sent to the Frontend. In the Frontend, there will be an interceptor that will
be getting the exception and if the exception is from the 401 (Unauthorized) type will
automatically logout the user by clearing the user session and redirecting the user to the login
page.
Each user of the platform when logins will receive a JWT, this token will contain
multiple information like role, user details information, expiration date, and much more, and
at each request that is done to the Backend, the JWT is sent across the headers.
For security purposes, if a user sends an invalid or expired token, this triggers a 401
HTTP error code. This error is handled on the Frontend by the code presented in Figure 35.
The code presented in the figure is an Interceptor. This interceptor is responsible for
intercepting all HTTP requests, and if it detects that a response from the Backend
corresponds to the HTTP status code 401, that forces the application to close, redirecting the
user to the login.
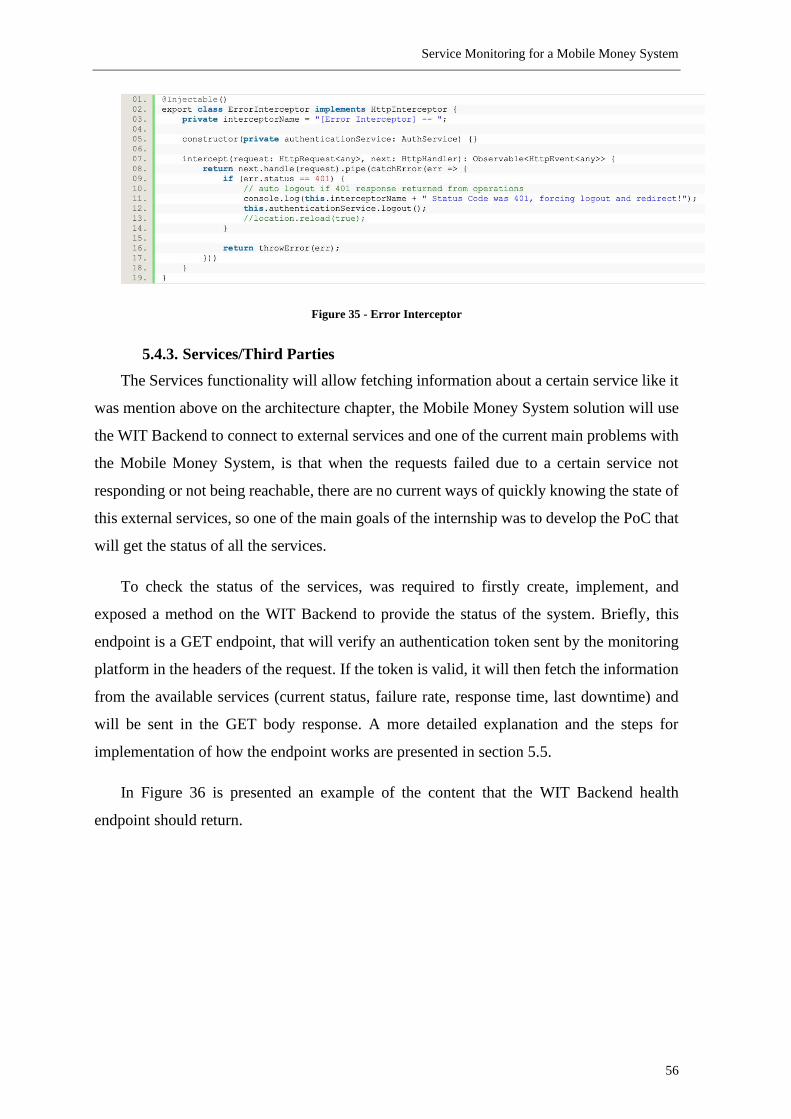
Service Monitoring for a Mobile Money System
56
Figure 35 - Error Interceptor
5.4.3. Services/Third Parties
The Services functionality will allow fetching information about a certain service like it
was mention above on the architecture chapter, the Mobile Money System solution will use
the WIT Backend to connect to external services and one of the current main problems with
the Mobile Money System, is that when the requests failed due to a certain service not
responding or not being reachable, there are no current ways of quickly knowing the state of
this external services, so one of the main goals of the internship was to develop the PoC that
will get the status of all the services.
To check the status of the services, was required to firstly create, implement, and
exposed a method on the WIT Backend to provide the status of the system. Briefly, this
endpoint is a GET endpoint, that will verify an authentication token sent by the monitoring
platform in the headers of the request. If the token is valid, it will then fetch the information
from the available services (current status, failure rate, response time, last downtime) and
will be sent in the GET body response. A more detailed explanation and the steps for
implementation of how the endpoint works are presented in section 5.5.
In Figure 36 is presented an example of the content that the WIT Backend health
endpoint should return.

Service Monitoring for a Mobile Money System
57
Figure 36 - Example of the JSON Response from the Health endpoint
To fetch the information from the health endpoint, was required to implement a
mechanism that fetched the information from the endpoint on a specific time interval, to
achieve this, it was implemented a SchedulerService.
When the user with the admin or management roles create a new location or assign a
new environment to an existing location, he as the option of adding the base URL for that
location, for example, https://tz.wit-testing.com/api/ and provide an authentication token.
When the users confirm the environment, it will be sent a test request to verify is the
environment is valid, and it will fetch the existing base endpoint.
To start monitoring the service, the user needs to go to the services tab, and press the
start monitoring button. When pressing the button, it will add the service to the
SchedulerService with the configured time interval and will periodically perform requests to
check the health and state of the service. The SchedulerService will then perform a GET
request to the defined endpoint and will analyse the received information with the base
values and check if the service state changes through time.
When performing the GET request to the health endpoint, the server will return the status
code, which will inform the status of the connection. Table 4 indicates all the connection
codes available.
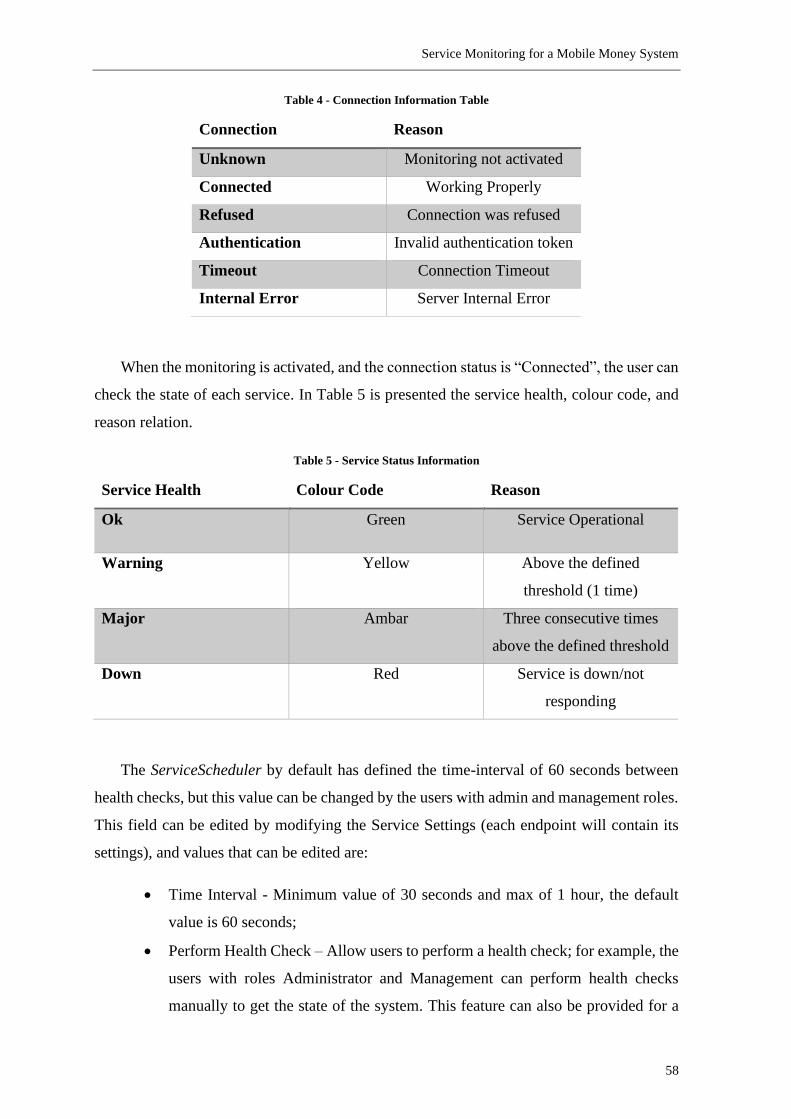
Service Monitoring for a Mobile Money System
58
Table 4 - Connection Information Table
Connection Reason
Unknown Monitoring not activated
Connected Working Properly
Refused Connection was refused
Authentication Invalid authentication token
Timeout Connection Timeout
Internal Error Server Internal Error
When the monitoring is activated, and the connection status is “Connected”, the user can
check the state of each service. In Table 5 is presented the service health, colour code, and
reason relation.
Table 5 - Service Status Information
Service Health Colour Code Reason
Ok Green Service Operational
Warning Yellow Above the defined
threshold (1 time)
Major Ambar Three consecutive times
above the defined threshold
Down Red Service is down/not
responding
The ServiceScheduler by default has defined the time-interval of 60 seconds between
health checks, but this value can be changed by the users with admin and management roles.
This field can be edited by modifying the Service Settings (each endpoint will contain its
settings), and values that can be edited are:
• Time Interval - Minimum value of 30 seconds and max of 1 hour, the default
value is 60 seconds;
• Perform Health Check – Allow users to perform a health check; for example, the
users with roles Administrator and Management can perform health checks
manually to get the state of the system. This feature can also be provided for a

Service Monitoring for a Mobile Money System
59
user with Normal roles by allowing this feature on the settings of the Service.
The default value is deactivated (only admin and management roles are allowed
to perform health checks manually);
• Custom Base Threshold – Define a base threshold in each will be used to
compare with the values returned from the health endpoint. The default value is
1500 ms;
• Custom Alarm Triggering Intervals – Allow to set custom base thresholds for
certain services items.
Along with the Frontend of the monitoring platform, the user can get a list of the current
services and each item of the service, along with some details of the current item health state
(response time, current health, name, last update, and latest downtime), this can be observed
in Figure 37.
Figure 37 – Services
On the Frontend side, each service will receive updates in real-time by connecting to the
respective environment WebSocket channel. Whenever a new change is received on the
monitoring Backend platform, there will be made an update on the Frontend in real-time,
changing the position of each service item according to the state, the health status, response
time, and much more.
If the current user has the roles Administrator or Management, he is also able to edit the
Service Settings for the Service. This feature is presented in Figure 38, and allows the user

Service Monitoring for a Mobile Money System
60
to enable or disable non-Management users to manually fetch for service health checks,
allow to change the base response time threshold and select custom response time threshold
values for a Service Item (see Figure 39).
Figure 38 - Service Settings
Figure 39 - Custom Response Time Threshold for a Service Item
In Figure 40 and Figure 41, are presented a sequence diagram, as an example of how the
monitoring platform Backend performs a health check from an external service, receives the
information, and sends the updates to the UI.
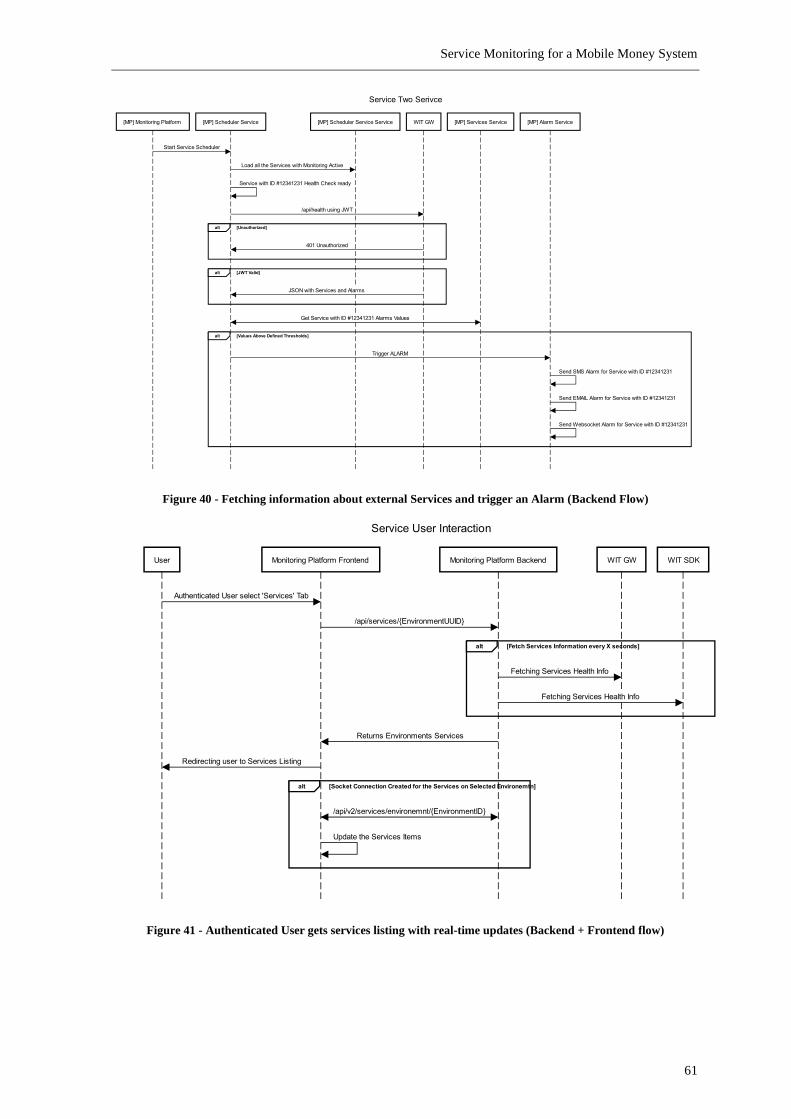
Service Monitoring for a Mobile Money System
61
Figure 40 - Fetching information about external Services and trigger an Alarm (Backend Flow)
Figure 41 - Authenticated User gets services listing with real-time updates (Backend + Frontend flow)

Service Monitoring for a Mobile Money System
62
Service Item Details:
When a health check is performed, the information on each item will be stored in a
NoSQL database, and this information can be observed more detailed by clicking on a
service item.
The information that will be presented to the user will be organized into two types, the
metrics, and the charts.
On the first type, it will be presented the name of the service item, status, creation date,
average metrics (failure rate, response time), the last downtime date, and the metrics on the
configured time interval (downtime, uptime, and downtime). It will also be possible to check
the triggered alarms and health checks performed on the configured time interval, that by
default is from the latest 24 hours.
In the second type, will show various charts with information on the configured time
interval and with an aggregation time interval (default is 5 minutes). To fetch a large amount
of data, it was used the aggregate functionality, and this will allow fetching all the data and
group them in specified time intervals, for example, fetch data from the last 24 hours in
groups of 5 minutes. In Figure 42 is presented an example of how the data aggregation of a
service item between a data using a time interval was performed.
Figure 42 - Example of data aggregation
Aggregation in MongoDB is an operation used to process the data that returns the
computed results. Aggregation groups the data from multiple documents and operates in
many ways on those grouped data to return one combined result. It processes documents and
return computed results and can perform a variety of operations on the grouped data to return
a single result [22].

Service Monitoring for a Mobile Money System
63
On the Frontend, it was basically consumed the REST APIs provided by the Backend,
allowing to display to the users the services and service items available on the selected zone,
and it was implemented using WebSockets, the live time health check feature, that allowed
to change in real-time the health check status and metrics displayed to the user. For achieving
this functionality, each service provides a socket connection that can be used by the Frontend
by subscribing the channel. The channel will have the following format:
/topic/service/{environmentUUID}/{serviceUUID}
Whenever a new health check was performed, the information was deployed on the
socket and was received by the listening Frontend connections.
By default, when a user entered to a specific environment he was automatically
subscribed to the channel of that environment, and when a health check occurred it is added
to that channel, and all the subscribed items will receive the information on the Frontend,
and using JavaScript Observables, it was possible to change the information in real-time.
In Figure 43 is possible to observe the getServices method and the
subscibeToServiceUpdates method. The first will provide a variable as an “observable”, and
that will be used to get updates from the socket connection. On the
subscibeToServiceUpdates method, it will be used the WebSocket connection created when
the user first authenticates and selects the location and environment to monitor. Then it will
be subscribed to the services that exist in that environment, waiting for new changes to send
through the observable.
Figure 43 - WebSocket Service and Observable

Service Monitoring for a Mobile Money System
64
In Figure 44 is possible to observe the “observable” implementation on the component
code, that will subscribe to the getServices observable and will update the service items of
the service according to the information sent through the WebSocket connection.
Figure 44 – Component code that subscribes to a certain observable and updates the Service Table with Service
Item updates
On the Frontend, each Service Item will display the information gathered (and can be
selected filters for the time period for the data to be presented) about the service item.
This information will be divided into two tabs, the Information tab (see Figure 45) will
contain more specific information about a service item, like current health status, average
metrics, downtime metrics, a list of all the health checks in the time period and a list of all
the alarms.
Figure 45 - Service Item Information Tab

Service Monitoring for a Mobile Money System
65
On the Charts tab (Figure 46), it will be presented more visual information, with bar
charts, linear graphics, and much more. This information will be useful for quickly
understanding the state of the service along the time, and for checking possible up and
downtimes, understand the time intervals where occurred more alarms, correlate the alarms
with downtime, and much more.
Figure 46 - Services Item Charts Tab
5.4.4. Operations
The Operations functionality consists of reusing and adapting a software developed
previously by WIT and updating the software to be able to send information to the
monitoring platform. More detailed information about the developments and changes
applied to this software can be found in section 5.5.
The existing develop tool, monitoring server, basically used data obtained from the
applications and backend communication, and compared this information with base values
to raise alarms. To collect the data generated in this tool and to use it in the monitoring
platform, it was required to provide a way of getting the data, and one of the easiest ways of
getting this information was through a REST endpoint.
To achieve this, when creating an environment, it was used the environment unique
identifier as a part of the REST endpoint, and a random token was generated to verify the
sender. On the monitoring server, it was added to the REST endpoint URL and the token,
and every time the monitoring server runs and generated data, this data is sent to the

Service Monitoring for a Mobile Money System
66
monitoring platform. This will provide data centralization and also allows the visualization
of the data through charts, along with the display of the data, it will also enable to trigger
and store alarms on the monitoring platform.
On the monitoring platform, the data was divided into two classes, the applications, and
the servers, and each type contains multiple requests. On the side of the mobile application,
the requests were the name of the REST Endpoint that was called to obtain the data, and on
the server-side, the requests were the ones that were made from the servers to the multiple
external services. This allows monitoring the system from the user side (enable to see the
times between the user clicked the screen until the request reached the server) and the time
the request takes between reaching the server going to the services and back to the
application. The catch was that this data was only possible to obtain at an hourly rate, not
allowing to get the system health state or the service health state continuously.
In Figure 47 is presented a flow diagram with the existing flows for displaying details
of a given operation and also the flows of the monitoring server inserting operations into the
monitoring platform and triggering alarms notifying an authenticated user.
Figure 47 - Operations, create a new endpoint, receive operations entry and update the Monitoring Platform UI

Service Monitoring for a Mobile Money System
67
To connect the monitoring server with the monitoring platform, it is required to add an
endpoint (where the information about each operation will be sent) and a communication
token, that will be responsible for authenticating and allowing the monitoring server to
submit information to the endpoint.
The endpoint will be constituted by the IP/DNS of the Monitoring Platform REST API
and by the controller (operations) and the method (insert) and the environment where the
information will be sent.
POST http://monitoringPlatformIP/operations/insert/{environmentUUID}
The data, for adding a monitoring server, is available for all the users that contain the
Administrator or Management Role, and to access this information the users need to go to
the Environment details and click on the details icon. This action will pop-up a modal with
all the required information (token, endpoint, last updated date, creation date, and much
more) and it also allows generating a new token, revoking the previous one. This feature is
presented in Figure 48.
Figure 48 - Connection Endpoint for the Monitoring Server to send the entries
After setting up the monitoring server with the proper endpoint and token, it will then
start sending data to the Monitoring Platform.
Each monitoring server will contain information about an environment and will monitor
the requests from the server-side and also the application side. The monitor server fetches

Service Monitoring for a Mobile Money System
68
information about the requests done by the mobile applications to the WIT Mobile Money
System Solution, that gathers all the information about the time each request took until a
response is received, the monitoring server will then gather this information from a database
within a certain time interval (every hour for example) and according to pre-configured
interval alarms will be triggered.
The monitoring platform will receive this information and will display it to the user, to
allow the user to analyse the information along a course of time and also to check each
request state individually.
Since an environment can have multiple applications, from multiple versions of
applications to multiple types of applications (Consumer Application or Organization
Applications). In Figure 49, it is presented the list of servers and applications on the selected
environment.
Figure 49 - List of applications and gateways on the selected environment
Each environment can have multiple versions of each application, and each application
or server can have multiple requests. When selecting to get the details of an application or a
server, the first tab displayed to the user contains a chart with the requests in the worst
condition along the last 24 hours (see Figure 50). This feature will allow, quickly, the user
to know which request might be bottlenecking the system.
On the server-side, to display this data, it is required to aggregate the data from the
multiple databases, from the MongoDB it will be fetched all the entries that will allow

Service Monitoring for a Mobile Money System
69
generating the lines of the chart, and from the Oracle Database, it will be fetched the health
status of each Operation.
Figure 50 - Operations in the worst condition
The aggregation process it will first take into consideration the rate that the monitoring
server inserts data into the monitoring platform (on the image the aggregation process is a
minimum of 5 minutes, this means that it will aggregate the data in 5 minutes intervals).
By providing only the worst condition operations, it will optimize the data loaded by the
Frontend side. Still, the user only has the option to load all the operations charts with multiple
options. Figure 52 shows an example, where a user can select to monitor only a specific
operation failure rate within a period of 15 minutes.
Figure 51 - Available configurations for the Operations chart
There is also the possibility to list all the operations, that will list all the existing
operations and order each request by health condition (see Figure 52).

Service Monitoring for a Mobile Money System
70
Figure 52 - List of Operations of an example Application
The information displayed on the previous figure is updated in real-time, this is possible
by using WebSockets that allows the Frontend application to be “listening” for Operations
Updated for this specific application, to update the data table in real-time and update each
request health and status. It is also possible to check the evolution of a certain request within
a time interval for the multiple metrics, as shown in Figure 53.
Each request will have the health status (healthy, unhealthy, improving, decreasing),
failure rate, response time and count call graphics, along with a graphic displaying the alarms
of each request within a time interval.

Service Monitoring for a Mobile Money System
71
Figure 53 - Details of a Request
5.4.5. Alarms
Alarms functionality allowed to preserve the detected anomalies on the system.
The users with an Admin and Management roles are allowed to define the base value
(reference value or custom value for each service item), and if those values are surpassed,
an alarm is triggered.
On the services (external service) functionality, each alarm can have multiple levels of
alarms, and each level is identified by severity, the list of severities can be found in Table 5.
On the operations functionality, the monitoring server will be responsible for triggering
alarms. This type of alarms will be different than the services alarms presented above since
they are configured on the monitoring server-side. But they will also be identified by a
severity similar to the services. Among these types of alarms, there are three types, similar
to the service alarms, but the values can only be changed on the monitoring server.
The alarms are associated with the location and to the environment, and they hold several
fields that allow to quickly identify the reason and the source of the alarm.
On the Frontend application, the user could get the alarms in real-time. For the selected
location and environment, it would be displayed a list of all the alarms on a Data Table, that
would be updated when a new alarm is triggered, this feature is represented on Figure 54.
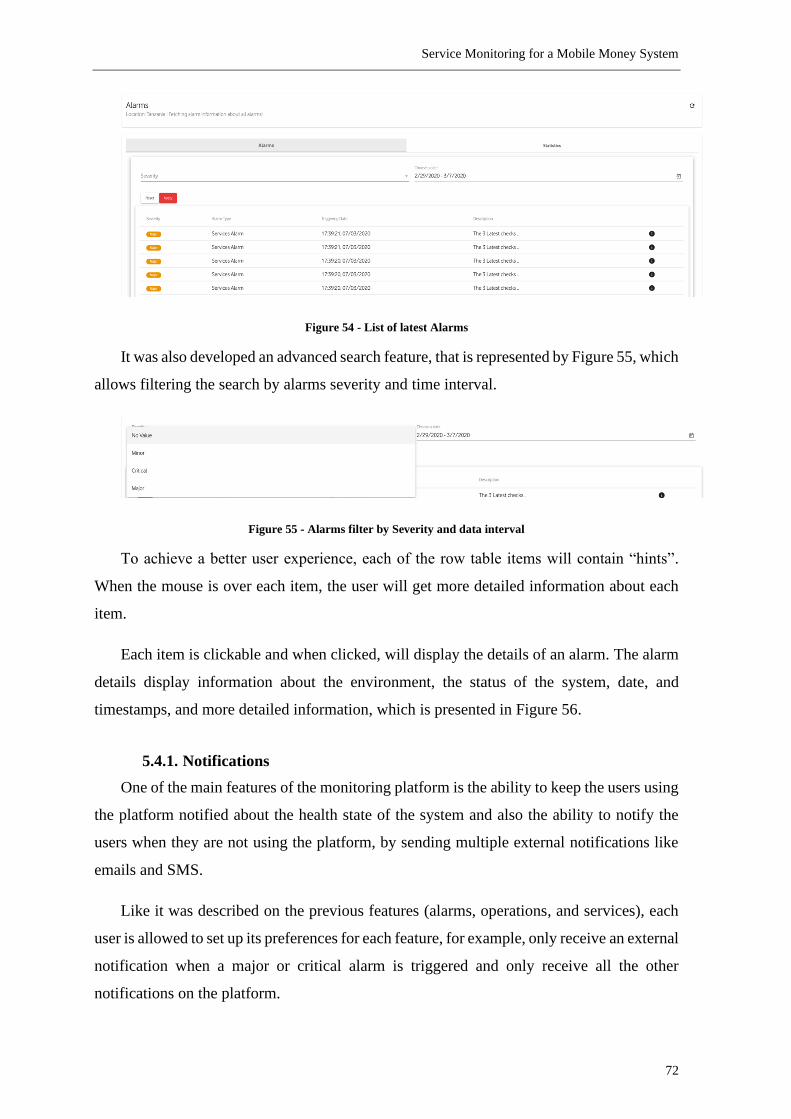
Service Monitoring for a Mobile Money System
72
Figure 54 - List of latest Alarms
It was also developed an advanced search feature, that is represented by Figure 55, which
allows filtering the search by alarms severity and time interval.
Figure 55 - Alarms filter by Severity and data interval
To achieve a better user experience, each of the row table items will contain “hints”.
When the mouse is over each item, the user will get more detailed information about each
item.
Each item is clickable and when clicked, will display the details of an alarm. The alarm
details display information about the environment, the status of the system, date, and
timestamps, and more detailed information, which is presented in Figure 56.
5.4.1. Notifications
One of the main features of the monitoring platform is the ability to keep the users using
the platform notified about the health state of the system and also the ability to notify the
users when they are not using the platform, by sending multiple external notifications like
emails and SMS.
Like it was described on the previous features (alarms, operations, and services), each
user is allowed to set up its preferences for each feature, for example, only receive an external
notification when a major or critical alarm is triggered and only receive all the other
notifications on the platform.

Service Monitoring for a Mobile Money System
73
Figure 56 - Details of an Alarm
To send notifications in real-time while using the monitoring platform was used as a
WebSocket. On the server-side, each environment, service, operation, will publish its results
on a specific channel. On the Frontend application, according to the user settings and
environment selection, the notification will trigger a notification to notify the user of a
change on the system (new triggered alarm, service item health change, operation health
change).
The notification feature does not consist only of WebSockets notifications. Still, it can
also send notifications via email and SMS. To achieve this was implemented on the
monitoring platform a notification service that according to the user settings for a specific
environment, service or operations, will send notification via email or SMS, notifying the
user even if he is not using the platform at the moment when the health/alarm was triggered.
Although the primary purpose of the notification feature is to inform the users about the
health and state of the system, it can also send verification and password reset/confirmation
emails to the users, as well as, user phone number confirmation via OTP (One Time
Password).
The notification service contains a set of methods that can be implemented among other
services to help to send notifications to users, for example, when an alarm is triggered and
the user settings for the service/operation that triggered that alarm says the user wants to be
notified via SMS, the sendAlarmsSmsToUsers method will be called, receiving a list of users
and the alarm that will be sent via SMS.
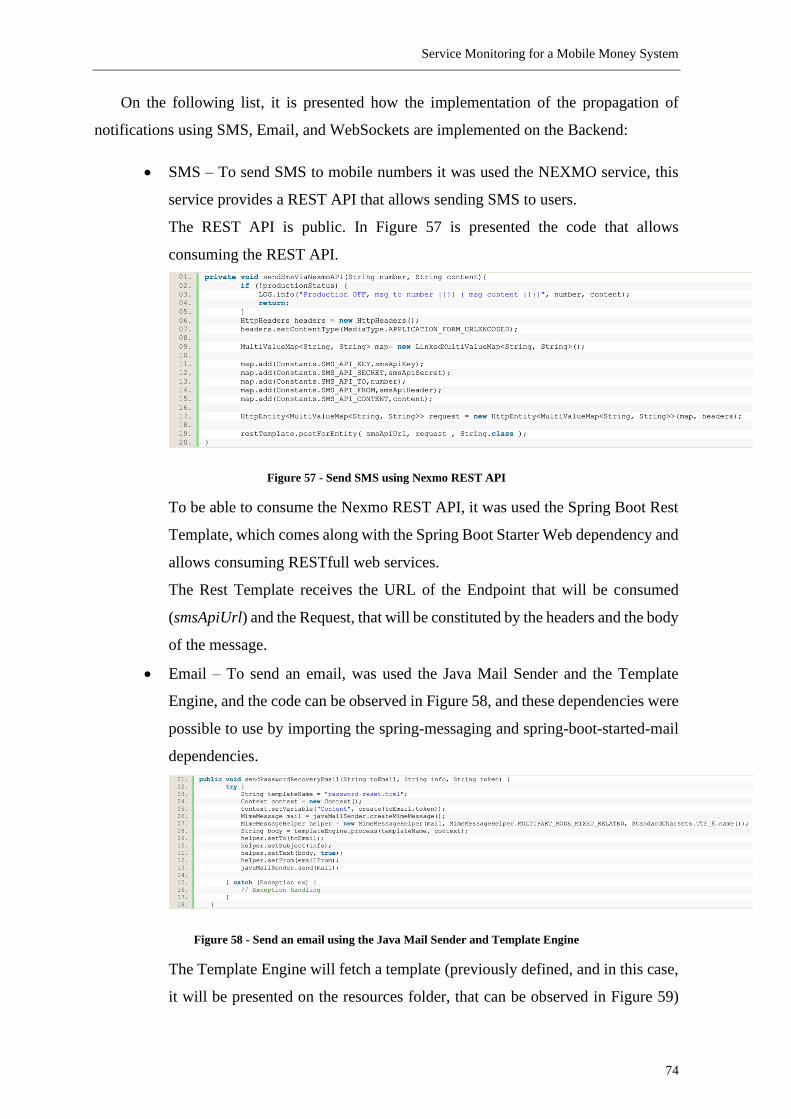
Service Monitoring for a Mobile Money System
74
On the following list, it is presented how the implementation of the propagation of
notifications using SMS, Email, and WebSockets are implemented on the Backend:
• SMS – To send SMS to mobile numbers it was used the NEXMO service, this
service provides a REST API that allows sending SMS to users.
The REST API is public. In Figure 57 is presented the code that allows
consuming the REST API.
Figure 57 - Send SMS using Nexmo REST API
To be able to consume the Nexmo REST API, it was used the Spring Boot Rest
Template, which comes along with the Spring Boot Starter Web dependency and
allows consuming RESTfull web services.
The Rest Template receives the URL of the Endpoint that will be consumed
(smsApiUrl) and the Request, that will be constituted by the headers and the body
of the message.
• Email – To send an email, was used the Java Mail Sender and the Template
Engine, and the code can be observed in Figure 58, and these dependencies were
possible to use by importing the spring-messaging and spring-boot-started-mail
dependencies.
Figure 58 - Send an email using the Java Mail Sender and Template Engine
The Template Engine will fetch a template (previously defined, and in this case,
it will be presented on the resources folder, that can be observed in Figure 59)
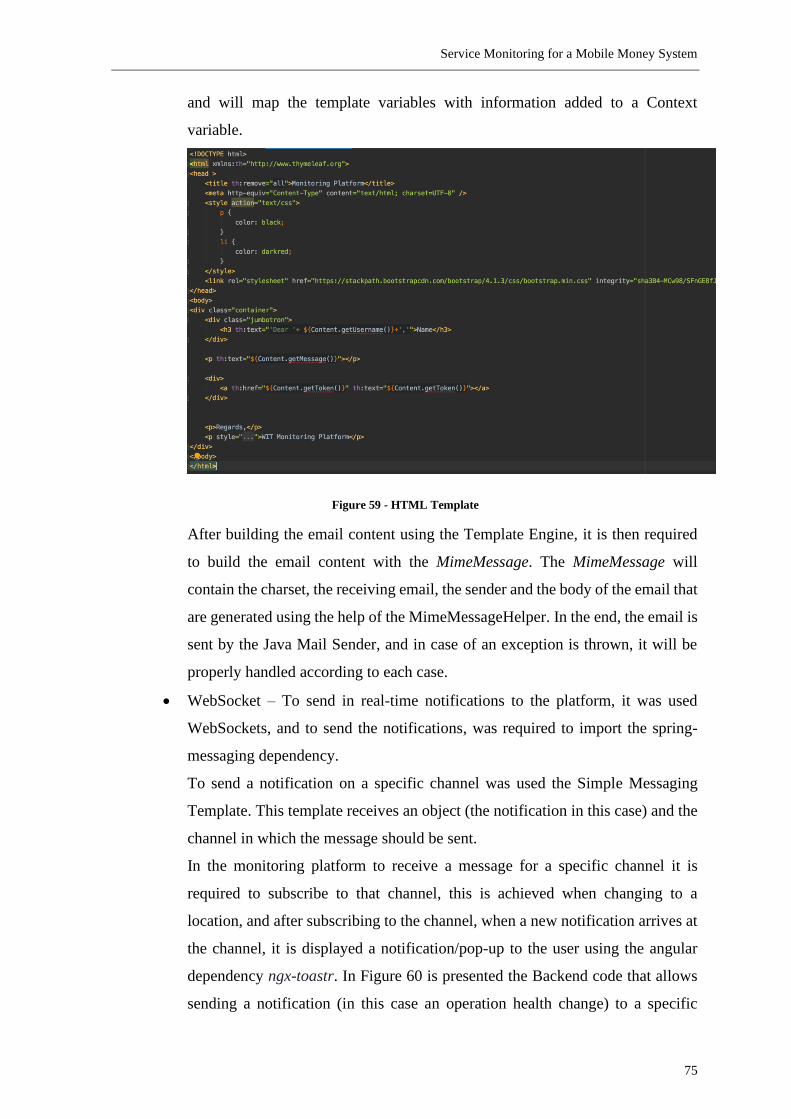
Service Monitoring for a Mobile Money System
75
and will map the template variables with information added to a Context
variable.
Figure 59 - HTML Template
After building the email content using the Template Engine, it is then required
to build the email content with the MimeMessage. The MimeMessage will
contain the charset, the receiving email, the sender and the body of the email that
are generated using the help of the MimeMessageHelper. In the end, the email is
sent by the Java Mail Sender, and in case of an exception is thrown, it will be
properly handled according to each case.
• WebSocket – To send in real-time notifications to the platform, it was used
WebSockets, and to send the notifications, was required to import the spring-
messaging dependency.
To send a notification on a specific channel was used the Simple Messaging
Template. This template receives an object (the notification in this case) and the
channel in which the message should be sent.
In the monitoring platform to receive a message for a specific channel it is
required to subscribe to that channel, this is achieved when changing to a
location, and after subscribing to the channel, when a new notification arrives at
the channel, it is displayed a notification/pop-up to the user using the angular
dependency ngx-toastr. In Figure 60 is presented the Backend code that allows
sending a notification (in this case an operation health change) to a specific
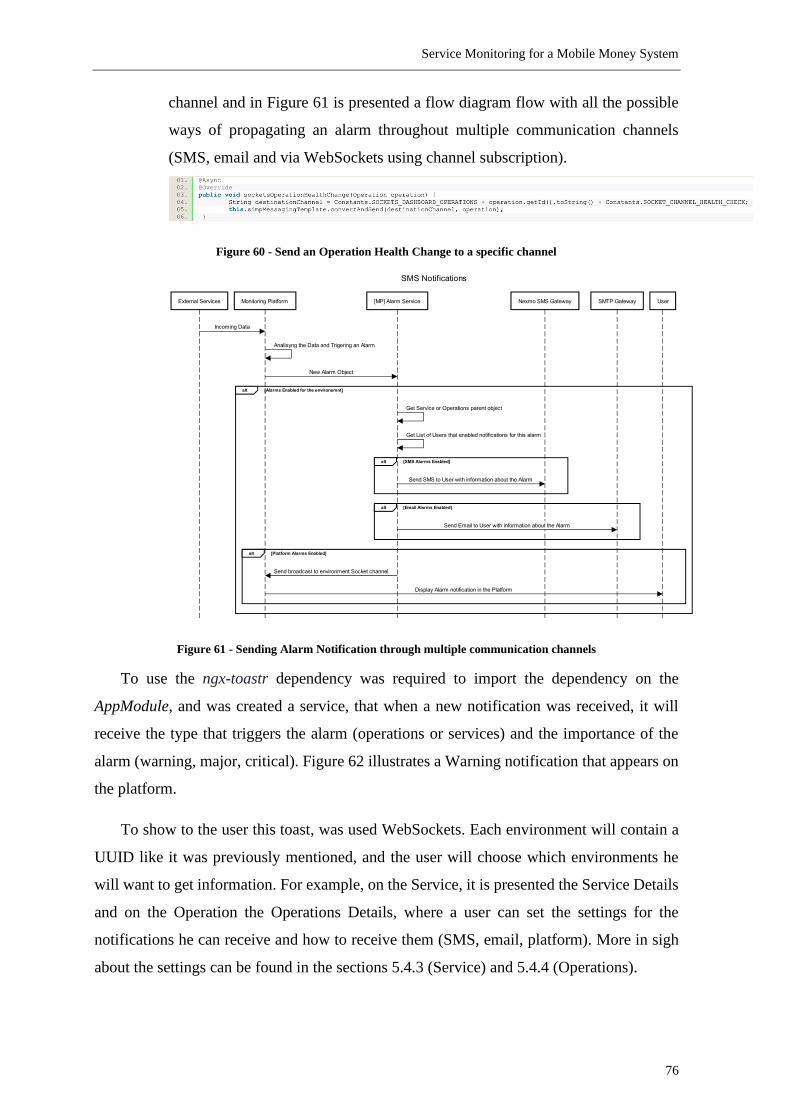
Service Monitoring for a Mobile Money System
76
channel and in Figure 61 is presented a flow diagram flow with all the possible
ways of propagating an alarm throughout multiple communication channels
(SMS, email and via WebSockets using channel subscription).
Figure 60 - Send an Operation Health Change to a specific channel
Figure 61 - Sending Alarm Notification through multiple communication channels
To use the ngx-toastr dependency was required to import the dependency on the
AppModule, and was created a service, that when a new notification was received, it will
receive the type that triggers the alarm (operations or services) and the importance of the
alarm (warning, major, critical). Figure 62 illustrates a Warning notification that appears on
the platform.
To show to the user this toast, was used WebSockets. Each environment will contain a
UUID like it was previously mentioned, and the user will choose which environments he
will want to get information. For example, on the Service, it is presented the Service Details
and on the Operation the Operations Details, where a user can set the settings for the
notifications he can receive and how to receive them (SMS, email, platform). More in sigh
about the settings can be found in the sections 5.4.3 (Service) and 5.4.4 (Operations).

Service Monitoring for a Mobile Money System
77
Figure 62 - Alarm Notification on the platform.
When the user selects to receive platform notifications, he will be subscribed to the
current Location WebSocket channel and other private channels and specific alerts (settled
up on the details), and this can be described in Figure 63.
Figure 63 - Subscribe to the WebSocket with JWT Auth, and subscribe to Current Location Channel
The user is also able to change the current location. Whenever he changed from Location
to Location, we will stop subscribing older Locations and start listening to the channel of the
new Location. It is possible to observe in Figure 64 when a user changed the location, the
method subscribeToZoneRelatedWebSocketChannel is called, disabling the notifications

Service Monitoring for a Mobile Money System
78
from the older Location and calling the method serviceZoneBasedNoticiations for enabling
notifications for the currently selected zone.
Figure 64 - Change Location and update Notifications
Like it was mentioned above, the user can select specific Services and Operations he
wants to receive alarms from, and to achieve this in real-time, whenever the user edit the
details it will store/update on the localStorage a list of the service/operations he does not
want to receive notifications, this list is also updated on server-side and loaded whenever the
user enters the application.
Figure 65 contains the code snippet used to upload the settings received from the server
into the storage mechanism. For example, when the user performs a login, it will receive this
list, and this method is called to update the localStorage.
This step will update the record containing information of which notifications should be
ignored, in this specific case, the list of operations to snooze/ignore.

Service Monitoring for a Mobile Money System
79
Figure 65 - Update the User Muted notifications (Operations/Services)
The user can also click on the notification, this will display a SnackBar (Figure 66), that
will give the user the option to disable Notifications for this specific Service or Operation,
and this can be reverted by entering the Service or Operations Settings.
Figure 66 - Disable Platform Notifications
For the email and SMS notification on the user side, the user email service will handle
the email notification and will also show the text to the user. An example of an email is
presented in Figure 67.
Figure 67 - Example email of a new triggered Alarm

Service Monitoring for a Mobile Money System
80
The SMS notification will also be handled by the user phone and the user messaging
application. An example of an SMS is presented in Figure 68.
Figure 68 - Example of SMS notifications
5.5. Mobile Money System Functionalities
Along with the functionalities on the monitoring solution, it was also required to create
and update features on the Mobile Money System, more precisely to the WIT Backend and
on the Monitoring Server, to be able to monitor the multiple existing external services.
In section 5.5.1 are described the WIT Backend functionalities that were added to allow
the monitorization of the external servers. In section 5.5.2 are described the changes applied
to the Monitoring Server to enable the communication with the Monitoring Platform.
5.5.1. WIT Backend
For fetch information about the Mobile Money System services, it was required to apply
some changes and adding some functionalities on the WIT Backend. The needed changes
consisted of exposing an endpoint that returned information about the state and health about
the system.

Service Monitoring for a Mobile Money System
81
Since the project has multiple functionalities that can be enabled/disabled (since various
markets have different needs), it was opted to use the same methodology for exposing the
health endpoint. The first thing that was required was to add a global property, that allowed
to enable or disable the health endpoint. In order to load this property, it can be added to the
java arguments with the flag -DmonitoringEnabled=true, and when enabled, this property
allows the health endpoint to be accessible.
When enabling the property, it will also be activated a filter. This filter will be
responsible for verifying if the incoming requests to the health endpoint contained a header
and also validated the content of the header.
For fetch information about the services of the WIT Backend, it was required to
configure the environment with the authentication token on the monitoring platform. After
configuring the environment, the platform would fetch the information of the health endpoint
within the set interval. More information can be found in section 5.4.3.
Among exposing the endpoint and creating the filter to ensure only authenticated
requests were allowed, it was also required to develop a mechanism to store and manage the
information about the services. However, this came with some problems since it was only
possible to create this mechanism using a local instance, the information about the services
were limited since the only available data comes from mocks servers, not allowing to test
the platform with real data.
To fetch the data from the services was created a health service. This service was
responsible for communicating with the other external services and using reflection, and it
gathers information about the services. On the reflection class that the external services
implemented, it was also defined a time interval, that serves as a control variable, and if that
service is not called during the specified time interval, a request is made for that external
service, to check the health. Figure 69 presents a flow diagram that describes the mechanism
for fetching the health status for external services.
By this, it was possible to know if the external service was up or down (down if it was
raised an exception, for example, a timeout occurred or a 500 based error code) and it was
also possible to know metrics like response time and failure rate.

Service Monitoring for a Mobile Money System
82
Figure 69 - WIT Backend external services health check mechanism
When the monitoring platform called the health endpoint, it collected all the services
data and returned the data to the monitoring platform via JSON. An example of the response
can be found in Figure 70.
Figure 70 - JSON Response by the Health API of the WIT Servers

Service Monitoring for a Mobile Money System
83
To test the monitoring platform and to simulate data input from external services, a mock
server was developed for the WIT Backend health endpoint, which mimicked the code
implemented and returned metrics about multiple services.
5.5.2. Monitoring Server
The monitoring server was a Spring Boot application, that was developed by WIT to
fetch information regarding the user’s applications. Each application uploaded information
about the requests (information about the request name, timestamps from when the request
was made and when the response arrived) and also information from the server-side (when
the request entered the system, and the response was sent to the applications). This system
compared the values mentioned above with reference values, and if they were above the
reference values alarms were triggered.
To fetch this information and display it in the form of charts and graphics to the user,
was implemented as a mechanism that sends the data and alarms to the monitoring platform.
This mechanism consisted of posting the information to the monitoring platform via a REST
API.
5.6. UI/UX Updates
Several changes were made on multiple functionalities to improve the user experience.
It was also refreshed the user interface, where it was proposed a new design by the WIT
Design team.
In Figure 71 is presented the initial design, and in Figure 72 is shown the final design
that was applied.
The new interface was cleaner, with more summarized information about the whole
system's health, and it was applied a custom font and custom colours. It was removed all the
unnecessary data from the dashboard, and it was only presented to the user the current status
of the system, with the health check status, performance status, and latest alarms on the last
24 hours.
On the overall design, the navigation bar suffered a refresh, and it was removed the
sidenav toggle icon and the toggle functionality. The sidenav was composed only by icons,
and it was implemented a new pop-over feature that shows the currently selected component.

Service Monitoring for a Mobile Money System
84
Figure 71 - Initial Dashboard Design
Figure 72 - UX/UI Refresh implemented Dashboard
Along with the platform, the new styles were applied, refreshing all the applied colours
and removing all the non-relevant displayed data.
In conclusion, this UI refresh made the overall look of the application cleaner and
reorganized the way the information was shown to the user, removing less relevant
information and replacing it with important factors of the system health.
5.7. Continuous Integration/Docker
The Continuous Integration (CI) / Continuous Delivery (CD) Stage is an important step
for the development stage since it allows to verify if the developed code is compiling, the
files are being built successfully, and the code is validated and tested. On this project, the
continuous integration stage was implemented close to the end of the intership but allowed

Service Monitoring for a Mobile Money System
85
to implement a CI/CD pipeline that allowed the final developments to occur without
problems since the code was being automatically validated by the build mechanism and the
deploys were also made automatically.
During the internship, it was performed simple code review tasks by other developers
from the Mobile Money System team, and one rule was that whenever a feature or fixes were
added into the develop branch, it was required to be performed code review. Whenever the
code review was completed, and the merge request was accepted, it is triggered a
notification/action by the versioning control service (in this case GitLab) into a webhook
provided by the CI/CD server, Jenkins, that would then run the code to check if there were
any compilation problems. When it is pushed a change to the versioning control service (ex:
Git or GitLab), it is triggered a notification/action into a webhook, that will start the pipeline,
the code is processed by a platform of continuous integration, more specific, Jenkins.
To automatize the deployment of the solution into the production and development
server was created a pipeline dedicated to connecting to the server, and updating the running
image. Figure 73 presents the full CI/CD schema, from the step of the developer committing
the code to the closed merge request until the user is notified and the images being updated
in the server.
Figure 73 - Continuous Integration Process

Service Monitoring for a Mobile Money System
86
All of these processes can be done manually by accessing the Jenkins platform. For
example, if there is a need for generating a build for a specific branch, the user can access
the pipeline and start a “Build with parameters”. By default, the branch used is the develop
(branch with a stable version of the code), and by manually adding a branch this will allow
generating a proper JAR file for that branch. By generating the JAR files from the CI tool
instead of generating manually, will assure that the JAR will be fully working.
5.7.1. Pipelines
To automatize this process, was used pipelines, and more precisely, it was created two
pipelines, the monitoring-build-pipeline, and the monitoring-deploy-pipeline.
The Build Pipeline will get as a parameter the branch in which the user wants to build
and generate the artifact. It also contains three stages. The First Stage is fetching the data
from the GitLab according to the parametrized branch.
If the first stage occurs successfully, the next stage is the Build Stage, where the maven
clean install command will be executed and in case of success will generate the project files.
In order to create a docker image and to store this docker image safely, it was also used the
maven plugin “maven-dockerfile” by Spotify. This plugin is configured on the pom.xml file
and allows to generate the Docker image of the JAR and to deploy this generated image into
a Docker Registry. Still, in the end, this plugin was not used to update the production server,
due to the WIT Jenkins configuration not supporting generating Docker builds.
The third stage is the Results Stage; this stage stores the generated files (from the server
and the Frontend) and makes them available for the next pipeline or to download the
generated project files.
The Deployment Pipeline will use the Build Pipeline, and in the end would run a
Deployment Stage, that fetches the archived project files from the build pipeline, and runs a
couple of shell scripts that would move the current project files to the server, and move the
previous files to a backup folder and in the end starting the newly uploaded project files.
5.7.2. Docker
At the end of the internship, it was also asked to Dockerize, the solution, to have a quick
and reliable way to publish the application.

Service Monitoring for a Mobile Money System
87
Docker is a tool designed to create, deploy and run applications efficiently by using
containers. The containers allow to package the application with all the parts it needs (like
libraries, dependencies, etc.) and to ship it all out as a single iamge. This image can then be
easily deployed.
In this specific case, it was adapted the pipeline that when the Jenkins runs the build,
there will be triggered a job that is responsible for generating a Docker image using the
stored project files. To create the Docker Image for the Backend application was used the
OpenJDK 8 alpine as the base image and The Dockerfile used for creating this Backend
image can be seen in Figure 74.
Figure 74 - Backend Dockerfile
For the frontend application, it was only required to run the HTTP docker image. Since
the Frontend is an Angular project when the Jenkins pipeline builds the code, it will generate
the static files that can be deployed using the HTTP webserver.
In Figure 75, it is presented the Dockerfile responsible for creating the docker container
running the Angular frontend application.
Figure 75 - Frontend Dockerfile

Service Monitoring for a Mobile Money System
88
Conclusion
The internship on WIT Software, was an enrichment experience, allowing me to develop
and improve competences and expertise on a professional level.
The main goal of the internship was to create a proof of concept platform that can
monitor a Mobile Money System. The goal was achieved by developing a platform that
successfully fetches and analyses information about the state of the system, allowing to
check the overall system health state.
One of the biggest challenges encountered in the internship was the lack of real data.
Since this is a monetary platform that moves a lot of money and deals with a large amount
of sensitive information, it was not possible to use real data from the production
environment, being only possible to simulate data using seeders (tools that simulate/dump
data) or tests environments data.
Like was mentioned above, due to being a sensitive system, it was not possible to use
the services that exist in the production environment, and the services used to test the system
were generated using seeders and mock data. Another main challenge encountered was not
having MSISDNs that allowed a proper monitorization of the services.
Being one of the main goals of the solution to monitor the multiple markets, one of the
biggest challenges was to develop the platform to centralize all the data from many
environments and analyse this data in real-time and notify the users by different notification
means.
For future work, the role system permissions system should be updated, allowing the
administrators and managers to entirely give custom permissions to each user based on what
they are allowed to access and not by using role-based authorisation. Also, implement
monitoring solutions that would extract more detailed data from the Mobile Money System
and the other external services, and finish the implementation of a test stage in the CI/CD.
In conclusion, the objective of the internship was the development of a PoC solution that
allowed to monitor a Mobile Money System. The solution was able to keep track of the
changes made to the services, triggering alerts based on threshold and allowing to check the
health of the services and the whole system using a unique platform. At the end of the
Service Monitoring for a Mobile Money System
89
internship, it was conducted a demonstration of the monitoring solution to Vodafone, which
helped to demonstrate the lack of monitoring solutions on the Mobile Money System, and
how a monitoring solution will help to know the major bottlenecks of the system quickly.
Also, by the end of the internship, it was received a proposal to keep working on WIT
Software Mobile Money System solution as a Software Developer, which was proudly
accepted.

Service Monitoring for a Mobile Money System
90
Bibliography
[1] “M-Pesa,” Vodafone, [Online]. Available:
https://www.vodafone.com/content/index/what/m-pesa.html. [Acedido em Fevereiro
2019].
[2] Nagios, “https://www.nagios.org/about/history/,” [Online]. [Acedido em 2018].
[3] Prometheus. [Online]. Available: https://prometheus.io. [Acedido em 11 2018].
[4] “What is Agile,” [Online]. Available: https://www.wrike.com/project-management-
guide/faq/what-is-agile-methodology-in-project-management/. [Acedido em 3 2019].
[5] Jira. [Online]. Available: https://confluence.atlassian.com/jirasoftwarecloud/burnup-
chart-945124716.html. [Acedido em 07 2019].
[6] “https://jwt.io,” jwt.io. [Online]. [Acedido em 2019 03].
[7] T. Dąbrowski, “https://www.toptal.com/java/stomp-spring-boot-websocket,”
[Online].
[8] Spring.io, “https://docs.spring.io/spring/docs/5.0.0.BUILD-SNAPSHOT/spring-
framework-reference/html/websocket.html,” [Online]. [Acedido em 03 2019].
[9] Angular, “Architecture,” [Online]. Available: https://angular.io/guide/architecture.
[Acedido em 10 2019].
[10] Java, “https://java.com/en/download/faq/whatis_java.xml,” o. [Online]. [Acedido em
2018].
[11] Oracle, “https://www.oracle.com/java/technologies/java-se-support-roadmap.html,”
[Online]. [Acedido em 2018].
[12] O. Database, “Oracle Database,” [Online]. Available:
https://www.oracle.com/database/. [Acedido em 11 2018].
[13] Hibernator, “Hibernator,” [Online]. Available: http://hibernate.org/. [Acedido em 11
2018].
[14] M. D. Inc., “MongoDB,” [Online]. Available: https://www.mongodb.com/what-is-
mongodb. [Acedido em 11 2018].

Service Monitoring for a Mobile Money System
91
[15] Gut, “Git-SCM,” [Online]. Available: https://git-scm.com/about. [Acedido em 11
2018].
[16] M. App, “Marvel App,” [Online]. Available: https://marvelapp.com/. [Acedido em 11
2018].
[17] Google, “Material Design - Understanding Layout,” [Online]. Available:
https://material.io/design/layout/understanding-layout.html .
[18] Amazon, “About Amazon AWS,” [Online]. Available:
https://aws.amazon.com/pt/about-aws/. [Acedido em 11 2018].
[19] Amazon, “Amazon EC2,” [Online]. Available:
https://docs.aws.amazon.com/pt_br/AWSEC2/latest/UserGuide/concepts.html.
[Acedido em 11 2018].
[20] Amazon, “About Amazon RDS,” [Online]. Available: https://aws.amazon.com/pt/rds/.
[Acedido em 11 2018].
[21] S. Grid, “About Scale Grid,” [Online]. Available: https://scalegrid.io/about-
scalegrid.html. [Acedido em 05 2019].
[22] R. Paul, “Aggregation in Mongodb,” [Online]. Available:
https://medium.com/@paulrohan/aggregation-in-mongodb-8195c8624337. [Acedido
em 06 2019].
[23] W. Software, “Wit Software Costumers,” [Online]. Available: https://www.wit-
software.com/customers/. [Acedido em 09 2019].
[24] scrum.org, “What is scrum?,” Scrum.org, [Online]. Available:
https://www.scrum.org/resources/what-is-scrum. [Acedido em February 2019].
[25] “What is Scrum and Agile?,” [Online]. Available: https://reqtest.com/agile-blog/agile-
scrum-guide/. [Acedido em 15 04 2019].
[26] O. G. A. M. O. I. Mohamed A. Mohamed, “Relational vs. NoSQL Databases: A
Survey,” International Journal of Computer and Information Technology (ISSN: 2279
– 0764) Volume 03 – Issue 03, May 2014, 2014.

Service Monitoring for a Mobile Money System
92
[27] Zabbix, “Zabbix,” [Online]. Available: https://www.zabbix.com/. [Acedido em 10
2018].
[28] “Nagios,” Nagios, [Online]. Available: https://www.nagios.org/. [Acedido em 10
2018].
[29] Datadog, “Datadog - Cloud Monitoring Service,” [Online]. Available:
https://www.datadoghq.com/. [Acedido em 10 2018].
[30] Pingdom, “Pingdom - Website performance,” Pingdom, [Online]. Available:
https://www.pingdom.com/. [Acedido em 2018 10].
[31] Pingometer, “Pingometer - Website Up Time Monitor,” Pingometer, [Online].
Available: https://pingometer.com/. [Acedido em 10 2018].
[32] Uptrends, “Uptrends - Website Monitoring,” [Online]. Available:
https://www.uptrends.com/. [Acedido em 10 2018].
[33] W. Software, “Wit Software,” [Online]. Available: https://www.wit-software.com.
[Acedido em 11 2018].
[34] J.-P. Lang, “Redmine,” [Online]. Available: https://www.redmine.org/. [Acedido em
11 2018].
[35] Hibernator, “Hibernator ORM,” [Online]. Available: https://hibernate.org/orm/.
[Acedido em 11 2018].
[36] Sensenet, “Why JWT,” [Online]. Available:
https://community.sensenet.com/blog/2017/08/09/why-jwt. [Acedido em 08 2019].
[37] F. Gutierrez, Pro Spring Boot 2, 2nd Edition, Apress, 2018.
[38] J. Grandja, “Hello Spring Security with Boot,” 03 2020. [Online]. Available:
https://docs.spring.io/spring-
security/site/docs/4.2.13.RELEASE/guides/html5/helloworld-boot.html.
[39] A. University, “Angular Single Page Applications (SPA): What are the Benefits?,”
[Online]. Available: https://blog.angular-university.io/why-a-single-page-application-
what-are-the-benefits-what-is-a-spa/. [Acedido em 3 2020].

Service Monitoring for a Mobile Money System
93

Service Monitoring for a Mobile Money System
94
Appendices
Appendice A - Monitoring Platform User Stories
Three types of roles existent on the platform:
• Administrator – Responsible to manage the system. Can create new users, edit and block users. Create
new Monitoring Zones, add Users and setting/removing Zone Managers.
• Manager – User that is assigned to manage a certain zone. He can assign new users to the monitoring
zone.
• Normal – User can access the platform and manage the zones he is assigned to. A user can be assigned
to manage multiple zones.
User → Name to simplify all user roles (admin, manager, normal). When using the USER on a user story
it means that independent the role all users can access/perform that user story.
Collected Data = Application Data, Application Statistics, Operations Data/Performance Data, Services
Data
U.S 1 - As a user, I want to be able to authenticate on the platform
U.S 2 - As a user, I want to be able to log out of the platform
U.S 3 - As an Administrator, I want to be able to manage the Locations and Environments of the platform
(Multitenancy)
U.S 4 - As an Administrator, I want to be able to manage users (Normal, Manager, Support)
U.S 6 - As a Manager of a Location, I want to be able to remove users from the Location
U.S 7 - As a Manager of a Location, I want to be able to get a listing of all users with the zone assigned
U.S 8 - As a User, I want to be able to list all my assigned Locations
U.S 9 - As a User, I want to be able to change Monitoring and Environment Location
U.S 10 - As a User, I want to be able to edit my profile
U.S 12 - As a User, I want to be able to get summarized information about the current Location
12.1- I want to have displayed the services and prioritize the ones in the worst condition.
12.2 - I want to have displayed a time-line of recent alarms.
12.3 - I want to have displayed information about the APIs
12.4 - I want to be able to get alerted of triggered alarms, server/API degradation, warning on
the Collected Data.

Service Monitoring for a Mobile Money System
95
U.S 22 - As a User, I want to be able to get a list of all the anomalies.
U.S 23 - As a User, I want to be able to get the details of a specific anomaly.
U.S 30 - As a User, I want to be able to view Collected Data about the current selected Location.
(Operations/Performance Data and Services Data)
U.S 31 - As a User, I want to be able to do charts and graphics to compare information from the Collected
Data.
U.S 32 - As a User, I want to be able to get a list of all the alarms.
U.S 33 - As a User, I want to be notified when an alarm is triggered.
U.S 34 - As a User, I want to be able to get the details of an alarm.
U.S 36 - As a User, I want to be able to set threshold values for an Item (Server, API, Collected Data), if
these values are reached or surpassed there will trigger an alarm
U.S 37 - If an item as defined threshold values and those values are reached/surpassed, the users
responsible for that item should be notified and an alarm triggered.
U.S 38 - When a monitored (Operation or Services) starts degrading, there should be triggered an Alarm
and all the Users responsible for that item should be notified.
U.S 39 - As a User, I want to be able to export information on
U.S 40 - As a Manager, I want to be able to export information about an assigned Location
U.S 41 - As an Administrator, I want to be able to get information about all the Zones available and
assigned.
U.S 42 - As an Administrator, I want to be able to assign/create an environment to a Location
U.S 43 – As an Administrator, I want to be able to edit an existing environment
U.S 44 - As a User, when I select an enterprise Location there will be selected a default Environment (the
selected environment is the environment with the biggest default value)
U.S 45 – As a user, I want to be able to get a list of the existing environments for the current enterprise
zone.
U.S 46 – As a user, I want to be able to get the details of a certain environment.
U.S 47 – As a user, I want to be able to get all the existing Services, G2 Information, Alarms and Statistics
for the currently selected environment.
U.S 48 - In order to create an environment, it is required that the Environment passes a connectivity check

Service Monitoring for a Mobile Money System
96
U.S 49 - When an environment is created/added all the existing environment services should be retrieved
automatically.
U.S 51 - As a user, I want to list all the existing services (By the current selected zone and environment)
U.S 52 - As a user, I want to be able to get the status of each service
U.S 53 - As a user, I want to be able to get the details of each service
U.S 54 - As a user, I want to be able to get a list of all the available G2 Information on the current selected
Zone - Existing Applications, Gateways
U.S 55 - As a user, I want to get the details of each Operation/Performance Item
U.S 57 - As a user when I authenticate into the platform and don’t have any location selected, I want to
be presented a map with all the available locations.
U.S 58 - As a Manager or Admin, with permissions to manage a certain Location, I want to be able to
manage alarms for a certain service
58.1 - I want to be able to set threshold values for each service to trigger an alarm.
58.2 - I want to be able to be able to edit existing rules.
58.3 - I want to be able to be able to remove existing rules.
58.5 - Edit Informative fields (name, etc)
58.6 - Edit/Change the URL/Endpoint

Service Monitoring for a Mobile Money System
97
Appendice B - Monitoring Platform Prototypes

Service Monitoring for a Mobile Money System
98

Service Monitoring for a Mobile Money System
99

Service Monitoring for a Mobile Money System
100

Service Monitoring for a Mobile Money System
101

Service Monitoring for a Mobile Money System
102

Service Monitoring for a Mobile Money System
103
Appendice C – Entity Relationship Diagram


