Servicer Heterogeneity: Does Servicing Matter for Loan Cure Rates? Carolina K. Reid a , Carly Urban b , J. Michael Collins c a Assistant Professor, Department of City & Regional Planning, UC-Berkeley b Assistant Professor, Department of Agricultural Economcs & Economics, Montana State University c Associate Professor, Department of Consumer Science, University of Wisconsin-Madison Abstract Keywords: Mortgage Default and Foreclosure; Servicer Heterogeneity; Loan Cures 1. Introduction Until recently, the mortgage servicing industry - which collects loan payments on residen- tial mortgages and remits those payments to either the originating lender or an investor - has operated largely in the background, receiving little public, regulatory, or academic attention. However, in the midst of the foreclosure crisis, mortgage servicing has garnered significant attention for its role in processing mortgage delinquencies. As the interface between bor- rowers and investors, servicers are often the ones that make the decision to grant either a loan modification or start foreclosure proceedings. To deal with the onslaught of delinquent loans, many servicers opened special “loss mitigation” offices in hard hit communities, held ‘borrower outreach’ fairs to reach delinquent mortgage holders, and developed relationships with foreclosure counselors to help shepherd paperwork through the loan modification pro- cess. Yet the industry has also been besieged by scandals related to “robo-signing” and “dual tracking,” as well as recurrent stories of servicer mistakes and lack of capacity to undertake mortgage modifications. These complaints and illegal practices have led to significant legal actions, including the National Morgage Settlement among the five largest national loan servicers, the United States Department of Justice (DOJ), the United States Department of Housing and Urban Development (HUD), and the attorneys general of forty-nine states. On the regulatory front, the Bureau of Consumer Financial Protection (CFPB) enacted stricter servicing rules and exam procedures to ensure greater accountability and transparency in mortgage servicing. Preprint submitted to Elsevier May 5, 2014
Transcript
Servicer Heterogeneity: Does Servicing Matter for Loan Cure
Rates?
Carolina K. Reida, Carly Urbanb, J. Michael Collinsc
aAssistant Professor, Department of City & Regional Planning, UC-BerkeleybAssistant Professor, Department of Agricultural Economcs & Economics, Montana State University
cAssociate Professor, Department of Consumer Science, University of Wisconsin-Madison
Abstract
Keywords: Mortgage Default and Foreclosure; Servicer Heterogeneity; Loan Cures
1. Introduction
Until recently, the mortgage servicing industry - which collects loan payments on residen-
tial mortgages and remits those payments to either the originating lender or an investor - has
operated largely in the background, receiving little public, regulatory, or academic attention.
However, in the midst of the foreclosure crisis, mortgage servicing has garnered significant
attention for its role in processing mortgage delinquencies. As the interface between bor-
rowers and investors, servicers are often the ones that make the decision to grant either a
loan modification or start foreclosure proceedings. To deal with the onslaught of delinquent
loans, many servicers opened special “loss mitigation” offices in hard hit communities, held
‘borrower outreach’ fairs to reach delinquent mortgage holders, and developed relationships
with foreclosure counselors to help shepherd paperwork through the loan modification pro-
cess. Yet the industry has also been besieged by scandals related to “robo-signing” and “dual
tracking,” as well as recurrent stories of servicer mistakes and lack of capacity to undertake
mortgage modifications. These complaints and illegal practices have led to significant legal
actions, including the National Morgage Settlement among the five largest national loan
servicers, the United States Department of Justice (DOJ), the United States Department of
Housing and Urban Development (HUD), and the attorneys general of forty-nine states. On
the regulatory front, the Bureau of Consumer Financial Protection (CFPB) enacted stricter
servicing rules and exam procedures to ensure greater accountability and transparency in
mortgage servicing.
Preprint submitted to Elsevier May 5, 2014
Indeed, it has become increasingly apparent that mortgage servicing is a complicated
but critical component to ensuring the sustainability of home mortgage lending, and that
servicer practices matter in determining the likelihood that a delinquent borrower will be
able to save his home from foreclosure. When a borrower receives his first notice of default,
the path to cure or foreclosure can take months if not years, and there are multiple possible
resolutions. Recent research has suggested that there is significant heterogeneity among ser-
vicers in terms of the types of resolutions they offer to borrowers, and that this heterogeneity
has actually undermined the effectiveness of federal efforts to prevent foreclosures (Agarwal
et al., 2013). Servicer heterogeneity is particularly problematic from the perspective of the
borrower, since it means that similarly situated borrowers could experience very different
outcomes. However, borrowers have very little control over their loan after it is originated;
they cannot decide whether their loan will be securitized, who their servicer is (or will be,
in case of a mortgage servicing right transfer), or what contractual provisions govern the
servicing their loan (Levitin and Twomey, 2011).1
In this paper, we examine the impact of the pronounced variation in resolution practices
among servicers on loan cure rates, focusing specifically on the experiences of low-income and
minority borrowers. While differences in resolution practices among servicers are likely due
to a set of complex and inter-related factors, understanding which loss mitigation practices
are the most likely to contribute to loan cures, especially for historically underrepresented
borrowers, can help to inform policies that seek to develop consistent and effective loss
mitigation standards. Despite their importance, not much is known about whether and
how specific servicer-related factors affect the likelihood of a delinquent loan being cured.
Using a national level sample of subprime and Alt-A loans in private label securities, we
address three key questions. First, what is the impact of servicer heterogeneity on loan cures
and foreclosure sales, and do these impacts differ for African-American, Latino, and Asian
borrowers? Second, how do servicers differ from one another in the extent to which they are
1Further, Levitin and Twomey (2011) point out that as a result of imperfect information, information
asymmetries, and cognitive biases, homeowners do not correct the principal-agent problem in servicing by
demanding a discount in mortgage rates to compensate for the servicing externality. Homeowners are unlikely
to price in servicing risk in their borrowing.
2
willing to offer modifications, as well as the type of relief that they are willing to provide?
Third, to what extent do these differences in loan modification rates help to explain borrower
outcomes upon modification, such as redefault and eventual foreclosure?
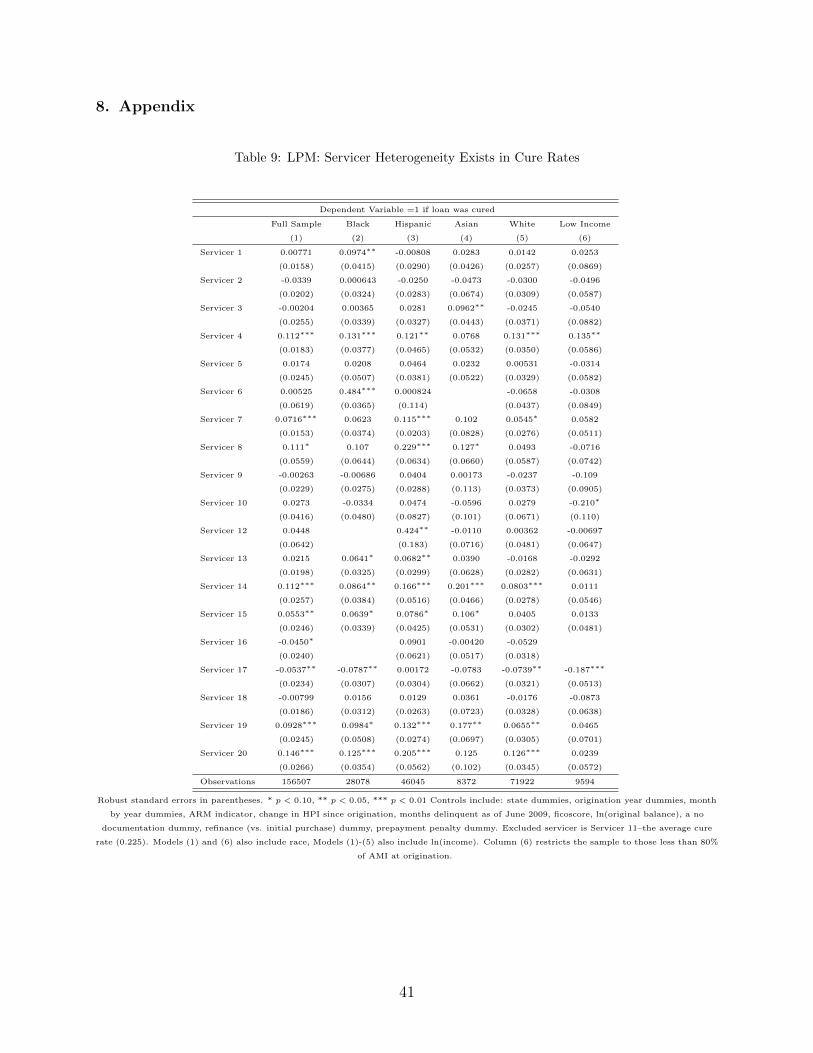
We find that servicers - and servicing practices - matter significantly for borrower out-
comes. There is vast heterogeneity across servicers; we find that the “Worst” 5 servicers
have cure rates of close to 10 percent, whereas the “Best” 5 have cure rates near 38 percent.
We also find that servicers vary greatly in their propensity to modify a loan. Servicers with
higher cure rates perform permanent modifications on almost 48 percent of their delinquent
loans, while servicers with the lowest cure rates only granted modifications to 2 percent of
delinquent borrowers over the course of our study period. These differences across servicers
are not explained by borrower, loan, or market characteristics, and underscore the impor-
tance of public policies that can help to increase both the uniformity and transparency of
servicing practices. We also find that there is a strong correlation between the granting of a
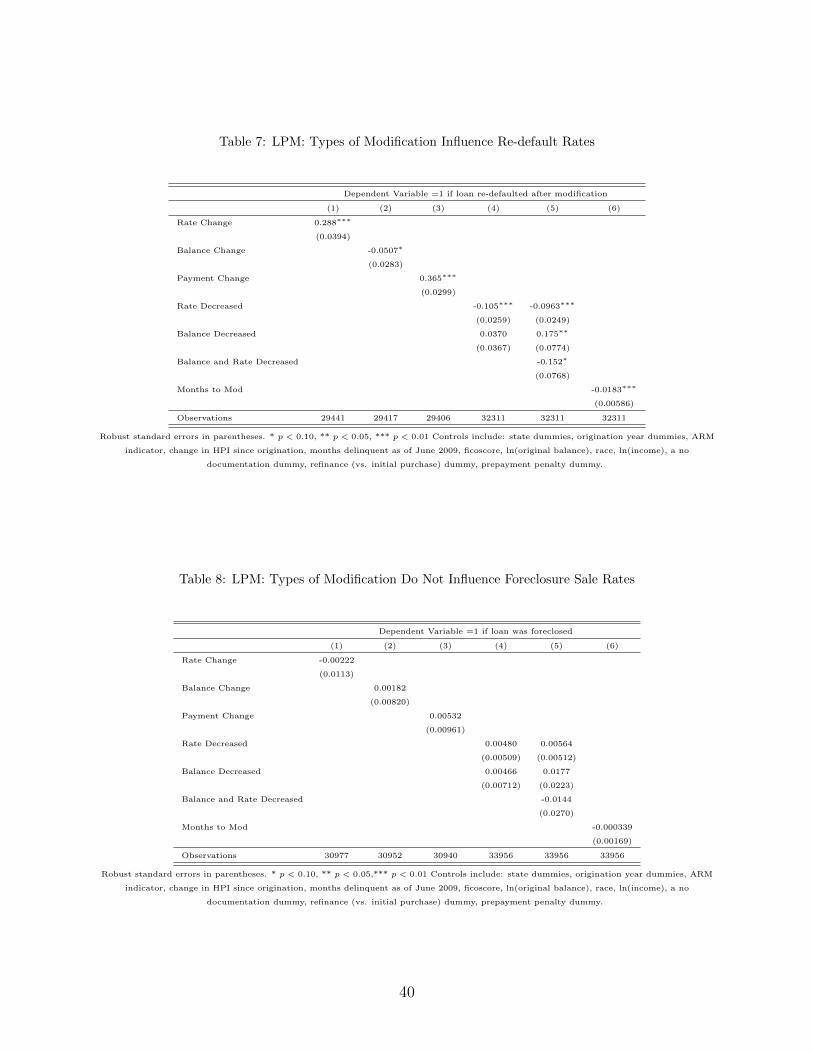
modification and loan cures; in particular, loan modifications that address borrowers’ afford-
ability constraints significantly reduce the likelihood of re-default one year after modification.
With respect to borrowers of color, while we find significant cross-servicer heterogeneity in
outcomes (as we do for the sample as a whole), it does not appear from this analysis that
within their own servicing portfolio, individual servicers treat African American, Latino or
Asian borrowers differently from their White counterparts.
The paper proceeds as follows. First, we provide some background on the development
of the mortgage servicing industry, as well as federal policy efforts to increase the incen-
tives and remove barriers for servicers to modify delinquent loans. Second, we review the
existing literature on servicer practices, and discuss some of the reasons why there may be
heterogeneity across servicers in their propensity to modify loans. In the third section, we
present information about our data and variables. Fourth, we turn to our empirical analysis,
providing a description of our model and findings to each of the three questions articulated
above. We conclude with a discussion and the implications of this research for public policy.
3
2. Development of the Mortgage Servicing Industry
Historically, mortgage servicing was handled by originating lenders, who kept loans in
their portfolios and who would work directly with borrowers who found themselves late on
their payments. The rise of securitization, however, has led to the creation of a mortgage
servicing industry. In this new regime, banks and investors, uninterested in managing the
day-to-day responsibilities of collecting loan payments and undertaking loss mitigation, del-
egate the servicing of their loans to other institutions that specialize in loan servicing, or
set up a separate servicing arm to manage loan processing. In addition, this specializa-
tion of mortgage lending has led to an asset class known as “mortgage servicing rights”
(MSR); banks and other institutions invest and trade in MSRs, much as they would other
investments. The credit rating agencies conduct periodic reviews of servicer quality, rating
servicers against their peers. For example, Moody’s assess servicers along five dimensions:
collections, loss mitigation, foreclosure timeline management, administration, and servicer
sustainability (Moody’s Investor Service, 2013).2
The returns to the MSR and the servicing business come from three primary sources
(Buttimer and Lin, 2005). First, servicers receive a fee for collecting, reporting and disbursing
loan payments: approximately 25 to 50 basis points per year on the outstanding balance of
the loan (Buttimer and Lin, 2005).3 Second, servicers collect interest on payments they
have collected from borrowers but not yet remitted to the investors in the mortgage backed
security (MBS)this “float” is possible since borrowers pay their mortgages throughout the
month, but servicers only need to make a single, monthly remittance to the MBS issuer.
Third, servicers can charge fees to the borrowers, for example, for late payments or for
providing detailed documentation (e.g. payment history or tax/escrow statements).
2However, as Levitin and Twomey (2011) argue, it is unclear whether the ratings system for mortgage
servicing is effective at disciplining servicer behavior.3Servicer fees are not explicitly negotiated; instead, the fees are related to the yield on the MBS, which
is negotiated between the seller of the MBS and the investor. The required yield on MBSs at any given time
is generally lower than the rates quoted for mortgages. The positive differential between the interest the
originator/servicer receives from the borrower (at origination) and the yield required to be remitted to the
investor (of the MBS) is the service fee. (Cochran et al., 2004)
4
Because the returns to any one loan are quite small, servicers’ profits generally come
from reducing costs and increasing the scale and efficiency of their operations (LaCour-
Little, 2000). In addition to the fixed costs associated with building the computing and
administrative infrastructure, monthly outlays include the administrative costs of collect-
ing and disbursing payments and undertaking loss mitigation when a loan goes delinquent.
Delinquent loans are particularly costly to the servicer. Typically, servicers must remit all
payments to the investor each month by the remittance date, even if the borrower has not
made the payment on their mortgage. As a result, if a borrower is delinquent, the servicer
often must make the payment on their behalf; the servicer is not reimbursed for these ad-
vances until the loan has gone through foreclosure (Buttimer and Lin, 2005). During the
recent crisis, the increase in administrative work load and the time consuming nature of
collections activity, workouts, loan modifications, default and foreclosure processing, and
real estate-owned (REO) management also increased servicer costs (Cochran and Shelnutt,
2014). As a result, the standard fees paid for loss mitigation on a nonperforming loan may
be inadequate to cover the total costs associated with such an effort (Ding, 2013). Moreover,
as Adam Levitin and Tara Twomey (2011) discuss in an excellent review article of the mort-
conflicts between them and the MBS investors, to the detriment of delinquent borrowers who
need a loan modification to prevent foreclosure.
Recognizing that voluntary efforts to expand loan modifications were unsuccessful at
stemming the wave of foreclosures,4 federal policy-makers have initiated a parade of programs
designed to overcome servicer-related barriers to loan modification, with modest success.
In February 2009, the Treasury Department rolled out the federal government’s landmark
foreclosure prevention initiative, the “Making Home Affordable” (MHA) program. As part of
MHA, the “Home Affordable Modification Program” or HAMP, sought to overcome barriers
to loan modification by encouraging servicers to bring loan payments in line with borrower
incomes, with a goal of reaching 3 to 4 million distressed borrowers (GAO, 2014). Under
4Alan White, for example, showed that the majority of voluntary modifications at the start of the crisis
typically increased a borrower’s monthly payment, as well as the principal owed on the loan (White, 2009a,b).
5
the program, eligible borrowers work with the servicer to reduce their monthly payment
to 38 percent of their income,5 and then HAMP provides a government subsidy to further
reduce the payment to 31 percent. Servicers also receive an up-front fee of $1,000 for each
modification, plus “pay for success” fees on performing modified loans of $1,000 per year for
up to 5 years, thus providing servicers a financial incentive to initiate modifications that help
keep borrowers in their homes.6 To help servicers make a determination if a modification
would help to protect the investors’ interests in the loan, HAMP uses a standardized net
present value (NPV) model to compare expected cash flows from a modified loan to the same
loan with no modification, using certain assumptions.
The federal roll out of the HAMP program, while not reaching its potential, did help
to increase the scale of loan modifications, and perhaps more importantly, provided clear
guidelines for modifications and oversight of the servicing industry. As of November 2013,
1.3 million borrowers had received modifications under the HAMP program, well below
Treasury’s initial estimate of 3 million to 4 million (GAO, 2014). However, the program has
led to significant reductions in payments–an average of $544 each month, or approximately 40
percent of their pre-modification payment–for borrowers who obtained relief (US Department
of the Treasury, 2014). There is also emerging evidence that HAMP modifications have led
to higher loan cure rates for deliquent borrowers; in a study of borrowers in New York City,
Voicu and his colleagues (Voicu et al., 2012) find that HAMP loans are much more effective
at preventing default than proprietary loan modifications, after controlling for a wide range
of variables. While not conclusive, these results suggest that the incentives within the HAMP
program as well as the modification guidelines have been successful at getting servicers to
modify loans and to offer modifications that lead to real reductions in loan costs.
In addition to the HAMP program, there have been a number of legal actions taken
against servicers that have also required that they undertake modifications and provide relief
for delinquent and underwater homeowners. In February 2012, 49 state attorneys general and
5Borrowers are eligible for a HAMP modification on first-lien loans for owner-occupied properties with
an unpaid principal balance of less than $729,750, originated on or before January 1, 2009.6HAMP also provides a bonus incentive of $1,500 to lender/investors and $500 to servicers for modifica-
tions made while a borrower is still current on mortgage payments but at imminent risk of default.
6
the federal government announced a historic joint state-federal settlement with the country’s
five largest mortgage servicers,7 requiring that these servicers provide $25 billion in relief in
the forms of first and second lien principal reductions, refinance options for underwater
borrowers, direct payments to borrowers, as well as financial support for state foreclosure
prevention efforts. The settlment also implemented reforms to servicing standards, including
requiring that servicers provide a single point of contact, adequate staffing levels and training,
better communication with borrowers, and appropriate standards for executing documents in
foreclosure cases. In 2013, 15 financial institutions settled with banking regulators, agreeing
to make payments that totaled $3.9 billion to more than four million homeowners. However,
concerns over abuses in mortgage servicing practices have continued, resulting in individual
settlements between mortgage servicing companies and federal and state regulatory agencies.
Recently, there have also been concerns about the rapid growth of the non-bank servicer
industry. The mortgage servicing industry has long been dominated by the large financial
depository institutions. In 2013, the top 3 mortgage servicers were Wells Fargo, Chase, and
Bank of America, together representing over a third of the market (37 percent). However,
the most rapid growth in servicing has occurred among non-bank servicers such as Ocwen
and Nationstar Mortgage. As of 2013, five of the top 10 mortgage servicing firms were non-
banks (accounting for 15 percent of the total mortgage servicing market) (Goodman and
Lee, March 31, 2014). This shift is in large part due to banks selling the servicing rights on
their distressed mortgages, which are more costly to service and which present reputational
risks for the banks. In addition, Basel IIIa set of banking reforms designed to strengthen
the safety and soundness of the financial marketsestablishes new capital requirements for
MSR and will likely increase the cost of holding MSR assets (Goodman and Lee, March 31,
2014). While many non-bank servicers specialize in working with distressed borrowers and
have been more willing to undertake loan renegotiations, they have come under signfiicant
regulatory scrutiny in recent years for growing too quickly and for increasing reports of poor
7The five banks signing onto the settlement are Ally/GMAC, Bank of America, Citi, JPMorgan Chase,
and Wells Fargo. In addition, Bank of America, JP Morgan Chase, and Wells Fargo signed a separate
settlement with the California Attorney General to provide an additional $12 billion in relief to California
homeowners
7
servicing practices.
3. Literature Review: Servicer Heterogeneity in Loan Renegotiations
Until recently, the issue of mortgage servicing and modifications has received little atten-
tion in the scholarly literature. However, the role of mortgage servicing and loan modification
practices have emerged as central to the debate about how to keep borrowers in their homes
and prevent foreclosure and their negative impacts on borrowers, communities, and the over-
all U.S. economy. One critical finding is that there is significant heterogeneity across servicers
in their propensity to modify loans. Agarwal et al. (2013), for example, document that fol-
lowing the rollout of HAMP, a few large servicers responded at half the rate of others, and
argue that the effect of HAMP was muted by these nonresponsive servicers. In fact, they
find that HAMP would have led to approximately 70 percent more permanent modifications
if all the loans by less active servicers were renegotiated at the same rate as their more
active counterparts. They also find that there is similar heterogeneity in the rate of private
modifications offered across servicing entities.
Other studies examining loan modification patterns similarly point to the importance
of servicer heterogeneity in predicting outcomes. In an earlier study examining servicer
behavior pre-HAMP, Agarwal et al. (2010, 2011) find that lenders and servicers pursue their
own individual loss mitigation practices, and that servicer fixed effects explain at least as
much variation in modification terms as did borrower characteristics. In a study of loan
modifications in five Mid-Atlantic states and Washington, DC, Collins and Herbert (Collins
and Herbert, 2009) also find evidence for servicer heterogeneity. In their analysis, 5 servicers
account for 58 percent of all the modifications in Maryland in their sample, despite only
representing 28 percent of 60-day delinquencies.
The paper most relevant to our research was conducted by Lei Ding (2013), who explores
servicer heterogeneity in loan modifications, using the CTS data, including merging those
data with HMDA. Ding examines the loan modification activities during the period from
January 2010 to May 2011 in two different types of markets: four Rustbelt states (Michi-
gan, Indiana, Illinois, and Ohio) and four sand states (California, Arizona, Florida, and
Nevada). He finds that servicers adopted significantly different loss mitigation approaches.
8
For example, four large servicers had a higher propensity to modify troubled loans than did
smaller servicers, whereas three other large servicers were less likely than small servicers to
do so, even after controlling for a variety of borrower and loan characteristics. He finds that
compared with those served by small servicers (the reference group), the relative odds of re-
ceiving a loan modification conditional on 60-day delinquency vary significantly by servicer:
to provide just one example, the relative odds of loan modification were 436% higher for
troubled loans in the hands of the “best” servicer, whereas the odds of modification were
60% lower for those serviced by the worst.
This strongly suggests that servicer loss mitigation choices are driven by institutional
factors, above and beyond underlying borrower and loan characteristics. The literature has
identified several institutional factors that may influence servicer behavior, including servicer
incentives and capacity, mortgage securitization and the associated “pooling and servicing
agreements”, information asymmetries, and lack of borrower contact (Adelino et al., 2009;
Cordell et al., 2010; Eggert, 2007; Gelpern and Levitin, 2009; Levitin and Twomey, 2011;
Pikorski et al., 2009).
The first question addressed in the literature is whether investor pooling and servicing
agreements, or PSAs, limit a servicers’ ability to undertake a loan modification. PSAs are
heterogeneous contracts, typically varying by securitization sponsor, yet in general PSAs
require servicers to manage the loans held by the trust as if for their own account and
maximize the returns to the investor. A loan modification may be more difficult for a
servicer to undertake if they need to consider all the different investor interests in a RMBS,
especially when there are different tranches of investors with different interests. However,
the extent to which securitization influences modification is still unclear. Adelino, Gerardi,
and Willen (2009) found no differences in loan modifications between loans held in portfolio
and loans in private label securities, while Piskorski, Seru, and Vig (2009) found just the
opposite. Agarwal and coauthors (2011) and Been, Weselcouch, Voicu and Murff (2013) have
subsequently confirmed Pikorski et al.’s (2009) findings that loans in private-label securities
were the least likely to be securitized, though differences in data and methodology across
the studies suggest that the debate over the role of securitization in loan renegotiations is
9
likely to be ongoing.8
In addition to potential barriers associated with their obligations under MBS pooling and
servicing agreements, a second factor influencing servicer behavior is its compensation struc-
ture and source of liquidity. As mentioned earlier, loan modifications are costly: they are
both labor and time intensive and cannot be easily automated. And unlike the costs associ-
ated with foreclosure, neither the labor nor the overhead costs associated with modifications
are billable back to investors.9 The economics of the modification/foreclosure decision are
thus highly dependent upon the cost of a modification and whether and when a modified
loan redefaults. If the modified loan redefaults before the servicer has recouped the cost of
the modification, then the modification is a money-loser for the servicer. Estimates for the
cost of processing a loan modification range from $500 to over $1000 per modification. (Lev-
itin and Twomey, 2011) Non-bank servicers may also face a different cost-benefit calculus
than servicers affiliated with despository institutions. For example, Ocwen–the largest non-
bank servicer–began aggressively modifying defaulted loans in 2008, including write-downs
of principal, in part due to the liquidity squeeze placed on it by servicing advances combined
with tightened credit markets (Levitin and Twomey, 2011). By modifying the loans and
bringing them out of delinquency, Ocwen was able to reduce its obligation to make servicing
advances, which reduced the strains on its liquidity.
A third explanation for servicer heterogeneity may lie in individual servicers institutional
response to the foreclosure crisis and rising delinquencies. One option for a servicer is to
implement a highly automated process of default management, which allows the servicer
firm to keep the costs of managing delinquencies low but may not best serve the interests
of the borrower. The practice of ‘robo-signing in which servicers employed individuals to
8The 2009 amendments to the Truth in Lending Act provide a safe harbor for servicers that modify a
distressed loan, as long as that modification maximizes the loan’s net present value. In addition, it specifies
that the duty to maximize the NPV of the mortgage is a duty owed to all investors, rather than to any
one investor in particular, protecting servicers from competiting obligations to different tranches of RMBS
investors (Levitin and Twomey, 2011).9As Levitin and Twomey (2011) points out, the way servicers are paid can also create a moral hazard,
since servicers may not have the same interests as the investors in the MBS.
10
sign foreclosure affidavits without reviewing the documents or following established notary
practices and legal requirementsis emblematic of this push for automation and efficiency
(Levitin and Twomey, 2011). In contrast, other servicers created special divisions to provide
a more intensive, ‘hands on approach to servicing delinquent loans. These loss mitigation
units work with distressed borrowers, often in concert with housing counselors or foreclosure
prevention specialists, to pursue a loan modification. Servicers often describe this process
as more “art than science, since the outcome of the renegotiation is often in large part
shaped by the borrowers ability and willingness to repay the loan; ex ante, it is difficult
to know whether or not a modification will actually lead to a cure, or whether it merely
postpones delinquency. In addition, a significant percentage of loans ‘self-cure, meaning that
the servicer must also make a judgment as to whether the modification is really necessary
for any individual borrower. The extent to which the servicer is willing to invest in staff
and time to perfect this “art” may lead to different determinations about the benefits of
offering a borrower a modification. In addition, the “science” of the loss mitigation process
also matters; differences in modification rates may arise if servicers use different assumptions
in calculating the NPV of a loan. While the Treasury department released an NPV model
as part of its efforts to streamline modifications, many servicers rely on internal models that
may include different assumptions about the anticipated value of properties in six months
time, the relative costs of renting versus owning in a particular market (which may influence
the likelihood that a borrower decides to strategically default), and the servicers ability to
manage and resell REO properties.
All of these factors have material effects for a borrower who is seeking to obtain a loan
modification and stay in their home. However, borrowers have very little control over their
loan after it is originated; they cannot decide whether their loan will be securitized, who their
servicer is (or will be, in case of a mortgage servicing right transfer), or what contractual
provisions govern the servicing their loan (Levitin and Twomey, 2011). Indeed, consumer
rights regarding loss mitigation are fairly narrow, and the process by which loss mitigation
decisions are made are often incredibly opaque not only to the consumer, but also to the
housing counselors working with borrowers to resolve their delinquencies. A critical question
is whether this servicer heterogeneity is leading to different outcomes for borrowers, and par-
11
ticularly, for delinquent low-income and minority homeowners. The lack of public data on
individual loan modifications, coupled with the fact that most loan performance datasets do
not include any information about the borrower with the exception of a FICO score, means
that we still have a limited understanding of whether loan modifications help to prevent
foreclosures, and for whom.10 The handful of studies that do exist on loan modifications
by borrower type have generally found no differences in the number or nature of loan mod-
ifications by race or ethnicity (Ambrose and Capone, 1996; Been et al., 2013; Chan et al.,
2014; Collins and Reid, 2010; Mayer and Piven, 2012). A subsequent study conducted by
the U.S. General Accounting Office using non-public HAMP data on four servicers did find
some differences in the incidence of HAMP modifications across fair lending populations, but
these differences were in large part due to differences in servicers’ determination of borrower
eligibility related to their debt-to-income ratio and the completeness of their modification
request (GAO, 2014).
However, very few of these studies focus on loan cures, and more specifically, on the role
that servicers play in determining borrower outcomes. In this paper, we seek to address
this gap by extending Ding’s (2013) analysis of the CTS data and examine whether or not
differences in servicer practices lead to different rates of loan cures (not just modifications),
as well as the servicing practices that might be able to explain differences in cure rates. In
addition, we focus specifically on the experience of low-income and minority homebuyers.
While differences in resolution practices among servicers are likely due to a set of complex
and inter-related factors, understanding which loss mitigation practices are the most likely
to contribute to loan cures, especially for historically underrepresented borrowers, can help
to inform policies that seek to develop consistent and effective loss mitigation standards.
10In early 2011, Treasury released the first loan level data on the HAMP program. However, 79 percent
of active permanent modification records and 82 percent of trial modification records in the data file lack
information identifying the race or ethnicity of the borrower. A study by the Urban Institute, cited below,
has nevertheless used these data to identify racial differences in modification outcomes.
12
4. Data Description
This paper uses data downloaded from Corporate Trust Services (CTS), a service of Wells
Fargo Bank, N.A. that provides information on a variety of investment vehicles administered
by the bank.11 The CTS data cover privately securitized, subprime and Alt-A mortgages for
which Wells Fargo serves as the trustee, and includes mortgages with different interest rate
structures, different purposes, different property types, and different lien statuses (Quercia
and Ding, 2009; White, 2009b). The database includes loans originated as early as the 1980s
and tracks performance until the loan is paid off or foreclosed upon, and includes over 4
million individual loans. Each monthly loan record contains the borrower’s FICO credit
score, loan-to-value (LTV) ratio at origination, the last 12 month’s delinquency history, the
property zip code, the type of loan, and the original and current balance of the loan.
In addition to detailed information on loan terms and performance, the CTS also includes
two important fields that make it relevant to our research question. First, the CTS reports
include a modification indicator, which represents all formal and permanent loan modifi-
cations and equals one for every period after the loan is modified. The reports also have
information about the loan balance, mortgage payment, and interest rate, both before and
after modification, which enables us to identify whether total mortgage debt, interest rate,
or mortgage payments are changed for individual homeowners. We create eight additional
variables to capture the type of modification. First, we determine the percentage change
in the interest rate (Rate Change), loan balance (Balance Change), and monthly payment
(Payment Change) before and after modification. Second, we construct dummy variables,
Rate Decreased and Balance Decreased that equal one if the rate decreased or the balance
decreased, respectively. We further provide an interaction of the two variables to capture
loans whose balance and interest rate fell after modification, Balance and Rate Decreased.
Third, we construct a variable, months to mod that equals the number of months between
the last 60-day delinquency and the modification. Finally, we determine if any of the loans
have undergone a second modification over the period of observation.
Second, the CTS data include loans from over 100 servicers across the country, allowing
11These investor report files are available at www.ctslink.com.