Serving People Engineering - A response to Aid challenges Sérgio Guedes Silva Dissertation Project / Final Thesis Supervisor's name in WFP: Mr. Temmy Tanubrata Supervisor’s name in FEUP: Prof. Alcibíades Guedes Faculty of Engineering of the University of Porto MSc in Mechanical Engineering, Specialization in Production Management Rome, Italy ‐ July, 2008 United Nations
Transcript
Serving People
Engineering - A response to Aid challenges
Sérgio Guedes Silva
Dissertation Project / Final Thesis
Supervisor's name in WFP: Mr. Temmy Tanubrata
Supervisor’s name in FEUP: Prof. Alcibíades Guedes
Faculty of Engineering of the University of Porto
MSc in Mechanical Engineering,
Specialization in Production Management
Rome, Italy ‐ July, 2008
UUnniitteedd NNaattiioonnss
SCOP
Master Dissertation Project i i FEUP/UN/WFP/LDU
SCOP
Master Dissertation Project i i i FEUP/UN/WFP/LDU
“Ita Hamutuk”1
1“We are Together” in East‐Timor dialect
SCOP
Master Dissertation Project i v FEUP/UN/WFP/LDU
SCOP
Master Dissertation Project v FEUP/UN/WFP/LDU
Abstract
The project described in this document is a collaboration in the context of concluding my MSc in Mechanical Engineering, specialization in Production Management, by FEUP (Faculty of Engineering of the University of Porto).
The basis for my involvement in this project starts with my desire to put the knowledge acquired during my course at FEUP into practice for the development of humanitarian projects.
This project focuses on the optimization of the World Food Programme’s Supply Chain. WFP is a United Nations agency, with Head Quarters based in Rome. I was involved in the project as a intern of the Logistics Development Unit (LDU) – part of the Logistics Division – for a period of four months.
The study is a practical answer to a challenge within the Humanitarian sector and illustrates how an Engineer can add value to the context of this sector. Being an engineer, you need to be able to balance science and practice, and by doing this adding value to processes and/or services.
WFP is currently dealing with perhaps one of the biggest challenges so far: The UN reform. The UN reform results in a new “market” for WFP – providing logistics services to other humanitarian actors. In combination with increasing prices for food and fuel and the increase of natural catastrophes, WFP has challenging times ahead.
However, WFP has the strength, the will and the capacity to answer to this challenge.
During this study, I met people that are involved beyond their technical knowledge; people that are genuinely concerned about and committed to what they are doing. People who at the end of the day think: “the work that I did today ads value/helps the people that we have to feed – the beneficiaries2”. This attitude, combined with technical capacity and a strong team spirit are the formula to achieve the target.
The LDU, as a team, is focused on this change. The unit is responsible for triggering and supporting a new organizational culture (thinking and acting), characterized by professionalism and team spirit. The Supply Chain Optimization Project (SCOP) is part of this change process. Improving the Supply Chain means improving WFP. “We Deliver” is WFP Logistics’ slogan and the quality of the delivery influences the image of the organization.
This study presents the first steps in a new improvement phase in WFP’s Supply Chain.
Within the scope of my involvement in the project, the basis to start a new approach was set, a model for performance measurement was defined based on correct data instead of on assumptions and an analysis to find the real roots-causes of the problems was initiated. Beyond that, a selection of new ideas was presented. Some of these ideas were in the meantime approved and a start was made.
The present study focused on the upstream processes for international cash purchases and distribution. 2 Temmy Tanubrata in a comment about the personal work
SCOP
Master Dissertation Project vi FEUP/UN/WFP/LDU
SCOP
Master Dissertation Project vi i
FEUP/UN/WFP/LDU
Acknowledgements
I wish to specially thank all my friends with whom I've shared so many experiences together, and have given me the strength to achieve this point.
To GASPorto – Action Social Group from Porto and the amazing people that I found there during this last years, that taught me to be more useful and develop the correct human principals.
To Professor Joao Falcao e Cunha, the mentor of this idea. More than his support as a professor, it is the human support that I would like to highlight. Following the same line, thanks to Prof Barbedo Magalhaes, Eng Antonio Guterres, Professor Alcibiades Guedes, and Eng Ramiro Lopes da Silva for their help in the concretisation of this project.
Thanks to the whole LDU team, Bernard, Selamawit, Dima, Hetty, Emmanuel, Stuart, Madeline, Andreas and specially to Temmy, advisor, colleague and exceptional friend. During the four months that I worked closely with these people, I learned a lot.
To finalize, thank to all my friends that help me in the revision of this thesis, special with the English: Dima, Hetty, Federica, Francis and Kush.
SCOP
Master Dissertation Project vi i i
FEUP/UN/WFP/LDU
SCOP
Master Dissertation Project i x FEUP/UN/WFP/LDU
Contents
Abstract ........................................................................................ v
Acknowledgements .................................................................. vii
Contents ...................................................................................... ix
Appendice K - The new proposal form ..................................................................... 139
SCOP
Master Dissertation Project 1 FEUP/UN/WFP/LDU
SCOP
Master Dissertation Project 2 FEUP/UN/WFP/LDU
1. Introduction
1.1. Organization Involvement
Faculty of Engineering of the University of Porto The Faculdade de Engenharia da Universidade do Porto (FEUP) is the engineering faculty of the University of Porto, in Porto, Portugal. With its origins in the 18th century, the institution became known as Faculdade de Engenharia in 1926. It awards degrees from the licentiate to doctorate, in several engineering fields, ranging from mechanical engineering to chemical engineering.
The organization is well-know in Portuguese industry and society, and is recognized in international science and engineering. In the last years is being distinguished by the great improvement and by the integration in the Bolonha Process.
Departaments
The Faculty is organized by departments, which have some autonomy and can be divided in sections, if their dimension or scientific aims recommend it.
o Chemical Engineering;
o Civil Engineering;
o Electrical and Computer Engineering;
o Informatics Engineering;
o Mechanical Engineering;
o Industrial Engineering and Management;
o Metallurgical and Materials Engineering;
o Mining Engineering;
o Physics Engineering.
Figure 1 – New facilities in FEUP
Figure 2 – Exhibition with projects Developed by FEUP
SCOP
Master Dissertation Project 3 FEUP/UN/WFP/LDU
United Nations – UN
The United Nations (UN) is an international organization whose stated aims are to facilitate cooperation in international law, international security, economic development, social progress and human rights issues. The UN was founded in 1945 to replace the League of Nations, to stop wars between nations and to provide a platform for dialogue.
There are now 192 member states, including almost every recognized independent state. From its headquarters on international territory within New York City, the UN and its specialized agencies decide on substantive and administrative issues in regular meetings held throughout the year.
The organization is divided into administrative bodies, primarily:
o The General Assembly (the main deliberative assembly);
o The Security Council (decides certain resolutions for peace and security);
o The Economic and Social Council (assists in promoting international economic and social cooperation and development);
o The Secretariat (provides studies, information, and facilities needed by the UN);
o The International Court of Justice (the primary judicial organ).
Additional bodies deal with the governance of all other UN System agencies, such as the World Health Organization (WHO), United Nations Children's Fund (UNICEF) and World Food Programme (WFP). The UN's most visible public figure is the Secretary-General, currently Ban Ki-moon of South Korea.
Emergency assistance
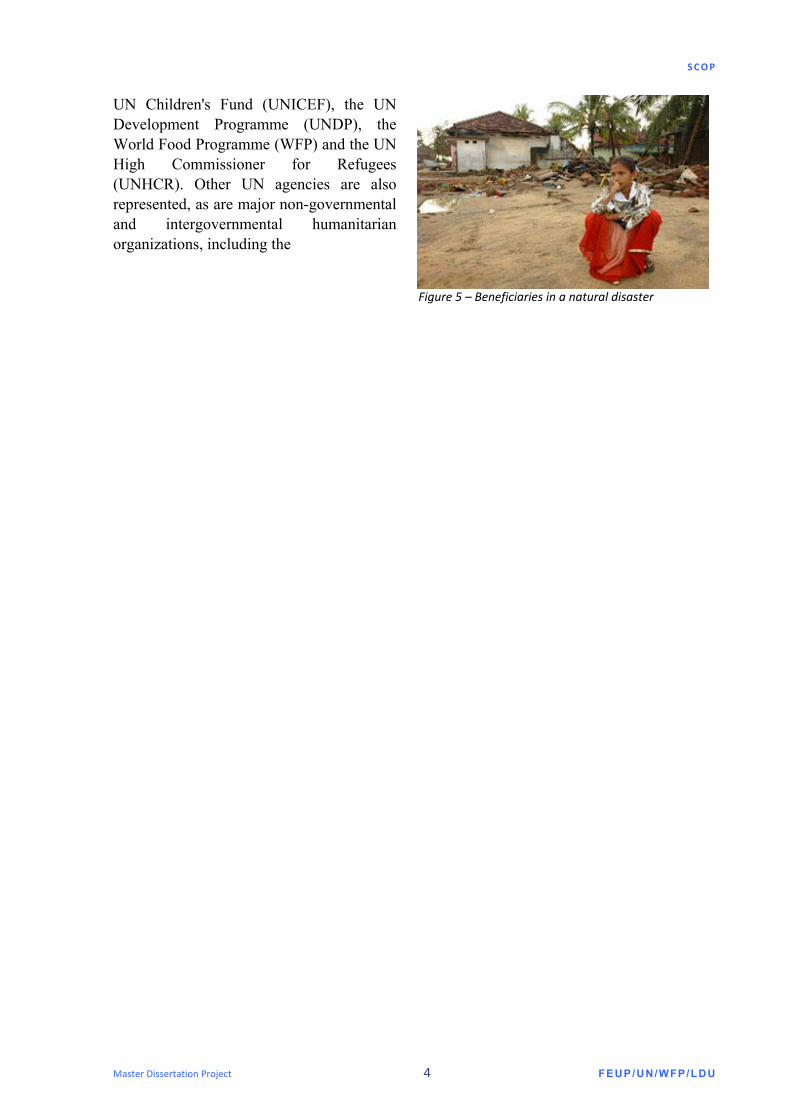
In the face of disaster, the UN family of organizations supplies food, shelter, medicines and logistical support to the victims — most of them children, women and the elderly.
Providing humanitarian assistance requires that the United Nations overcome major logistical and security constraints in the field.
The UN coordinates its response to humanitarian crises through a committee of all the key humanitarian bodies, chaired by the UN Emergency Relief Coordinator. Members include the
Figure 3 – UN Logo
Figure 4 – UN New York Head
SCOP
Master Dissertation Project 4 FEUP/UN/WFP/LDU
UN Children's Fund (UNICEF), the UN Development Programme (UNDP), the World Food Programme (WFP) and the UN High Commissioner for Refugees (UNHCR). Other UN agencies are also represented, as are major non-governmental and intergovernmental humanitarian organizations, including the
Figure 5 – Beneficiaries in a natural disaster
SCOP
Master Dissertation Project 5 FEUP/UN/WFP/LDU
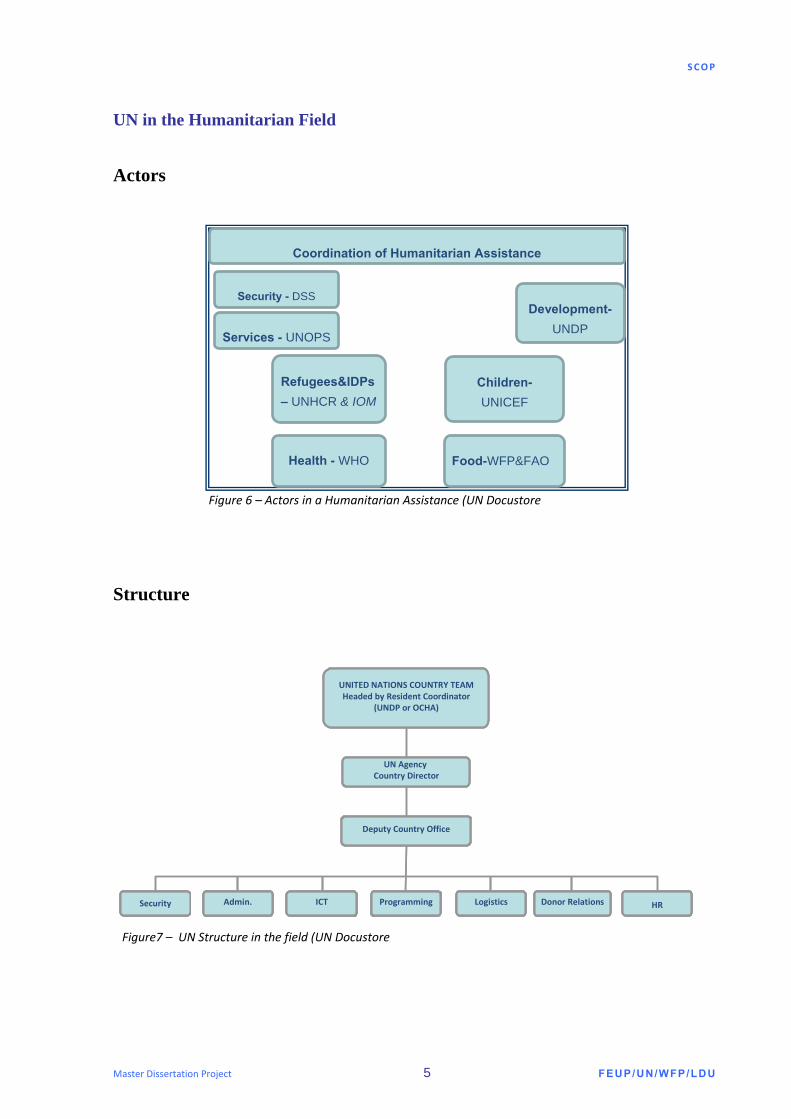
UN in the Humanitarian Field Actors
Structure
Refugees&IDPs – UNHCR & IOM
Children-UNICEF
Food-WFP&FAO Health - WHO
Development-UNDP
Coordination of Humanitarian Assistance
Security - DSS
Services - UNOPS
Figure 6 – Actors in a Humanitarian Assistance (UN Docustore
UNITED NATIONS COUNTRY TEAMHeaded by Resident Coordinator
(UNDP or OCHA)
Figure7 – UN Structure in the field (UN Docustore
SCOP
Master Dissertation Project 6 FEUP/UN/WFP/LDU
Interaction with others players
Integrated Missions
United Nations
Red Cross Movement
NGOs
Armed Forces
United Nations
Red Cross Movement
NGOs
Armed Forces
Figure 8 – Interaction with other players
DEPUTY SRSG FORINTERIM CIVIL
ADMINISTRATION(UN)
DEPUTY SRSG FOR HUMANITARIAN
AFFAIRS(UNHCR)
DEPUTY SRSG FORINSTITUTION BUILDING
(OSCE)
DEPUTY SRSG FORRECONSTRUCTION
(EU)
MILITARYLIAISONOFFICE
LEGALADVISOR
CHIEFOF STAFFHQ STAFF
POLITICALOFFICE
SPOKESMAN’SOFFICE
SPECIAL REPRESENTATIVE OF THE SECRETARY-GENERAL (SRS)
UNCIVPOL KFOR
Figure 9 – UN Structure in Integrated Missions(UN Docustore source)
SCOP
Master Dissertation Project 7 FEUP/UN/WFP/LDU
World Food Programme – WFP
The World Food Programme (WFP) is the United Nations’s food aid agency and the world's front-line agency in the fight against hunger. Established in 1961 as a three-year experimental programme by the United Nations General Assembly and the Food and Agriculture Organization (FAO), WFP obtained continuing status in December 1965 “for as
long as multilateral food aid is found feasible and desirable”.
In 2004, WFP worked in 80 countries with the host governments, United Nations agencies, international organizations and non-governmental organizations (NGOs) to provide food to 113 million people.
WFP’s mission statement is to use food aid to help eradicate hunger and poverty. This means giving food to people whose food consumption is inadequate to help them survive, grow or take advantage of development opportunities. For the complete text of WFP’s mission statement see: http://www.wfp.org/policies/Introduction/mission
WFP is governed by the 36 member states that comprise its Executive Board and managed by an Executive Director who is jointly appointed by the United Nations Secretary-General and the Director General of FAO.
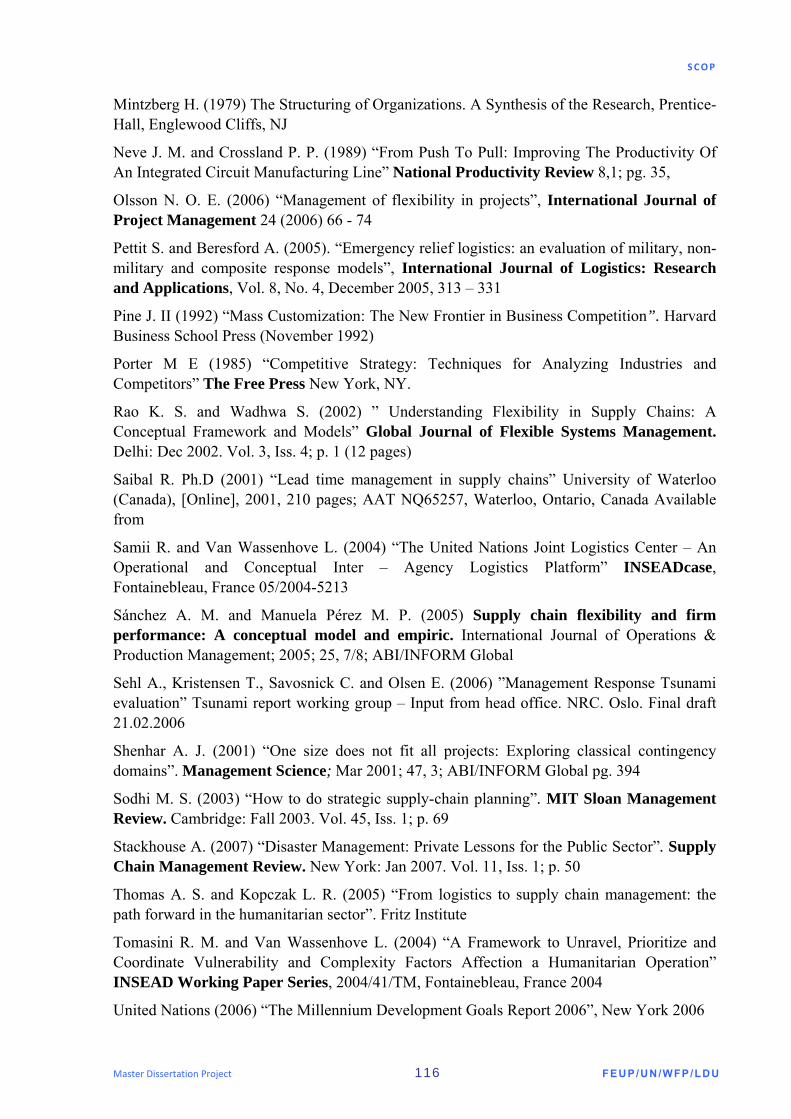
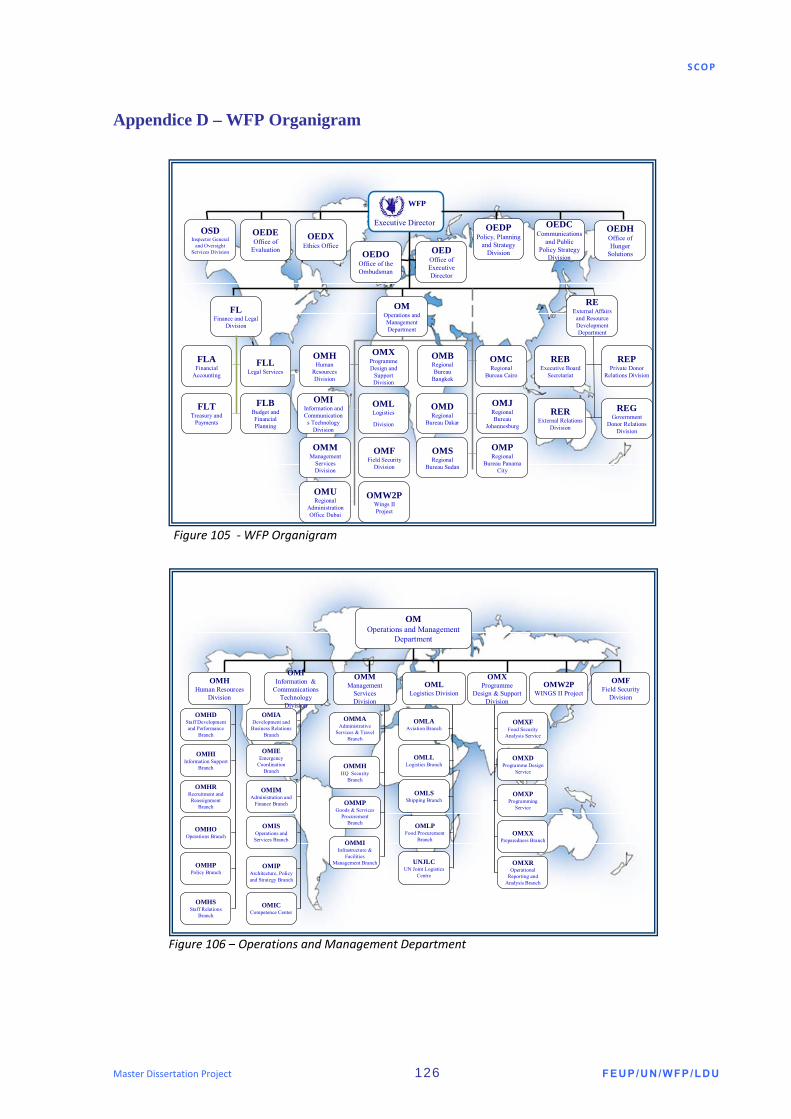
WFP is made up of 80 operational country offices, 6 regional bureaux, 9 United Nations/Donor liaison offices, 5 support offices and its headquarters in Rome. See Annex 1 for the WFP organigram.
What are WFP’s goals?
WFP’s overall goal is to contribute to meeting the Millennium Development Goals (MDGs)3 through its food-assisted interventions targeting poor and hungry people. WFP has five strategic objectives linked to the MDGs.
These are to: o save lives in crisis situations; o protect livelihoods in crisis situations and enhance resilience to shocks;
3 The Millennium Development Goals were signed at the United Nations in 2000 and include: reducing
poverty, hunger, illiteracy and discrimination against women, combating HIV/AIDS and other diseases,
improving maternal and child health, increasing access to safe drinking water and saving the environment from
further degradation, by the year 2015.
Figure 10 – WFP Logo
SCOP
Master Dissertation Project 8 FEUP/UN/WFP/LDU
o support the improved nutrition and health status of children, mothers and other vulnerable groups;
o support access to education and reduce gender disparity in access to education and skills training;
o help governments establish and manage national food-assistance programmes.
Who are WFP’s beneficiaries?
WFP’s beneficiaries are people who are not eating adequate food to lead a healthy and active life.
They include:
o people cut off from access to their normal sources of food because of conflict or a natural disaster, such as an earthquake or flood or drought;
o refugees or displaced people;
o particular groups within a community whose diet is found to be inadequate and affecting their growth or development: pregnant and lactating women; children; adolescents; people suffering from HIV/AIDS; or elderly people;
o people who spend a disproportionate amount of time and/or income growing, collecting or purchasing food and for whom food aid provides a means to invest in capital assets, which will reduce their future vulnerability to food insecurity or shocks.
Overview of WFP's programmes
WFP's programmes fall into four main categories:
o emergency operations: response to disasters from natural or human causes;
o protracted relief and rehabilitation operations: recovery after a crisis;
o country programme and development activities: food aid for social and economic development;
o special operations: logistics to speed up the movement of food aid.
WFP's programme cycle
Prior to any intervention, WFP will first establish whether food aid is needed and an appropriate response. If it is, WFP will:
o assess who needs food, how much and why;
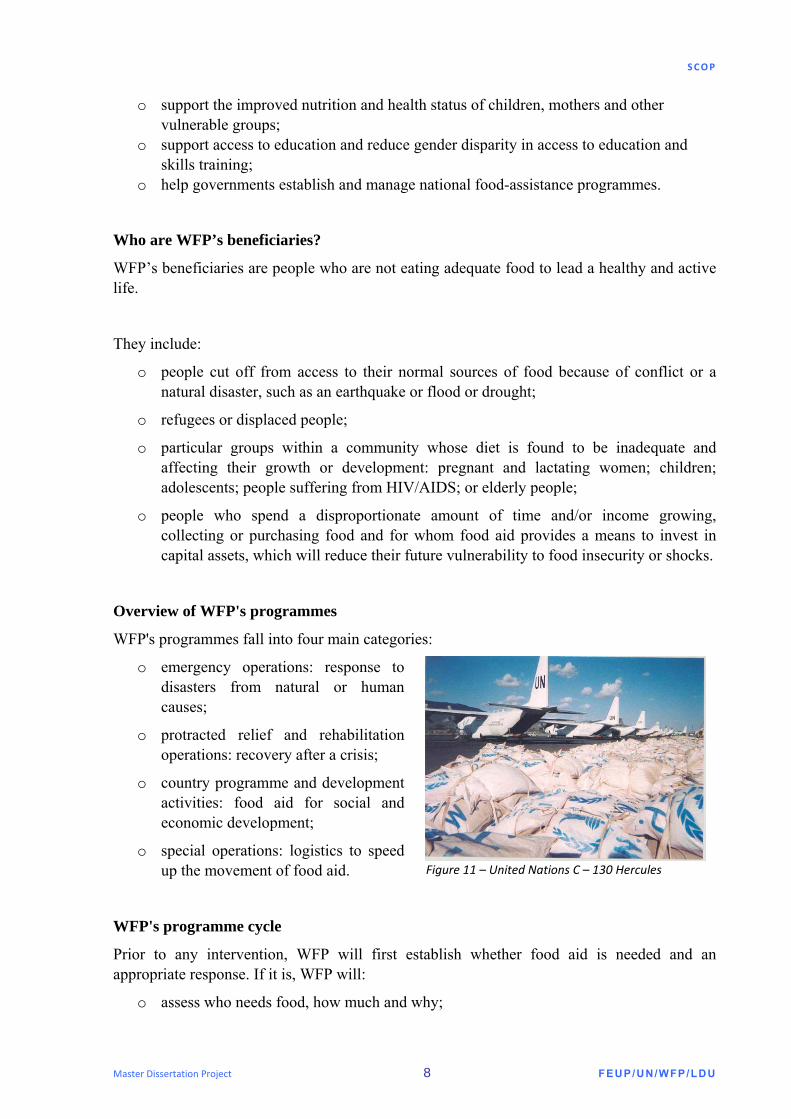
Figure 11 – United Nations C – 130 Hercules
SCOP
Master Dissertation Project 9 FEUP/UN/WFP/LDU
o identify the population in need of assistance, the form that assistance should take, and which targeting mechanism to use;
o design the project and establish: the food ration to be distributed and non-food items required; the time period for assistance; any exit strategies; any security measures needed; training capacity building needs; and reporting arrangements;
o organize transport and food storage facilities;
o identify an appropriate distribution system;
o develop a monitoring and evaluation plan.
WFP in numbers
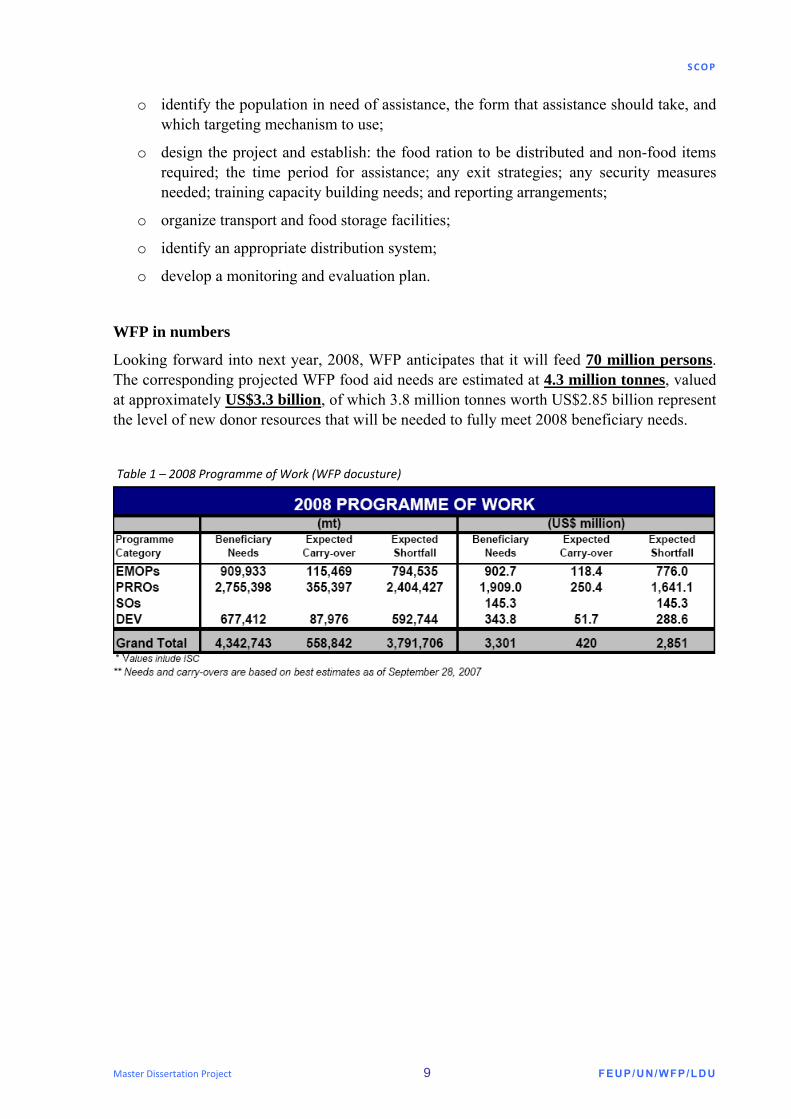
Looking forward into next year, 2008, WFP anticipates that it will feed 70 million persons. The corresponding projected WFP food aid needs are estimated at 4.3 million tonnes, valued at approximately US$3.3 billion, of which 3.8 million tonnes worth US$2.85 billion represent the level of new donor resources that will be needed to fully meet 2008 beneficiary needs.
Table 1 – 2008 Programme of Work (WFP docusture)
SCOP
Master Dissertation Project 10 FEUP/UN/WFP/LDU
1.2. Dissertation Project
Quick Snapshot At present, Supply Chain Optimization Project (SCOP) remains at the "upstream supply chain implementation stage" (WFP headquarters level) dealing with the process period from receipt of donor contribution until cargo (food) is loaded onboard of a ship to be delivered to the recipient country. The project has heavily focused on streamlining various HQ units' processes and the introduction of several supply chain indicators and systems to support the performance measurement. Despite its adoption, SCOP still faces several challenges that require analysis and resolution in order to achieve a stable and improved supply chain performance.
Terms of Reference Title: Project Supply Chain Optimisation – improving lead time performance
Role: Intern
Reporting to: Temmy Tanubrata
Location: Rome
Duration: 17 Mar – 25 July of 2008
Project Objectives and Scope To provide a set of recommendations to the project champions in order to further improve the lead time performance at upstream level (WFP HQ level), contributing to the following main objectives:
1) Shorter and predictable lead times
2) Improved on time delivery of food commodities in Country Offices
3) Maximization of available resources
Key tasks
As dissertation project, the tasks established for a period of five months involve working on a new phase of SCOP, based on six-sigma methodology, with a specific focus on measuring, analysing and improving upstream supply chain performance.
Key tasks involve the following:
o Providing direct support to the project manager during project cycle;
o Assisting in the definition of supply chain improvement opportunities;
o Selection of performance measurement data;
o Review of process mapping and recommending improvements;
SCOP
Master Dissertation Project 11 FEUP/UN/WFP/LDU
o Development of measurement system analysis (MSA);
o Root-cause analysis of performance problems;
o Deployment of statistical tools;
o Comparative modelling and development of improvement plan;
o Drafting business specifications of information system to generate KPI data;
o Drafting specifications of supply chain performance dashboard.
Background The Supply Chain Optimization project was launched in late 2004 to facilitate SCO in improving overall performance within the WFP system. It gained a renewed momentum in the 2nd quarter of 2006, when it entered a more ‘practical’ stage.
This process was conducted by the Boston Consulting Group – BCG, and the three main phases were:
o Diagnostic;
o High-level design;
o Implementation.
As a result of this study, several agreed changes occurred in the supply chain process:
o Alignment with the New Business Model/Project Planning Tool (NBM/PPT);
o Delivery of the SCO basic tools:
o Import Parity Form (IPF);
o Lead Time Tool (LTT);
o Tableau de Board (TdB).
Subsequently, the project gained added pace with the appointment of a Supply Chain Officer in Nov 2006, with 2 staff members (consultant and intern). As result of this phase, a specific tool was created: Overland Lead Time Tool (OLTT).
Today the project has entered its fourth phase of stabilization and improvements at HQ level and started concept development of field optimization.
SCOP
Master Dissertation Project 12 FEUP/UN/WFP/LDU
2. Background Context 2.1. Logistics in WFP
WFP Logistics aims to deliver the right amount of food to the right people, to the right place, at the right time and at the right price. To achieve this, it has turned the complex business of moving food aid into a fine art.
In 2006, WFP delivered a total of 4 million metric tons of food assistance by land, sea and air. In addition, WFP transported some 368,000 passengers from over 100 NGOs to and from the world's humanitarian crisis zones.
WFP Logistics serves over 82 country offices and in 2005 was on the frontline of every emergency operation, from Darfur and the Pakistan earthquake to the Niger food crisis and the Tsunami.
Logistics Branch’s:
o Water: ships, barges, ports;
o Land: trucks, roads, bridges, railway, animals;
o Air: fixed wing, airdrop, helicopter;
o Rapid Response: ALITE, emergency food, UNHRD, standby capacities.
Operations Management Logistics (OML) (Logistics division in WFP)4
Strategic Intent
At the heart of OML’s strategy is a deep sense of purpose, strong guiding values and an ambitious overarching goal that our strategy will help us achieve. We call this our strategic intent.
Core purpose
Our core purpose is to save lives and protect livelihoods by providing the leadership and logistics capacity required to ensure that critical humanitarian supplies reach the right people at the right time and in the right condition.5
4 OML Business Plan
SCOP
Master Dissertation Project 13 FEUP/UN/WFP/LDU
Guiding Values
We pursue this purpose out of a deep respect and empathy for our beneficiaries. We believe that every population in need of humanitarian assistance can and must be reached. Through preparedness, a bias toward action and dedication we ensure that no place is too remote and no obstacle is too great. We are proud of our reputation as leaders in humanitarian logistics but also appreciate that it is by working in collaboration with our partners that we achieve far more than we can alone.
Overarching Goal
Given the challenges facing the humanitarian community, the growing need for reliable logistics capacity, our responsibility to lead the Logistics Cluster, our core competence in humanitarian logistics and our drive to become a stronger organization, we believe that we can best fulfil our core purpose by taking on an even more broad and impact role within the humanitarian community. Our overarching goal, therefore, is to be the logistics service provider of choice to WFP Programmes and to the wider humanitarian community by 2011.
There are three aspects of this goal that are important to highlight:
Service
While we have always worked hard to meet the needs of our WFP colleagues in other divisions, broadening our scope to include the wider humanitarian community will present us with new challenges. We will have to work even harder to define who our customers are, what their needs are, and what services we can provide to meet those needs. Customer service will be at the core of what we do, and it will motivate us to develop new ways of thinking and working that will benefit all of our customers, including our existing customers in WFP.
Choice
We aim to offer humanitarian organizations a logistics service option that is more cost-effective, reliable and flexible than is currently available to them. We are not interested in imposing our services, but rather in earning the opportunity to serve by delivering outstanding value and performance.
WFP Programmes and the wider humanitarian community
We are WFP Logistics. Our colleagues with whom we deliver WFP programmes will always be our core customers and reason for being. However, there is a large and growing need for logistics services for other humanitarian organizations and as the leader in humanitarian logistics we believe that we have a responsibility to service that need. We also believe that in doing so we will become a stronger logistics organization and better equipped to meet the current and emerging needs of WFP.
5This statement relates directly to the “7 R” performance targets of WFP Logistics. It implies that WFP delivers the right
product; in the right quantities; at the right place; at the right time; to the right customer; at the right cost; and in the right
condition.
SCOP
Master Dissertation Project 14 FEUP/UN/WFP/LDU
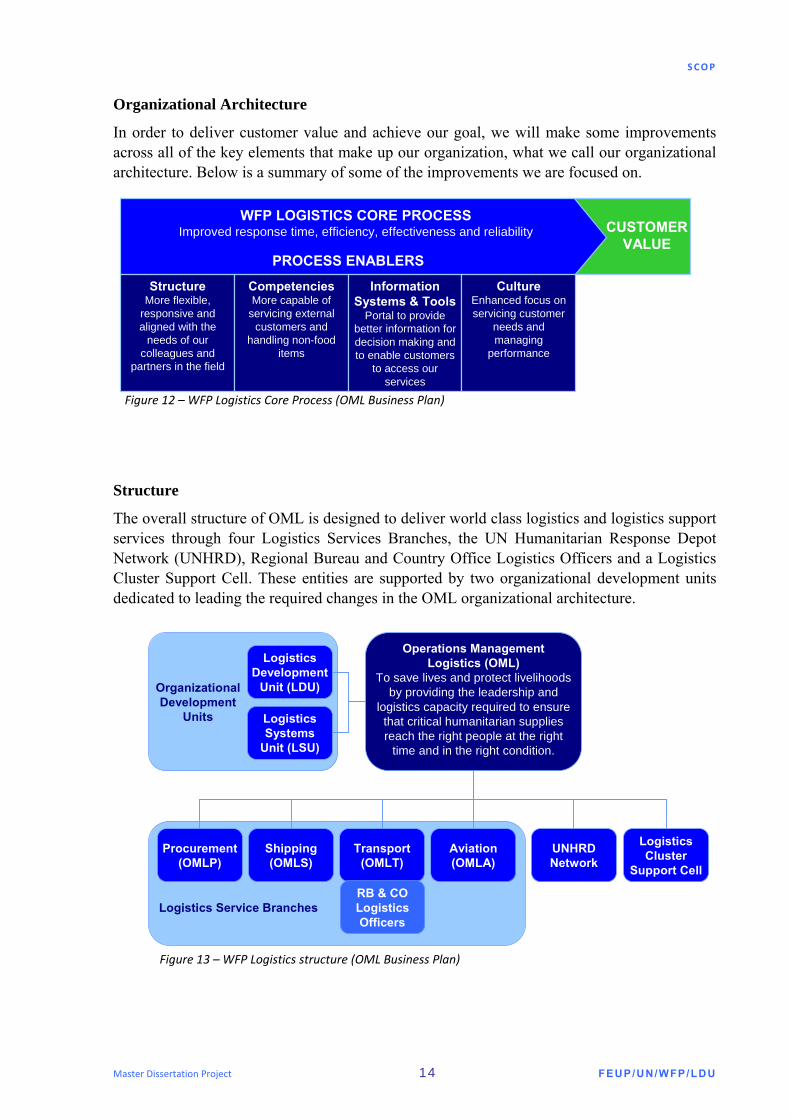
Organizational Architecture
In order to deliver customer value and achieve our goal, we will make some improvements across all of the key elements that make up our organization, what we call our organizational architecture. Below is a summary of some of the improvements we are focused on.
Structure
The overall structure of OML is designed to deliver world class logistics and logistics support services through four Logistics Services Branches, the UN Humanitarian Response Depot Network (UNHRD), Regional Bureau and Country Office Logistics Officers and a Logistics Cluster Support Cell. These entities are supported by two organizational development units dedicated to leading the required changes in the OML organizational architecture.
WFP LOGISTICS CORE PROCESSImproved response time, efficiency, effectiveness and reliability
StructureMore flexible,
responsive and aligned with the
needs of our colleagues and
partners in the field
CompetenciesMore capable of
servicing external customers and
handling non-food items
Information Systems & Tools
Portal to provide better information for decision making and to enable customers
to access our services
CultureEnhanced focus on servicing customer
needs and managing
performance
PROCESS ENABLERS
CUSTOMERVALUE
Figure 12 – WFP Logistics Core Process (OML Business Plan)
Organizational Development
Units
Procurement (OMLP)
Shipping (OMLS)
Transport (OMLT)
Aviation (OMLA)
Operations Management Logistics (OML)
To save lives and protect livelihoods by providing the leadership and
logistics capacity required to ensure that critical humanitarian supplies reach the right people at the right
time and in the right condition.
UNHRD Network
Logistics Cluster
Support Cell
Logistics Development
Unit (LDU)
Logistics Systems
Unit (LSU)
Logistics Service BranchesRB & CO Logistics Officers
Figure 13 – WFP Logistics structure (OML Business Plan)
SCOP
Master Dissertation Project 15 FEUP/UN/WFP/LDU
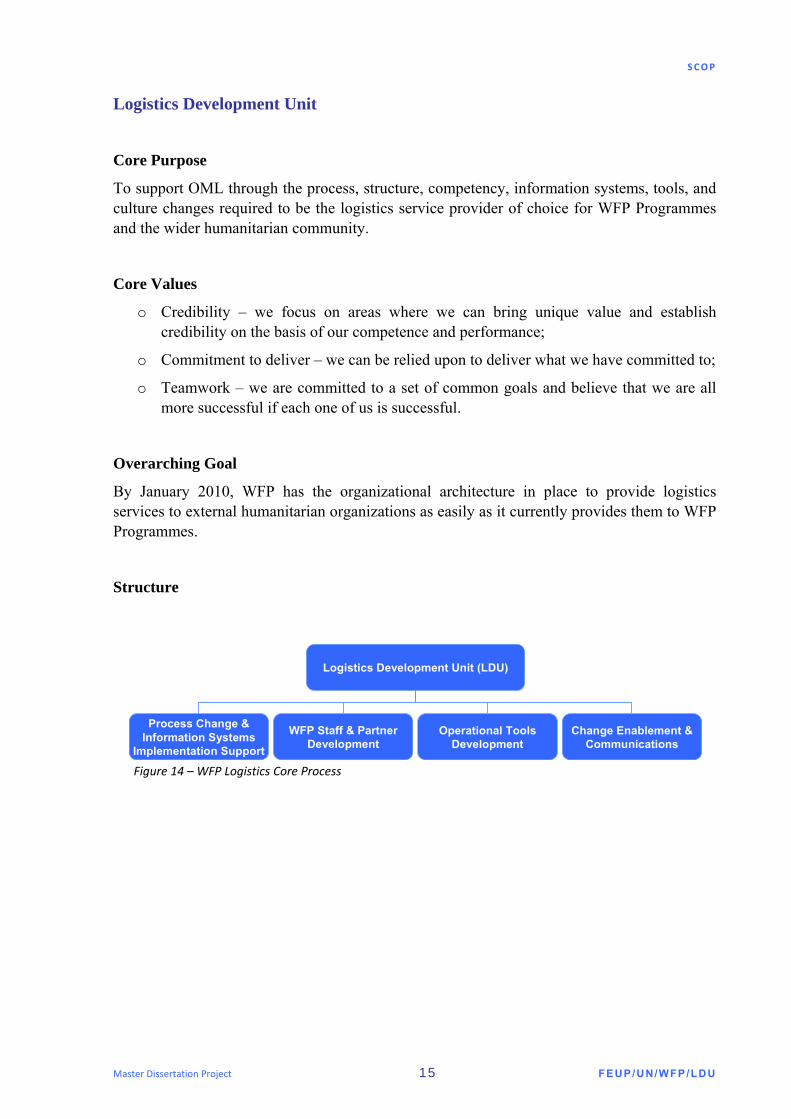
Logistics Development Unit
Core Purpose
To support OML through the process, structure, competency, information systems, tools, and culture changes required to be the logistics service provider of choice for WFP Programmes and the wider humanitarian community.
Core Values
o Credibility – we focus on areas where we can bring unique value and establish credibility on the basis of our competence and performance;
o Commitment to deliver – we can be relied upon to deliver what we have committed to;
o Teamwork – we are committed to a set of common goals and believe that we are all more successful if each one of us is successful.
Overarching Goal
By January 2010, WFP has the organizational architecture in place to provide logistics services to external humanitarian organizations as easily as it currently provides them to WFP Programmes.
Structure
Logistics Development Unit (LDU)
Process Change & Information Systems
Implementation Support
WFP Staff & Partner Development
Operational Tools Development
Change Enablement & Communications
Figure 14 – WFP Logistics Core Process
SCOP
Master Dissertation Project 16 FEUP/UN/WFP/LDU
2.2. UN Reform – context to WFP restructure
Objectives of Humanitarian Reform
o Sufficient humanitarian response capacity and enhanced leadership, accountability and predictability in 9 “gap” sectors/areas of response;
o Adequate, timely and flexible humanitarian financing;
o Improved humanitarian coordination and leadership;
o More effective partnerships between UN and non-UN humanitarian actors.
Cluster Approach
o 9 gap sectors/areas of response identified;
o Each cluster lead by one organization (Lead Agency);
o Increased predictability and accountability of relief operations;
o Lead Agency is provider of last resort;
o Increased preparedness and technical capacity; common standards; monitoring and advocacy; surge capacity and Stand-by Rosters; joint training; stockpiles; pooled resources.
2.3. WFP Restructure
Rapid and profound changes in WFP’s operating environment are presenting significant new challenges and opportunities for WFP Logistics. A new strategy for how WFP Operations Management Logistics (OML) intends to mitigate those risks, capitalize on the opportunities and fulfil its mission to save lives and protect livelihoods is being built.
Trends Underlying the OML Strategy:
Growing Humanitarian Needs Driving Increased Demand for Logistics Capacity:
Climate change and its associated destructive storms, flooding, drought and increased land use for bio-fuels is reducing the amount and productivity of land used for food production. At the same time, rising incomes in emerging economies and exponential population growth are driving up the global demand for food, and in particular for land intensive food such as meat. This strain on the global food supply is coming with increasing fertilizer, fuel and transport costs to produce rapidly rising global food prices.
SCOP
Master Dissertation Project 17 FEUP/UN/WFP/LDU
For our beneficiaries in the world’s most poor and vulnerable populations, these trends are devastating. For the humanitarian community, the challenge will not only be to close a massive food gap, but also to provide the huge amount of water, fertilizer, seeds, medicines and other materials required to save lives and help these communities get back on their feet. The logistics capacity required to move these supplies will be unprecedented. However, efficient and reliable humanitarian logistics capacity requires experience, significant infrastructure and an extensive network of suppliers and partners. With growing demands and rising fuel costs, very few organizations within the humanitarian community will be able to afford to maintain their own logistics capacity. At WFP, this is our core competence. It is expected therefore that we will increasingly be called upon to provide our partners with logistical support.
The “One UN” Approach Creating Formalized Leadership Responsibilities for WFP in the Logistics Cluster:
In response to the growing humanitarian challenges and pressure to perform, the UN is undergoing an extensive reform process. This process involves working more closely as “one UN” and adopting a cluster approach whereby individual UN bodies are given an explicit mandate to lead in their specific area of expertise. As the recognized leader in the field of humanitarian logistics, WFP has been given the responsibility to lead the Logistics Cluster and to provide logistics services to partners in the humanitarian community when required.
New Actors Available as Potential New Partners:
Growing public awareness of the scale of the global crisis and changing institutional policies have prompted new or increased involvement in the humanitarian sector from military, commercial, NGO and other non-traditional humanitarian actors. Many of these actors are small and will face significant challenges operating their programmes efficiently without logistics support. Others, such as the military, have significant logistics capacity and will be looking to use it to support humanitarian operations. Partnerships with both types of organizations offer WFP an opportunity to maximize its impact by leveraging its substantial knowledge and capacity in humanitarian logistics.
SCOP
Master Dissertation Project 18 FEUP/UN/WFP/LDU
Implications for the OML 2008 - 2011 Business Plan:
MEET THE DEMAND FOR A HUMANITARIAN LOGISTICS PROVIDER that is efficient, reliable & predictable
1.
EMBRACE OUR RESPONSIBILITYTO LEAD the humanitarian system in the area of logistics
LEVERAGE OUR LOGISTICS CAPACITY AND KNOWLEDGE to maximize our impact
2.
3.
ONE UN CREATING FORMALIZED LEADERSHIP ROLE FOR WFP► humanitarian reform ► one UN ► cluster approach
GROWING HUMANITARIAN NEEDS DRIVING DEMAND FOR LOGISTICS CAPACITY► climate change► increased natural disasters► increased land use for bio-fuels► rising global food consumption► constrained food supply ► rising food prices► increased need for food,
agriculture and other suppliesin developing nations
unable to afford to run their own logistics operation
NEW ACTORS, NEW PARTNERS► NGOs, military,
commercial, etc.
Figure 15 – From Logistics Business plan implications
SCOP
Master Dissertation Project 19 FEUP/UN/WFP/LDU
SCOP
Master Dissertation Project 20 FEUP/UN/WFP/LDU
3. Supply chain in WFP
3.1. Characteristics of the Humanitarian Supply chain The humanitarian Aid is provided in emergencies cases and in places that are defined as poor countries that need help to support their needs. WFP ‘s main role is essentially to support these countries with food aid, but after the UN reform and being a specialist in Logistics, it has also taken the head of logistic assistance. This implicates that WFP supply chain needs to be prepared to deal with other goods different from food - NFI (Non Food Items).
The characteristics of the SC are also influenced by the type of intervention: if it is an emergency scenario or a planned response.
Usually the process starts as an emergency and later the intervention shifts into a planned reply. This implicates a change in kind of support and consequently a change in type of goods and type of logistics system.
When an emergency occurs, based in the Maslow’s Pyramid, we can see that things like food or water are primary needs and only after that people need support in the shelters, education etc.
Figure 8‐ WFP Logistics Core Process
Development Protracted
Relief & Recovery
Emergency
Time
Figure 16 – Time evolution of the type of intervention
Figure 17 – Pyramid of Needs (from LDU ppt)
SCOP
Master Dissertation Project 21 FEUP/UN/WFP/LDU
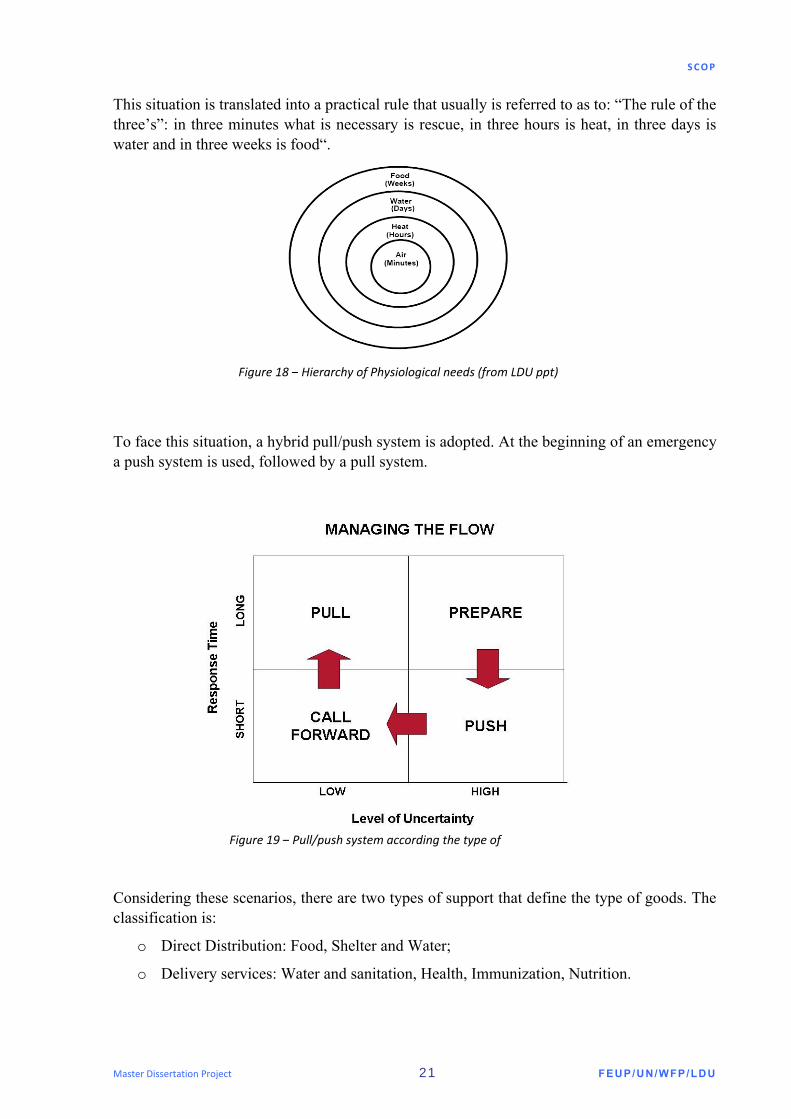
This situation is translated into a practical rule that usually is referred to as to: “The rule of the three’s”: in three minutes what is necessary is rescue, in three hours is heat, in three days is water and in three weeks is food“.
To face this situation, a hybrid pull/push system is adopted. At the beginning of an emergency a push system is used, followed by a pull system.
Considering these scenarios, there are two types of support that define the type of goods. The classification is:
o Direct Distribution: Food, Shelter and Water;
o Delivery services: Water and sanitation, Health, Immunization, Nutrition.
Figure 18 – Hierarchy of Physiological needs (from LDU ppt)
Figure 19 – Pull/push system according the type of
SCOP
Master Dissertation Project 22 FEUP/UN/WFP/LDU
The type of support changes in time. We start first by supplying NFI (Non Food Items) and later more Food items.
Considering the type of items most transported by WFP, food items, the common commodities are:
o Cereals – Rice, Maize and Wheat
o Processed cereal products: Fortified Maize meal, Fortified Wheat flour and Blended Foods
o Vegetable Oils – Soybean, Palm oil, Oil
o Pulses – Beans, Chickpeas, Lentils, Yellow Split Peas
o Various Products: sugar, salt, high energy biscuits, dried whole milk, Japanese canned meat.
72hrs 2 wks 3-4wks 8wks
Other than Food
FoodVOLUME
Shift from air to surfaceShift from kits to single/customized items
Figure 20 – Type of support with time
SCOP
Master Dissertation Project 23 FEUP/UN/WFP/LDU
3.2. WFP Supply chain Dimension
Some Logistics facts to understand the SC in WFP better:
o Distributes about 4 million tons of food for year;
o Beneficiaries are about 87.8 million of the poorest people in the world;
o Operates in 78 countries;
o Total expenditure: US$ 2.9 billion;
o Total number of employees: 10,587 (92% of staff in field);
o Works with over 3,260 international and local NGOs;
o Lead of the Logistics Cluster, Co-Lead of the Telecom Cluster.
The Supple net/Locations:
o Head Quarters: Rome;
o Regional Bureaux – seven: Panama, Dakar, Johannesburg, Dubai, Sudan, Cairo and Bangkok;
Assets: o 3,000+ logistics staff; o 14 Stand-By Partners; o 5,000 trucks on the road; o 100 aircraft aloft; o 40 ships at sea; o 300+ mobile warehouses (90,000 m2 or 150,000 MTs).
Alliances/Partners:
Market Knowledge: o 60+ Logistics Capacity Assessments o 200+ Commercial Transport Contracts o Customs Agreements/Accelerated Procedures
Types of Processes: o Donations: in Kind or Cash; o Purchases: International, Regional or Local;
Figure 22 – The emergence response. The 5 HRD (from LDU ppt).
Figure 23 – WFP Partners
SCOP
Master Dissertation Project 25 FEUP/UN/WFP/LDU
3.3. WFP Supply Chain - General Description
Programming and Procurement
On the basis of the assessment of the type and quantity of food needed, WFP will design a project/programme with a budget that reflects all costs involved in getting the food to beneficiaries over the project period.
Next, WFP:
o presents the budget to donors who pledge cash and food (in-kind) donations;
o gets the project and budget approved;
o purchases food (unless it has received in-kind donations) and organises the transport of the food.
The shipment/overland stage
WFP may receive from donors: cash or food. Donors often set conditions as to how their cash funding is spent, which will determine how and where WFP will purchase the food. For example, the donor may state as a condition that WFP buys the food locally (in the recipient country) or a neighbouring country (in the region), or internationally, outside the region.
On the other hand, if the donor provides WFP with food – it may be handed over in the recipient country, a neighbouring country or outside the region.
Depending on where WFP receives the food or buys the food, WFP may be responsible for shipping it to the recipient country and then transporting it overland to a warehouse(s).
The receipt and storage stage
The food arrives at a warehouse at, or close to, the country port, where:
o It is inspected, any loss or damage is recorded, and existing stock figures for the commodity are adjusted accordingly;
o Landside Transport Instructions are issued – including loading instructions – and the food is ready to be transported to mutually agreed delivery points (or handover points).
The delivery stage
The food arrives with all transport documents (e.g WFP waybills) to the mutually agreed delivery points, where the Cooperating Partner (CP):
o receives the food and records on the waybill;
o stores the food and transports to distribution sites (if stored away from distribution site);
o distributes the food to beneficiaries and monitors the distribution.
SCOP
Master Dissertation Project 26 FEUP/UN/WFP/LDU
Main process: Cash donations and international purchases
The main process in WFP is characterized by cash donations and international purchases. The process starts with a need, and is finished with the delivery of the food. Between the two points, there are several sub-processes. For instance, the acceptance of the request by WFP, the contacts with donors, etc. After WFP has the Confirmed Contribution – CC, the Logistics process starts.
Supply Chain in WFP-Logistics
C0’s
WFP HQ
Country has a need
Can we respond?(Internal process)
Programming Shipping OverlandTransports
Beneficiaries
Procurement
HQ work (Fund Raising, etc) until he have Confirmed Contributions - CCCC
StartHow long?
Lead Time?
If positive, we have a Supply to do:
DonorsFin. Help?
Figure 24 – Possible delivery Places (From BCG)
Figure 25 – The SC in WFP
SCOP
Master Dissertation Project 27 FEUP/UN/WFP/LDU
3.4. Relevant concepts to WFP Supply Chain
Classification: UP stream / Down Stream
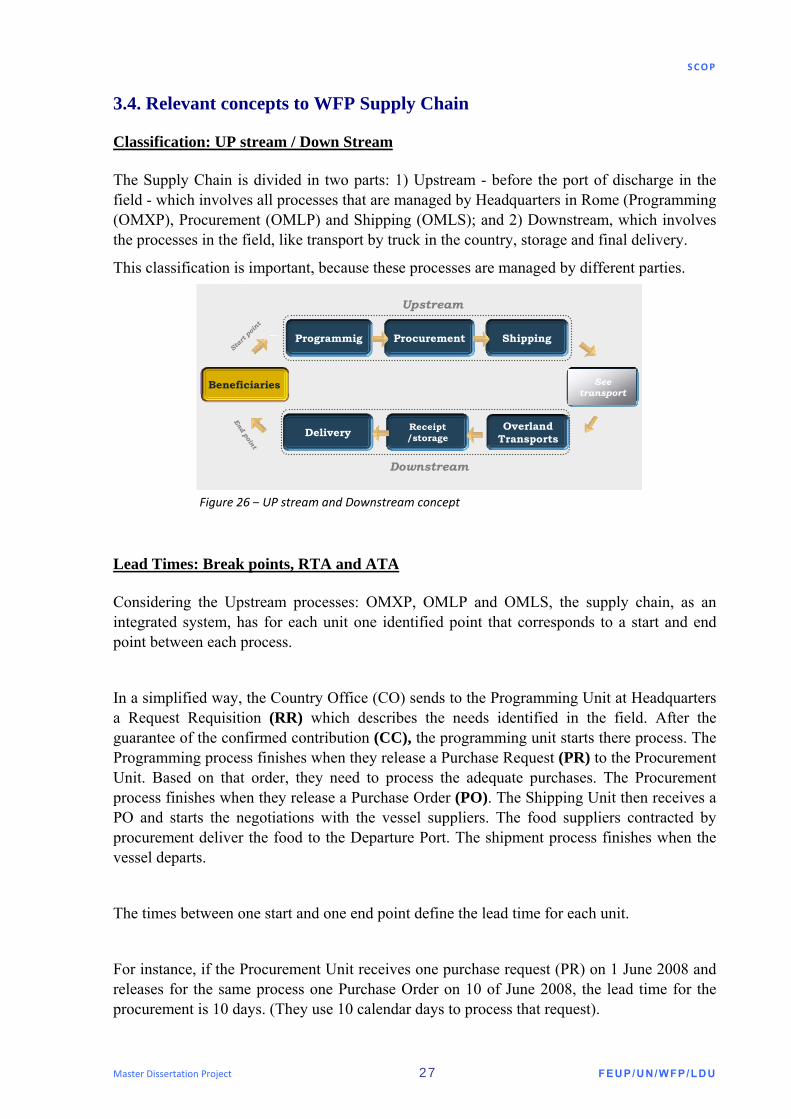
The Supply Chain is divided in two parts: 1) Upstream - before the port of discharge in the field - which involves all processes that are managed by Headquarters in Rome (Programming (OMXP), Procurement (OMLP) and Shipping (OMLS); and 2) Downstream, which involves the processes in the field, like transport by truck in the country, storage and final delivery.
This classification is important, because these processes are managed by different parties.
Lead Times: Break points, RTA and ATA
Considering the Upstream processes: OMXP, OMLP and OMLS, the supply chain, as an integrated system, has for each unit one identified point that corresponds to a start and end point between each process.
In a simplified way, the Country Office (CO) sends to the Programming Unit at Headquarters a Request Requisition (RR) which describes the needs identified in the field. After the guarantee of the confirmed contribution (CC), the programming unit starts there process. The Programming process finishes when they release a Purchase Request (PR) to the Procurement Unit. Based on that order, they need to process the adequate purchases. The Procurement process finishes when they release a Purchase Order (PO). The Shipping Unit then receives a PO and starts the negotiations with the vessel suppliers. The food suppliers contracted by procurement deliver the food to the Departure Port. The shipment process finishes when the vessel departs.
The times between one start and one end point define the lead time for each unit.
For instance, if the Procurement Unit receives one purchase request (PR) on 1 June 2008 and releases for the same process one Purchase Order on 10 of June 2008, the lead time for the procurement is 10 days. (They use 10 calendar days to process that request).
Figure 26 – UP stream and Downstream concept
Programmig Shipping
Overland Transports
Beneficiaries
Procurement
Downstream
Receipt/storageDelivery
See transport
Upstream
Star
t poin
t
End point
SCOP
Master Dissertation Project 28 FEUP/UN/WFP/LDU
Requested Time of Arrival – RTA
The main elements in a request are the identification of the type of commodities, the quantities, the location of delivery and the date that the commodities should be delivered. This date is the Requested Time of Arrival – RTA.
The actual definition of RTA associates different locations according to different types of transport. Therefore, if the process includes shipping transport, the location associated with the date indicated (RTA) is the port of discharge. If the transport uses overload transport and not shipping, the location is the inland destination (Country Office warehouse or in exceptional cases the Final Distribution Point).
For example, if in Mozambique a request is released to feed people in Tete, lets take two possibilities:
Error!
1. International purchase: buying food in India and using vessel to send the food first to the Beira Port, and then to Tete by truck. In this case, the RTA indicated in the request form is the date of delivery to the port (Beira).
2. Regional purchase: buying in South of Africa, and sending the food by truck directly to Tete warehouse. In this case, the RTA indicated is the date of delivery to the warehouse (Tete).
Actual Time of Arrival – ATA
The actual time of arrival refers to the real time that the goods arrive in the place indicated and are recorded accordingly. This date is used to check if the goods arrived in time or delayed.
Figure 27 – Illustration of Type of arrival
SCOP
Master Dissertation Project 29 FEUP/UN/WFP/LDU
WINGS and COMPAS
WINGS is the WFP corporate information system. WINGS stands for "World Food Programme Information Network and Global System."
WINGS is used to manage many facets of WFP's business, including programme/project planning and implementation, procurement, logistics, finance, travel and human resources. WINGS uses SAP software. SAP stands for Systems, Applications and Products in Data Processing and is the name of a company.
COMPAS is WFP’s global commodity tracking application. It is an electronic system for monitoring the progress of commodities from the time they are first requested by field offices through to their handover to Cooperating Partners.
COMPAS's base data for commodity planning, purchasing and international shipment are downloaded daily from WINGS. After WFP commodities have arrived in their destination countries, all subsequent storage, processing and delivery data for these commodities are entered in COMPAS locally and replicated with other COMPAS offices. The result is a comprehensive on-line picture of the entire WFP food supply chain.
SCOP
Master Dissertation Project 30 FEUP/UN/WFP/LDU
3.5. SC As is in the start of the project
Standard Lead Times
As a result of the previous phases of the project, standard lead times were established for each unit involved in the upstream process. The units and the lead times associated are:
o Programming – 5 working days;
o Procurement – 17 working days;
o Shipping – 20 working days.
Measure the performance – the process used In order to quantify the lead times of each process, we use data from WINGS and Compas, which have the dates (start and end point) for all the processes.
To analyse the data, were created some tools:
o Lead Time Tool (LTT): an access data base, that takes data imported from WINGS and with that data the performance of each process is analysed according to the request defined previously. As part of LTT, highlight the “Tableau de bord”, a resume table that shows the lead time for each unit for one indicated period.
o Overland Lead Time Tool (OLTT): an oracle data base, that gives to the user the performance indicators of the overland logistics process. (it is not used for the upstream analysis and, therefore, will not be part of study in this project);
The relation between units, processes, standard lead times and measure tools is shown in the next figure:
SI
Supply Chain – Up Stream analyze
Programmig
Shipping
Procurement
Prog. Analz (IFE)
t (Work daws)
10 15 2220 30 40 42
Confirmed contribution
Purchase Order raised by OMLP
Vessel Departure
Tender
1P.C.M.
Preparing Cargo
Process Prog. analyse
Tender PCM 1;2
SI Booking Confirmation
in WINGS
Preparing Cargo
Loading Sailing
Responsively Unit OMXP OMLP OMLP OMLP
OMLS
OMLS OMLS OMLS ?
Time target(Work Days) 5 10 5 1+1
5 8 5 5 ?
System tool IPF + LTT
LTT LTT LTT
LTT
LTT LTT LTT LTT
Key Points:
50
Purchase RequestRaised by OMXP
1-PR amendment
2
2-Finalize the issue of Purchase Order
24 32
Shipping Instruction issued by OMLP
Loading
PCM–Purchase Committe Meeting IPF–Imparty Parity Form LTT–Lead Time Tool OLTT–Overland Lead Time Tool
Book.Conf.
Arrival at port
sailingsailing
Figure 28 – The main processes to measure upstream
SCOP
Master Dissertation Project 31 FEUP/UN/WFP/LDU
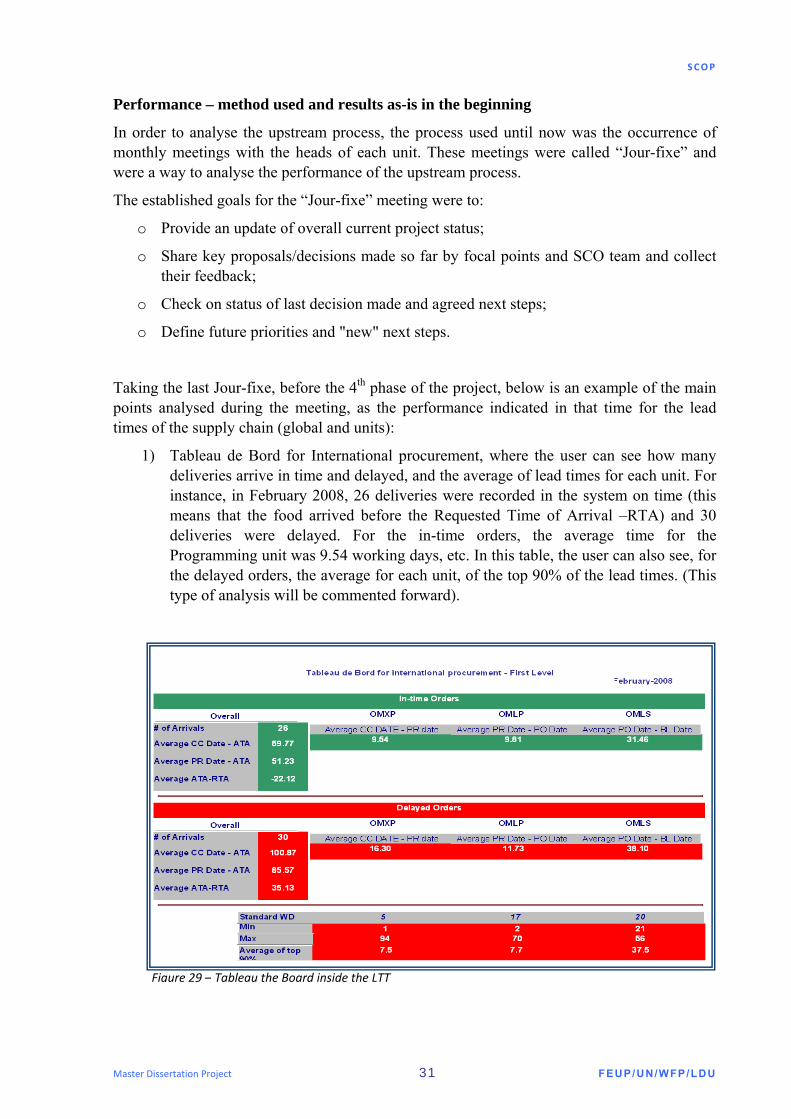
Performance – method used and results as-is in the beginning
In order to analyse the upstream process, the process used until now was the occurrence of monthly meetings with the heads of each unit. These meetings were called “Jour-fixe” and were a way to analyse the performance of the upstream process.
The established goals for the “Jour-fixe” meeting were to:
o Provide an update of overall current project status;
o Share key proposals/decisions made so far by focal points and SCO team and collect their feedback;
o Check on status of last decision made and agreed next steps;
o Define future priorities and "new" next steps.
Taking the last Jour-fixe, before the 4th phase of the project, below is an example of the main points analysed during the meeting, as the performance indicated in that time for the lead times of the supply chain (global and units):
1) Tableau de Bord for International procurement, where the user can see how many deliveries arrive in time and delayed, and the average of lead times for each unit. For instance, in February 2008, 26 deliveries were recorded in the system on time (this means that the food arrived before the Requested Time of Arrival –RTA) and 30 deliveries were delayed. For the in-time orders, the average time for the Programming unit was 9.54 working days, etc. In this table, the user can also see, for the delayed orders, the average for each unit, of the top 90% of the lead times. (This type of analysis will be commented forward).
Figure 29 – Tableau the Board inside the LTT
SCOP
Master Dissertation Project 32 FEUP/UN/WFP/LDU
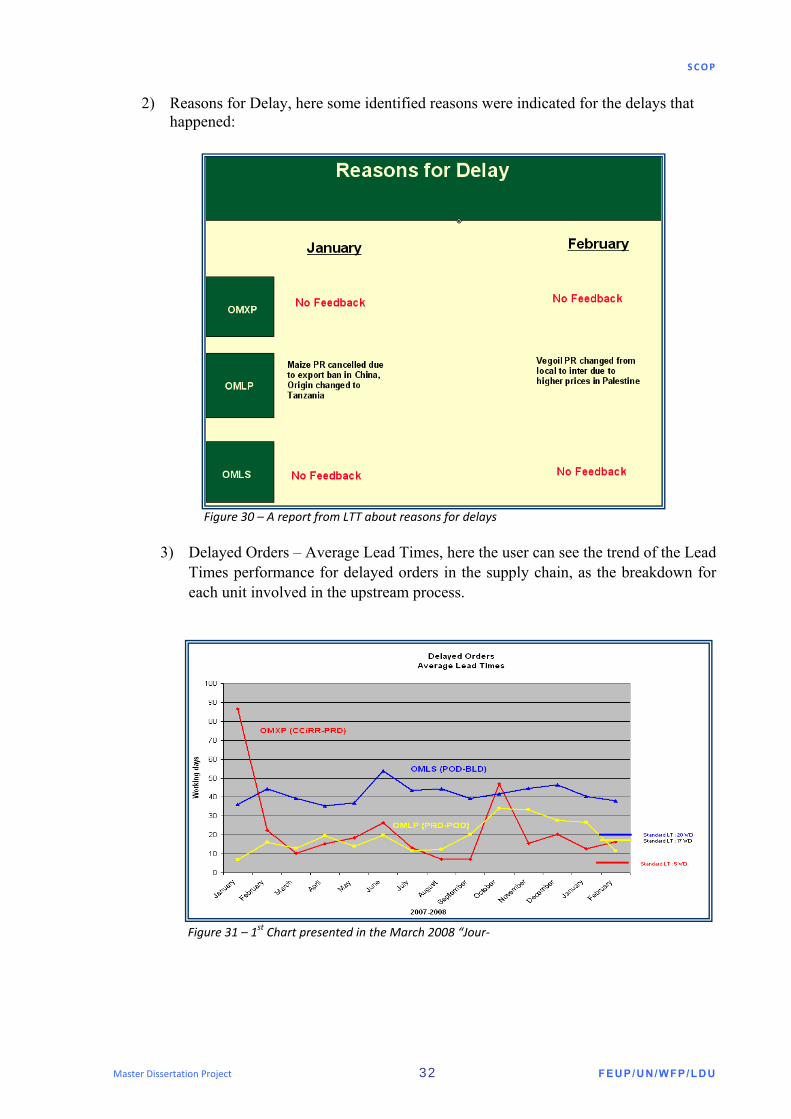
2) Reasons for Delay, here some identified reasons were indicated for the delays that happened:
3) Delayed Orders – Average Lead Times, here the user can see the trend of the Lead Times performance for delayed orders in the supply chain, as the breakdown for each unit involved in the upstream process.
Figure 30 – A report from LTT about reasons for delays
Figure 31 – 1st Chart presented in the March 2008 “Jour‐
SCOP
Master Dissertation Project 33 FEUP/UN/WFP/LDU
4) Average Lead Times (from Confirmed Contribution to vessel Departure), here we can see the trend of Lead Times performance of the Supply Chain for International Cash Purchases (upstream process) for all orders (in time plus delayed), as the breakdown by units.
5) Service Rate, here the ratio between the orders that existed and the number that arrived in-time is analysed for the period indicated.
Figure 32 – 2sd Chart presented in the March 2008 “Jour‐Fixe”
Figure 33 – 3rd Chart presented in the March 2008 “Jour‐Fixe”
SCOP
Master Dissertation Project 34 FEUP/UN/WFP/LDU
4. Logistics Management Logistics Management is that part of Supply Chain Management that plans, implements, and controls the efficient, effective, forward, and reverse flow and storage of goods, services, and related information between the point of origin and the point of consumption in order to meet customers’ requirements.
4.1. Supply Chain Management Supply chain management (SCM) is6 the oversight of materials, information, and finances as they move in a process from supplier to manufacturer to wholesaler to retailer to consumer. Supply chain management involves coordinating and integrating these flows both within and among companies. It is said that the ultimate goal of any effective supply chain management system is to reduce inventory (with the assumption that products are available when needed). As a solution for successful supply chain management, sophisticated software systems with Web interfaces are competing with Web-based application service providers (ASP) who promise to provide part or all of the SCM service for companies who rent their service.
Supply chain management flows can be divided into three main flows: o The product flow; o The information flow; o The finances flow.
The product flow includes the movement of goods from a supplier to a customer, as well as any customer returns or service needs. The information flow involves transmitting orders and updating the status of delivery. The financial flow consists of credit terms, payment schedules, and consignment and title ownership arrangements.
There are two main types of SCM software: planning applications and execution applications. Planning applications use advanced algorithms to determine the best way to fill an order. Execution applications track the physical status of goods, the management of materials, and financial information involving all parties.
Some SCM applications are based on open data models that support the sharing of data both inside and outside the enterprise (this is called the extended enterprise, and includes key suppliers, manufacturers, and end customers of a specific company). This shared data may reside in diverse database systems, or data warehouses, at several different sites and companies.
By sharing this data "upstream" (with a company's suppliers) and "downstream" (with a company's clients), SCM applications have the potential to improve the time-to-market of products, reduce costs, and allow all parties in the supply chain to better manage current resources and plan for future needs.
Increasing numbers of companies are turning to Web sites and Web-based applications as part of the SCM solution. A number of major Web sites offer e-procurement marketplaces where manufacturers can trade and even make auction bids with suppliers.
6 CIO Definitions ‐ Supply chain management
SCOP
Master Dissertation Project 35 FEUP/UN/WFP/LDU
4.2. Improvement methods
In organizational development, a improvement method is a series of actions taken to identify, analyze and improve existing processes within an organization to meet new goals and objectives.
These actions often follow a specific methodology or strategy to create successful results. Samplings of these are:
o Benchmarking;
o Business Process Improvement;
o Business process reengineering;
o Capability Maturity Model Integration/Capability Maturity Model;
o Hoshin Kanri;
o ISO 9000;
o Just In Time manufacturing;
o Lean manufacturing;
o Performance improvement;
o Process management;
o Process Improvement and Management (PI&M);
o Six Sigma;
o Theory of Constraints;
o Total Quality Management;
o Trillium Model;
o Twelve leverage points.
SCOP
Master Dissertation Project 36 FEUP/UN/WFP/LDU
Six-Sigma
Six Sigma at many organizations simply means a measure of quality that strives for near perfection. Six Sigma is a disciplined, data-driven approach and methodology for eliminating defects (driving towards six standard deviations between the mean and the nearest specification limit) in any process -- from manufacturing to transactional and from product to service.
A Six Sigma process is one where the process average is at least ‘six Sigma’ away from the nearest customer specification limit (where one Sigma is the standard deviation of the process variation, a measure of process spread).
Even within realistic shifts in the process average (of up to 1.5 Sigma), a Six Sigma process will produce just 3.4 defects per million opportunities.
A Six Sigma defect is defined as anything outside of customer specifications. A Six Sigma opportunity is then the total quantity of chances for a defect. Process sigma can easily be calculated using a Six Sigma calculator.
The fundamental objective of the Six Sigma methodology is the implementation of a measurement-based strategy that focuses on process improvement and variation reduction through the application of Six Sigma improvement projects. This is accomplished through the use of two Six Sigma sub-methodologies: DMAIC and DMADV. The Six Sigma DMAIC process (define, measure, analyze, improve, control) is an improvement system for existing processes falling below specification and looking for incremental improvement. The Six Sigma DMADV process (define, measure, analyze, design, verify) is an improvement system used to develop new processes or products at Six Sigma quality levels. It can also be employed if a current process requires more than just incremental improvement. Both Six Sigma processes are executed by Six Sigma Green Belts and Six Sigma Black Belts, and are overseen by Six Sigma Master Black Belts.
DMAIC vs DMADV
Six Sigma has 2key methodologies: DMAIC and DMADV (inspired by W. E. Deming's Plan-Do-Check-Act Cycle
The methodology adopted in this project is DMAIC.
What is DMAIC: DMAIC is used to improve an existing business process. It is a basic methodology that consists of the following five steps:
1. Define the process improvement goals that are consistent with customer demands and enterprise strategy.
2. Measure the current process and collect relevant data for future comparison.
3. Analyze to verify relationship and causality of factors. Determine what the relationship is, and attempt to ensure that all factors have been considered.
4. Improve or optimize the process based upon the analysis using techniques like Design of Experiments.
5. Control to ensure that any variances are corrected before they result in defects. Set up pilot runs to establish process capability, transition to production and thereafter continuously measure the process and institute control mechanisms
Figure 36 – 6Sigma Control
(from Stanford. University)
SCOP
Master Dissertation Project 38 FEUP/UN/WFP/LDU
Main activities for each phase:
Phase Main Activities
Define Validate/Identify Business Opportunities; Validate/Identify Team Charter; Identify and Map Processes; Identify Quick wins and Refine Processes; Critical Customer Requirements.
Measure Identify Input, process and output Indicators; Develop Operational Definition and Measurement plan; Analyze Measurement System; Plot and Analyze Data; Determine if Special Cause Exists; Determine Sigma Performance; Collect other Baseline Performance Data.
Analyze Stratify Process; Stratify Data and Identify Specific Problem; DevelopProblem Statement; Identify Root Causes; Design Root Cause Verification Analysis; Validate Root Causes; Comparative Methods; Sources of VariationStudies; Failure Modes and Effects Analyses; Correlation Analyses;
Improve Generate Solution Ideas; Determine Solution Impacts: Benefits;Evaluate and Select Solutions; Develop Process Maps and High Levelplan; Develop and present Storyboard; Communicate Solutions to allStakeholders.
Control Develop pilot plan and pilot solutions; Verify sigma improvementresulted from solution; Apply Statistical Process Control; Identify anddevelop Replication and standardization opportunities; Integrate andmanage Solutions in daily work process; Integrate Lesson Learned; Identify Team’s Next steps and plans for remaining Opportunities;
Figure 37 – Six‐sigma Phases
Table 2 – Main activities for Six‐sigma
SCOP
Master Dissertation Project 39 FEUP/UN/WFP/LDU
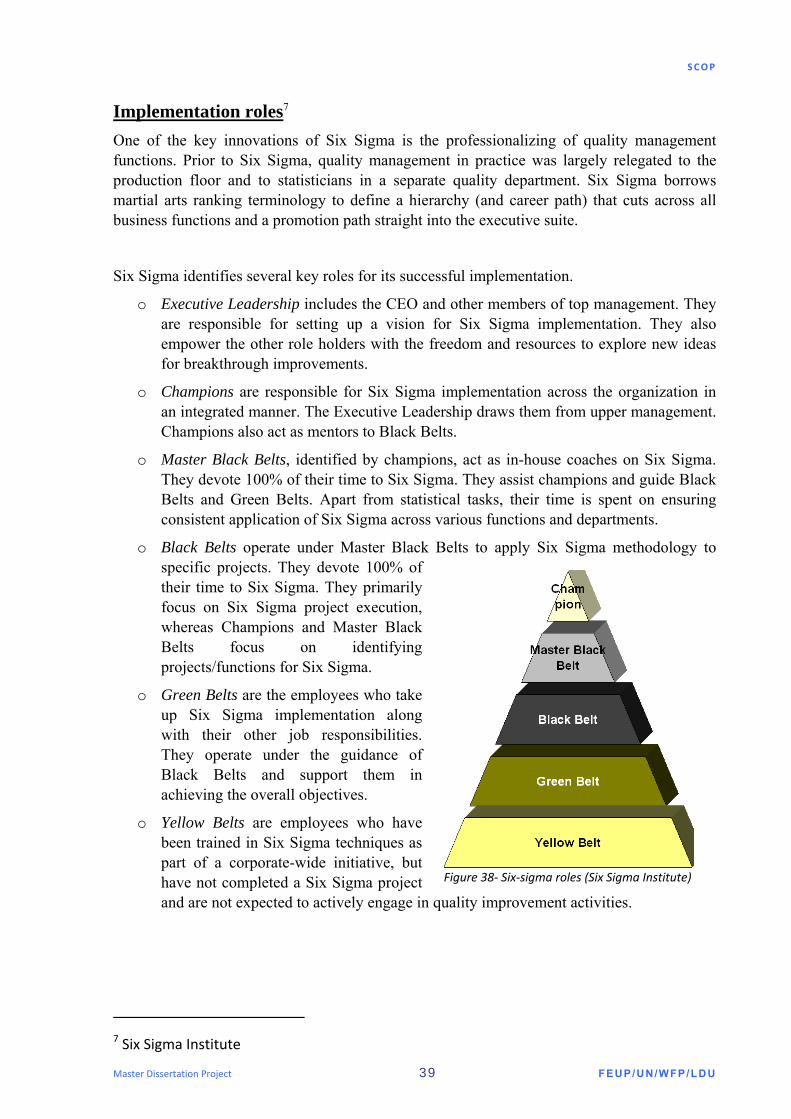
Implementation roles7
One of the key innovations of Six Sigma is the professionalizing of quality management functions. Prior to Six Sigma, quality management in practice was largely relegated to the production floor and to statisticians in a separate quality department. Six Sigma borrows martial arts ranking terminology to define a hierarchy (and career path) that cuts across all business functions and a promotion path straight into the executive suite.
Six Sigma identifies several key roles for its successful implementation.
o Executive Leadership includes the CEO and other members of top management. They are responsible for setting up a vision for Six Sigma implementation. They also empower the other role holders with the freedom and resources to explore new ideas for breakthrough improvements.
o Champions are responsible for Six Sigma implementation across the organization in an integrated manner. The Executive Leadership draws them from upper management. Champions also act as mentors to Black Belts.
o Master Black Belts, identified by champions, act as in-house coaches on Six Sigma. They devote 100% of their time to Six Sigma. They assist champions and guide Black Belts and Green Belts. Apart from statistical tasks, their time is spent on ensuring consistent application of Six Sigma across various functions and departments.
o Black Belts operate under Master Black Belts to apply Six Sigma methodology to specific projects. They devote 100% of their time to Six Sigma. They primarily focus on Six Sigma project execution, whereas Champions and Master Black Belts focus on identifying projects/functions for Six Sigma.
o Green Belts are the employees who take up Six Sigma implementation along with their other job responsibilities. They operate under the guidance of Black Belts and support them in achieving the overall objectives.
o Yellow Belts are employees who have been trained in Six Sigma techniques as part of a corporate-wide initiative, but have not completed a Six Sigma project and are not expected to actively engage in quality improvement activities.
7 Six Sigma Institute
Figure 38‐ Six‐sigma roles (Six Sigma Institute)
SCOP
Master Dissertation Project 40 FEUP/UN/WFP/LDU
5. Applying Six sigma in SCOP
Why Six-sigma?
The six-sigma as a method, is being evaluated by looking at different improvement methods (TQM, Lean, Kaizen, etc) and, together with a strong scientific approach, focusing the analysis in one structure approach that leads to an improvement in the quality of the processes. At the same time, another point to highlight is the fact that this method is customer oriented.
This method has been tested with good results in several companies:
o Motorola; o Sony; o Toshiba; o Johnson & Johnson; o Brown Boveri; o Black & Decker; o Bombardier; o Dupont; o Dow Chemical; o Federal Express; o Kodak (which had taken in $85 million in savings as of early 2000); o Navistar; o Polaroid; o Seagate Technologies; o Siebe Appliance Controls.
Considering that in the WFP Supply Chain we are facing processes that need to be improved, and be customer oriented, six-sigma is a good method to guide this process.
The use of six-sigma should be seen as a guide in this improvement process. The fact that the host organization is WFP, several constraints are present. WFP does not have the same characteristics of a normal company. The success of the project depends also on the capacity of use of the six-sigma “rules” in the correct measure, being agile and not inflexible without losing the rigour.
To finalise, add the information, that the option of follow the six-sigma approach was a decision of the project manager, before I start this study.
SCOP
Master Dissertation Project 41 FEUP/UN/WFP/LDU
5.1. Definition Phase Objectives
1. Identify the improvement opportunity;
2. Develop the business processes;
3. Define critical customer requirements and prepare themselves to be an effective project team.
Main activities
1. Identify Business Needs/Customer Requirements;
2. Validate and Identify Business Opportunity;
3. Project Charter;
4. Identify and Map Processes.
SCOP
Master Dissertation Project 42 FEUP/UN/WFP/LDU
Identify Business Needs/Costumer Requirements
Who is the Customer?
The final destination of the supply chain is the beneficiaries; people that need to be supported with food.
Considering the structure of WFP: Headquarters (HQ), Regional Bureaus (RB) and the Country Offices (CO), it is the CO that represents the needs of the beneficiaries.
Identify Business Opportunity
Learn from past practices – be efficient / effective with the analysis;
Why didn’t WFP improve based on the mistakes identified in the past?
For one year WFP have been spoke about the same things;
Opportunity: Stabilize the process, become closer to our goal: reduce and control lead time;
Action: study the past of SCOP (notes and excel data analysis)
Concepts definition: RTA and IPF/IPE
In several notes for the record (NFR), resulting from meetings like the monthly “Jour-Fixe”, it has been reported that there is a misconception about the use and definition of RTA and IPF.
Develop a definition that everyone agrees with, understand and use well;
Opportunity: Simplify and accelerate the process, clarifying two of the most used “instruments” in the Supply Chain: IPF and RTA; make a better use of RTA by CO, reducing some unrealistic RTA that exist now;
Action: First, based on the experience of the several units and country offices reports, define the concepts in HQ and afterwards “train” all the players with the new concepts.
Develop an integrated chain: The whole chain needs to be linked
WFP Structure: The present structure works with “single” (separate) parts that in the end are the supply chain, but do not work in an integrated system.;
Information: the present processes are supported by several tools and several information sources.
Opportunity: improve the performance of the whole supply chain/ reduce the present lead times.
SCOP
Master Dissertation Project 43 FEUP/UN/WFP/LDU
Action:
o Identify and understand the vision of each unit for the supply chain (priorities, difficulties, etc);
o Map the actual supply chain process;
o Validate the process with the different departments;
o Analyze possible “bottlenecks” in the chain;
o Develop a tool to respond at all information needs (that groups the several existing sources of information and tools).
Focus on the Country Offices (customers):
Identify and understand the Customers Requirements (they are the beginning and the end of the chain and therefore the most important link in the chain).
Opportunity:
o Focus on the real problem and, with that, perform a more efficient analysis;
o Improve the performance of the whole supply chain/reduce our lead time.
Action:
o Define the customers needs, using:
o Surveys (questionnaires);
o Information from the CO (Reports, etc).
Separate the special cases in order to focus on different ways to improve
Opportunity: improve the performance of the supply chain by controlling significant cases (make the analysis more realistic – increase the sensibility of analysis).
Action:
Define a better measure system adjustable to WFP SC characteristics (for example, separate special cases (processes that have a different behaviour – for example, donors that have a special request).
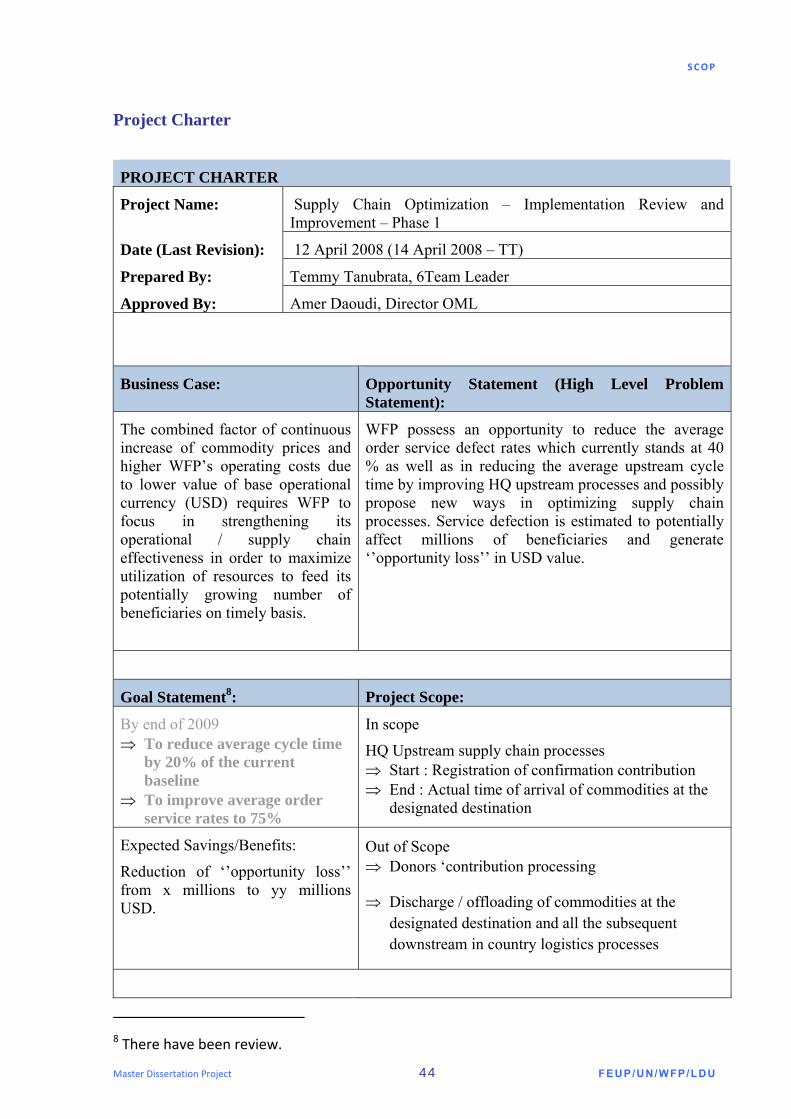
Date (Last Revision): 12 April 2008 (14 April 2008 – TT)
Prepared By: Temmy Tanubrata, 6Team Leader
Approved By: Amer Daoudi, Director OML
Business Case: Opportunity Statement (High Level Problem Statement):
The combined factor of continuous increase of commodity prices and higher WFP’s operating costs due to lower value of base operational currency (USD) requires WFP to focus in strengthening its operational / supply chain effectiveness in order to maximize utilization of resources to feed its potentially growing number of beneficiaries on timely basis.
WFP possess an opportunity to reduce the average order service defect rates which currently stands at 40 % as well as in reducing the average upstream cycle time by improving HQ upstream processes and possibly propose new ways in optimizing supply chain processes. Service defection is estimated to potentially affect millions of beneficiaries and generate ‘’opportunity loss’’ in USD value.
Goal Statement8: Project Scope:
By end of 2009 ⇒ To reduce average cycle time
by 20% of the current baseline
⇒ To improve average order service rates to 75%
In scope
HQ Upstream supply chain processes ⇒ Start : Registration of confirmation contribution ⇒ End : Actual time of arrival of commodities at the
designated destination
Expected Savings/Benefits:
Reduction of ‘’opportunity loss’’ from x millions to yy millions USD.
Out of Scope ⇒ Donors ‘contribution processing
⇒ Discharge / offloading of commodities at the designated destination and all the subsequent downstream in country logistics processes
8 There have been review.
SCOP
Master Dissertation Project 45 FEUP/UN/WFP/LDU
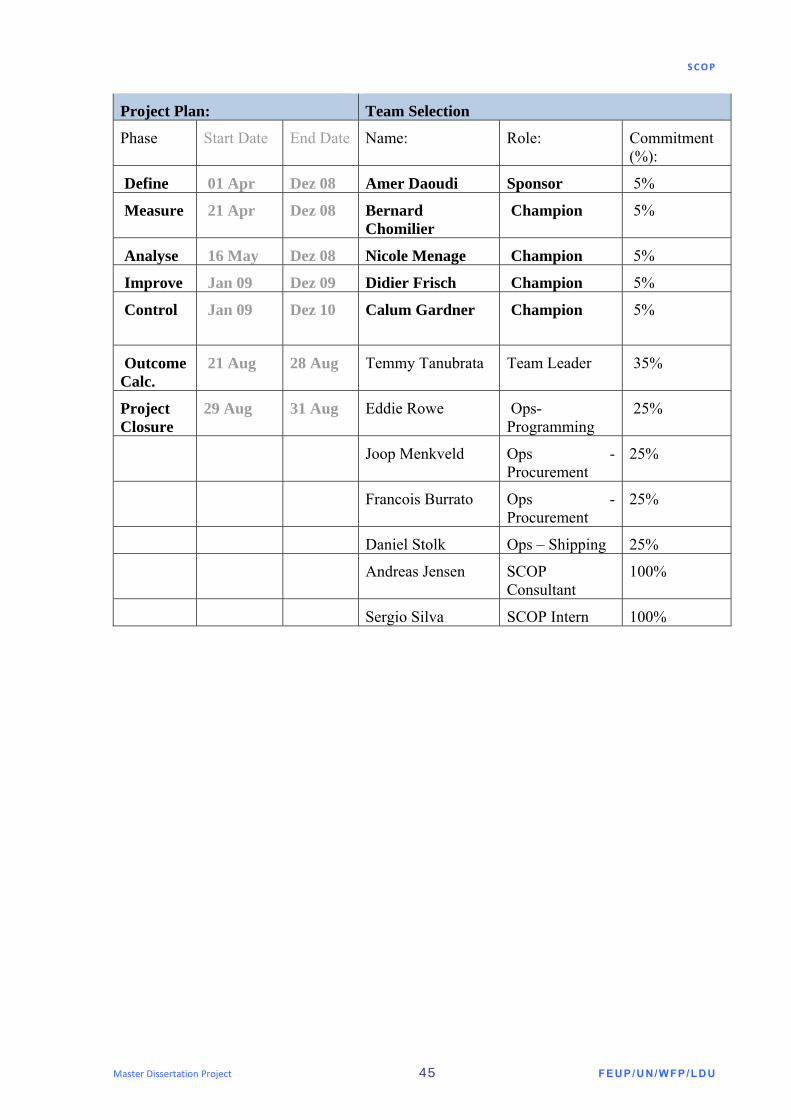
Project Plan: Team Selection
Phase Start Date End Date Name: Role: Commitment (%):
Define 01 Apr Dez 08 Amer Daoudi Sponsor 5%
Measure 21 Apr Dez 08 Bernard Chomilier
Champion 5%
Analyse 16 May Dez 08 Nicole Menage Champion 5%
Improve Jan 09 Dez 09 Didier Frisch Champion 5%
Control Jan 09 Dez 10
Calum Gardner Champion 5%
Outcome Calc.
21 Aug 28 Aug Temmy Tanubrata Team Leader 35%
Project Closure
29 Aug 31 Aug Eddie Rowe Ops-Programming
25%
Joop Menkveld Ops - Procurement
25%
Francois Burrato Ops - Procurement
25%
Daniel Stolk Ops – Shipping 25%
Andreas Jensen SCOP Consultant
100%
Sergio Silva SCOP Intern 100%
SCOP
Master Dissertation Project 46 FEUP/UN/WFP/LDU
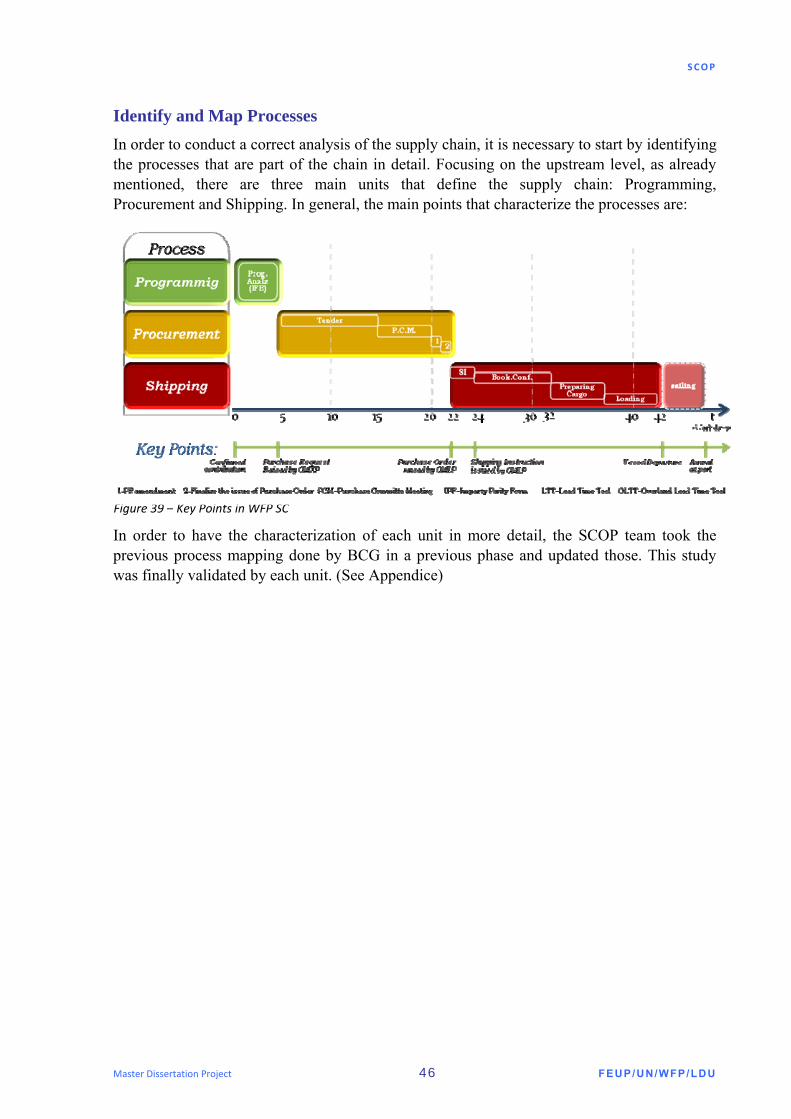
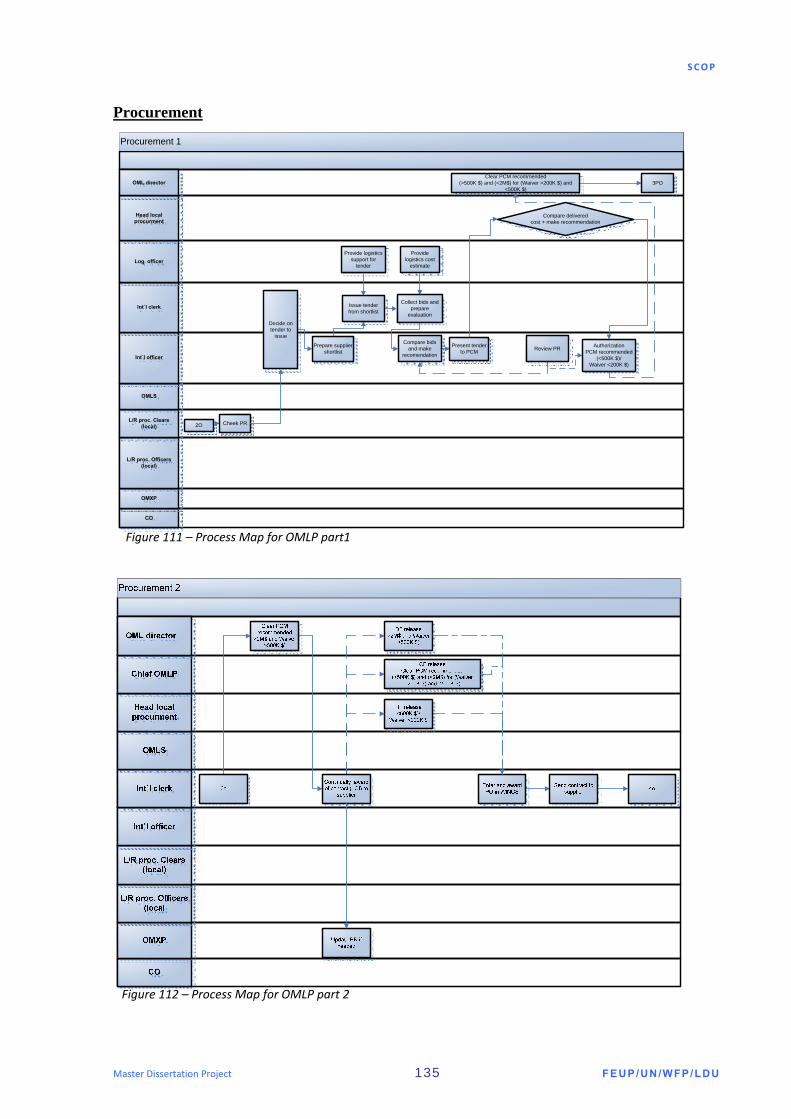
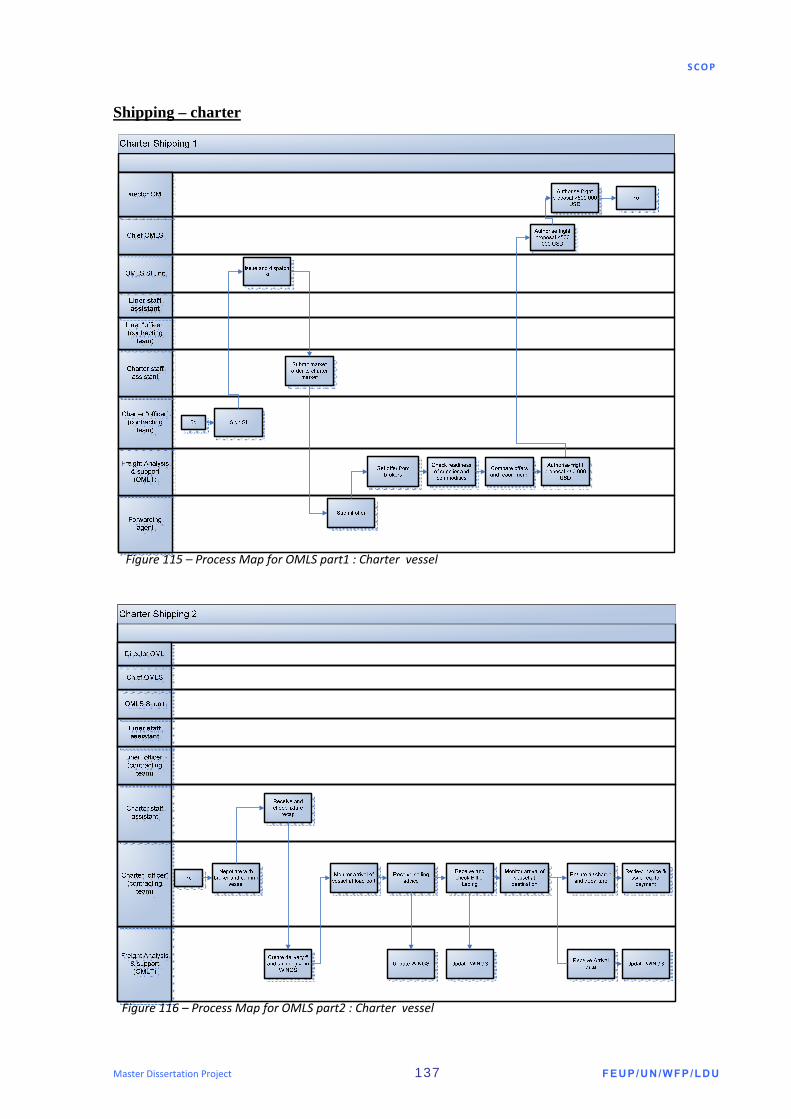
Identify and Map Processes In order to conduct a correct analysis of the supply chain, it is necessary to start by identifying the processes that are part of the chain in detail. Focusing on the upstream level, as already mentioned, there are three main units that define the supply chain: Programming, Procurement and Shipping. In general, the main points that characterize the processes are:
To have in more detail the characterization of each unit, SCOP team taking the previous process mapping did by BCG in a previous phase, did a update of the processes mapping, This study was in the end validate from each unit. (appendice ***)
In order to have the characterization of each unit in more detail, the SCOP team took the previous process mapping done by BCG in a previous phase and updated those. This study was finally validated by each unit. (See Appendice)
Figure 39 – Key Points in WFP SC
SCOP
Master Dissertation Project 47 FEUP/UN/WFP/LDU
5.2. Measurement Phase
Objectives
o Identify critical measures that are necessary to evaluate the success, meeting critical customer requirements;
o Begin developing a methodology to effectively collect data to measure process performance.
Main Activities
o Identify Input, Process and Output indicators;
o Develop Operational Definition and Measurement Plan;
o Plot and Analyze Data;
o Determine if special Cause Exists;
o Collect other baseline Performance data;
o Failure Modes and Effects Analysis.
SCOP
Master Dissertation Project 48 FEUP/UN/WFP/LDU
KPI’s Definition
In order to define the KPI’s related to Supply chain, with lead of Andreas, SCOP team on 13th of May sent a questionnaire to a selection of senior staff members to collect their input into KPI validation. The response rate was just below 80 % and the respondents answered according to the asked scale. However, there was some feedback that the questionnaire was unclear and difficult to understand, this could have influenced the results.
Responses and general comments
There were 20 respondents, of which 9 were senior staff (P-5 or above). The questions and the scale of rating 0, 1, 3 and 9 used for answering were, either very much at the high end (9 ratings) or at the low end (0-1 ratings). Three, ratings were not very often used. All the responds presented interlinks between customer and process criticality. However, there are some differences between the first two and responses from senior staff on what is business critical.
Top overall KPIs
The top overall KPIs was calculated as the average of the median results of the three ratings, (putting a preference to senior staff validation). The ratings present interdependencies between what is assumed important for the organization, timeliness of arrival both at port and in-country with low variances is rated high. On the other hand KPIs related to cost were not seen as important.
SCOP
Master Dissertation Project 49 FEUP/UN/WFP/LDU
Suggestions for SCO-team validation
The SCO-project team suggested the following KPI output to be tested for increasing the focus on WFP supply chain optimization, SCO team to advice the Jour Fixe.
o WFP operational service rate at port based on tonnage o WFP operational service rate at first warehouse in recipient country on tonnage o WFP HQ operational processing compared to standard o WFP operational loss o Total commodity delivery cost to first warehouse in recipient country
No. Measure Unit of measure
Critical for beneficiaries
Critical for
Business
Critical for
Process Control
3 Difference between Requested Time of Arrival (qt in tonnage) and Actual Time of Arrival at first warehouse in recipient country
Tons (Metric tons)
9 6 9
3B Difference between Requested Time of Arrival (qt in tonnage) and Actual Time of Arrival at port of discharge
Time in days
9 6 9
10 Difference between total procured and total delivered to first warehouse in recipient country
Tons (MT) 9 6 9
1B Difference between Requested Time of Arrival (for each delivery) and Actual Time of Arrival at port of discharge
Time in days
9 6 6
1 Difference between Requested Time of Arrival (for each delivery) and Actual Time of Arrival at first warehouse in recipient country
Time in days
9 3 9
9 Lead – time from port of discharge to arrival at first warehouse in recipient county
Time in days
9 2 3
11 Percentage of commodities (in tonnage) that arrive on time at first warehouse in recipient country
In Percentage
6 9 9
11B Percentage of commodities (in tonnage) that arrive on time at port of discharge
In Percentage
6 9 9
12B Percentage of commodities (in no of deliveries) that arrive on time at port of discharge
In Percentage
3 9 9
4 Total commodity delivered at first warehouse in recipient county
Tons (MT) 3 6 3
12 Percentage of commodities (in no of deliveries) that arrive on time at first warehouse in recipient country
In Percentage
3 5 3
8 Total overland handling cost in USD from port of discharge to first warehouse in recipient country
USD 2 3 3
5 Difference between Standard HQ Lead‐Time and actual lead‐times obtained by the Lead‐Time Tool as part of SCO Project
Time in days
1 3 9
2 Total commodity delivery cost to first warehouse in recipient country
USD 1 6 3
7 Variation of HQ lead‐times obtained by the Lead‐Time Tool as part of SCO Project
Time in days
0 6 3
6 Daily process cost, for each individual units to handle supply chain related matters (OMXP, OMLP and OMLS)
USD 0 3 3
Table 3 – KPI’s Results
SCOP
Master Dissertation Project 50 FEUP/UN/WFP/LDU
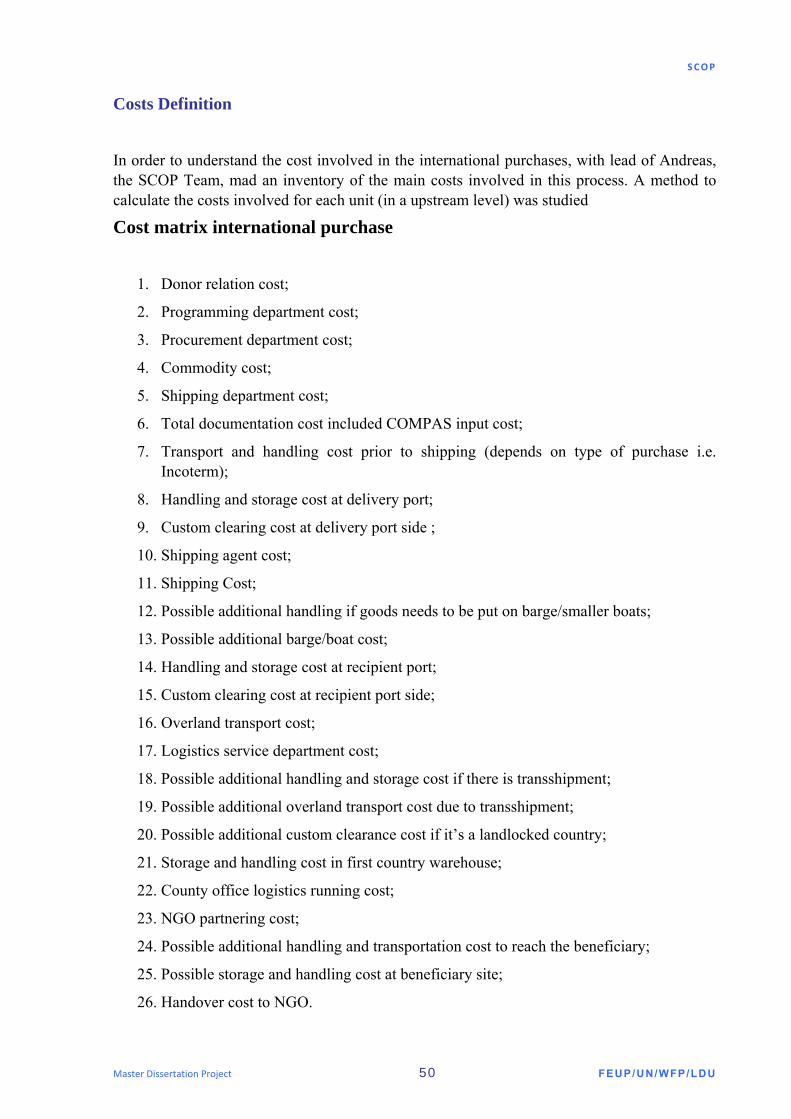
Costs Definition
In order to understand the cost involved in the international purchases, with lead of Andreas, the SCOP Team, mad an inventory of the main costs involved in this process. A method to calculate the costs involved for each unit (in a upstream level) was studied
Cost matrix international purchase
1. Donor relation cost;
2. Programming department cost;
3. Procurement department cost;
4. Commodity cost;
5. Shipping department cost;
6. Total documentation cost included COMPAS input cost;
7. Transport and handling cost prior to shipping (depends on type of purchase i.e. Incoterm);
8. Handling and storage cost at delivery port;
9. Custom clearing cost at delivery port side ;
10. Shipping agent cost;
11. Shipping Cost;
12. Possible additional handling if goods needs to be put on barge/smaller boats;
13. Possible additional barge/boat cost;
14. Handling and storage cost at recipient port;
15. Custom clearing cost at recipient port side;
16. Overland transport cost;
17. Logistics service department cost;
18. Possible additional handling and storage cost if there is transshipment;
19. Possible additional overland transport cost due to transshipment;
20. Possible additional custom clearance cost if it’s a landlocked country;
21. Storage and handling cost in first country warehouse;
22. County office logistics running cost;
23. NGO partnering cost;
24. Possible additional handling and transportation cost to reach the beneficiary;
25. Possible storage and handling cost at beneficiary site;
26. Handover cost to NGO.
SCOP
Master Dissertation Project 51 FEUP/UN/WFP/LDU
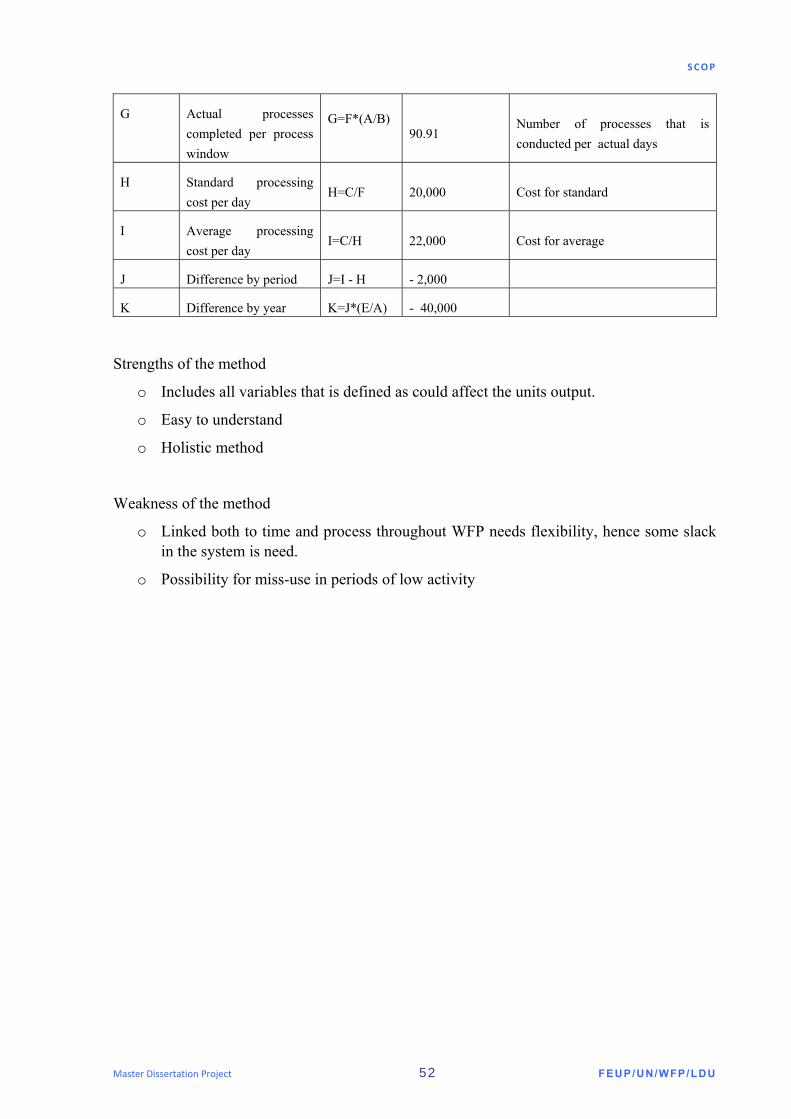
Calculation method for process cost evaluation
The ongoing WFP's Supply Chain Optimization Project has as one of its aims to maximize available resources, through the integration of programming, procurement, shipping and transport processes. Andreas developed a short brief that explains one calculation method for process/unit cost evaluation. SCO intends to present these methods in the upcoming Jour Fixe for the meeting to agree on. This method was discussed in the team and is still in discussion and will be submitted to approval after a final definition. The SCO team intends to present this method in the upcoming Jour Fixe for the meeting to agree on.
The method selected should be consistent and provide a somewhat complete picture of the unit’s performance. However, this being the first step in introducing operational KPIs it is needed to see beyond this metric alone. The unit cost evaluation can be viewed as a precursor and its implementation should help to ease the transition to a more complete set of operational KPIs.
Note, SCO would like too emphasise that to much focus on cost could lead to reduction in flexibility. Hence, complication in meeting the organizations goal: feeding the hungry poor in situations with multiple catastrophes. It is therefore important to see cost evaluation as one of the proposed metrics.
Cost calculation method (example):
Input variables
Calculations
Calculation name
Definition Formula Sample value Remarks
F Standard processes completed per process window
F=D/(E/A)
100.00
Average operating cost for each process including time aspect
Calculation name Definition
Sample value Remarks
A Standard 10 Standard Processing days as agreed upon
B Actual process days 11 Actual Processing days provided by LTT
C Total operational cost 2,000,000 Budget cost of unit
D Total nr process 2,000 Number of RRPRs/Pos/SIs conducted
E Total work days 200 Average standard workdays in a year
SCOP
Master Dissertation Project 52 FEUP/UN/WFP/LDU
G Actual processes completed per process window
G=F*(A/B)
90.91
Number of processes that is conducted per actual days
H Standard processing cost per day
H=C/F 20,000 Cost for standard
I Average processing cost per day
I=C/H 22,000 Cost for average
J Difference by period J=I - H - 2,000
K Difference by year K=J*(E/A) - 40,000
Strengths of the method
o Includes all variables that is defined as could affect the units output.
o Easy to understand
o Holistic method
Weakness of the method
o Linked both to time and process throughout WFP needs flexibility, hence some slack in the system is need.
o Possibility for miss-use in periods of low activity
SCOP
Master Dissertation Project 53 FEUP/UN/WFP/LDU
Table 4: Calculation method
Measurement System Definition
Data Source The data that is used to do the performance analyze of the supply chain, is imported from WINGS (SAP System), using the SAP Transaction code: ZRPPT. The extraction is downloaded into an Excel based sheet which will be the basis for the lead time information, analysis and calculations. Lead times will be calculated in Excel as differences between dates downloaded from WINGS.
The data present in this analysis was imported in 07 May of 2008, and contain records from 01 Jan 2007 until 31 May 2008.
Calculation Method
Definition of the boundaries for each unit to measure the Lead Times
Unit Starting Point Ending Point
OMXP RR or CD (the last one)
PR release date
OMLP PR release date PO release date
OMLS PO release date BL Date
Vessel Time BL Date ATA
RR: Resource Request Creation date; CD: Contribution Confirmation date; PR: Purchase Requisition release date; PO: Purchase order release date BL: Bill of Lading date (Vessel Departure); ATA: Actual Time of Arrival.
Figure 40 – Interface of the extraction toll
SCOP
Master Dissertation Project 54 FEUP/UN/WFP/LDU
Sample definition
The performance results are based on the data that are recorded in WINGS. This data could have some invalid values, like big numbers, that perturb a right analysis. So, In order to correctly measure the performance of the Lead times for each unit, three methods were used:
o 100% of the all sample;
o 90% of the best positive data (eliminating the worst 10% of the record data and the negative values);
o Fixed boundaries.
The first step to measure the system was to analyse all the data that were recorded in the system (100% of the sample). Interesting facts were found, described in the next phase. After this, two methods were developed, characterized by a different definition of the outliers. The analysis of these three methods is described in the analysis phase. In this phase a description of the method used and the achieved results is included.
100% of the sample
This method consists of taking the complete data sample as is, without rejecting any values. Off course we will find unrealistic values and related to that a disturbed performance. The goal is exactly that: identify the quantity of unrealistic numbers inside the system in order to study the reason of that and prepare the definition of the outliers.
Top 90%
This method consists of defining as outliers the values that are included in the worst 10% of the performance cases, between all positive numbers.
For that, the first step was rejected the negative numbers (they are less then 1%), and after, ranking the indicator to measure, for example the performance of OMXP, and with this reject the worst 10% cases.
This method was selected because until now, following the indication of the Boston Consulting Group - BCG, one current method consists of analyzing the top 90% of delayed cases. So in order to relate the previous analysis to the new one, this method was chosen.
Fixed Boundaries
This method consists of establishing a lower and upper limit, agreed by unit chiefs, that define what we should consider valid and not (if we have values upper then that value, we reject). The advantages and disadvantages will be discussed in the analysis phase.
For the lower limit, the boundary between positive and negative numbers was considered: rejecting all negative numbers including zero, that obliviously are wrong values inserted in the system. For the upper limit, in order to use the same criteria for all units, we established
SCOP
Master Dissertation Project 55 FEUP/UN/WFP/LDU
Tab 5:Steps to calculate the upper limit of the sample
one value that translates the tolerance period (in this case we established 30 days for working days and a correspondent 42 days for calendar days), that we assume to consider a valid value in the system, and after we correct this value by a correction factor, that adjust this value to his weight inside the chain.
Upper limit = standard Lead time + tolerance days + correction factor
Calculation of upper limit
(Working days)
Standard LT
Tolerance days
Correction factor9 Calculation Upper limit
OMXP 5 +30 5/42 5+30*(1+5/42) ≈40
OMLP 17 +30 17/42 17+30*(1+17/42) ≈60
OMLS 20 +30 20/42 20+30*(1+20/42) ≈66
HQ 42 +30 42/42+
5/42+17/42+20/42
42+30*(1+(42+5+17+20)/42)) ≈132
(Calendar days)
Standard LT
Tolerance days
Correction factor Calculation Upper limit
OMXP 7 +42 7/59 7+42*(1+7/59) ≈54
OMLP 24 +42 24/59 24+42*(1+24/59) ≈83
OMLS 28 +42 28/59 28+42*(1+28/59) ≈90
HQ
59 +42 59/59+
7/59+23/59+28/59
59+42*(1+(59+7+23+28/59)) ≈184
9 Explain that for the correction factor was considered its own "weight" (42 work. days or 59 cal days), but also the effect that the three parties (3 units) have in the final result (the HQ performance is the result of the
performance of the tree parts).
SCOP
Master Dissertation Project 56 FEUP/UN/WFP/LDU
Results What is necessary measure?
According the KPIs defined and the current indicators used until now to measure the performance of the WFP Supply chain, there are two main lines to measure:
1. HQ Unit/global process time performance;
2. Timeliness of cargo Delivery;
How to plot the data?
The way that the data is plotted is crucial in the interpretation of the results. Taking a sample, and playing with the way that we show the data, we can induce to incorrect analysis. It is necessary to be very precise in the way that the data is shown. Therefore, factors like coherency, transparency and accuracy were the main guide in this study.
To reply to this need, some changes were implemented in the way of measuring upstream level performance of the Supply chain. For instance, until now, all the performances (for all units) were measured taking as base the month that the PR occurred or the delivery occurred. This means that the PR month or the delivery month is fixed and, with that, all the performances, even those that happened in a different month, are viewed from that month. This way of measuring, as proved in the analysis, is not correct.
The present method to measure each unit’s performance consists of measuring the time when the process really happens, and not looking at a month when in fact the process did not occur. For instance for the procurement unit, the process starts when they have a Purchase Request -PR and finishes when they release a Purchase Order –PO, the performance should be shown by PO month, that is the month that they finish the process. It is similar for shipping, but now for the Release of the Shipping Instructions – SI.
Concluding this definition, the process is measured and posted in the month that it really happens. For each unit the month is defined by the last point of the process.
Therefore, to measure the performance, it is important to consider:
Programming PR month
Procurement PO month
Shipping BL date
Vessel Time ATA Month (delivery month)
Total Head Quarters Process BL date
ATA (Actual Time for Arrival)
ATA month (delivery month)
Services Rates (ATA vs RTA)
ATA month (delivery month)
Table 6 – Process to associate to the date to consider in the analyze
SCOP
Master Dissertation Project 57 FEUP/UN/WFP/LDU
Another indicator, which does not represent a performance measure but an indicator of management, is the RTA trend. In this case, the RTA is defined when a Request Requisition is created. Therefore, in order to see the RTA days that the Customers indicated “live”, the RTA should be analyzed for a RR month.
The majority of the charts presented here, reflect working days, because that makes the results more realistic (the units do not control the holidays and the weekends). Performances like the Vessel time, ATA or RTA are presented in calendar days because the vessel time needs to be in calendar days (the vessels do not stop in the ocean for a holiday). One extensive excel analysis was done, which offered the possibilities for different units to choose time (calendar or working days), and the possibility to filter the analysis for donor, recipient country, purchase group, etc.
Global indicators:
1. Delivery analysis
To define if the delivery is on time or delayed, it is necessary to analyze the difference between RTA and ATA, the difference between the request date and the actual date of delivery. If the ATA is inferior to the RTA, it means that the commodities were delivered inside the established date. If not, it means that there is a delay of x days (x=ATA-RTA)
100% of the sample and top 90%
Number of the deliveries that arrive in time and delayed:
Deliveries analysis
020406080
100120140160180
1 2 3 4 5 6 7 8 9 10 11 12 1 2 3 4 5
2007 2008
Date
No of Deliveries
In time
Delayed
Figure 41 – In time / delayed deliveries for 100% Figure 42 – In time / delayed deliveries for top 90%
Deliveries analysis
020406080
100120140160180
1 2 3 4 5 6 7 8 9 10 11 12 1 2 3 4 5
2007 2008
Date
No of Deliveries
In time
Delayed
Deliveries analysis
020406080
100120140160180
1 2 3 4 5 6 7 8 9 10 11 12 1 2 3 4 5
2007 2008
Date
No of Deliveries
In time
Delayed
Deliveries analysis
020406080
100120140160180
1 2 3 4 5 6 7 8 9 10 11 12 1 2 3 4 5
2007 2008
Date
No of Deliveries
In time
Delayed
SCOP
Master Dissertation Project 58 FEUP/UN/WFP/LDU
Considering that the volume of the deliveries is relevant, another analysis was conducted on the tonnages that arrive in time vs delayed.
Service rate
The service rate is a result of the ratio between the number of deliveries that arrive in time and the total number of deliveries.
Service rate = On time deliveries / total of deliveries
Deliveries Analysis by Tonnage
0200400600800
10001200
1 2 3 4 5 6 7 8 9 10 11 12 1 2 3 4 5
2007 2008
Date
Qua
ntity (ton
s)
In time
Delayed
Deliveries Analysis by Tonnage
0200400600800
10001200
1 2 3 4 5 6 7 8 9 10 11 12 1 2 3 4 5
2007 2008
Date
Qua
ntity (ton
s)
In time
Delayed
Figure 43 – In time / delayed food quantity ( 100%) Figure 44 – In time / delayed food quantity ( 100%)
Services Rates (Ontime Delivery In Pct)
0%20%40%60%80%100%
1 2 3 4 5 6 7 8 9 10 11 12 1 2 3 4 5
2007 2008
Month of delivery
100%
90%
Figure 45 – Services Rates of Supply Chain
SCOP
Master Dissertation Project 59 FEUP/UN/WFP/LDU
2. RTA trend
The RTA days is the number of days between the day that the customers request the commodities (RTA date) and the first point of the supply chain (note: it is the last one between the RR: Resource Request Creation date and the CD: Contribution Confirmation date)
100% of the sample
RTA Trendy = ‐0.5207x + 104.94
0
20
40
60
80
100
120
1 2 3 4 5 6 7 8 9 10 11 12 1 2 3 4 5 6
2007 2008
RR Month
Cal. Days
Figure 46 – RTA trend for 100% of the sample
0
200
400
600
800
1000
1200
-58
-27 3 34 64 95 125
156
186
217
247
278
309
339
370
400
431
461
492
522
553
583
614
645
675
706
736
767
797
828
858
889
919
950
981
1011
RTA c.days
Figure 47 – Histogram of the RTA 100% sample with statistical details
Figure 49 – Histogram of the RTA top 90% sample with statistical details
SCOP
Master Dissertation Project 61 FEUP/UN/WFP/LDU
3. ATA trend
The Actual Time of Arrival - ATA, gives the actual (real) number of days that WFP spends to deliver the commodities. It is the result from the difference between the ATA date and the first point of the chain (RR or CD).
100% of the sample
0
100
200
300
400
500
600
700
-62
-28 6 40 74 108
142
176
210
244
278
312
346
380
414
449
483
517
551
585
619
653
687
721
755
789
823
857
891
925
959
993
1027
ATA c.days
Figure 51 – Histogram of the ATA 100% sample with statistical details
ATA Trend
y = ‐0.4917x + 127.54
0
20
40
60
80
100
120
140
160
180
1 2 3 4 5 6 7 8 9 10 11 12 1 2 3 4 5
2007 2008
Delivery Date
Cal. Days
Figure 50 – ATA trend for the 100% of the sample
SCOP
Master Dissertation Project 62 FEUP/UN/WFP/LDU
Top 90%
Figure 53 – Histogram of the ATA top 90% sample with statistical details
0
20
40
60
80
100
120
140
160
180
2 8 15 21 27 34 40 47 53 59 66 72 78 85 91 97 104
110
117
123
129
136
142
148
155
161
167
174
180
186
193
199
ATA c.days
ATA Trendy = ‐0.1257x + 107.95
0
20
40
60
80
100
120
140
1 2 3 4 5 6 7 8 9 10 11 12 1 2 3 4 5
2007 2008
Delivery Date
Cal. Days
Figure 52 – ATA trend for the top 90%
SCOP
Master Dissertation Project 63 FEUP/UN/WFP/LDU
4. Units Performance
OMXP
100% of the sample
OMXP LT
y = ‐0.7904x + 20.119
05
101520253035
1 2 3 4 5 6 7 8 9 10 11 12 1 2 3 4 5 6
2007 2008
PR Month
Working
days
Figure 54 – OMXPLT trend for 100%
0
500
1000
1500
2000
0 19 39 58 77 97 116
135
155
174
193
212
232
251
270
290
309
328
348
367
386
406
425
444
464
483
502
521
541
560
579
599
618
637
657
OMXP w.days filter final
Figure 55 – OMXP Histogram 100% sample with statistical details
Figure 71 – Vessel time Histogram 100% sample with statistical details
SCOP
Master Dissertation Project 72 FEUP/UN/WFP/LDU
Top 90%
Shipping
y = ‐0.1118x + 30.288
05
10152025303540
1 2 3 4 5 6 7 8 9 10 11 12 1 2 3 4 5
2007 2008
Date
Cal. Days
Figure 72 – Vessel Time trend for top 90%
0
20
40
60
80
100
0.0
1.8
3.7
5.5
7.4
9.2
11.0
12.9
14.7
16.6
18.4
20.2
22.1
23.9
25.8
27.6
29.4
31.3
33.1
35.0
36.8
38.7
40.5
42.3
44.2
46.0
47.9
49.7
51.5
53.4
55.2
57.1
Vessel Time cal.days
Figure 73 – Vessel Time Histogram top 90% sample with statistical details
SCOP
Master Dissertation Project 73 FEUP/UN/WFP/LDU
5.3. Analysis Phase
Objectives
o Identify and Validate the root causes that assure the elimination of “real” root causes and thus the problem the team is focused on;
o Determine true sources of variation and potential failure modes that lead to customer dissatisfaction.
Main Activities
o Stratify Process;
o Stratify Data and identify specific Problem;
o Develop Problem Statement;
o Identify Root Causes;
o Design Root Causes Verification Analysis;
o Validate Root Causes;
o Comparative Analysis;
o Sources of variation Studies;
SCOP
Master Dissertation Project 74 FEUP/UN/WFP/LDU
Previous method vs New approach – the definition of outliers
Current methods
There were two current methods used to measure the performance of each unit. The first one consists of selecting the best 90% inside the delayed orders. This method consider for analysis the best 90% of the cases inside the period that is indicated and relate to the unit that we want analyze. After choosing the unit to analyze and the period to cover, the system makes a ranking of the lead times for each delivery and rejects the worst cases (10%). The data presented in this chart is filtered by ATA Date. This means that the months showed correspond to deliveries that occur in that month. All the performance results plotted consider the deliver month as the base of the analysis.
The other method considers all the data (100%) for analysis. The data is collected by selecting one time period, in this case the PR date, what means that the data plotted in this chart has a PR month as base (the date indicated in the chart corresponds to a month that the PR occurs and not the delivery).
The previous charts presented in the Jour-fixe do not follow the same approach (i.e. they are built with different methods: top 90% for delayed orders in an ATA monthly base and 100% for all orders in a PR monthly base). This lack of coherence could lead to a misconception of the performance.
In order to improve the measuring system, two methods were developed: top 90% and fixed boundaries. They already were defined. In this phase, I analyzed the two methods and compared them.
Figure 74 – Analysis to top 90% delayed orders in Work Days
Figure 75 – Analysis to 100% of the orders in cal days
SCOP
Master Dissertation Project 75 FEUP/UN/WFP/LDU
The top 90% method is simple and flexible but contains some weaknesses that sometimes negatively affect the results. If we take a big sample the results are reliably, but if the sample is, for example, equal or less than one month, the analysis could present some mistakes. Let us take, for example, January 2007. If we take the best 90%, we are left with lead times such as 66 or 69 working days and these should be considered wrong values. For the opposite way, if we look at April 2008, the best 90% are not counted with values like 19, 20 or 21 days, and we know that these values are not errors in the system.
Fixed Boundaries Method – A new approach
There are different routes to solve the problem. One way of eliminating the weaknesses mentioned above is establishing an upper limit, agreed by unit chiefs, that define what we should consider or not (if we have values upper then that value, we reject).
There are some advantages in adopting this method, which is based on one value that is established by the chiefs:
Independent of the size of the data;
(equal when we analyze one month, on day or one year)
o Independent of the performance: (2+3+4+5+90+100)=2+3+4+5+90 (with 90% the system count the 90 value) (2+3+4+5+90+100)=2+3+4+5 (with fixed boundaries)
o Agree by all players; (Bring trust in the calculations – we know what is behind the results)
o Coherent with the 2 whys of getting global performance (if we calculate the total HQ
lead Time by summing each unit lead time or by direct way: Vessel Departure-RR or Contribution Date, we get the same results, which does not happen with the 90 % method. It is also more coherent when we realize the breakdown from the HQ performance by units.
Percentage of data included in this method
Working days Calendar days Unit % of the sample Unit % of the sample
Table 7 – Percentage of the sample considered r in the Fixed Boundaries
SCOP
Master Dissertation Project 76 FEUP/UN/WFP/LDU
With the rule created for using the same criteria to establish the limits to cut, we can see that we follow a coherent line independent of the unit of measure or if it is in calendar days or working days.
Observing the results obtained by using the fixed boundaries method, we can say that the performance is very similar using both methods: 90% of sample size and fixed boundaries. Considering that both methods are valid, the differences are focused on the precision and how holistic the use. For small samples, like weekly or monthly analyzes, the fixed boundaries method is more precise but, in terms of flexibility, the 90% method is better.
Considering that it is crucial to win the trust for the measure and analysis system in HQ, we should improve the measure method. One possible solution is to adopt a system based on an agreed boundary to define the upper limit, and use that boundary to consider what is valid and not (and we get a more precise analysis). If not, the system use by default the best 90% (could be for example, applied for all local purchases). This is a hybrid solution.
HQ Lead Time for Cash and InternacionalPurchasesFrom RR/CD to BL date(Fixed Boundaries)
0
20
40
60
80
100
120
1 2 3 4 5 6 7 8 9 10 11 12 1 2 3 4 5
2007 2008
BL Month
Working
Days
Fix Bound
Top 90%
Figure 76 – Analysis to different methods: top 90% and fixed boundaries
SCOP
Master Dissertation Project 77 FEUP/UN/WFP/LDU
Differences Found Between the Results
In order to substantiate the performance reporting, as in the beginning of this study, I have initiated a validation on the existing measurement data within SCOP. This is done by conducting several analyses on the existing data to validate the basis of calculation and the extraction process of the indicators used. Based on this analysis, differences have been observed that lead to an adjustment in the performance of WFP HQ supply chain.
As is in the beginning of the study
During the Jour Fixe session of April 2008 (the monthly meeting between the units chiefs), the previous SCOP Team presented the trend of the HQ process lead time based in the previously obtained data. The data presented reveals an average reduction of 2.6 process days/month for the observed period of January 2007 to March 08. This is the trend that has been presented until this date. (Figure no. 77).
Problems found
The analysis was conducted due to some differences observed between the results presented in the previous jour-fixe and the performance observed when I conducted a quick validation on the raw data from WINGS.
This discrepancy led to an investigation of the current process used in the measurement of data. Upon further analysis, this led to a new result that demonstrates a different performance of HQ lead Times.
1- Different Sample size:
It was identified that the previous data sets used in all previous jour fixe sessions excluded some data for performance measurement calculation. The data presented in the Figure 78 represents the number of deliveries used to measure the performance between the 2 data sets: (1) in the Jour Fixe presentation over the previous phase and (2) the actual amount of data that is present in the corporate data
HQ Process Time for Int'l Purchases performedFrom RR/CD to BL date(100% Data)
0
20
40
60
80
100
120
1 2 3 4 5 6 7 8 9 10 11 12 1 2 3
2007 2008
Based on Month when PRs issued
Calendar Days
Figure 77 – HQ LT Performance presented previous
Sample size Difference(example from one year)
0
20
40
60
80
100
120
140
160
180
3 4 5 6 7 8 9 10 11 12 1 2
2007 2008
Quantity of Deliveries Record
Previous
Now
Figure 78 – Quantity of data that was consider in analyze
SCOP
Master Dissertation Project 78 FEUP/UN/WFP/LDU
recorded in WINGS. We can observe that for half of the period, the size of data used in the measurement differs quite significantly. This means that when we were showed the results of one month the analysis did not include all deliveries that factually happened in that month. The difference is results in the different service rates and lead time performance.
For this validation (different sample sizes), I collected two samples with the same characteristics for a period of one year. The first one represents the previous study that results in the improvement of 2.6 days (the Figure 77.) This data was obtained from a table that resumes the data plotted in the previous phase. The method used for collecting this data was validated by the previous team, and the number of deliveries (that are the sample size) are the result of the output of the Tableau de Board (a report of LTT). They show how many deliveries were done in time or delayed for every delivery month (100% of the data in the system for that month).
So, in order to compare the sample size, the new data was collected considering 100% of the data and for the month of delivery.
The study was conducted for one year (March 2007 to February 2008). This interval corresponds to the period in which we are able to cross-reference the old data and the new data.
One of the reasons that can lead to the wrong analysis is the possible bad collection of data to do the analysis. The sample size difference could well be caused by missing data due to the range settings of the extracted data from WINGS. Extraction from WINGS is done by setting the lead time range. The field that sets the boundary of data in the WINGS extraction screen refers to PR release date. In the previous phase, the data range was set on a short period and this resulted in some data being excluded from the sample, and any data updates made in WINGS in past period not being considered.
For example, in order to analyze the data, if it were established for the extraction of the data for a period for three months, this means that all PRs that are out of this range are excluded from the analysis.
Other possibilities were investigated, however none were consider valid.
Resolving the Problem
The solution for this is collecting the data for the ATA date and not for the PR. Also, it should be done by extraction over a long period of time, in order to update eventual changes in the system. It is also possible to do the extraction by PR month but it is necessary to extract for a long period of time (one year to be safe) and than measure the number of deliveries.
Figure 79 – Interface of the extraction tool
SCOP
Master Dissertation Project 79 FEUP/UN/WFP/LDU
2- Plot the Chart in a PR monthly base
In order to measure the performance of the several units, the HQ total process, and the Services Rates (deliveries in time vs delayed), the previous method takes the data extracted for a PR date and analyzes the performance measuring for corresponding processes times for each unit. This means that the PR month is fixed and “from there” (the PR month) the system looks forward and measures the others times that are inside the sample. For example, looking at the month of January 2008, this means that we are looking for the PR date happening in January, and for the processes that have a PR in January. Afterwards, we go forward and calculate the time that specific processes spend in procurement and in shipping, the sum of the tree being the HQ total time. These are the results plotted in the Figure 77.
What are the consequences of this?
The system provided for the last months of analysis good results (lower lead times). This happens because, for example, now in July 2008, if we go to the system and look at May 2008 (for instance to prepare the Jour-fixe of May), using this method that we are looking to the PR that happened in May, and the times that we have in the system for procurement are the faster purchases and for shipping are the faster shippings. As result of this, we will have for that month, a good performance for HQ. But, in fact, for the next month, if we update these values, we will see that for that month we have new values. As a result of this, we are counting 120 processes in programming for example: 80 in procurement, 50 in shipping and 20 in deliveries.
I call this method the “constant promises of improvement”, because every time that we run this chart, the output shows that in the last months (2/3) we are improving.
It is worthy to highlight the fact that, for the months of February, March, April and May, the performance increased significantly in the next times that we run the extraction and plot the charts. For those months, we will have the PR that now has a delivery associated (the slowest deliveries).
HQ Lead Time for Cash and InternacionalPurchasesFrom RR/CD to BL date
0
20
40
60
80
100
120
140
1 2 3 4 5 6 7 8 9 10 11 12 1 2 3 4 5
2007 2008
PR Month
Calendar Days
PreviousNow
Changes caused essential by the different size of sample
New promise
Performance update
Figure 80 – Comparing the previous and the new approach
SCOP
Master Dissertation Project 80 FEUP/UN/WFP/LDU
Resolve the Problem
To resolve this problem, it is necessary to extract the data by BL date and build the charts (i.e. group the data by month that the process finished (BL date) and not PR date). It is possible also to do the extraction by PR month but it is necessary to extract for a long period of time (one year to be safe) and, afterwards, to measure the performance, fixing the B/L month.
The new results
Based on the extraction of data from October 2006 to 30 May 2008, as already demonstrated for the same process (HQ total process time) we obtain the following actual performance as reflected in figure 81 (in contrast to the figure77).
Following the trend that shows the method of 90%, it is possible to see that, since January 2007, the performance improved slightly (0.2 days for month).
Avoiding the seasonal effects and looking at a one year period, for 2007, it was verified that the performance became worst by 0.3 days for month.
For June 2007 until May 2008, the performance improved with 0.6 days per month.
HQ Process Time For Int'l Purchases From CD/RR to BL
0
20
40
60
80
100
120
1 2 3 4 5 6 7 8 9 10 11 12 1 2 3 4 5
2007 2008Month based on B/L Release Date
W.Days
90%
Target
100%
Figure 81 – HQ LT New Performance From Jan 07 until May 2008
HQ Lead Time for Cash and InternacionalPurchasesFrom RR/CD to BL date(top90%)
y = 0.3118x + 53.635
0
20
40
60
80
100
120
1 2 3 4 5 6 7 8 9 10 11 12
2007
BL Month
Working
Days
Figure 82 – HQ LT New Performance for 2007
HQ Lead Time for Cash and InternacionalPurchasesFrom RR/CD to BL date(top90%)
y = ‐0.6585x + 58.272
0
20
40
60
80
100
120
6 7 8 9 10 11 12 1 2 3 4 5
2008
BL Month
Working Days
Figure 83 – HQ LT New Performance for the last one year period
SCOP
Master Dissertation Project 81 FEUP/UN/WFP/LDU
Import Parity Form - IPF
The IPF is an “instrument” that allows a CO to do an import parity exercise, indicating to HQ the chosen place to purchase the requested commodities and the motive of the choice.
This is created on an Excel file that the CO needs to complete and send to procurement to be approved. After appoval, the form is sent to programming in order to proceed with the request. (the form is included in the Appendics)
Based on the information available, the CO studies the best situation, looking at the prices (purchase and transport) and the times to get the food commodities from one place to another. With this, they indicate the best option. According to the money involved, the decision of approving the IPF needs to be taken from by HQ, RB or CO.
The problems associated to the IPF
The introduction of this form in August 2007, becoming mandatory in October 2007, triggered a big discussion inside the units. The main complaints consisted of two facts: first, the lack of understanding from the field on knowing how to complete the form correctly, resulting in several mistakes that needed to be corrected by HQ units; and the second is the increase of work that this new form represents.
Find the best possible sourcing alternative
Shipping Real overland transportation Origin #1: Int'l commodity price
Shipping Real overland transportation Origin #2: Int'l commodity price
Real overland transportation Regional commodity price
Local commodity price
Int'l procurement from
all available origins
Regional
procurement
Local procurem
ent
Figure 84 – The Import Parity Exercise
SCOP
Master Dissertation Project 82 FEUP/UN/WFP/LDU
A Root cause diagram was done in order to understand the real reason of the complaints.
Several root causes were identified as possible but all seemed significant. So this exercise was abandoned because we realized that first we needed to identify the real problem instead of finding the root for a “wrong” problem.
The data shows that, after an adaptation period, the performance of the two directly-involved units improved. The impact in OMLP is clear, being proven by the directed measure and by the trend. For programming, the direct measure shows that the performance became worst but the trend shows that, in October, the performance became better and more under control.
Figure 85 – IFP Root Causes analyze
OMLP Process PerformanceFrom PR to PO(Best 90%)
0
5
10
15
20
25
1 2 3 4 5 6 7 8 9 10 11 12 1 2 3 4 5
2007 2008
Wor
king
days
Figure 86 – The effect of IPF in OMLP
OMXP Process PerformanceFrom RR/CD to PR(Best 90%)
0
2
4
6
8
10
12
14
1 2 3 4 5 6 7 8 9 10 11 12 1 2 3 4 5
2007 2008
Wor
king
Day
s
Figure 87 – The effect of IPF in OMXP
SCOP
Master Dissertation Project 83 FEUP/UN/WFP/LDU
With this conclusion, despite the resistance showed with the introduction of the IPF, the form improves the process and, more than that, brings accountability for the parity exercise.
Taking the decision of maintaining the IPF, three scenarios were studied relating to the way of working with the IPF:
o 1st Scenario: Business as usual (no change);
o 2nd Scenario: Keeping the same process but introducing the new format of the IPF (the review form-see attachment);
o 3rd Scenario: Change the form and the process: the use of IPF starts at CO level and stops at CD’s (Country Director) signing. The connection between CO and OMXP / OMLP return to the best practice chosen for each unit.
New Form:
In the previous findings, the same fields that were redundant (repeated information) were identified. Some were not clear and some were never used. In a general way, this also referred to the fact that the main information highlighted doesn’t correspond to the choice that the CO made.
His is an automatically cell that indicate the best choice to do. But, could not be the option taken by the CO. So, for procurement that needs to check the IPF, this information don’t had value, but instead, bring confusion.
As a result of this analysis, the following changes are being introduced in the IPF:
1. Changing the excel form:
a) Cut the repeated information:
o Donor constraints (is repeated in the top and bottom);
o Check if the Fund and CRN is redundant or if both are necessary;
o “Timeliness”: the information inputted there is repeated in the additional comments;
Figure 88 – Detail of IPF
SCOP
Master Dissertation Project 84 FEUP/UN/WFP/LDU
b) Cut the unnecessary information: (never filled)
o “Minimum quantity ”;
o “Impact on the local/regional market “;
c) Cut confusing information:
o “Import parity recommendation:” this highlights information that is not useful (we do not choose by commodity price, but by total costs). Instead, it is better to put one conditional formula in the list of costs in order to highlight the minimum value inside the column of the costs. (it will not create more information, but help to analyze the information).
2. Changes suggested in the way of working with the IPF:
a) Standardize the IFP email subject. Following the suggestion of OMLP: include the name of country, name of regional bureau, fund number, name and quantity of commodity and type of purchase recommended;
b) Avoid repeating IPF for different donors or funds that have the same characteristics (requests, constrains, etc), include in the fill “Fund” or “CRN” the several funds or CRN’s. This option needs to be validated from a legal/bureaucracy point of view.
The new IPF is presented in the Appendices.
SCOP
Master Dissertation Project 85 FEUP/UN/WFP/LDU
Change the use of IPF (3rd Scenario)
Another possibility, closer to an ideal process of being a service provider, consists of using the IPF as an independent exercise, supported by information made available by headquarters, in order for the CO to make the best decision.
The main points that characterize this new process are:
o Using the IPF in a CO: This is a document that brings transparency and accountability; IPF used as a document to register the option that was chosen and send it to OMXP;
o The intervention from OMLP in the process, following the rules that define who has the authority to approve the values involved in the purchases (and not for all the IPF);
o To avoid extra work for Procurement and simplify the process, the OMLP needs to collect and publish a list of regional prices (like the FOB list published in the OMLP webpage) on the web.
Added value:
1. Faster process: it is not necessary to send the IPF to OMXP and to OMLP (for OMLP, it is just necessary follow the rule of who has authorization to order the purchase– which is related to the amount of the money involved);
2. Less work for OMXP and OMLP (the same for CO);
3. The CO has a document that gives transparency;
4. Increase of accountability in the process: inside the CO the responsibilities are identified;
5. This process contributes to the increase of the new concept of being a service provider, and consequently, develops a more agile Supply chain.
With the implementation of this new process, the result process should be:
CO consults the list of prices from OMLP (international, regional and local) and the shipping prices from the web and, with this, they fill out the IPF (the new version). After completing the IPF, the result is used to decide on the best option and the CO sends the request (qt, local to purchase, etc) to Programming. According to the rules of who has the authority to sign the purchase order, OMLP is either contacted, or not, to intervene in the process.
This discussion is still open and the decision needs to be taken at the senior level. This process is lead by the SCOP Team and occurs between Procurement and Programming.
SCOP
Master Dissertation Project 86 FEUP/UN/WFP/LDU
Information Management The main system to support information management in WFP is WINGS, which contains all information related to logistics.
WFP also has a system called COMPAS that allows getting more information on the downstream level: monitoring the progress of commodities from the moment first requested by field offices up to handover to implementing partners.
In order to organize the information recorded in the system in a way that answers the users’ needs (from a logistics point of view), two additional tools were developed: The Lead Time Tool (LTT) and The Overland Lead Time Tool (OLTT). These two tools allow capturing more details on the lead times between all the main points defined in the processes. For example, within the LTT details on the time between a PO (purchase order) and a SI (shipping Instruction) and for OLTT the time between the port of Douala and Chade.
Figure 89 – The Interface of Lead Time Tool ‐ LTT
OLTTOLTT
Figure 90 – The Interface of Overland Lead Time Tool ‐ OLTT
SCOP
Master Dissertation Project 87 FEUP/UN/WFP/LDU
Besides this, in the process more crucial information that is captured in different systems/places is necessary. For instance, the prices for buying commodities on the international markets are available through the Procurement web page. For regional and local markets prices are obtained in an “ad-hoc” way (through personal contact by phone or a specific document). For shipping rates, the information is available on the “Bulletin Board” (all WFP staff has access), etc.
As an example, the below visual depicts the necessary procedures for realization of obtaining information for the IPF:
The process to plan a simple request is not easy. It is necessary to invest a lot of time and sometimes the information is not updated or is obtained in an ad-hoc way.
For 2007 an average of 95 requests per month was identified, which means almost 5 requests per day. However, It was not measured how much time in average is necessary to complete the whole process of following through one request. But it is clear that by optimizing the information process, the time needed and percentage of mistakes in the manual procedure can be reduced.
At this moment this step is the bottleneck in the first phase of procedures in an up stream level.
Tools
LTT (field)
OLTT
Sources of information (Bulletin Board) FOB price list Minimum tender quantities HQ tender schedule Shipping rates Local food costs (RBs & COs) Overland transport costs (LTSH matrices)
Manuals
Supply chain optimization overview and
management of lead times and RTA
User guide lead time tool field (LTT – field)
Effectiveness of Ocean Transport
Effectiveness of Food Procurement
Import Parity Analysis
Sources of Information and Tools
WINGS
COMPAS
“ad-hoc”: Market prices Local Prices
Figure 91 – Information Sources and tools used in IFP
SCOP
Master Dissertation Project 88 FEUP/UN/WFP/LDU
To solve this problem a tool is being design. The goal is to group all information necessary in one place, online and easer to identify. This idea is developed in the improvement phase.
It’s also being study the possibility of insert in this tool a tracking system based on GIS - geographic information system. The concept of this new tool is being created at this moment. The goal is already defined: have a track system that allows identifying where WFP have the food in the moment and with that allow developing better planning.
Beyond that the idea is presented in a graphical way (for example like Google maps) some information is available in the information tool. For instance the possibilities roots between A and B and the costs associated.
After the presentation of this concept, the capacity to develop these faculties is being studied.
RTA management The available interval time to realize one delivery is given by the identification of the RTA – Requested time of Arrival date. This date is indicated when the request occurs. The number of days given in the RTA correspond with the number of days that WFP has available to delivery the food after receipt of the Resource Request (RR) or the Contribution Date (CD) in the system. This value is the RTA.
Until now, WFP Logistics sees the RTA as one of the main challenges to control. After this study, it can be stated that due to several facts no indication of a realistic and meaningful value for RTA days can be given.
Based on what can I affirm this?
Because of lack of understanding of the RTA with WFP Logistics staff in the field, a default value of 60 or 90 days is often inserted in the system. In fact analyzing a sample of 2,297 records in the system shows that 10% corresponds to 60 days, and 40% corresponds to 90 days.
This means that the Country Office (CO), independent of origin of the commodities indicates a request to deliver in 90 days.
What is the base of this problem?
At the start of this study, a root cause analysis was performed to understand the full context of this problem.
Several causes were identified, though two main causes identified that influence the situation highly and can be controlled are:
o Lack of understanding of the RTA concept in the field (Countries level);
o Inexistence of an information tool that combines all necessary information in an easy accessible way;
To solve this problem, the solutions that were studied are:
o Develop an information tool that combines all necessary information in one place (as for the IPF) in an easy accessible manner (tool developed in the improvement phase);
o Send a survey to the field to identify the real reason of lack of understanding on the RTA Concept.
Good RTA management
InformationSoftware system
Resources
Procedure
Poor access to info
Dose not meet users needs
Incorrect
Poor undersanding
Lack of trust
Bureaucratic processes
Lack of enforcement
Opposition to change
Poor Roll Out
Focus was not on SCO
Bad planning
Unclear purpose
Unclear guidelinesmethods
Not integrated
Not user friendly
Difficult to access
Unclear calculation method
No direct link
OLLT
Interface
LTT
Difficult to understand
To much output – not clear
Too many definitions
Concept unclear to users
Wrong data from source
Conflicting information
Poor data validation
Lack of staff
Lack of skills
No validation tools Poor training
Complicated interface
User do not know where the information is
No or late funding
Lack of training
Lack of committed and trained FP
Did not see the needRTA problem
Double work All info in bluebook - time
Focus on processes not on actual deliveries (ton)
Field need deliveries
HQ lack of field Understanding in
under developmentThree systems to use
Production constraints
Its not easy to access
Tools
Lack of KPIs
LTT
Download problem
Figure 93 – The Root Cause to RTA Management Problem
SCOP
Master Dissertation Project 90 FEUP/UN/WFP/LDU
Besides this direct solution to the problem, a new approach was discussed and is presented in this study.
New approach to the RTA management problem
Why are we not looking at this point from a total different angle? Question is: should WFP be this much focused on the existence of a bad indication of the RTA value? And give it so much importance?
The answer is no, and the next part of this study will illustrate this theory.
Until now WFP’s Head quarters considered solving this problem as essential in optimizing the supply chain. Several times the performance of the supply chain was identified as ‘bad’, based on unrealistic RTA.
I studied the impact of the variance of the RTA in the ATA (actual time of arrival). With this I wanted to detemine the impact that RTA management has on the WFP Performance. Basis question was: Is the WFP SC (supply chain) performance stable, controlled and independent of some external effects like RTA?
For this study I observed the impact that high RTA numbers (high in this case is more then 180 calendar days/6 months), have on the performance (ATA – number of days that WFP spend to deliver the food in the port of arrival).
The below chart depicts how the SC reacts to a high number of days for RTA.
RTA & ATA Big Numbers Perfil
051015202530354045
1 2 3 4 5 6 7 8 9 10 11 12 1 2 3 4 5
2007 2008
Date
No of records
RTA
ATA
Figure 94 – The influence of the RTA in the ATA
SCOP
Master Dissertation Project 91 FEUP/UN/WFP/LDU
If the CO inserts a high RTA value in the system (which happens for example often in October and November) WFP’s performance reduced even though there was more time to plan the requests.
This proves that WFP is dependent on the type of request and Doesn’t act like a service provider that usually has a standard, controlled way of operating.
A logistics company usually defines what it can do for a client. What is the quantity that can be transported and how much time is needed to transport from A to B.
If a customer wants to transport from China to Portugal in 1 hour and a company obviously is not able to meet this request, it doesn’t mean that the company is incompetent.
And…. If a client catches a taxi and asks how much time is needed to travel from A to B, the answer is C. Faster than C will be more expensive and there is a risk of not being able to meet the request. This is not the responsibility of the driver.
WFP should use the same principle. A first step would be to define the best practices in doing business followed by defining a system. For this the characteristics (time, costs, etc from A to B) for the business need to be defined and a system to measure these characteristics needs to be implemented. If a company delivers from A to B in y days with a cost of z$, and WFP delivers from the same points (A to B) with 2y days and 2z$ the WFP performance is worst and vice versa.
How to apply this model in WFP?
1. Define the WFP Supply chain:
a. How much time does WFP need to transport from A to B, considering all A and B positions;
b. What are the cost from A to B;
c. What are WFP resources: what are the limits? WFP can operate between these parameters (for instance distances and quantity of requests for month) with x performance.
2. Define with the client the WFP conditions/responsibility: WFP can transport from A to B in x time (delivery on x). If delivered after that time, it is considered a delay. If delivered within less days, that is considered a good performance. The emergency cases should be measured separately, as they should be looked at from a different perspective: from a scenario of what is the best that WFP can do.
In order to develop these two elements it is necessary to change the culture within WFP and to develop some tools to allow/support staff members to work with this new approach.
As a first step in element 1, a Service Catalog is being built. I was involved in the definition of the structure of this catalog.
SCOP
Master Dissertation Project 92 FEUP/UN/WFP/LDU
The proposed structure was:
Service Catalog Structure 1. Introduction
a. What is;
b. Motivation/importance to use;
c. The WFP/OML commitment;
2. Custumers profile
a. Describe the custumers;
b. Identify the benefits for the custumers;
c. The interface/relation between custumers and WFP;
3. Services
a. Name
b. Global Description
c. Characteristics/Specifications
i. Costs;
ii. Lead Times with the interval of confidence level;
iii. Others: start point and end point; (for example: load and discharge
point;
iv. Delivery: (for example, the logistics don’t discharge the trucks; the ..
delivery the information by email, etc)
v. Extra services provide; (for example we offer manuals to explain…,
guaranty of quality of the goods delivery)
vi. Requirements for the custumers; (for example, paying in one month)
vii. Availability;
d. Service Manager
i. Contact;
4. Contacts – general
Annex:
Table with the summary of the services – fast consult
Table with the summary of the contacts – fast consult
Figure 95 – Service Catalog Structure
SCOP
Master Dissertation Project 93 FEUP/UN/WFP/LDU
To address the second element (WFP’s conditions/responsibilities), the solution proposed is to have a automatic IPF that - according to the destination and the type and quantity of food - provides automatically the time and the cost associated (f.e. WFP could provide the top 5 options from which the user chose one). The user should have the possibility to change the choice into a more unrealistic one, but will need to justify why and the request will be identified as “emergency”. These cases will afterwards be analyzed and an intervention, for instance for chronic cases is studied.
SCOP
Master Dissertation Project 94 FEUP/UN/WFP/LDU
5.4. Improve Phase
Objectives
o Identify, evaluate and select the right improvement solutions;
o Develop a change management approach to assist the organization in adapting to the changes introduced though solution implementation.
Main Activities
o Design of Experiments;
o Generate solution Ideas;
o Determine Solution Impacts: Benefits;
o Evaluate and select solutions;
o Develop Process Maps & High Level Plan;
o Develop and Present Storyboard;
o Communicate solutions to all stakeholders;
o Develop Pilot Plan and pilot Solution.
SCOP
Master Dissertation Project 95 FEUP/UN/WFP/LDU
At the moment of finalization of this study, the current project (Supply Chain Optimization = SCOP) is completing the 3 first six sigma phases: Define, Measure and Analyze. For the Improve and Control phase, a strategy of intervention is being drafted. However, several achievements and improvements already occurred. In addition a draft document on what and how to control the process was created.
Some of the improvements achieved were described in the first part of this document. For these improvements I will limit the content to a summary and avoid repetition of information.
A correct measure system The base of a successful study/analysis is a solid validation of data. It is only possible to identify a problem correctly and come to the improvement/right solution if correct data are available. It is important to work with correct information and not based on assumptions.
This base was not available before, and is related to organizational culture. An example for this: based on results of a questionnaire, it was confirmed that senior staff did not give importance to cost calculation. Another point to mention is that the methodology to measure performance was not coherent and correct. As a result of this incorrect measure system, some of the chiefs lost trust in the numbers presented. For example, at the start of the project the Chief of Programming was not present during the chiefs meeting related to the Supply Chain discussion (“jour-fixe”). When asked for the reason, he mentioned that the numbers used for the project did not reflect reality, so he did not see the point of attending a meeting to discuss facts that are not true.
After defining and validating all data and defining a new methodology to measure, the results were presented to the Director of WFP Logistics. The Director seconded the results achieved and approved of the proposal for the next phases.
A new method for measuring performance was defined and the base to recover trust of the users is being built. Now the time is ready to start correct analysis of the real root causes of the problems (based on data and not assumptions).
SCOP
Master Dissertation Project 96 FEUP/UN/WFP/LDU
The new dimensions to measure
The method to calculate performance was described before. However, it is even more important to define how to analyze the results.
For this reason two additional dimensions related to unit performance, were added to the lead time results.
A unit might be able to improve lead times, but can still be less efficient. How? For instance, if there is a need to do double work with the same resources (no. of staff).
Therefore it is important to analyze also the volume of work and the resources available to perform the work.
Regarding the example of the programming unit, the output proposed is:
The number of staff is still to be defined. For this example, an illustrative value for the numbers or staff was used.
Another dimension that was proposed to present is the business implications.
Having a bad or a good performance has implications. Which implications can be defined?
For example the Head Quarter process was calculated with a percentage that implies bad performance (Lead Time upper the target: 42 working days). The result was 20%.
Figure 96 – The new dimension in the performance analysis
SCOP
Master Dissertation Project 97 FEUP/UN/WFP/LDU
What are the implications of this 20% of bad performance from Jan 2007 until June 2008?
Considering the following numbers:
o procurement, 2.1 million tones of cash purchases (27% of international purchases/HQ procurement – that are included in this study),
o official numbers of WFP, the 81.6 millions of beneficiaries,
A projection of these numbers for the 1st semester of 2008 (data for 2008 not available), results in the following numbers: 15.93 Million of beneficiaries potentially affected by and 160.650 MT involved in the 20% of bad performance (represented in red in the following chart)
The financial implication can not be defined due to absence of information on budget of the units (except for procurement) and is waiting validation of the method of cost implications presented in the measure phase by the chiefs of the units. For the financial dimension it is necessary to develop a study together with the chiefs of the units. This should happen in the next phase.
Figure 97 – The business implications
SCOP
Master Dissertation Project 98 FEUP/UN/WFP/LDU
IPF review
The IPF, as previously demonstrated, represents a problem that needs to be solved. For short term improvement a new form is being developed. The aim of this form is to simplify the process. The current status is that the form needs to be validated by the programming unit before it can be implemented.
The 3rd scenario presented (the use of the IPF just on CO level) is in preparation for a later phase. At this moment this scenario is under consideration and discussion within the SCOP Team, contemplating a complete new way of leading the IPF.
However, an ideal process was identified: An automatic IPF.
This idea consists of developing an IPF that asks the user for the destiny of the commodities, the type of commodities, the quantity and the constrains for the donor or the reception country. With this information, the IPF presents automatically the top 5 options with indications of time and price for each option. The development of this form will result in a considerable improvement of the supply chain. It will speed up the process and eliminate the involvement of manual work, so less staff involved. The current process to check one IPF, consists of consulting several sources of information which results in an increased time to process and therefore, an increased number of staff involved.
Actual Process:
Main differences:
Manual IPF Automatic IPF Many steps
Many Staff involved Some mistakes (manual process)
Many Time
One step Less staff ff involved
Less Time
Figure 98 – IPF sources of Information and tools
SCOP
Master Dissertation Project 99 FEUP/UN/WFP/LDU
What is essential to develop this automatic IPF?
o To develop a tool that synchronizes the lead times based on the existing information in WINGS and captures the prices introduced in a table provided by shipping and procurement;
o To standardize the information involved: names of the commodities, type of constrains, etc;
o A weekly update (or another time base) of procurement and shipping lists of prices involved;
o To train the users.
Integrated tool The study confirmed several times that information management is part of the root cause for the problems found. WFP is a hugh humanitarian agency and this has consequences. Logistics consists of several units and because of that the quantity of created information is enormous. Sometimes this results in duplication of information. But looking at it from a different angle, a big gap exists between the information available and the information needed in the field and at head quarters level to be able to measure, analyze and follow the processes. It is necessary to initiate a change of organizational culture, to organize the existing information and start collecting/creating missing information .
Addressing this need is a big challenge. In order to achieve WFP Logistics’ goal for 2011 - to become the logistics service provider of choice for WFP and the wider Humanitarian Community - it is essential that WFP Logistics uses correct and complete information systems that allow quantifying all resources involved in the performance, measuring the lead times and tracking the process and commodities in time.
To meet this need, implementation of an integrated tool is planned. The main goal is to collect all necessary information for the users in one place (a web-based application) including a group of ‘alarm indicators’ on the main processes that can help the users to better plan the supply chain. Like a “Dashboard”.
A tracking system, based on GIS technology (geographic information system) is also being study. This system aims to be an information-gathering and tracking system that unites all operational departments involved from confirmed contribution to at first warehouse in recipient country.
SCOP
Master Dissertation Project 100 FEUP/UN/WFP/LDU
The situation as-is
The actual trend of HQ performance, taking the period of jan 07 to June 2008, is -0.26 days per month. Extrapolating this to the end of 2009, this means that the previous target (42 days) will not be achieved. In addition two other scenarios were studied: performance improvement of 10% and 20%.
As analyzed above, it is necessary to proceed the changes in the process to maintain at least the current/established target.
Figure 99 – Simulation of HW LT Improvement
)
SCOP
Master Dissertation Project 101 FEUP/UN/WFP/LDU
5.5. Control Phase
The present study didn’t achieve the control phase correspondent to a six sigma approach.
In SCOP, is planning realize this phase in the 2010.
Related to this thesis, I describe after what should be done in this phase.
Objectives proposed
o Understand the importance of planning and executing against the plan;
o Determine the approach to be taken to assure achievement of the targeted results;
o Understand how to disseminate lessons learned;
o Identify replication and standardization opportunities/processes and develop related plans.
Main Activities suggested
o Verify reduction in Root Cause Sigma Improvement resulted from solution;
o Identify whether additional Solutions are necessary to achieve goal;
o Identify and Develop Replication and standardization opportunities;
o Integrate and Manage Solutions in Daily Work Processes;
o Integrate Lessons learned;
o Identify Teams next steps and plans for remaining Opportunities.
SCOP
Master Dissertation Project 102 FEUP/UN/WFP/LDU
6. Results and Discussion
Following the six sigma approach, almost all results and the discussion were done during all the phases. Because of that, in this section I will produce a summary table of all the results achieved and the points discussed.
6.1. Summary Table:
Results Discussion New Measure Method During this study it was identified that the measure method
used before presented several mistakes which didn’t translate the corrected performance of the supply chain.
Because of this, first was developed a investigation of the root of the problem funded, and after, developed two new methods of measure. The differences between the two are in the way that the outliers are defined. For the “top 90%”, the negative numbers and the 10% worst records in the sample are consider outliers. The “Fixed Boundaries” method, established fixed limits to define an outlier. These limits presented consider the study of the behaviour of the system and follow the same criterion of all systems to measure.
This improvement will bring trust in the results for the users, and are the solid base needed to start a correct analysis and with this define a strategy to improve.
Identification of KPI’s As result of the questionnaires filed by the Headquarters staff, special senior staff, we identified the Key points that should be measured:
o WFP operational service rate at port based on tonnage;
o WFP operational service rate at first; warehouse in recipient country on tonnage;
o WFP HQ operational processing compared to standard;
o WFP operational loss;
o Total commodity delivery cost to first warehouse in recipient country.
Interesting to understand that the HQ is not so focused on the resources that are spent (money involved and time to process upstream) but more in the fact whether WFP delivery is before the date indicated for the CO. They are also more concerned in the downstream level than in the upstream.
SCOP
Master Dissertation Project 103 FEUP/UN/WFP/LDU
New dimensions of analyze
In order to have a better understanding of the lead-time performance for each unit, two dew dimensions were added: the volume of work and the resources (staff) that were used in the process.
With these new dimensions it will be possible to better evaluate the correct performance and correctly diagnose the problems.
For the Headquarters global performance were also added two new dimensions corresponding to the business implications caused by a bad performance: the number of potential beneficiaries affected and the tonnage of the food involved in the bad performance. These new dimensions help to identify the direct consequences of a bad performance. They are part of the new culture that needs to exist, which consists of being more precise.
Costs implications A first method to determine the costs implications was started. The objective is to be capable of quantifying the opportunity loss and the bad performance in USD value.
Determining a method that can link the performance and the money involved is urgent. With that it is possible to say: “if WFP improves by 10% it will win x USD”. Or “this 20% of bad performance means y USD loss”.
The method indicated, allows to obtain a raff number. The dimension of the WFP, and the fact that the organization doesn’t have this culture, brings difficult to obtain numbers like the budget for the units, or the number of the staff directed connected to the processes. It is not easy and needs time. It is suggested that a new study to analyse this dimension should occur.
Integrated tool During this study it was identified that the information management represents one of the main roots to several problems.
Because of this, a concept was developed for a tool that was presented to the director of logistics. The idea was approved with a support of $100,000 USD to develop this tool.
The implementation of this tool will bring improvements in every process (upstream and downstream) and will give the necessary support to the users to develop better SC planning.
Until this moment the idea has been established: put all the information necessary (now the existent is in several sources) in one place (web location). The new method to measure will be the background for the performance indicators. The next steps
SCOP
Master Dissertation Project 104 FEUP/UN/WFP/LDU
is to work together with all players involved: Programming, Procurement, Shipping, Field Support Unit (the voice of the “clients”), and together identify the best way to produce the information necessary.
Track System - GIS The concept of this new tool is being created at this moment. The goal is already defined: have a track system that allows to identify where WFP have the food in the moment and with that allow to develop better planning.
Beyond that the idea is presented in a graphical way (for example like Google maps) some information is available in the information tool. For instance the possibilities roots between A and B and the costs associated.
After the presentation of this concept, the capacity to develop these faculties is being studied.
IPF review The IPF is viewed for the units as an obstacle in the process. To simplify this step a new form was created. It is a renewed form considering the feedback of the units. The duplicate and unused information was taken from the form, and the existent was rearranged to simplify the form.
IFP Automatic Consider that the information necessary to do the IPF is distributed for several sources, and a new concept for the IPF was created.
The actual process requires a long time to realize and sometimes result in some mistakes. An introduction of an automatic form will introduce a considerable simplification of the process and a decrease of the time used, bringing added value to the SC.
To develop this idea is necessary to identify the requirements necessary for the software system and with that define the implications for the units (for instance: submit on a weekly basis the list of the prices).
After this identification, the same should be submitted to the approval of the director.
RTA Management A new idea was presented in this study about this point. WFP should define the characteristics of the SC (times and costs from A to B), and the users should do the requests according to the constraints presented. The performance of WFP SC should not be measured according to “unrealistic requests” but instead for that use the standard performance.
SCOP
Master Dissertation Project 105 FEUP/UN/WFP/LDU
UP-stream Management style
Until now in order to analyse the upstream processes the chiefs have a monthly meeting: the “Jour-Fixe”. During the phase correspondence to this study, the programming chief was not present at all meetings. In fact that disturbs the rest of the other units, because the programming unit corresponds to the first step of the chain. If the units are not together, it is difficult to create an integrated concept that is the basis to improvement.
The root cause for this behaviour was the disbelief on the numbers presented in that meeting.
With the new methods, it is expected to recover the trust of the units in the numbers presented, and with this, start a model where all the players sit together to resolve the problem.
If this didn’t happen in a voluntary way, a high-level position should be taken. The union between all the departments involved in the SC is crucial to achieve good results.
Another point, also discussed concerning the change of culture: The units should think like a service provider. For example, Procurement should provide the users with the necessary information: prices, rules, etc in a standard and easy way to avoid the usual “ad-hoc” intervention. It Is necessary to smooth the process, and hence the role of each unit should be clear. An example of this, is the confusion that the field of the IPF is now facing. After this clarification of roles, it is expected that the boundaries of intervention should be more rigid. This will put the process more fluent.
Service catalogue I also have the opportunity to work in the service catalogue that is partly linked to the concept presented here. The service catalogue structure is defined. This part of my work is included in another project that pretends to develop some tools related to this new concept of WFP becoming a service provider.
SCOP
Master Dissertation Project 106 FEUP/UN/WFP/LDU
6.2. Compare with the market
If WFP achieves 100% success in the performance, (i.e. all deliveries processed in less than 42 working days -- upstream), is it in fact a good performance? Is 42 working days good or bad?
And, how many resources can WFP spend to have that performance? WFP can delivery from A to B in 5 days, but if $500,000 USD is spent to that, and another company spends $10, 000 USD is it also a bad performance?
To answer this question, first measure WFP indicators (and for that, this study almost indicates the steps to do it), and after benchmark other companies, identify the same indicators and study at the same time the best practices.
This last exercise is very complex. Who should be benchmarked? WFP is not a normal company. The fact of working with donations and operators in hostile places, completely changes the rules of the game. It is a complex exercise, but totally necessary and urgent. It should be one of the next steps and realized for an external company.
SCOR - Supply-Chain Operations Reference-model A good model that was identified, that could bring add value to WFP SC, is the SCOR. It could be a good way to learn how to bring from the private sector the best practices to the humanitarian sector.
The Supply-Chain Operations Reference-model (SCOR) is the product of the Supply-Chain Council (SCC), with membership open to all companies and organizations interested in applying and advancing the state-of-the-art in supply-chain management systems and practices.
The SCOR-model captures the Council’s consensus view of supply chain management. While much of the underlying content of the Model has been used by practitioners for many years, the SCOR-model provides a unique framework that links business process, metrics, best practices and technology features into a unified structure to support communication among supply chain partners and to improve the effectiveness of supply chain management and related supply chain improvement activities. The following of the model is similar to the next steps identified in this study. For that, it seems a good model to follow.
SCOP
Master Dissertation Project 107 FEUP/UN/WFP/LDU
6.3. External interference
An important topic to highlight, not mentioned until now, is the control of the starting point, and by that, I mean the donation process, and of the end point, the field.
Is difficult planning if there is any money, and also, all the planning can fail if the food arrive and the conditions in the field are different than before (for example if the political situation change or if the security situation change).
These are two main external points that affect the upstream process. Improve this two points would mean to reduce the variables in the system. Reducing these variables may bring to do a better planning.
Strategically Advanced founds
A new Business Model was already studied to be introduce in WFP, but it was not successfully implemented. The goal, as we can see in the next chart done by BCG, was to adjust the timing between the income money and the requirements.
Figure 100 – Cross‐functional framework of SCOR (from SCOR overview doc in Supply Chain council website)
SCOP
Master Dissertation Project 108 FEUP/UN/WFP/LDU
It is a difficult exercise. Also because if WFP uses money in advance, it means that it start replying before the donor gives the money, and normally the Donor gives the money because he sees that there is a need that be met. So using money in advance could imply losing capacity to attract donations.
It is necessary to develop an advanced study on about this issue. The main goal is to stabilize the income money in-flow process in order to be able to forecast the budget and with that do a better planning. What WFP logistics should do is to ensure to be ready when the contribution is confirmed.
Apart from this, there should be a closer relation between the logistics department and the Found razing department. This approximation could lead to a better planning, by increasing the advanced information to Logistics about the incoming donations. With that logistics, could be prepare in advance for the income work.
Down stream analyze - Roll out to the field
So far, this project was not focused on the downstream level. However, some points have been discussed.
There is room for optimization. It Is easy to identify the lack of planning and communication between the RB and CO. It Is necessary to identify warehouses, corridors, etc. and to design a better process by developing possible synergies between the actual resources and the needs.
Figure 101 – Difference between income money and the requirements by BCG
SCOP
Master Dissertation Project 109 FEUP/UN/WFP/LDU
Points discussed: The pipeline officer
Changing OML too become the humanitarian logistics provider off choice, requires a change in mentality and of doing business. The starting point of WFP operations is the pipeline manager. If this role is not conducted properly WFP starts its operations with a handicap. Hence, it is key that the role is conducted in a way that provides support for all business units that relay on this role.
The solution project by the SCOP Team requires a change in the Terms of Reference. However, instead of building on the pipeline manager concept this approach involves rethinking the entire role. If correctly done, there should be a possibility to optimize operation, and reduce and even diminish the handicap that is experienced to day.
The concept of this change was drafted for my colleague Andreas and I was responsible to draft the new ToR. The solution drafted is a creation of a Supply Chain Officer that has the responsibility, skills and authority to manage either the CO or RBs supply chain. Positive aspects of this solution:
o Clear chain of command;
o Possibility for higher flexibility;
o Possibility for increased Speed;
o Correct skill set;
o Increases planning, increases horizon by providing feasible and meaningful RTA;
o Meet customers needs: Output and usability is equal to customer needs since the person should have the skills to understand internal as well as external SC requirement.
The main challenges related to this solution:
o Time constraint, changing the positions into the role of SC mangers would take time;
o Complexity constraint, train and develop the management skills to become SC officer is complex;
o Costly, training and development has a cost;
o Change constraint, typically persons on general resists changes.
This solution requires as the challenges suggest time, money and developing human resources. Quantifying cost on either is difficult since the progress is on a concept stage. However, as the concepts get into more detailed it would be easier to quantify.
This solution creates room for improved speed. Second, it creates higher flexibility. Hence this could help reach the OML goal of becoming the preferred humanitarian logistics provider easier.
SCOP
Master Dissertation Project 110 FEUP/UN/WFP/LDU
6.4. Next steps
Immediate Actions (Define, Measure and Analysis)
Identified Issues Proposed Solutions for H2/2008
(Q3 unless otherwise stated)
Poor RTA Management o Roll-out of revised import parity form
o Change of process & responsibility for import parityexercise
o Supply Chain information tool (up to Q4)
Lack of performancemonitoring
(Basics for dashboard)
o Supply Chain Dashboard Preparations
o Correction on existing performance indicators
o Establish business implication calculations by service units
o Review and revise current performance standard (HQ)
o Monthly performance reporting to Director + Chiefs
Lack of buy-in o Obtain support from project sponsor & champions
o Introduce new practices (including corrections)
SCOP Team SkillsDevelopment
o Training For SCOP Team on SCOR Model
Preparation for roll-out o White paper : Transformation of supply chain to valuechain
o Validation of WFP W2 SC Processes to SCOR Model (Q4)
o Global SCOR KPI Framework – (Q4)
The Change. (Analysis, Improve and Control)
Identified Issues Proposed Solutions for 2009
The ‘’black hole’’ in the field o Roll-out in 3-5 pilot corridors (To be selected)
o SCO Awareness session (during RLM) x 6#
o Phased Roll-out by regions
o Support and Follow up (Travels)
No operational dashboard o Propose to implement through DELIVER project(inclusive of Non-food items) (Q1-Q3)
Non chaos-tolerant and non-standard supply chain model
o Alignment of HRD + Cluster processes towards SCOR Model (Quick wins as WINGS II just rolledout and related to NFI Tracking developments)(Q1/2)
SCOP
Master Dissertation Project 111 FEUP/UN/WFP/LDU
6.5. Six Sigma roadmap on SCOP
2008 (PREPS, DEFINE, MEASURE)
o Supply chain business needs survey
o White Paper : Supply Chain Value Chain Transformation
o Integrating SC IS, Field roll-out preps and pipeline management streamlining
o Alignment of internal WFP supply chain processes & KPIs to SCOR Model
2009 (MEASURE, ANALYSIS, IMPROVE)
o Alignment of (Cluster + HRD) supply chain processes to SCOR Model
o Pilot corridor selection and implementation
o WFP Supply Chain Dashboard Development
o Phased roll-out by regions
o Analysis and reporting of improvements
2010 (CONTROL)
o Mainstream of processes – business control mode (Related to competence centre paper)
o Project Closure
SCOP
Master Dissertation Project 112 FEUP/UN/WFP/LDU
7. Conclusion
7.1. Project point of view
WFP has now to face one of its, perhaps, biggest challenges ever.
The UN reform, that brings a new “market” for WFP, the increase of the food and fuel prices, and the increase of natural disasters, represent a difficult conjuncture to overcome.
WFP has the strength, the will and the capacity to answer this challenge. During this study, I found, more than people with technical knowledge. People that are concerned in what they are doing, people that at the end of the day think: “the work I did today will bring some added value to the people that we have to feed10”. This attitude, together with technical capacity and team spirit is the formula to achieve the target.
LDU, as a team, is focused on this change. Bring a new way of thinking and act, characterized by professionalism and team spirit.
SCOP is part of this change. Improving the SC is improving WFP. “We Delivery” is WFP slogan. The quality of this delivery service is the image of the organization.
This study shows the first steps towards a new phase of improvement in WFP SC.
The background to start a new approach is set. A measure model was defined and based in correct data and not assumptions, an analysis was started to find the real causes underneath the problems. Beyond that, a bunch of new ideas were presented. Some have already been approved and started.
This study was focused on the upstream processes, on the international and cash purchases and on the distribution.
Starting from the “top” is the correct approach. It Is necessary to start from the top and, after, go trough all the parts and, according to the strategy established, do the necessary changes. Is a top-down approach.
For the 3.3 million tons of food deliveries in 2007, 1.2 were in kind and 2.1 were purchases by WFP from cash donations. From this 2.1 millions, 27% correspond to Headquarters purchases. The other 73% were processed in the field with the support and orientation of the headquarters.
10 Temmy Tanubrata in a comment about the personal work
SCOP
Master Dissertation Project 113 FEUP/UN/WFP/LDU
This means that there is a lot of work to do. But after defining what has to be done, and identifying a successful case, it is easier to achieve the scope: WFP internal SC has to be the service provider in the humanitarian sector.
7.2. Academic point of view The realization of this study made me develop several Learning Elements.
Main achievements:
o Gain knowledge in approaches to improve supply chain performance;
o Gain knowledge in the six-sigma methodology;
o Understand the concepts, methods and tools applied in Supply Chain;
o Management in a humanitarian operation context;
o Experience the challenges of working in a no-profit organisation;
o Study of statistical tools and supply chain principles
o Working on my own requiring minimum supervision;
o Improve in the preparation of presentations and develop correct writing skills;
o Be an efficient team player;
o Develop a cognitive capacity and ability to research and analyze large volumes of information.
To finish, I would like to mention the added value that this kind of collaboration between my university and the UN can bring for all the players involved. More than the change of scientifically knowledge is the fact of showing a student that his knowledge can be useful in a practical way for the human being. This learning acquired at an important age, and inserted in a educational environment, could generate a multiplicative factor in terms of develop better principles in our society.
BBiillaatteerraall
CClluusstteerr
UUNNHHRRDD HHuummaanniittaarriiaann
SSuuppppllyy CChhaaiinn
DDoowwnn
ssttrreeaamm
WWFFPP
SSuuppppllyy CChhaaiinn
SSccooppee
LLooccaall
RReegg
IInntt’’llCCaasshh
IInn--kkiinndd
UUpp
ssttrreeaamm
CCoommmmooddiittiieess SSoouurrccee
Figure 102 – The current scope of the project
SCOP
Master Dissertation Project 114 FEUP/UN/WFP/LDU
8. References
Beamon B. M. and Kotleba S. A. (2006) “Inventory modelling for complex emergencies in humanitarian relief operations”, International Journal of Logistics: research and Applications, Vol. 9, No 1, March 2006, 1 – 18
Beamon, B.M. (1999), "Measuring supply chain performance", International Journal of Operations & Production Management, Vol. 19 No. 3, pp. 75-92.
Caplice C. (2003) “Lectures 2 & 3, ESD 260, fall 2003” MIT open coursewaive, MIT
Caplice C. and Sheffi Y. (1995) “A Review and Evaluation of Logistics Performance Management Systems”. International Journal of Logistics Management, 6(1):61-74, 1995
Christopher M. (2000). The Agile Supply Chain. Industrial Marketing Management, 29,pp- 37-44.
Duclos L. K., Vokurka R. J. and Lummus R. R. (2003)”A conceptual model of supply chain flexibility” Industrial Management + Data Systems. Wembley: 2003.Vol.103, Iss. 5/6; p. 446 (11 pages)
Fisher, M.L., Raman, A. and McClelland, A.S. (2000), "Rocket science retailing is almost here - are you ready?", Harvard Business Review, Vol. 78 No. 4, pp. 115-24.
Frei F. X., Kalakota, R., Leone, A. J. and Marx L. M. (1999) Process variation as a determinant of bank performance: Evidence from the retail banking study”. Management Science, 45(9), 1210-1220.
Gavirneni S. (2002) “Information flows in capacitated supply chains with fixed ordering costs” Management Science. Linthicum: May 2002. Vol. 48, Iss. 5; p. 644 (8 pages) Available from: ProQuest Direct, ABI Inform Global [Accessed 18 November 2005]
Gulati R., Nohria N. and Zaheer A. (2000) “Strategic networks”, Strategic Management Journal, vol. 21.no. 3, pp. 203-215 Available from: ProQuest Direct, ABI Inform Global [Accessed 18 November 2005]
Gwendolyn W. and Landeros R. (2006) “Supplier Diversity Effectiveness: Does Organizational Culture Really Matter?” The Journal of Supply Chain Management 42 (4), 16–28. Ha A. Y., Li L. and Ng SM. (2003) ” Price and delivery logistics competition in a supply chain” Management Science. Linthicum: Sep 2003. Vol. 49, Iss. 9; p. 1139 Available from: ProQuest
Harrison A. and Van Hoek R. (2005) "Logistics Management and strategy 2nd edition", Prentice Hall - Financial Times
Harvey, D. (2001), Competing in Collaborative Economy, Business Intelligence, London
Hendricks K. B. and Singhal V. R. (2005) “An Empirical Analysis of the Effect of Supply Chain Disruptions on Long-Run Strategy” Production and Operations Management. Spring 2005; 14, 1; ABI/INFORM Global pg. 35
SCOP
Master Dissertation Project 115 FEUP/UN/WFP/LDU
Hiebelar, R., Kelly, T.B. and Katteman, C. (1998), Best Practices Building Your Business with Customer-Focussed Solutions, Simon and Schuster, New York, NY
Hill T. (2000) Operations Management, 3rd éd., Macmillan, Basingstoke.
Holmstrom J. (1997) “Product range management: a case study of supply chain operations in the European grocery industry”. Supply Chain Management. Bradford: 1997.Vol.2, Iss. 3; pg. 107
Hoopes D. G., Madsen T. L. and Walker G. (2003) “Guest editors' introduction to the special issue: Why is there a resource-based view? Toward a theory of competitive heterogeneity”. Strategic Management Journal. Chichester: Oct 2003. Vol. 24, Iss. 10; p. 889
Horne T., and Brown D. L. (1991) “Bridging organizations and sustainable development”, Human Relations, vol. 44, no. 8, pp. 807-832 Available from: ProQuest Direct, ABI Inform Global [Accessed 18 November 2005]
Horvath L. (2001) “Collaboration: the key to value creation in supply chain management”, International Journal Supply Chain Management, Dec 2001, Volume: 6 Issue: 5 Page: 205 - 207
Hum S-H. and Sim H-H. (1996) Time-based competition: literature review and implications for modelling. International Journal of Operations & Production Management. Bradford: 1996. Vol. 16, Iss. 1; p. 75
Ko, E., Kincade, D. and Brown, J.R. (2000), "Impact of business type upon the adoption of quick response technologies: the apparel industry experience", International Journal of Operations & Production Management, Vol. 20 No. 9, pp. 1093-111.
Koudal P. and Lavieri T. (2003) ”Profits in the balance” Optimize. Manhasset: Jun 2003. p. 81 Available from: ProQuest Direct, ABI Inform Global [Accessed 18 November 2005]
Kyro P. (2004) “Benchmarking as an action research process”. Benchmarking. Bradford: 2004. Vol. 11, Iss. 1; p. 52
Lambert D. M., Cooper M. C. and Pagh J. D. (1998) “Supply chain management: Implementation issues and research opportunities”. International Journal of Logistics Management. Ponte Vedra Beach: 1998. Vol. 9, Iss. 2; p. 1 (19 pages)
Lee H. L. (2002) “Aligning Supply Chain Strategies with Product Uncertainties”. California Management Review, vol. 44, n. 3, pp. 105-119.
Lee H. L. (2004) "The Triple-A Supply Chain" Harvard Business Review, Vol. 82, No.10, October 2004. Available from: Classfronter, Molde University College [Accessed 19 November 2005]
Lei D., Slocum Jr. J. W. and Pitts R. A. (1997) “Building cooperative advantage: Managing strategic alliances to promote organizational learning”, Journal of World Business, vol. 32, no. 3. pp. 203-223. Available from: ProQuest Direct, ABI Inform Global [Accessed 18 November 2005]
Mayer K. J. and Nickerson, J. A. (2005) “Antecedents and performance implications of contracting for knowledge workers: Evidence from information technology services”. Organization Science, 16(3), 225-242.
Milgate M. (2001) Supply chain complexity and delivery performance: An international exploratory” Supply Chain Management; 2001; 6, 3/4; ABI/INFORM Global pg. 106
SCOP
Master Dissertation Project 116 FEUP/UN/WFP/LDU
Mintzberg H. (1979) The Structuring of Organizations. A Synthesis of the Research, Prentice-Hall, Englewood Cliffs, NJ
Neve J. M. and Crossland P. P. (1989) “From Push To Pull: Improving The Productivity Of An Integrated Circuit Manufacturing Line” National Productivity Review 8,1; pg. 35,
Olsson N. O. E. (2006) “Management of flexibility in projects”, International Journal of Project Management 24 (2006) 66 - 74
Pettit S. and Beresford A. (2005). “Emergency relief logistics: an evaluation of military, non-military and composite response models”, International Journal of Logistics: Research and Applications, Vol. 8, No. 4, December 2005, 313 – 331
Pine J. II (1992) “Mass Customization: The New Frontier in Business Competition”. Harvard Business School Press (November 1992)
Porter M E (1985) “Competitive Strategy: Techniques for Analyzing Industries and Competitors” The Free Press New York, NY.
Rao K. S. and Wadhwa S. (2002) ” Understanding Flexibility in Supply Chains: A Conceptual Framework and Models” Global Journal of Flexible Systems Management. Delhi: Dec 2002. Vol. 3, Iss. 4; p. 1 (12 pages)
Saibal R. Ph.D (2001) “Lead time management in supply chains” University of Waterloo (Canada), [Online], 2001, 210 pages; AAT NQ65257, Waterloo, Ontario, Canada Available from
Samii R. and Van Wassenhove L. (2004) “The United Nations Joint Logistics Center – An Operational and Conceptual Inter – Agency Logistics Platform” INSEADcase, Fontainebleau, France 05/2004-5213
Sánchez A. M. and Manuela Pérez M. P. (2005) Supply chain flexibility and firm performance: A conceptual model and empiric. International Journal of Operations & Production Management; 2005; 25, 7/8; ABI/INFORM Global
Sehl A., Kristensen T., Savosnick C. and Olsen E. (2006) ”Management Response Tsunami evaluation” Tsunami report working group – Input from head office. NRC. Oslo. Final draft 21.02.2006
Shenhar A. J. (2001) “One size does not fit all projects: Exploring classical contingency domains”. Management Science; Mar 2001; 47, 3; ABI/INFORM Global pg. 394
Sodhi M. S. (2003) “How to do strategic supply-chain planning”. MIT Sloan Management Review. Cambridge: Fall 2003. Vol. 45, Iss. 1; p. 69
Stackhouse A. (2007) “Disaster Management: Private Lessons for the Public Sector”. Supply Chain Management Review. New York: Jan 2007. Vol. 11, Iss. 1; p. 50
Thomas A. S. and Kopczak L. R. (2005) “From logistics to supply chain management: the path forward in the humanitarian sector”. Fritz Institute
Tomasini R. M. and Van Wassenhove L. (2004) “A Framework to Unravel, Prioritize and Coordinate Vulnerability and Complexity Factors Affection a Humanitarian Operation” INSEAD Working Paper Series, 2004/41/TM, Fontainebleau, France 2004
United Nations (2006) “The Millennium Development Goals Report 2006”, New York 2006
SCOP
Master Dissertation Project 117 FEUP/UN/WFP/LDU
Van Wassenhove L. N. (2006) “Blackett Memorial Lecture – Humanitarian aid logistics: supply chain management in high gear”, Journal of the Operational Research Society, Vol. 57, No. 5, 2006, 475 - 489
Wanke P.F. and Zinn W. (2004) “Strategic logistics decision making” International Journal of Physical Distribution & Logistics Management. Bradford: 2004. Vol. 34, Iss. 6; p. 466
Wijngaard J., de Vries J. and Nauta A. (2006) “Performers and performance – how to investigate the contribution of the operational network to operational performance”, International Journal of Operations & Production Management, Vol. 26 NO. 4, 2006 pp. 394 -411
World Food Programmme (WFP) 2007 “WFP in Statistics 2007”, Rome 2008
World Food Programme (2005) “BUSINESS PROCESS REVIEW: PROGRESS REPORT ON IMPLEMENTATION”, Executive Board Annual Session
World Food Programme (2007) “Food Distribution Guidelines”, internal document, intranet version
Yeo K. T. and Ning J. H. (2002) “Integrating supply chain and critical chain concepts in engineer-produce-construct (EPC) projects”, International Journal of Project Management 22 (2004) 19 - 31
The Six Sigma Handbook: 2008 [Consult. 12-04-2008]. In: <http://books.google.it/books?hl=en&id=ly7iBGNVGe8C&dq=six-sigma&printsec=frontcover&source=web&ots=T8XdvYUoqy&sig=KX48CPhmAdFf_VAYS-95L5bKs9E&sa=X&oi=book_result&resnum=4&ct=result#PPA151,M1>
Wikipedia: 2008 [Consult. 21-05-2008]. In: <http://en.wikipedia.org/wiki/Un> and <http://en.wikipedia.org/wiki/Wfp>
SCOP
Master Dissertation Project 118 FEUP/UN/WFP/LDU
9. Figures and Tables
Figure 1– New facilities in FEUP
Figure 2 – Exhibition with projects Developed by FEUP
Figure 3 – UN Logo
Figure 4 – UN New York Head Quarters
Figure 5 – Beneficiaries in a natural disaster
Figure 6 – Actors in a Humanitarian Assistance
Figure 7 – UN Structure in the field
Figure 8 – Interaction with other players
Figure 9 – UN Structure in Integrated Missions
Figure 10 – WFP Logo
Figure 11 – United Nations C – 130 Hercules
Figure 12 – WFP Logistics Core Process
Figure 13 – WFP Logistics structure
Figure 14 – WFP Logistics Core Process
Figure 15 – Logistics Business plan implications
Figure 16 – Time evolution of the type of intervention implications
Figure 17 – Pyramid of Needs
Figure 18 – Hierarchy of Physiological needs
Figure 19 – Pull/push system according the type of intervention
Figure 20 – Type of support with time
Figure 21 – The WFP presence in world
Figure 22 – The emergence response. The 5 HRD.
Figure 23 – WFP Partners
Figure 24 – Possible delivery Places (Designed by BCG)
Figure 25 – The SC in WFP
Figure 26 – UP stream and Downstream concept
Figure 27 – Illustration of Type of arrival
Figure 28 – The main processes to measure upstream
Figure 29 – Tableau the Board inside the LTT
Figure 30 – A report from LTT about reasons for delays
Figure 31 – 1st Chart presented in the March 2008 “Jour-Fixe”
Figure 32 – 2sd Chart presented in the March 2008 “Jour-Fixe”
SCOP
Master Dissertation Project 119 FEUP/UN/WFP/LDU
Figure 33 – 3rd Chart presented in the March 2008 “Jour-Fixe”
Figure 34 – Six sigma method
Figure 35 – Six-sigma goal
Figure 36 – 6Sigma Control
Figure 37 – Six-sigma Phases
Figure 38 – Six-sigma roles
Figure 39 – Key Points in WFP SC
Figure 40 – Interface of the extraction toll
Figure 41 – In time / delayed deliveries for 100%
Figure 42 – In time / delayed deliveries for top 90%
Figure 43 – In time / delayed food quantity (100%)
Figure 44 – In time / delayed food quantity (100%)
Figure 45 – Services Rates of Supply Chain
Figure 46 – RTA trend for 100% of the sample
Figure 47 – Histogram of the RTA 100% sample with statistical details
Figure 48 – RTA trend for the top 90%
Figure 49 – Histogram of the RTA top 90% sample with statistical details
Figure 50 – ATA trend for the 100% of the sample
Figure 51 – Histogram of the ATA 100% sample with statistical details
Figure 52 – ATA trend for the top 90%
Figure 53 – Histogram of the ATA top 90% sample with statistical details
Figure 54 – OMXPLT trend for 100%
Figure 55 – OMXP Histogram 100% sample with statistical details
Figure 56 – OMXPLT trend for top90%
Figure 57 – OMXP Histogram top 90% sample with statistical details
Figure 58 – OMLP LT trend for 100%
Figure 59 – OMLP Histogram 100% sample with statistical details
Figure 60 – OMLP LT trend for top 90%
Figure 61 – OMLP Histogram top90% sample with statistical details
Figure 62 – OMLS LT trend for 100%
Figure 63– OMLS Histogram 100% sample with statistical details
Figure 64 – OMLS LT trend for Top 90%
Figure 65 – OMXLS Histogram top 90% sample with statistical details
Figure 66 – HQ LT trend for 100%
SCOP
Master Dissertation Project 120 FEUP/UN/WFP/LDU
Figure 67 – HQ Histogram 100% sample with statistical details
Figure 68 – HQ LT trend for Top 90%
Figure 69– HQ Histogram top 90% sample with statistical details
Figure 70 – Vessel time trend for 100%
Figure 71 – Vessel time Histogram 100% sample with statistical details
Figure 72– Vessel Time trend for top 90%
Figure 73 – Vessel Time Histogram top 90% sample with statistical details
Figure 74 – Analysis to top 90% delayed orders in Work Days
Figure 75 – Analysis to 100% of the orders in cal days
Figure 76 – Analysis to different methods: top 90% and fixed boundaries 100% of the orders in cal days
Figure 77 – HQ LT Performance presented previous
Figure 78 – Quantity of data that was consider in analyze
Figure 79 – Interface of the extraction tool
Figure 80 – Comparing the previous and the new approach
Figure 81 – HQ LT New Performance From Jan 07 until May 2008
Figure 82 – HQ LT New Performance for 2007
Figure 83 – HQ LT New Performance for the last one year period
Figure 84 – The Import Parity Exercise
Figure 85 – IFP Root Causes analyse
Figure 86 – The effect of IPF in OMLP
Figure 87 – The effect of IPF in OMXP
Figure 88 – Detail of IPF
Figure 89 – The Interface of Lead Time Tool - LTT
Figure 90 – The Interface of Overland Lead Time Tool - OLTT
Figure 91 – Information Sources and tools used in IFP
Figure 92 – RTA Characterization
Figure 93 – The Root Cause to RTA Management Problem
Figure 94 – The influence of the RTA in the ATA
Figure 95 – Service Catalog Structure
Figure 96 – The new dimensions in the performance analysis
Figure 97 – The business implications
Figure 98 – IPF sources of Information and tools
Figure 99 – Simulation of HW LT Improvement
SCOP
Master Dissertation Project 121 FEUP/UN/WFP/LDU
Figure 100 – Cross-functional framework of SCOR (from SCOR overview doc in Supply Chain council website)
Figure 101 – Difference between income money and the requirements
Figure 102 – The current scope of the project
Figure 103 – Map of World Hunger. (from WFP website)
Figure 104 – The Regional Bureaus and the Counties Offices O that WFP have
Figure 105 – WFP Organigram
Figure 106 – Operations and Management Department
Figure 107 – Food aid is unloaded from a WFP helicopter amid wintry snow conditions in Pakistan's Central Highlands, ready for distribution to survivors of the 2005 Pakistan earthquake (Copyright: 2006 WFP/Keith Ursel)
Figure 108 – UN humanitarian convoy, organised by WFP, winds through the hills of southern Lebanon during the 2006 crisis (Copyright: 2006 WFP/Marco Frattini )
Figure 109 – Boxes of WFP's high-energy biscuits are handed down from trucks in Ngozi, Burundi (Copyright: 2005 WFP/Maxime Bessieres
Figure 110 – Process Map for OMXP
Figure 111 – Process Map for OMLP part1
Figure 112 – Process Map for OMLP part 2
Figure 113 – Process Map for OMLS part1: Linear vessel
Figure 114 – Process Map for OMLS part2: linear vessel
Figure 115 – Process Map for OMLS part1: Charter vessel
Figure 116 – Process Map for OMLS part2: Charter vessel
Figure 117 – The previous IPF
Figure 118 – The new IPF
Tables
Table 1 – 2008 Programme of Work (WFP docusture)
Table 2 – Main activities for Six-sigma
Table 3 – KPI’s Results
Table 4 – Calculation method
Tab 5 – Steps to calculate the upper limit of the sample
Table 6 – Process to associate to the date to consider in the analyze
Table 7 – Percentage of the sample consider in the Fixed Boundaries Method
SCOP
Master Dissertation Project 122 FEUP/UN/WFP/LDU
10. Appendices
SCOP
Master Dissertation Project 123 FEUP/UN/WFP/LDU
Appendice A - Map of hunger
Figure 103 – Map of World Hunger. (From WFP website)
Panama CityBoliviaColombiaCubaDominican Rep.Ecuador El SalvadorGuatemalaHaitiHondurasNicaraguaPeru
OMCRegional BureauCairo
OMBRegional Bureau
Bangkok
OMPRegional BureauPanama
City
OMJRegional Bureau
Johannesburg
OMDRegional BureauDakar
OMSRegional Bureau Sudan
OMURegional
Administration Office
Dubai
Figure 104 – The Regional Bureaus and the Counties Offices O that WFP
SCOP
Master Dissertation Project 125 FEUP/UN/WFP/LDU
Appendice C – Acronyms ART Anti-Retroviral Treatment CFW Cash for Work CO(s) Country Office(s) EMMA Emergency Markets Mitigation Account EMOP Emergency Operation FFW Food for Work HQ WFP Headquarters MCHN Mother and Child Health and Nutrition MDG Millennium Development Goals NGOs Non-Governmental Organisations OMXD Programme Design Service OMXF Food Security Analysis Service OMXP Programming Service OMXR Operational Reporting and Analysis Branch OVC Orphan and Vulnerable Children PLW Pregnant and Lactating Women PLWHA People Living With HIV/AIDS RB(s) Regional Bureau(x) REG WFP Government Donor Relations Division SLM Sustainable Land Management UN United Nations WFP World Food Programme
SCOP
Master Dissertation Project 126 FEUP/UN/WFP/LDU
Appendice D – WFP Organigram
WFP
Executive DirectorOSD
Inspector General and Oversight
Services Division
OMOperations and Management Department
REExternal Affairs
and Resource Development Department
OMMManagement
Services Division
OMIInformation and Communication
s Technology Division
OMHHuman
Resources Division
OEDCCommunications
and Public Policy Strategy
Division
RERExternal Relations
Division
REBExecutive Board
Secretariat
REGGovernment
Donor Relations Division
REPPrivate Donor
Relations Division
OEDEOffice of
Evaluation
OMLLogistics
Division
OMCRegional
Bureau Cairo
OMBRegional Bureau
Bangkok
OMPRegional
Bureau Panama City
OMSRegional
Bureau Sudan
OMXProgramme Design and
Support Division
OMDRegional
Bureau Dakar
FLFinance and Legal
Division
FLAFinancial
Accounting
FLTTreasury and
Payments
FLBBudget and Financial Planning
OEDPPolicy, Planning
and Strategy Division
FLLLegal Services
OMJRegional Bureau
Johannesburg
OEDOOffice of the Ombudsman
OMFField Security
Division
OMURegional
Administration Office Dubai
OEDOffice of Executive Director
OEDXEthics Office
OEDHOffice of Hunger
Solutions
OMW2PWings II Project
Figure 105 ‐WFP Organigram
OMMPGoods & Services
ProcurementBranch
OMIADevelopment and
Business Relations Branch
OMMAAdministrative
Services & TravelBranch
OMMHHQ Security
Branch
OMMIInfrastructure &
Facilities Management Branch
OMOperations and Management
Department
OMMManagement
Services Division
OMIInformation &
Communications Technology
Division
OMHHuman Resources
Division
OMXProgramme
Design & Support Division
OMFField Security
Division
OMHPPolicy Branch
OMHOOperations Branch
OMHIInformation Support
Branch
OMHDStaff Development and Performance
Branch
OMHRRecruitment and
Reassignment Branch
OMIEEmergency
Coordination Branch
OMIPArchitecture, Policy and Strategy Branch
OMICCompetence Center
OMIMAdministration and
Finance Branch
OMISOperations and Services Branch
OMLAAviation Branch
OMLLLogistics Branch
OMLSShipping Branch
OMLLogistics Division
UNJLCUN Joint Logistics
Centre
OMLPFood Procurement
Branch
OMXROperational
Reporting and Analysis Branch
OMXXPreparedness Branch
OMXDProgramme Design
Service
OMXFFood Security
Analysis Service
OMXPProgramming
Service
OMHSStaff Relations
Branch
OMW2PWINGS II Project
Figure 106 – Operations and Management Department
SCOP
Master Dissertation Project 127 FEUP/UN/WFP/LDU
Appendice E - WFP emergency rations
WFP emergency rations
Full WFP rations take into account what the local population cook and eat, but a typical food basket consists of a variety of basic food items (cereals, oils and pulses) and, possibly, additional foods known as complementary food items (meat or fish, vegetables and fruit, fortified cereal blends, sugar, condiments). The latter enhance nutritional adequacy and palatability Proteins should provide 10-12 percent (60 grammes) and fat at least 17 percent of the energy (40g)
In the early stages of emergencies, when basic cooking facilities are in short supply, WFP uses high energy biscuits, rich in micro-nutrients, to meet food needs
SCOP
Master Dissertation Project 128 FEUP/UN/WFP/LDU
Appendice F - Structure of a WFP country office
At a minimum, a country office is made up of a country director, administration, finance and programme staff. The number of staff and their individual duties will vary according to the size and nature of the WFP intervention, which is itself dependent on local circumstances and the amount of funding available to the country office. A more complex operation may also include the following staff: a deputy country director; logistics, procurement, security, ICT and/or public affairs officers; and a variety of field operations services staff with specific responsibilities for air operations, monitoring, radio operations, site operations, warehouse management and/or workshop/fleet operations.
Generally, a country office is made up of a main office, usually in the capital of the country where WFP is providing assistance, and a number of sub-offices located at strategic positions across the country to supervise food-distribution sites.
The WFP country director is responsible for overseeing that a WFP operation is managed effectively, alongside national authorities and NGO partners. The country director will coordinate WFP’s programmes and activities in the country with that of other United Nations agencies, donors, and NGOs and promote joint programming whenever possible.
Sub-offices are generally headed by programme staff who are responsible for planning, implementing and coordinating WFP programme activities at sub-office level. The head of a sub-office will identify potential cooperating partners and, after consultation with the main office, agree to partner, as appropriate. In close collaboration with local or de facto authorities, the head of a sub-office will also identify potential areas of intervention for WFP and work closely with international and local NGOs in addition to United Nations agencies, donors, beneficiaries and food pipeline agencies to harmonize and coordinate ongoing and future food-aid activities.
NGO staff will mainly be in contact with programme staff (at a sub-office or main office) for issues related to the implementation of a project (such as project design, distribution, monitoring and evaluation); logistics staff in the country for issues concerning the receipt of commodities; and finance staff for any issues related to payments.
SCOP
Master Dissertation Project 129 FEUP/UN/WFP/LDU
Appendice G - WFP's programmes – details
WFP's programmes fall into four main categories:
1. Emergency operations: response to disasters from natural or human causes;
2. Protracted relief and rehabilitation operations: recovery after a crisis;
3. Country programme and development activities: food aid for social and economic development;
4. Special operations: logistics to speed up the movement of food aid.
1. Emergency operations
When a disaster – from natural or human causes – occurs anywhere in the world and the government of the affected country11 makes an official request for WFP food aid, WFP will consider an allocation of WFP emergency food aid if:
o food aid is an appropriate response to the particular local situation;
o supply of the required food aid has not already been assured from other sources;
o timely delivery of that aid to the intended beneficiaries is possible.
WFP's emergency operations cover four main kinds of emergency:
1. sudden disasters: natural or man-made disasters which affect food access and/or cause population displacements;
2. slow-onset disasters: such as drought and crop failure;
3. refugee crises (in close collaboration with UNHCR);
4. complex emergencies: involving elements such as conflict, widespread social and economic disruption, and requiring special United Nations coordination procedures. 11 WFP's provision of emergency food aid and associated logistics support and non‐food items is dependent on:
o a request from the government or the United Nations Secretary‐General; and o the availability of multilateral resources and/or specific donor support for the country and
situation concerned. All states that are members of the United Nations, or are members or associate members of any United Nations specialized agency, are eligible to submit requests for WFP emergency aid.
o Priority is given to requests from low‐income, food‐deficit countries (LIFDCs). o Requests from other countries are considered in the light of the resources at their disposal and
the scale of the disaster. o In general,WFP imports bulk commodities (particularly cereals) as emergency food aid only
when there is an overall national food (cereal) deficit and/or no practical possibility of moving available in‐country surpluses into the affected area.
SCOP
Master Dissertation Project 130 FEUP/UN/WFP/LDU
In such situations WFP will, try to “save lives” and prevent deterioration of nutritional status – through general ration distribution as well as selective feeding activities, and by seeking to ensure an appropriate food basket in terms of quantity and quality.
2. Protracted relief and rehabilitation operations
Once WFP food aid has addressed the immediate needs of people affected by disasters,its operations focus on helping to rebuild their lives and communities.
WFP recognizes that for food-insecure people, the crisis continues after the cause ofany disaster has subsided. For this reason, WFP's Protracted Relief and Recovery Operations (PRROs) deal with the later stages of an emergency. The main objective of a PRRO is to help re-establish and stabilize livelihoods and household food security and, if applicable, to contribute to the improvement of the nutritional status of vulnerable groups.
WFP's relief and rehabilitation projects are made up of one or more of the following:
o Protracted relief: when a population's basic nutritional needs still cannot be met without continued free distribution of food. This may be the result of successive shocks or setbacks: for example, following conflict/war and/or a natural disaster.
o Protracted refugee: in the event that a refugee population remains in a host area for a period of years. The operation may involve helping the population develop a degree of self-reliance by assisting with, for example, small-scale crop production.
o Recovery: in the wake of acute crises and sometimes referred to as “rehabilitation” or “reconstruction”. These operations involve meeting the longer-term needs of affected populations through the gradual introduction of development activities, e.g. land clearance and school building.
3. Country programme and development activities
In its country programme and development activities, WFP provides food to poor families for whom hunger is a real threat to health and productivity. WFP's development projects aim to free people temporarily from having to provide food for themselves, and to give them time and resources to invest in assets such as better houses, clinics, schools, new agricultural skills and medicine and, ultimately a better future. Alternatively, projects may be directed specifically at improving vulnerable groups' health and nutritional status.
Examples of WFP's development projects include:
o Asset-creation projects: WFP provides food aid to food-insecure but economically active families who work on building their capital assets.
o School-feeding programmes: WFP provides a nutritionally balanced meal or snack to children/young people in school in circumstances where attendance is low and food
SCOP
Master Dissertation Project 131 FEUP/UN/WFP/LDU
could encourage more children to attend; or where children attending are hungry and food could improve learning; or where providing food encourages regular attendance which may help children overcome psycho-social trauma (see more details in the matrix at the end of Section 3, Chapter 3).
o HIV/AIDS projects: WFP provides food aid to persons infected by HIV/AIDS and their households or to persons closely associated with a person infected by HIV/AIDS (or who has died of AIDS) and who do not have access to enough food.
o Maternal and child health and nutrition projects: To address the specific nutritional requirements of young children, pregnant and lactating women, WFP provides specially formulated, fortified blended foods either through health centres or in the context of community-based health and nutrition programmes. It also actively supports and strengthens local capacity for production of such foods.
4. Special operations
WFP carries out special operations to rehabilitate and enhance transport infrastructure when necessary to permit the speedy and efficient delivery of food aid to meet emergency and protracted food needs.
Special operations are short term and usually complement emergency operations. Generally, they involve work on infrastructure and logistics, and are designed to overcome operational bottlenecks. WFP special operations can cover:
o repairs to roads, bridges, railways;
o repairs to airports, port infrastructure and equipment;
o air operations;
o provision of common logistic services including joint logistics centres and communication initiatives.
Whether refugees are fleeing war or drought is destroying farmland, hunger is often the first emergency. The hungry look to WFP for the first response. In 2006, the agency's food assistance reached 63.4 million people caught in the world's ever-widening net of humanitarian disasters.
The number of food emergencies has been rising over the past two decades, from an average of 15 per year during the 1980s to more than 30 per year since the turn of the millennium.
Whatever the cause - natural or man-made - hunger is one of the first threats to survival.
At the request of the local government, WFP sets the well-oiled wheels of its emergency response procedure into motion. Over its 40 year history, the agency has turned the complex business of getting the right food to the right people in the right place into a fine science.
First, Emergency Assessment teams are sent in to ask the key question: how much food assistance is needed for how many beneficiaries and for how long? And, how can the food be delivered to the hungry?
Equipped with the answers, WFP draws up an Emergency Operation (EMOP), including a plan of action and a budget. This lists who will receive food assistance, what rations are required, the type of transport WFP will use and which humanitarian corridors lead to the crisis zone.
Next, WFP launches an Appeal to the international community for funds and food aid. The agency relies entirely on voluntary contributions to finance its operations, with donations made in cash, food or services. Governments are the biggest single source of funding. More than 60 support WFP's worldwide operations.
Figure 107 – Food aid is unloaded from a WFP
helicopter amid wintry snow conditions in Pakistan's
Central Highlands, ready for distribution to survivors
of the 2005 Pakistan earthquake (Copyright: 2006
WFP/Keith Ursel)
SCOP
Master Dissertation Project 133 FEUP/UN/WFP/LDU
As funds and food start to flow, WFP's logistics team works to bridge the gap between the donors and the hungry. In 2006, the agency distributed 4 million tonnes of food aid by air, land and sea.
WFP food convoy heads into southern Lebanon.
Ships carry the largest WFP cargo, their holds filled to the brim with 50,000 tonnes or more of grain, cans of cooking oil and tinned food; every day, the agency has 30 ships on the high
seas, frequently rerouting vessels to get food fast to crisis zones.
In extreme environments, WFP also uses the skies to reach the hungry, airlifting or airdropping food directly into disaster zones.
Before the aid can reach its country of destination, logistics experts often need to upgrade ports and secure warehouses.
Trucks usually make the final link in WFP's food chain - transporting food aid along the rough roads that lead to the hungry. Where roads are impassable or simply nonexistent, WFP relies on less conventional forms of transport: donkeys in the Andes, speedboats in the Mozambique floods, camels in Sudan and elephants in Nepal.
WFP high-energy biscuits are unloaded at Ngozi, Burundi
When the food reaches designated distribution sites - refugee camps, therapeutic feeding centres and other emergency shelters - WFP teams-up with governments and non-governmental organisations (NGOs) to deliver food into the hands and mouths of the hungry. WFP works with over 3,300 international and local NGOs to distribute food aid.
At this stage, local community leaders work closely with WFP to ensure rations reach the people who need it most: women, pregnant mothers, children and the elderly.
Figure 109 – Boxes of WFP’s
high‐energy biscuits are handed
down from trucks in Ngozi,
Burundi (Copyright: 2005
WFP/Maxime Bessieres)
Figure 108 – UN humanitarian
convoy, organised by WFP,
winds through the hills of
southern Lebanon during the
2006 crisis (Copyright: 2006
WFP/Marco Frattini )
SCOP
Master Dissertation Project 134 FEUP/UN/WFP/LDU
Appendice I - Processes map Programming
Figure 110 – Process Map for OMXP
SCOP
Master Dissertation Project 135 FEUP/UN/WFP/LDU
Procurement
Procurement 1
CO
OMXP
L/R proc. Officers (local)
L/R proc. Clears (local)
OMLS
Int`l officer
Int`l clerk
Log. officer
Head local procurment
OML director
AuthorizationPCM recommended
(<500K $)/Waiver <200K $)
Collect bids and prepare
evaluation
Cheek PR
Issue tender from shortlist
Clear PCM recommended (>500K $) and (<2M$) for (Waiver >200K $) and
<500K $)
2O
Provide logistics cost
estimate
Prepare supplier shortlist
Compare bids and make
recomendation
Compare delivered cost + make recommendation
Provide logistics support for
tender
Present tender to PCM
3PO
Decide on tender to
issue
Review PR
Figure 111 – Process Map for OMLP part1
Figure 112 – Process Map for OMLP part 2
SCOP
Master Dissertation Project 136 FEUP/UN/WFP/LDU
Shipping – Linear
Figure 114 – Process Map for OMLS part1 : Linear vessel
Figure 113 – Process Map for OMLS part2: linear vessel
SCOP
Master Dissertation Project 137 FEUP/UN/WFP/LDU
Shipping – charter
Figure 115 – Process Map for OMLS part1 : Charter vessel
Figure 116 – Process Map for OMLS part2 : Charter vessel