SESSION 2 Mediation and moderation of treatment effects Andrew Pickles Methods of explanatory analysis for psychological treatment trials workshop Methodology Research Group Funded by: MRC Methodology Grant G0600555 MHRN Methodology Research Group
Transcript
SESSION 2Mediation and moderation of treatment
effects Andrew Pickles
Methods of explanatory analysis for psychological treatment
• Moderator is a variable that modifies the form or strength of the relation between an independent and a dependent variable.
• Mediator is a variable that is intermediate in the causal sequence relating an independent variable to a dependent variable.
3
Moderators in RCTs
• Moderators are baseline characteristics that influence the effect of treatment, or the effect of treatment allocation (on intermediate or final outcomes).
• They are pre-randomisation effect-modifiers.
• Examples: sex, age, previous history of mental illness, insight, treatment centre, therapist characteristics, genes etc.
4
Typical local example
Creed et al., Psychosomatic Medicine 67:490–499 (2005)
Figure 2. SF36 scores by abuse categories at baseline and follow-up (treated patients only)
5
Testing for Moderation
• A moderator variable is typically a baseline variable (e.g. not-abused, abused)
• Makes treatment effect greater in one group than another (moderator may or may not have an additional direct effect on outcome). It is a source of treatment effect heterogeneity
• A classic error is to claim moderation when treatment effect is significant effect in one group and not significant in another. Is simply a recipe for increasing Type I (false positive) error rate
6
Interaction & Synergy
• Need to show significant interaction with treatment on outcome
• But on what scale?– Can find that interaction significant on one scale but is not
significant if outcome variable is transformed. Choice of scale requires both statistical and clinical considerations.
– If outcome binary then usual test is for interaction on the log-odds scale
• Some argue that main effects on log-odds scale already suggests synergy
– e.g. if the base outcome rate is low and the treatment and moderator each increase outcome by 100% then the two together increase the outcome rate not by 200% but by 300% even without an interaction
7
The SoCRATES Trial
• SoCRATES was a multi-centre RCT designed to evaluate the effects of cognitive behaviour therapy (CBT) and supportive counselling (SC) on the outcomes of an early episode of schizophrenia.
• Participants were allocated to one of three conditions: Analysed as two conditions
Control condition: Treatment as Usual (TAU),
Treatment condition: TAU plus psychological, either CBT + TAU or SC + TAU.
8
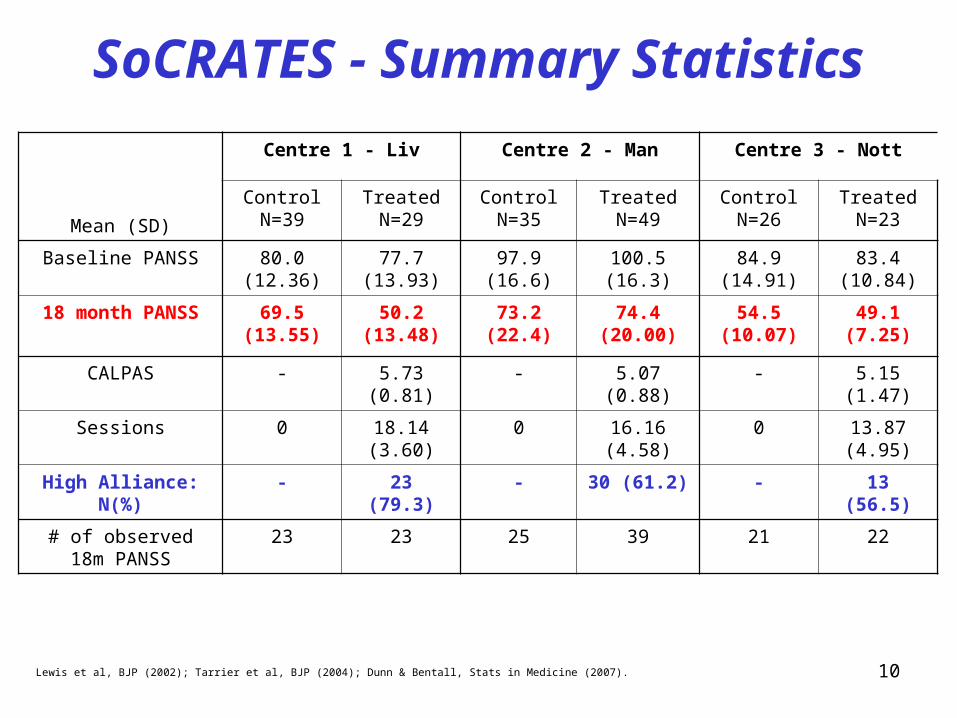
SoCRATES (contd.)• 3 treatment centres: Liverpool, Manchester and Nottinghamshire.
Other baseline covariates include logarithm of untreated psychosis and years of education.
• Outcome (a psychotic symptoms score) was obtained using the Positive and Negative Syndromes Schedule (PANSS).
• From an ITT analyses of 18 month follow-up data, both psychological treatment groups had a superior outcome in terms of symptoms (as measured using the PANSS) compared to the control group.
9
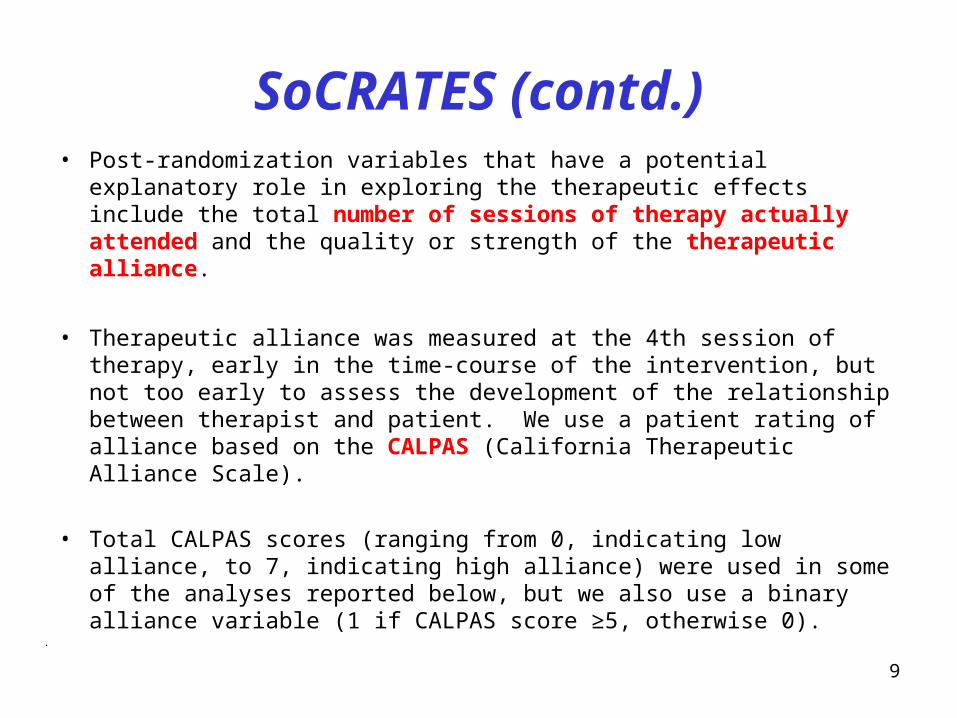
SoCRATES (contd.)• Post-randomization variables that have a potential explanatory role
in exploring the therapeutic effects include the total number of sessions of therapy actually attended and the quality or strength of the therapeutic alliance.
• Therapeutic alliance was measured at the 4th session of therapy, early in the time-course of the intervention, but not too early to assess the development of the relationship between therapist and patient. We use a patient rating of alliance based on the CALPAS (California Therapeutic Alliance Scale).
• Total CALPAS scores (ranging from 0, indicating low alliance, to 7, indicating high alliance) were used in some of the analyses reported below, but we also use a binary alliance variable (1 if CALPAS score ≥5, otherwise 0). .
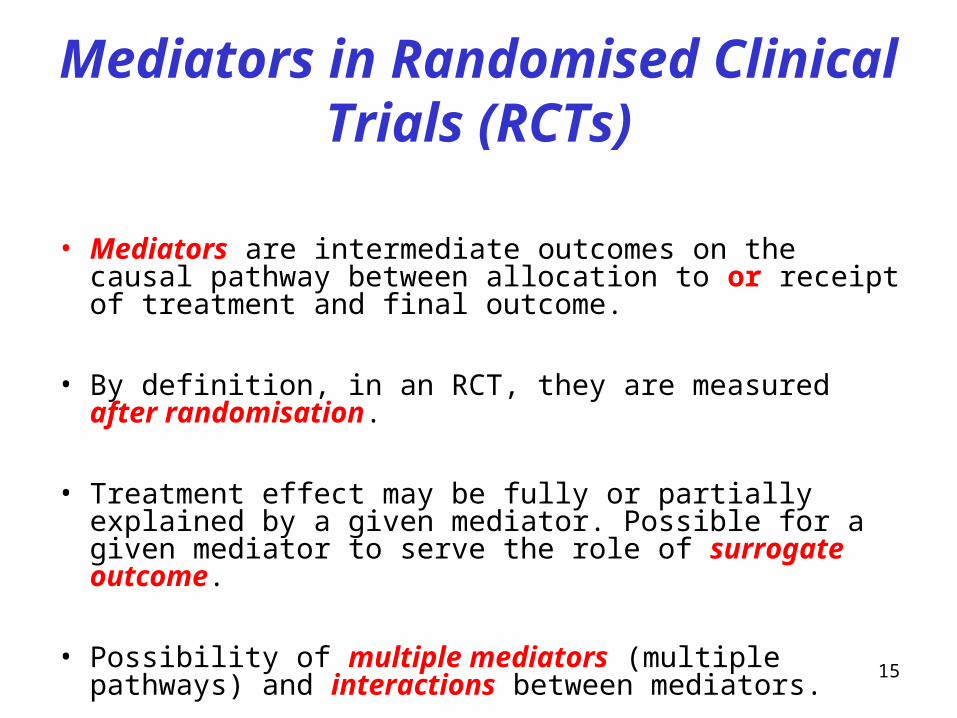
• Mediators are intermediate outcomes on the causal pathway between allocation to or receipt of treatment and final outcome.
• By definition, in an RCT, they are measured after randomisation.
• Treatment effect may be fully or partially explained by a given mediator. Possible for a given mediator to serve the role of surrogate outcome.
• Possibility of multiple mediators (multiple pathways) and interactions between mediators.
16
Post-randomisation effect modifiers
• Intermediate outcomes that influence either (a) the effects of treatment/treatment allocation on other intermediate outcomes (mediators) or (b) the effects of the other intermediate outcomes on the final outcome.
• Distinction between these variables and mediators not
obvious.
17
Examples
Compliance with allocated treatment Does the participant turn up for any therapy?
How many sessions does she attend?
Fidelity of therapyHow close is the therapy to that described in the treatment manual? Is it a cognitive-behavioural intervention, for example, or merely emotional support?
Quality of the therapeutic relationshipWhat is the strength of the therapeutic alliance?
18
Examples (cont.)
What is the concomitant medication?Does psychotherapy improve compliance with medication which, in turn, leads to better outcome? What is the direct effect of psychotherapy?
What is the concomitant substance abuse?Does psychotherapy reduce cannabis use, which in turn leads to improvements in psychotic symptoms?
What are the participant’s beliefs?
Does psychotherapy change attributions (beliefs), which, in turn, lead to better outcome? How much of the treatment effect is explained by changes in attributions?
19
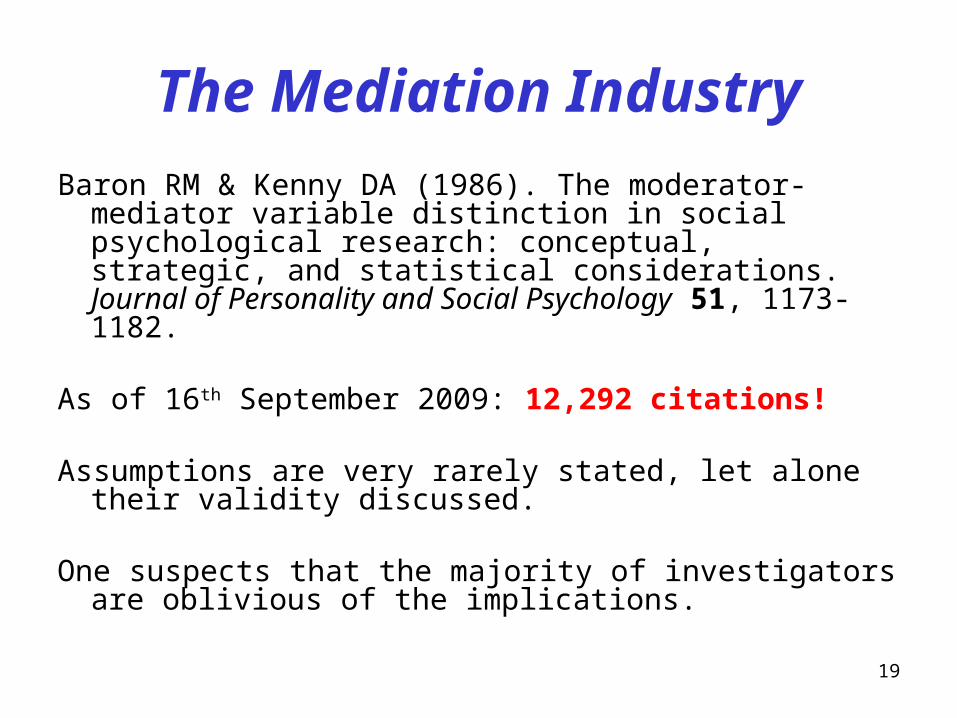
The Mediation Industry
Baron RM & Kenny DA (1986). The moderator-mediator variable distinction in social psychological research: conceptual, strategic, and statistical considerations. Journal of Personality and Social Psychology 51, 1173-1182.
As of 16th September 2009: 12,292 citations!
Assumptions are very rarely stated, let alone their validity discussed.
One suspects that the majority of investigators are oblivious of the implications.
20
Number ofsessions
Mediator M
PsychoticSymptomsDependent
Y
Randomised toPsych treatmentIndependent X
e3 e2
Regression eqns used to assess mediation
Y=d1+cX+e1
Y=d2+c’X+bM+e2
M=d3+aX+e3
total effect=c mediated effect= ab or (c-c’) (in simple linear models these should be equal if estimated on same sample)
a
b
c’
A Naïve Look at mediation: the B&K framework
21
Testing for Mediation
Estimate of mediated effect =
Confidence interval +/- 1.96*seab
Estimate of seab = sqrt( seb2
+ sea2)
Bootstrap resampling better (allows for asymmetry)
Test of mediation (1) if 0 within CI
(2) z-test for /seab
ab̂^
a2^ b2^
ab̂^
ab̂^
22
Baron & Kenny Steps: naïve mediation
• Effect of X on Y (c) must be significant
• Effect of X on M (a) must be significant
• Effect of M on X (b) must be significant
• When controlling for M, the direct effect of X on Y (c’) must be non-significant
TITLE: Ability latent autoregressive modelDATA: FILE IS D:\courses\mplus\ability.dat; TYPE IS CORRELATION STDEVIATIONS; NOBSERVATIONS=204;VARIABLE: NAMES ARE y1-y4; USEVARIABLES ARE y1-y4;MODEL: y2 on y1; y3 on y2; y4 on y3;MODEL INDIRECT:
y4 IND y1; y3 IND y1;OUTPUT: STANDARDIZED; CINTERVAL;
32
AR1 Model Output-1
Effects from Y1 to Y4 Total 0.971 0.076 12.814 0.971 0.596 Total indirect 0.971 0.076 12.814 0.971 0.596
TOTAL, TOTAL INDIRECT, SPECIFIC INDIRECT, AND DIRECT EFFECTS Estimates S.E. Est./S.E. Std StdYXEffects from Y1 to Y4 Total 0.971 0.076 12.814 0.971 0.596 Total indirect 0.971 0.076 12.814 0.971 0.596 Specific indirect Y4 Y3 Y2 Y1 0.971 0.076 12.814 0.971 0.596Effects from Y1 to Y3 Total 0.841 0.056 14.956 0.841 0.688 Total indirect 0.841 0.056 14.956 0.841 0.688 Specific indirect Y3 Y2 Y1 0.841 0.056 14.956 0.841 0.688
35
Simplex Model
f1 f2 f3 f4
y1 y2 y3 y4
Age 6 Age 7 Age 9 Age 11
V’s measured with errorAutoregressive F’s
Curiously, middle part of model is identified without restrictions, but the whole model is not identified without some restrictive assumptions e.g. measurement error and reliability constant with age
36
Simplex Model: ability2.inpTITLE: Ability latent autoregressive modelDATA: FILE IS D:\courses\mplus\ability.dat; TYPE IS STDEVIATIONS CORRELATION; NOBSERVATIONS=204; VARIABLE: NAMES ARE y1-y4; USEVARIABLES ARE y1-y4;MODEL: f1 by y1 (1); f2 by y2 (1); f3 by y3 (1); f4 by y4 (1); y1 y2 y3 y4 (2); f2 on f1; f3 on f2; f4 on f3;MODEL INDIRECT: f3 IND f1; f4 IND f1;OUTPUT: STANDARDIZED;
37
Simplex Model: ability2.out
TESTS OF MODEL FITChi-Square Test of Model Fit Value 1.440 Degrees of Freedom 2 P-Value 0.4835
TOTAL, TOTAL INDIRECT, SPECIFIC INDIRECT, AND DIRECT EFFECTS
Estimates S.E. Est./S.E. Std StdYXEffects from F1 to F3 Total 1.170 0.074 15.901 0.925 0.925 Total indirect 1.170 0.074 15.901 0.925 0.925 Specific indirect F3 F2 F1 1.170 0.074 15.901 0.925 0.925Effects from F1 to F4 Total 1.516 0.105 14.396 0.877 0.877 Total indirect 1.516 0.105 14.396 0.877 0.877
38
Simplex Model: conclusion
• Conclusion.In the presence of measurement error in the mediator the mediated effect is underestimated (attenuated) and the residual “direct” effect over-estimated.
With multiple predictors (mediators) measurement error can result in decreased, increased and quite spurious effects being estimated.
• But still ignores possible confounding – to be addressed this afternoon


![Moderation process for dummies [Read-Only] - pdfMachine ... · 1. PLAN FOR MODERATION Before you can start with Moderation, ask the following questions first:-Who asked for moderation?-Why](https://static.documents.pub/doc/80x56/5bc5d2c209d3f264788dfdf4/moderation-process-for-dummies-read-only-pdfmachine-1-plan-for-moderation.jpg)


