44
Session 20, Using Derivatives for Pension Investing Moderator: Thomas J. Egan Jr., FSA, EA, FCA Presenters: Jodan H. Ledford Christopher M. Wittemann, FSA, CERA

Session 20, Using Derivatives for Pension Investing
Moderator: Thomas J. Egan Jr., FSA, EA, FCA
Presenters:
Jodan H. Ledford Christopher M. Wittemann, FSA, CERA

Legal & General Investment Management America
Presentation to:
1
Jodan Ledford - Head of US SolutionsChris Wittemann, FSA, CFA - Solutions Strategist
2016 Investment Symposium
Session 20: Using Derivatives for Pension Investing

2
Table of contents
1 Background
2 Case studies
3 Appendix
2

3
Background on derivative usage by pension plans
3
Why should pension plans care about derivatives?
• When used within a pension risk management context, derivatives are valuable tools to help plans mitigate funded status volatility and improve funded ratio outcomes
• Derivatives can be used to:
- Hedge downside equity or interest rate risk
- Monetize decisions previously made (i.e. monetization of the glide path)
• Sell equities at higher levels than today as funded status improves
• Increase fixed income allocation at higher rates than today
- Release funding to implement more precise/effective hedge portfolios
4
Why should pension plans care about derivatives? (cont.)
• Plans of a variety of size and sophistication levels are using derivative strategies to efficiently manage pension risks and benefit from the asymmetric risks faced by pension plans
- Corporate pension plans governed under ERISA face both a corporate income and an excise tax when recovering surplus assets, presenting little value to overfunding
- However, plans that are underfunded have to contribute dollar for dollar or earn their way back to full funding, meaning downside deficit dollars are assigned full value
- Discounted upside combined with very penal downside outcomes make pensions natural users of option based strategies
5

6
Additional required contributions
Pensions use derivatives to manage funded status outcomes
• Strategies are developed within a total portfolio context to minimize funded status volatility
• Optimize asset return profiles to benefit from natural pension asymmetry - Strategies often trade “excess” upside (that could potentially lead to stranded surplus) to avoid downside
(potentially requiring additional contributions)
High
Low
Prob
abilit
y
Funding ratio return Negative Positive
0%
More condensed distribution of funding ratio returns… …leads to less funding ratio volatility and better outcomes
6
Time
Fund
ing
ratio
Stranded surplus Fully
funded
Charts depicted above are intended for illustrative purposes only.

Derivative usage by pension plansA majority of plans use derivatives primarily to deliver increased precision when hedging
7
Source: “Liability Driven Investing Survey,” November 2014, 2015, CIO magazine.
Use of derivatives
Overall, plans continue to get more comfortable using derivatives

Brief introduction to options and futures
Futures – Sample payoff diagram
Price
Pay off
Long Future Short Future
Price
Pay off
Futures – Definitions and basics•Grants party to transact today for delivery in the future
- Contract holder obligated to fulfill the terms of his/her contract
- Provides price certainty for producers (sellers) and consumers (buyers)
- Can be used to either hedge or speculate price movements
- Allows room for speculators to provide liquidity to the marketplace
•Futures are exchange traded forward
- Anonymous counterparties
- Standard contracts
- Daily settlement
8
Charts depicted above are intended for illustrative purposes only.

Brief introduction to options and futures (cont.)
Bought Call
Bought Put
Sold Call
Sold Put
Options – Sample payoff diagrams
9
Options – Definitions and basics•Grants the right to buy or sell the underlying asset
•Seller receives premium from buyer
•Buyer pays premium for right but not obligation to transact
•Important difference versus forwards/futures/swaps
•Can be OTC or exchange traded
•Call - Transacting on the right to buy the underlying asset
•Put - Transacting on the right to sell the underlying asset
•Strike or exercise price
•Exercising the option
•Moneyness – “In-the-money”, “Out-of-the-money”
•“Greeks” - Market sensitivities that affect option price (delta, gamma, vega, theta, rho)
Charts depicted above are intended for illustrative purposes only.

Hedging toolkit - Forwards and futures advantages for pension risk management
• US Treasury futures allow plans to target interest rate hedge ratios across the curve to minimize unintentional curve bets that can arise from solely using physical bonds
• Active Treasury contracts include the 2-year, 5-year, 10-year, “long bond” and “ultra-long bond” to target a variety of key rate duration points
• Treasury futures require limited cash upfront so that plans can efficiently hedge interest rate exposures while allocating cash to other assets
• Treasury futures markets are among the deepest and most liquid markets in the world
• Can be used to control risk/price uncertainty
• Price movements are linked to that of underlying assets
• No cash needed until settlement (only margin), which helps liquidity
• Can be long or short depending on position/view
• Large, liquid markets over a wide range of assets
10

Common interest rate option strategies
• Pension plans can use interest rate options to protect against downside rate scenarios as well as monetize decisions to add duration should rates rise
• Pension plans typically sell payer swaptions and/or buy receiver swaptions
- Interest rate hedge is increased if particular market rates are achieved in the future
• Swaption strikes based on forward curve
- Pensions will benefit from current expectation of much higher futures rates
• If a plan doesn’t want to increase hedge ratio at current levels but wants “insurance” against rates falling, it can buy receiver swaptions
• If a plan wants to increase interest rate hedge ratio if yields rise to a certain higher level, it can sell payer swaptions
• Plans can fund purchase of a receiver by selling a payer (swaption collar)
11

Common equity option protection strategies
• Pension plans can use option strategies to mitigate risk of equity drawdown impact to funded status
• Purchase puts outright
• Put spread- Buy at-the-money put and sell out-of-the-money put
• Put spread collar- Sell out-of-the-money call to finance a put spread
• Stock replacement- Purchase calls (ATM or OTM) to replicate exposure to equity markets but limiting downside
to premium spent
• Risk reversal- Sell a put and purchase a call
12

Hedging toolkit - Swaps
• Swaps convert a stream of payments from one type to another
- Payments can be linked to interest rates, inflation, total return, currencies, etc.
• Classic swap type is fixed ↔ floating interest rate swap
- Example: Investor owns a fixed rate bond, but finances the bond purchase at a floating rate
- Investor can eliminate this funding mismatch via a pay fixed, receive floating interest rate swap
13
Investor Counterparty BankFloating rate
(LIBOR)
Bond
Floating rate (LIBOR)
Financing
Fixed rate Fixed rate

Additional implementation considerations
• Derivative implementation tailored upon completion of ALM study’s strategic objectives
• Derivative securities can be divided into two general categories
Category
Operational complexity / flexibility
Key documentation / operation steps
Where is collateral held?
Pricing /Valuation
Daily collateral management
Futures & Centrallycleared
Lower / limited
Include in investment guidelines & open an account with a clearing broker
Clearing broker
“One visible price” set by clearinghouse
Cash moves every day governed by clearinghouse
Over-the-counter (OTC)
Higher / fullycustomizable
Include in investmentguidelines, multipleISDAs involving legal and counterparty discussions, additional custodian setup and support
Counterparty and/or plan’s custodian
Both parties have independent pricing models; differences need to be reconciled
Cash/Treasuries move only if above/belowagreed upon thresholds
14

15
Case study 1
15
Using Treasury futures to improve the overall interest rate hedge
The following case study best depicts the inclusive strategies offered by LGIMA, is based on a point in time and is a representative sample of an actual client implementation whose circumstances are different from yours, and are thus being presented for illustrative and informational purposes only, and accordingly should not be relied upon in making any investment decision, as past performance should not be taken as an indication or guarantee of future performance. The numbers presented are not actual client numbers but are based on an actual client's situation. By receipt of this presentation, you hereby acknowledge that no recommendation, representation, express or implied, is made regarding future performance or that LGIMA's investment or risk management process will be successful, follow this process or match the results depicted in the following case studies. Recommendations made throughout this presentation are based on the original implementation strategy and should not be considered a recommendation to any recipient of this presentation.
Further disclosures are presented at the end of this presentation.

Key takeaway from case study #1
• Many pensions adopt a fixed income allocation benchmarked against the Barclays Long Government/Credit Index
- This is a standard long duration benchmark for fixed income mandates (i.e. essentially all USD investment grade bonds with a maturity of 10 years or longer)
- This benchmark implicitly leaves the pension as a “passive taker” to credit risk based on the amount of issuance and respective maturities in the US bond markets
• This case study illustrates a simple step that pensions can take to further reduce its funded status volatility by introducing a custom Treasury portfolio that takes advantage of using Treasury futures tailored against a plans liability cashflows
16

Overview
• In early 2015, a $5.5 billion plan sponsor approached LGIMA seeking a recommendation for a liability hedging strategy
• Plan had a 102% funded status with a 32% allocation to liability hedging assets in the form of long government/credit
• Plan’s original liability hedging asset allocation targeted a 33% interest rate hedge ratio and exposed the plan to duration mismatches across the curve
• LGIMA recommended the plan to implement a completion management framework with explicit liability benchmarking
- Greater capital efficiency allows for same dollar allocation to achieve higher hedge ratios
- Mitigates unintentional curve exposures and unintentional hedge ratio drift
• Plan ultimately reallocated $883 million from its long government/credit allocation into a completion portfolio composed of Treasuries and Treasury futures to target a 60% interest rate hedge ratio across the curve
17

Return Seeking Assets68%
Long Government
/Credit32%
Original asset allocation and hedge summary
Liability Hedge % 2y 5y 7y 10y 15y 20y 30y TotalInterest rate risk 30% 28% 27% 32% 33% 41% 30% 33%
Credit spread risk 22% 20% 19% 21% 21% 26% 14% 19%
Asset summary Hedge summary
Exposure summary
Contribution to liability hedge
AssetsMV
($mm)Dur (yrs)
DV01 ($mm)1
Return Seeking Assets 3,712 -- --
Long Government/Credit 1,766 13.6 2,400
Total Assets 5,478 4.4 2,400Liabilities 5,400 13.4 7,238
As of June 30, 2015.1Dollar change in MV due to a 1 basis point move in rates.
Allocation provided an aggregate hedge ratio of 33% however left the plan exposed to unintentional curve mismatches.
-
500,000
1,000,000
1,500,000
2,000,000
2,500,000
3,000,000
2Y 5Y 7Y 10Y 15Y 20Y 30Y
DV0
1 ($
)
Liabilities Long Duration Credit Long Government
Fixed income portfolio had similar duration to liabilities and did not have any derivative exposure.
18

19
Implementing a custom Treasury portfolio versus liability
• Treasury futures require limited cash upfront so that plans can efficiently hedge interest rate exposures while allocating cash to other assets
• US Treasury futures allow plans to target interest rate hedge ratios across the curve to minimize unintentional curve bets that can arise from solely using physical bonds
• Active Treasury contracts include the 2-year, 5-year, 10-year, “long bond” and “ultra-long bond” to target a variety of key rate duration points (total notional is # contracts x contract notional x futures contract price)
• Treasury futures require initial margin (i.e. physical Treasuries) to be held as collateral and gain/losses are settled every day with cash
• If/when cash levels get low, physical Treasuries can be sold and the duration exposure can be replaced with more Treasury futures
Treasury futures # of contracts Total notional ($mm)2yrs 325 735yrs 750 92 10yrs 700 8930yrs -2,800 -412
Ultra Long 11,900 1,844Total (gross) 2,510
Total (net) 1,686
Physical securities Face amount ($mm) Market value ($mm)
Cash (T-Bills) 192 192T 7 5/8 02/15/25 175 261T 6 1/4 05/15/30 220 319T 3 5/8 02/15/44 100 111
Total MV 883
Illustrative portfolio composition
Collateral management summaryDescription AmountInitial margin required $55,000,000
DV011 of Treasury futures exposure $2,427,665
Cash collateral available $192,367,197
Increase in Treasury ratesto use all cash ~ 79 bpsAs of June 30, 2015.
1Dollar change in MV due to a 1 basis point move in rates.
Return Seeking Assets68%
Long Government
/Credit16%
Custom Hedging Portfolio
16%
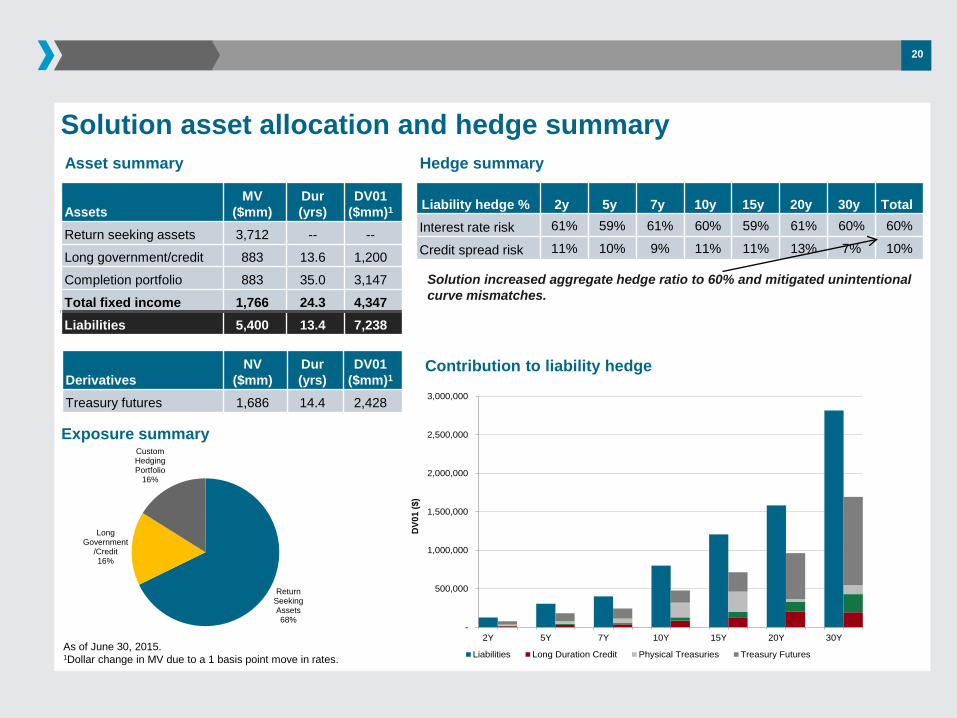
Solution asset allocation and hedge summary
Liability hedge % 2y 5y 7y 10y 15y 20y 30y TotalInterest rate risk 61% 59% 61% 60% 59% 61% 60% 60%
Credit spread risk 11% 10% 9% 11% 11% 13% 7% 10%
Asset summary Hedge summary
Exposure summary
Contribution to liability hedge
AssetsMV
($mm)Dur (yrs)
DV01 ($mm)1
Return seeking assets 3,712 -- --
Long government/credit 883 13.6 1,200
Completion portfolio 883 35.0 3,147
Total fixed income 1,766 24.3 4,347Liabilities 5,400 13.4 7,238
Solution increased aggregate hedge ratio to 60% and mitigated unintentional curve mismatches.
DerivativesNV
($mm)Dur (yrs)
DV01 ($mm)1
Treasury futures 1,686 14.4 2,428
As of June 30, 2015.1Dollar change in MV due to a 1 basis point move in rates.
-
500,000
1,000,000
1,500,000
2,000,000
2,500,000
3,000,000
2Y 5Y 7Y 10Y 15Y 20Y 30Y
DV01
($)
Liabilities Long Duration Credit Physical Treasuries Treasury Futures
20

21
Case study 2
21
Capital efficient pension risk management
The following case study best depicts the inclusive strategies offered by LGIMA, is based on a point in time and is a representative sample of an actual client implementation whose circumstances are different from yours, and are thus being presented for illustrative and informational purposes only, and accordingly should not be relied upon in making any investment decision, as past performance should not be taken as an indication or guarantee of future performance. The numbers presented are not actual client numbers but are based on an actual client's situation. By receipt of this presentation, you hereby acknowledge that no recommendation, representation, express or implied, is made regarding future performance or that LGIMA's investment or risk management process will be successful, follow this process or match the results depicted in the following case studies. Recommendations made throughout this presentation are based on the original implementation strategy and should not be considered a recommendation to any recipient of this presentation.
Further disclosures are presented at the end of this presentation.

Key takeaway from case study #2
• Pensions can structure derivatives to better shape funded status outcomes
• Derivatives are capital efficient as they can provide market exposures without requiring full cash upfront
• This allows cash to serve two purposes: (1) buy physical bonds to hedge pension funded status risk, and (2) support collateral requirements of derivative exposures
• Derivatives can provide asymmetric payoffs that are aligned very well with pension regulatory environment
22
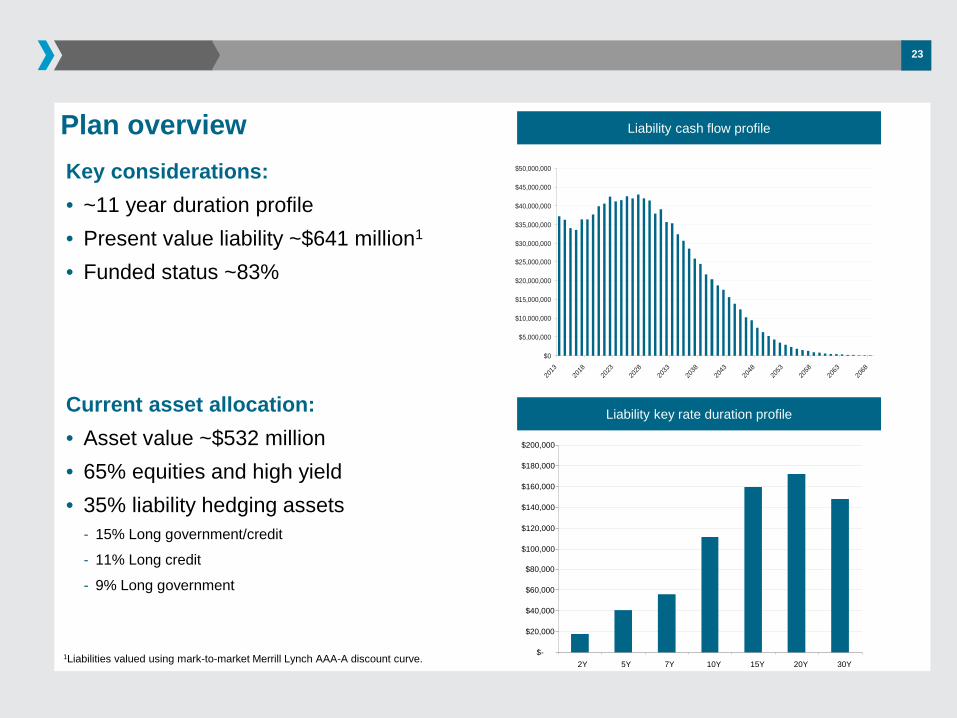
Key considerations:• ~11 year duration profile • Present value liability ~$641 million1
• Funded status ~83%
Plan overview
Current asset allocation:• Asset value ~$532 million• 65% equities and high yield• 35% liability hedging assets
- 15% Long government/credit
- 11% Long credit
- 9% Long government
Liability cash flow profile
Liability key rate duration profile
1Liabilities valued using mark-to-market Merrill Lynch AAA-A discount curve.
$0
$5,000,000
$10,000,000
$15,000,000
$20,000,000
$25,000,000
$30,000,000
$35,000,000
$40,000,000
$45,000,000
$50,000,000
2013
2018
2023
2028
2033
2038
2043
2048
2053
2058
2063
2068
$-
$20,000
$40,000
$60,000
$80,000
$100,000
$120,000
$140,000
$160,000
$180,000
$200,000
2Y 5Y 7Y 10Y 15Y 20Y 30Y
23

Funded status sensitivity analysis (instantaneous)Funding status will fall if equities fall
Funding status will rise if rates rise
• A 26% interest rate hedge leaves the Plan exposed to changes in interest rates- A drop of 100 basis points in rates will decrease the funding ratio from 83% to 77% (6%)
• Given allocation to risk seeking assets, the Plan is significantly exposed to market drawdowns- For 20% equity market decline, the funded status will fall from 83% to 72% (11%)
Note: Analysis assumes instantaneous shock to interest rates and equity markets. Analysis assumes 0.95 Beta for non-fixed income portfolio.
Funding status will rise if equities rise
Funding status will fall if rates fall
Significant downside exposure to rates and equities (which tend to be highly correlated in periods of economic stress)
24

Solution overview
25
• Replace $140 million of global equity portfolio with exchange traded futures or total return swaps
• Use long duration credit to target a ~33% credit spread hedge versus liabilities
- Overall credit spread risk should be managed within a total portfolio context due to the high correlation between equities and credit spreads
• Target 60% interest rate hedge to reduce funded status volatility due to changes in interest rates via mix of physical Treasuries and futures
- Implement completion management framework with custom liability benchmarking to minimize funded status volatility
- Match interest rate hedge ratio across curve, mitigating unintentional duration and curve bets
• Sell payer swaptions to commit to increasing hedge ratio to 100% on a delta one basis at higher pre-determined rate levels (ATMF +50 basis points) and raise premium
• Allocate premium from payer swaption sale to purchase 1-year 90% strike puts on $100 million of US equity portfolio
- Allows for re-allocation of RSA portfolio as funded status improves/Plan de-risks in future

Completion management framework
26
LGIMA liability hedging strategy
$133 mm
Credit Manager #2
$80 mm
LGIMA Long Duration Credit
$106 mm
LGIMA custom Treasury / Hedging portfolio
Total liability risk
Completion management framework
• Portion of the long duration credit ($133 million) and long government ($48 million) is allocated to other managers for performance diversification purposes
• LGIMA acts as a completion manager- Incorporates external manager exposures (based
on underlying market-based benchmark) to complete to aggregate plan level hedge ratio
- LGIMA held accountable to aggregate 60% interest rate hedge ratio target
• As completion manager, LGIMA manages the custom Treasury portfolio overlay to:- Target aggregate interest rate hedging objectives
- Manage collateral posting requirements on the equity derivative strategies
AssetsMV
($mm)Custom Treasuries (LGIMA) 106
Long duration credit (LGIMA) 80
Long duration credit (external) 133
Long government (external) 48
$48 mm
Long Government
Manager
26

27
• Plan can use total return swaps or equity futures to raise efficient funding against cash equities portfolio while maintaining exposures - LGIMA recommends total return swaps for ERISA
clients due to more attractive collateral provisions (no initial margin and potential to pledge Treasuries as collateral required)
• LGIMA recommends that the Plan sell $140 million of cash equities portfolio to raise cash, replacing exposure via total return swap- Plan receives market total return (market value
fluctuations and dividend payments)
- Plan pays Libor + [●] bps for the funding
- TRS is cash settled on quarterly basis
• Plan can deploy funding to implement fixed income hedging portfolio (Treasuries and long duration credit)
Replace cash equity with total return swap (TRS) exposure
Plan Counterparty
Market
Libor + [●]bps
$140mm
Equity market total return
Cash equities

Sell payer swaptions across the curve
• Target 60% interest rate hedge using mix of physical Treasuries and futures- LGIMA to incorporate external manager exposures and structure the custom Treasury portfolio to target 60% hedge
ratio across the curve
• Sell payer swaptions across the curve to commit to increasing hedge ratio to 100% at higher pre-determined rate levels and raise premium- 3-year ATMF rates are 50-252 basis points higher across the curve- Sell payer swaptions at ATMF + 50 basis points duration matched with Plan liabilities across the curve- Swaptions have deltas of ~31-40%, resulting in total mark-to-market interest rate hedge of ~76%- Raises premium of $9.6 million
28
Chart depicted above is intended for illustrative purposes only.
Swaption Notional ($mm)
Current Par Rate (%)
At-The-Money Forward Rate
(%)
Payer Strikes
(%)
Swaption Delta (%)
Premium Received
(%)
Premium Received
($mm)3 years into 2 years 50 0.51% 3.03% 3.53% 39% 0.98% 0.493 years into 5 years 45 1.71% 3.70% 4.20% 40% 2.17% 0.983 years into 7 years 35 2.35% 3.93% 4.43% 38% 2.68% 0.943 years into 10 years 49 2.93% 4.14% 4.64% 37% 3.49% 1.713 years into 15 years 48 3.42% 4.27% 4.77% 35% 3.88% 1.863 years into 20 years 38 3.63% 4.29% 4.79% 33% 4.57% 1.743 years into 30 years 35 3.76% 4.26% 4.76% 31% 5.38% 1.88
Total 300 9.60
Payer Swaption Pricing: ATMF + 50bps

29
• Equities currently stand near 5-year highs, while equity volatility is near 5-year lows
• LGIMA believes purchasing equity protection is prudent at this time, as the rally has made significant positive contribution to the Plan’s funded status
• LGIMA recommends purchasing 1-year 90% strike puts on $100mm of the US equity portfolio- Using $3 million of the $9.6 million premium received from sale of payer swaptions, the Plan can purchase December 1625 SPX
puts hedging exposure below 90% of current market levels on $100 million of the US equity portfolio• Remaining $6.6 million can be used to purchase future protection
- Full upside exposure retained - no impact to expected rate of return
- Plan has room to adjust the RSA allocation as funded status improves/plan de-risks
Buy equity protection
VIX IndexMSCI AC World Performance
Source: BloombergCharts depicted above are intended for illustrative purposes only.
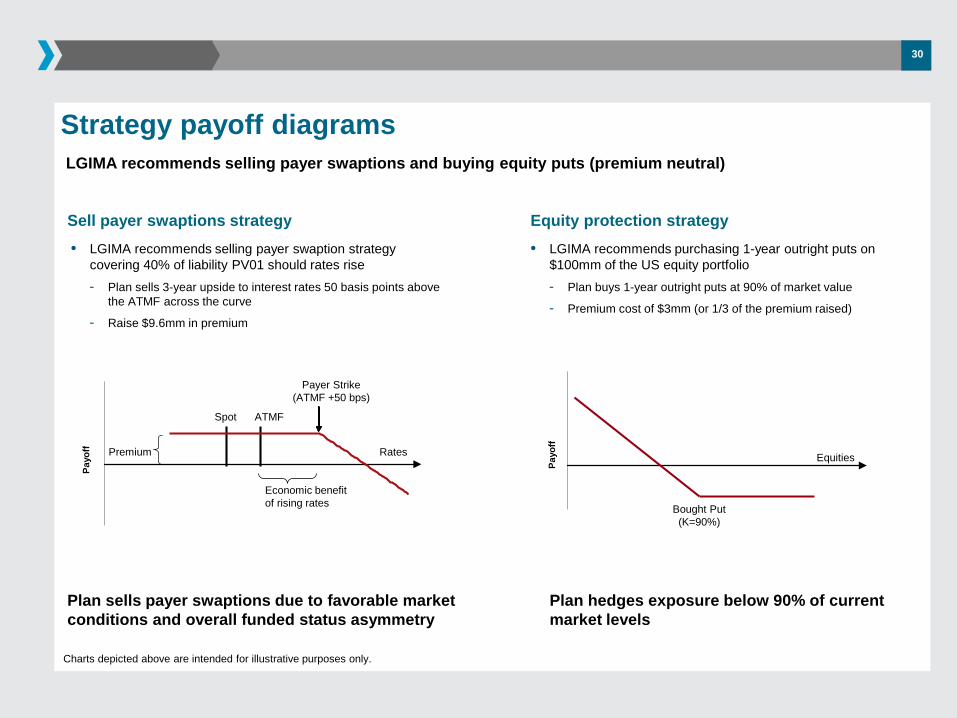
Sell payer swaptions strategy• LGIMA recommends selling payer swaption strategy
covering 40% of liability PV01 should rates rise- Plan sells 3-year upside to interest rates 50 basis points above
the ATMF across the curve
- Raise $9.6mm in premium
Equities
Payo
ff
Bought Put (K=90%)
-10%
10%
30%
0%
25% 50% 100%
Agreed fixed rate(payer strike)
Agreed fixed rate(receiver strike)
-10%
10%
30%
Payo
ff
Payer Strike (ATMF +50 bps)
ATMF
Rates
• LGIMA recommends purchasing 1-year outright puts on $100mm of the US equity portfolio- Plan buys 1-year outright puts at 90% of market value
- Premium cost of $3mm (or 1/3 of the premium raised)
Equity protection strategy
LGIMA recommends selling payer swaptions and buying equity puts (premium neutral)
30
Spot
Economic benefit of rising rates
Plan sells payer swaptions due to favorable market conditions and overall funded status asymmetry
Plan hedges exposure below 90% of current market levels
Strategy payoff diagrams
Premium
Charts depicted above are intended for illustrative purposes only.

Funding position sensitivity component analysis
Note: Analysis assumes instantaneous shock to interest rates and equity markets. Analysis assumes 0.95 Beta for non-fixed income portfolio.
31
Impact of selling payer swaptions
Impact of buying equity protection
Increasing interest rate hedge ratio provides downside protection if interest rate falls
Selling payer swaptions at ATMF +50 basis points increases the hedge ratio at higher rates as Plan funded status improves
Using the swaption premium to purchase put protection on a portion of the equity portfolio provides significant downside protection; Plan retains all upside benefit of equities
Impact of increasing interest rate hedge ratio to 60%
-150 bps -100 bps -50 bps 0 bps 50 bps 100 bps 150 bps
(191.5) (163.2) (136.0) (110.0) (84.0) (59.3) (35.7)
9.6 7.9 4.7 0.0 (6.3) (13.8) (22.2)
(181.9) (155.2) (131.2) (110.0) (90.2) (73.0) (57.8)
Funding Position Sensitivity to ∆ in Rates
∆ in Rates
Original Funding Position
Impact of Sold Payer Swaptions
New Funded Status
-150 bps -100 bps -50 bps 0 bps 50 bps 100 bps 150 bps
(191.5) (163.2) (136.0) (110.0) (84.0) (59.3) (35.7)
37.5 24.4 11.9 0.0 (11.9) (23.3) (34.1)
(154.0) (138.7) (124.0) (110.0) (95.9) (82.5) (69.8)
∆ in Rates
Funding Position Sensitivity to ∆ in Rates
New Funded Status
Original Funding Position
Impact of additional Treasuries
-30% -20% -10% 0% 10% 20% 30%
(210.0) (176.7) (143.3) (110.0) (76.7) (43.3) (10.0)
20.0 10.9 3.9 0.0 (1.7) (2.8) (2.9)
(190.0) (165.8) (139.4) (110.0) (78.4) (46.1) (12.9)
∆ in Equities
Funding Position Sensitivity to ∆ in Equities
New Funded Position
Impact of Puts
Original Funding Position

Funding position sensitivity analysis
Note: Analysis assumes instantaneous shock to interest rates and equity markets. Analysis assumes 0.95 Beta for non-fixed income portfolio.
32
Combination of selling payer swaptions and buying equity protection mitigates funding position volatility significantly
Strategy benefits the Plan when the Plan needs it the most (scenarios where rates and equity markets are down significantly)
Relative to current portfolio
Funding status post transaction
-30% -20% -10% 0% 10% 20% 30%
150 bps (36) (45) (52) (56) (58) (59) (59)
100 bps (17) (26) (33) (37) (39) (40) (40)
50 bps 2 (7) (14) (18) (20) (21) (21)
0 bps 20 11 4 0 (2) (3) (3)
-50 bps 37 28 21 17 15 14 14
-100 bps 52 43 36 32 31 30 29
-150 bps 67 58 51 47 45 44 44
Funding Position ($mm)
Funding Position Sensitivity to ∆ in Equities
Funding Position Sensitivity to ∆ in R
ates
-30% -20% -10% 0% 10% 20% 30%
150 bps 69% 73% 78% 83% 89% 95% 101%
100 bps 70% 74% 78% 83% 89% 94% 100%
50 bps 70% 74% 79% 83% 89% 94% 99%
0 bps 71% 74% 79% 83% 88% 93% 98%
-50 bps 71% 74% 78% 83% 87% 92% 97%
-100 bps 71% 74% 78% 82% 86% 91% 95%
-150 bps 70% 74% 77% 81% 85% 89% 94%
Funding Status (%)
Funding Status Sensitivity to ∆ in Equities
Funding Status Sensitivity to ∆ in R
ates

33
Appendix
33

Option “greeks”
• Delta- Rate of change of the option price with respect to the price of the underlying asset
- Can loosely be thought of as the probability the option ends up in the money
• Gamma- Rate of change of the value of the delta with respect to the price of the underlying asset
- Second order term, similar to convexity (bond duration) or acceleration (physics)
• Theta- Rate of change of the value of the option due to the passage of time
- As rates pass through time they can decay and that decay increases rapidly as the option nears expiry
• Vega- Rate of change of the value of the option with respect to the volatility of the underlying asset
- More volatility implies a larger probability of ending up in the money and thus a more expensive option
• Rho- Rate of change of the value of the option with respect to changes in interest rates
34

Common equity option protection strategies
• Puts and put spreads offer different ways of limiting full downside exposure to declines in equity markets
• Focusing on the put spread to illustrate the option structure
- Recall strategy call for buying an at-the-money put and selling an out-of-the-money put
- Plan participation in the downside of an equity selloff is mitigated
Equities
Payo
ff
Market
Sold Put (K=80%)
Bought Put (K=95%)
Equity put spread pay-off diagram
35

Return profile of long equity and call spread
• Plans can also consider selling distant and potentially unnecessary equity upside via calls or call spreads- Plan is monetizing a decision that has already been made
(reducing equity exposure as funded status increases)
• Premium from selling distant upside can be used to:- Buy equity protection
- Improve current funded status
- Amplify near term returns to achieve fully funded status sooner-20%
-10%
0%
10%
20%
30%
40%
50%
60%
90% 95% 100% 105% 110% 115% 120% 125% 130% 135% 140% 145% 150%Long Stock Long Stock 1x2CS
Buy 1 Call
Sell 2 Calls
Fully funded
Stranded Surplus
Stock replacement performance (vs. long equity)
• Plans can replace a portion of existing cash equity portfolio allocation with long calls, retaining upside of owning equities without downside exposure
• Stock replacement via call will create a straddle like payoff profile vs. original long equity position- Position must be managed over time to offset time decay
• Cash released can be used to implement a more precise and effect hedging portfolio
36
Charts depicted above are intended for illustrative purposes only.
-15%
-10%
-5%
0%
5%
10%
15%
20%
25%
70%
73%
76%
79%
82%
85%
88%
91%
94%
97%
100%
103%
106%
109%
112%
115%
118%
121%
124%
127%
130%
Today 6M Expiration
Common equity option protection strategies (cont.)

3737
Total return swaps (TRS) for pensions
Plan Counterparty
Market
Libor + [●]bps
Cash
Equity market total return
Cash equities
• Plan can use total return swaps to raise efficient funding against cash equities portfolio while maintaining exposures
- For ERISA plans, total return swaps are more attractive than equity futures due to more attractive collateral provisions (no initial margin and potential to pledge Treasuries as collateral required)
• Plan can sell cash equities, replacing exposure via total return swap
- Plan receives market total return (market value fluctuations and dividend payments)
- Plan pays Libor + [●] bps for the funding
- TRS is cash settled on a quarterly basis
• Plan can deploy funding to implement more effective fixed income hedging portfolio

3838
Using swaptions for pension risk management
• Pension plans typically sell payer swaptions and/or buy receiver swaptions- Interest rate hedge is increased if particular market
rates are achieved in the future
• Swaption strikes based on forward curve- Pensions will benefit from current expectation of
much higher futures rates
38
Selling a payer swaption
• If a plan doesn’t want to increase hedge ratio at current levels but wants “insurance” against rates falling, it can buy receiver swaptions
• If a plan wants to increase interest rate hedge ratio if yields rise to a certain higher level, it can sell payer swaptions
• Plans can fund purchase of a receiver by selling a payer (swaption collar)Charts depicted above are intended for illustrative purposes only.
Forward curve implies much higher rates
0.00
0.50
1.00
1.50
2.00
2.50
3.00
3.50
4.00
4.50
1 2 3 4 5 6 7 8 9 10 11 12 13 14 15 16 17 18 19 20 21 22 23 24 25 26 27 28 29 30
Spot Yield Curve 3YR Forward Yield Curve
-10%
10%
30%
0%
25% 50% 100%
Agreed fixed rate(payer strike)
Agreed fixed rate(receiver strike)
-10%
10%
30%
Payo
ff
Payer Strike (ATMF + 50 bps)
ATMF
Rates
Spot
Economic benefit of rising rates
Premium
Why consider credit default swaps for pension plans?
• Pension plan liabilities are sensitive to credit spread risk
- Liability value increases if credit spreads tighten
- Liability value decreases if credit spreads widen
• High quality investment grade fixed income bonds are the natural hedge to manage this credit spread risk because they have this same sensitivity with two important challenges
- High quality fixed income bonds have high transaction costs (can be above 1% in roundtrip costs)
- Fixed income bonds have downgrade risk while pensions do not
• Credit default swaps can be an additional natural hedge to also manage this credit spread risk efficiently within a broad pension risk management context
- Much lower transaction costs (can be less than 0.1% roundtrip)
- Dodd Frank framework has reduced implementation complexity (similar to Treasury futures)
39

Considerations when considering credit derivatives
Potential benefits of CDS/CDX
• Correlated to spread volatility inherent in pension liabilities
• Provide broad index exposure, and thus the ability to express overall credit market view quickly and efficiently
• Synthetic exposure eliminates the need to either 1) divest other assets to raise cash to gain exposure, or 2) borrow physical assets to short exposure
• Cost effective instrument relative to physical bonds (i.e., much lower transaction costs)
• Highly liquid instrument with deep, global participation allows for quick implementation of sizable positions
• Suite of related derivative products (single name, index, options, etc.) allows for flexible structuring of hedges over time
40
Considerations when considering credit derivatives (cont.)
Potential limitations of CDS/CDX
• While correlated with spread movement of physical corporate bonds, technical factors and basis risk can produce different outcomes in the short-term
• Duration of the most liquid index (5-year maturity) is significantly different than longer duration credit benchmarks used in most investment portfolios
• Index constituents, both at the sector and issuer level, differ significantly from broad, physical bond credit and/or corporate indexes
41

42
Investment Grade CDX Indices
• The CDX IG Index is composed of 125 equal-weighted investment grade credit default swaps
- CDX uses standard contracts that are 5-years (very liquid) or 10-years (less liquid)
- Similar to CDS, CDX transactions include a protection buyer (premium payer) and protection seller (premium receiver)
- Index is based on overall market
- CDX transactions are centrally cleared, mitigating counterparty default risk
• Every 6 months (March/September) a new series of CDX is created which becomes the new on-the-run contract
- Older series roll down the credit curve as their exposure shortens over time
- Each new series may result in minor substitutions due to credit events, ratings migrations, or market demands
• CDX indices tend to be highly correlated with cash bond credit spreads
- Basis risk does exist
CDX IG Credit Curve
0
100
200
300
400
500
600
Dec
-06
Apr-0
7Au
g-07
Dec
-07
Apr-0
8Au
g-08
Dec
-08
Apr-0
9Au
g-09
Dec
-09
Apr-1
0Au
g-10
Dec
-10
Apr-1
1Au
g-11
Dec
-11
Apr-1
2Au
g-12
Dec
-12
Apr-1
3Au
g-13
Dec
-13
Apr-1
4Au
g-14
Dec
-14
Apr-1
5Au
g-15
US Intermediate Credit OAS
CDX IG
43
The material in this presentation regarding Legal & General Investment Management America, Inc. (“LGIMA”) is confidential, intended solely for the person to whom it has been delivered and may not be reproduced or distributed. The material provided is for informational purposes only as a one-on-one presentation, and is not intended as a solicitation to buy or sell any securities or other financial instruments or to provide any investment advice or service. LGIMA does not guarantee the timeliness, sequence, accuracy or completeness of information included. The information contained in this presentation, including, without limitation, forward looking statements, portfolio construction and parameters, markets and instruments traded, and strategies employed, reflects LGIMA’s views as of the date hereof and may be changed in response to LGIMA’s perception of changing market conditions, or otherwise, without further notice to you. Accordingly, the information herein should not be relied on in making any investment decision, as an investment always carries with it the risk of loss and the vulnerability to changing economic, market or political conditions, including but not limited to changes in interest rates, issuer, credit and inflation risk, foreign exchange rates, securities prices, market indexes, operational or financial conditions of companies or other factors. Past performance should not be taken as an indication or guarantee of future performance and no representation, express or implied, is made regarding future performance or that LGIMA’s investment or risk management process will be successful.
In certain strategies, LGIMA might utilize derivative securities which inherently include a higher risk than other investments strategies. Investors should consider these risks with the understanding that the strategy may not be successful and work in all market conditions.
Reference to an index does not imply that an LGIMA portfolio will achieve returns, volatility or other results similar to the index. You cannot invest directly in an index, therefore, the composition of a benchmark index may not reflect the manner in which an LGIMA portfolio is constructed in relation to expected or achieved returns, investment holdings, portfolio guidelines, restrictions, sectors, correlations, concentrations, volatility, or tracking error targets, all of which are subject to change over time.
No representation or warranty is made to the reasonableness of the assumptions made or that all assumptions used to construct the performance provided have been stated or fully considered.
All LGIMA performance returns in this presentation are presented gross of fees, but are accompanied with an explanation of performance net of investment management fees.
The presentation may also include performance that is based on simulated or hypothetical performance results that have certain inherent limitations. Unlike the results in an actual performance record, these results do not represent actual trading. Because these trades have not actually been executed, these results may have under- or over-compensated for the impact, if any, of certain market factors, such as lack of liquidity. Simulated or hypothetical trading programs in general are also subject to the fact that they are designed with the benefit of hindsight. No representation is being made that any account will or is likely to achieve profits or losses similar to these being shown.
Information obtained from third party sources, although believed to be reliable, has not been independently verified by LGIMA and its accuracy or completeness cannot be guaranteed.
43
Disclosure


