+ All Categories
Home > Documents > Session 3 Managing Voltage Control on a Power System with ... fileCIGRÉ Training Day 2nd December...

Session 3 Managing Voltage Control on a Power System with ... fileCIGRÉ Training Day 2nd December...

Date post: 15-Aug-2019
Category:
Upload: hathu
View: 212 times
Download: 0 times
Share this document with a friend
83
CIGRÉ Training Day 2 nd December 2013 EI, Dublin Slide 1 CIGRÉ - Irish National Committee Session 3 Managing Voltage Control on a Power System with High Renewable Penetration Simon Tweed Tony Hearne Andrew Keane Steve Gough Douglas Cheung
Transcript

CIGRÉ Training Day

2nd December 2013 EI, Dublin

Slide 1 CIGRÉ - Irish National Committee

Session 3

Managing Voltage Control on a Power

System with High Renewable Penetration

Simon Tweed

Tony Hearne

Andrew Keane

Steve Gough

Douglas Cheung

CIGRÉ Training Day

2nd December 2013 EI, Dublin

Slide 2 CIGRÉ - Irish National Committee

Managing Voltage Control on a Power

System with High Renewable Penetration

Simon Tweed

Tony Hearne

PROBLEM DESCRIPTION

Session 3: Managing Voltage on a Power

System with High Renewable Penetration

- TSO Issues

Simon Tweed, EirGrid

CIGRE Ireland Training Day

2nd December 2013

Technical Analysis of the Issues

Detailed Technical Analysis

2008 - All Island Grid Study

2010 - Facilitation of Renewables

2011 - Ensuring a Secure Sustainable System

Issue: Reactive Power Availability (Sync)

0

1,000

2,000

3,000

4,000

5,000

6,000

0% 10% 20% 30% 40% 50% 60% 70% 80% 90% 100%

Re

acti

ve P

ow

er

Cap

abili

ty

(Mva

r)

Percentage of hours in the year

Reactive Power Duration Curves (Lagging)

2010 outturn

2020 base case

Issue: Wind Farm Location &

Reactive Controllability

(2013 Data)

Transmission

Connected 37% (791 MW)

T – not under voltage control

8% (67 MW)

Distribution

Connected 63% (1360 MW)

D – actively controlled

3% (39 MW)

D – not actively controlled

97% (1321 MW)

T – under voltage Control

92% (724 MW)

Issue: Dynamic Stability

Issue: Voltage Dip-Induced Frequency Dip

P Conventional / Wind

t

Managing Voltage Control on a Power

System with

High Renewable Penetration

Problem Description: DSO Perspective

Tony Hearne,

Manager IVADN Project, ESB Networks

10 esbnetworks.ie

Presentation Structure

What makes Distribution Connection different

Degrees of embedding within Distribution System

Traditional voltage-rise

New tools at our disposal

Reactive Range and visibility

Example of inter-windfarm interaction for Cluster scenario

11 esbnetworks.ie

What makes Distribution Connection different

• DSO License obligations

– Must keep all customers terminal voltage within limits [EN 50160] at all times

– Must keep all network voltages within operational limits

– Must minimise distribution network losses

• Varying degrees of embedding in Distribution System

• Varying topologies

• Interaction with existing Distribution Plant

• Interaction with demand

• Voltage Range differences

12 esbnetworks.ie

Type B Type C Type D Type E Type A

Effectiveness of reactive power

for TSO Voltage control

Effectiveness of reactive power

for local DSO Voltage control

Degree of embedding within the Distribution System

Electrical impedance between Generator and Tx System

G G

G G G

G

G

G

G

Varying degrees of embedding in Distribution System

“Traditional” Voltage Rise

14 esbnetworks.ie

Traditional Voltage Rise

If Windfarm operates at unity Power Factor

– there is voltage rise along the feeder

Windfarm

HV station

MW

Voltage

rise

15 esbnetworks.ie

Traditional Voltage Rise

If Windfarm operates such as to import VArs

– Voltage drop due to MVAr offsets voltage rise due to MW

Windfarm

HV station

MW

Voltage

rise

MVar

16 esbnetworks.ie

Traditional Voltage Rise

If Windfarm operates such as to export VArs

– Voltage rise due to MVAr adds to voltage rise due to MW

Windfarm

HV station

MW

Voltage

rise

MVar

17 esbnetworks.ie

Traditional Voltage Rise

Limit 1 at load station dictated by tapping range on transformers

Limit 2 at Windfarm location can be higher

Windfarm

HV station

Limit 1 Limit 2

Existing 38kV Station

New tools at our disposal Now and being contemplated for future use

19 esbnetworks.ie

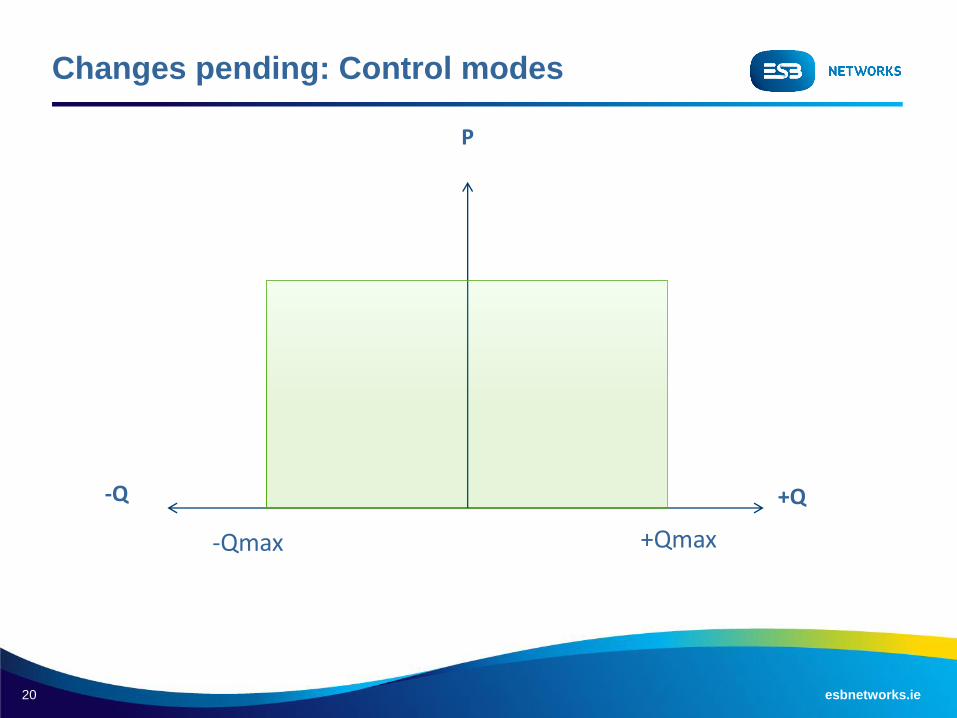
Grid / Distribution Code Changes : Capability

Referring to Figure WFPS1.4:

Point A represents the minimum Mvar absorption capability of the Controllable WFPS at 100% Registered Capacity and is equivalent to 0.95 power factor leading;

Point B represents the minimum Mvar production capability of the Controllable WFPS at 100% Registered Capacity and is equivalent to 0.95 power factor lagging;

Point C represents the minimum Mvar absorption capability of the Controllable WFPS at 12% Registered Capacity and is equivalent to the same Mvar as Point A;

Point D represents the minimum Mvar production capability of the Controllable WFPS at 12% Registered Capacity and is equivalent to the same Mvar as Point B;

Point E represents the minimum Mvar absorption capability of the Controllable WFPS at the cut-in speed of the individual WTGs;

Point F represents the minimum Mvar production capability of the Controllable WFPS at the cut-in speed of the individual WTGs;

The TSO accepts that the values of Points E and F may vary depending on the number of WTGs generating electricity in a low-wind scenario;

MW

Q/Pmax

Registered

Capacity

(Pmax)

A B

C D12% of Registered

Capacity

-0.33 0.33

E F

20 esbnetworks.ie

Changes pending: Control modes

-Q +Q

P

+Qmax -Qmax

21 esbnetworks.ie

Q mode

-Q +Q

P

+Qmax -Qmax

Q set P max

22 esbnetworks.ie

Power Factor mode

-Q +Q

P

+Qmax -Qmax

23 esbnetworks.ie

Voltage Control

-Q +Q

V

+Qmax -Qmax

V reference 1

V reference 2

24 esbnetworks.ie

-Q

+Q

P

+Qmax

-Qmax

P max

25 esbnetworks.ie

-Q

+Q

P

+Qmax

-Qmax

P max

Reactive Range and visibility

27 esbnetworks.ie

G

38 kV DSO Connection

Point

G

38 kV

110 kV

TSO-DSO

operational

boundary

WF 2

WF 1

V

V

Can this be applied to a

distribution wind cluster?

28 esbnetworks.ie

2 + 2 may not equal 4

+ Q - Q

P

WF 1

+ Q - Q

P

WF 2

- Q + Q

P

Composite at

TSO-DSO

Interface

Idealised total

capability Actual total

capability

29 esbnetworks.ie

Interaction with Demand Load

-80

-40

0

-50 -40 -30 -20 -10 0 10

P [MW]

Q [MVAr]

29% load

100% load

∆qmax

P

+

Q

-

Q

P

1

P

2

P

Voltage Range differences

31 esbnetworks.ie

Tx KV % TX KV

112 123.2

111 122.1

110 121

109 119.9

108 118.8

107 117.7

106 116.6

105 115.5

104 114.4

103 113.3

102 112.2

101.5 111.65

101 111.1

100.5 110.55

100 110

99.5 109.45

99 108.9

98.5 108.35

98 107.8

97 106.7

96 105.6

95 104.5

94 103.4

93 102.3

92 101.2

91 100.1

90 99

89 97.9

88 96.8

87 95.7

86 94.6

85 93.5

84 92.4

83 91.3

82 90.2

81 89.1

80 88

79 86.9

78 85.8

77 84.7

MV KV % MV KV

113 22.6

112 22.4

111 22.2

110 22

109 21.8

108 21.6

107 21.4

106 21.2

105 21

104 20.8

103 20.6

102 20.4

101 20.2

100 20

99 19.8

98 19.6

97 19.4

Tap 9

Example of inter-windfarm

interaction for Cluster scenario

33 esbnetworks.ie

Case 3: Strong and weak on same trafo

+ / - 12 MVAr

Tap

Strong

110kV/38kV trafo Standard

Taps Sincal Tap

1 122.5 40.9 5

2 120 40.9 4

3 117.5 40.9 3

4 115 40.9 2

5 112.5 40.9 1

6 110 40.9 0

7 107.5 40.9 -1

8 105 40.9 -2

9 102.5 40.9 -3

10 100 40.9 -4

11 97.5 40.9 -5

12 95 40.9 -6

13 92.5 40.9 -7

14 90 40.9 -8

15 87.5 40.9 -9

16 85 40.9 -10

+ / - 5 MVAr

Weak

Action- 8.4 MVAr

Action- 3.5 MVAr

Reset 3.6 MVAr

S C 2 3

0 . 0 0 M W

1 . 2 8 M v a r

AAG 2 2

1 5 . 0 0 M W

- 0 . 0 0 M v a r

L 2 0

1 4 . 6 1 M W

0 . 1 2 M v a r

1 4 . 6 1 M V A

0 . 2 3 k A

- 1 5 . 0 0 M W

- 1 . 2 9 M v a r

1 5 . 0 6 M V A

0 . 2 3 k A

L 1 6

3 5 . 9 0 M W

2 . 2 3 M v a r

3 5 . 9 7 M V A

0 . 5 5 k A

- 3 6 . 0 0 M W

- 2 . 1 8 M v a r

3 6 . 0 7 M V A

0 . 5 5 k A

AAG 1 5

3 6 . 0 0 M W

0 . 0 0 M v a r

2 T 1 4

- 1 . 0

5 0 . 3 6 M W

- 6 . 6 5 M v a r

5 0 . 7 9 M V A

0 . 3 0 k A

- 5 0 . 5 1 M W

- 2 . 3 4 M v a r

5 0 . 5 6 M V A

0 . 7 8 k A

S C 1 2

0 . 0 0 M W

2 . 1 6 M v a r

I 1 0

- 5 0 . 3 6 M W

6 . 6 5 M v a r

3 8 . 6 2 k V

1 0 1 . 6 2 %

3 7 . 5 8 k V

9 8 . 9 0 %

3 7 . 4 6 k V

9 8 . 5 8 %

9 8 . 9 1 k V

8 9 . 9 2 %

Reset 1.5 MVAr

34 esbnetworks.ie

80

81

82

83

84

85

86

87

88

89

90

91

92

93

94

95

96

97

98

99

100

101

102

103

104

105

106

107

108

109

110

111

112

113

114

115

116

117

118

-17 -16 -15 -14 -13 -12 -11 -10 -9 -8 -7 -6 -5 -4 -3 -2 -1 0 1 2 3 4 5 6 7 8 9 10 11 12 13 14 15 16 17

Q [MVAr]

V [%

nom

]Case 3: Strong and weak on same trafo

35 esbnetworks.ie

80

81

82

83

84

85

86

87

88

89

90

91

92

93

94

95

96

97

98

99

100

101

102

103

104

105

106

107

108

109

110

111

112

113

114

115

116

117

118

119

120

121

122

-17 -16 -15 -14 -13 -12 -11 -10 -9 -8 -7 -6 -5 -4 -3 -2 -1 0 1 2 3 4 5 6 7 8 9 10 11 12 13 14 15 16 17

Q [MVAr]

V [%

nom

]Case 3: Strong and weak on same trafo

36 esbnetworks.ie

Case 3: Strong and weak on same trafo

80

81

82

83

84

85

86

87

88

89

90

91

92

93

94

95

96

97

98

99

100

101

102

103

104

105

106

107

108

109

110

111

112

113

114

115

116

117

118

119

120

121

122

-17 -16 -15 -14 -13 -12 -11 -10 -9 -8 -7 -6 -5 -4 -3 -2 -1 0 1 2 3 4 5 6 7 8 9 10 11 12 13 14 15 16 17

Q [MVAr]

V [%

nom

]

37 esbnetworks.ie

Case 3: Strong and weak on same trafo

80

81

82

83

84

85

86

87

88

89

90

91

92

93

94

95

96

97

98

99

100

101

102

103

104

105

106

107

108

109

110

111

112

113

114

115

116

117

118

119

120

121

122

-17 -16 -15 -14 -13 -12 -11 -10 -9 -8 -7 -6 -5 -4 -3 -2 -1 0 1 2 3 4 5 6 7 8 9 10 11 12 13 14 15 16 17

Q [MVAr]

V [%

nom

]

38 esbnetworks.ie

80

81

82

83

84

85

86

87

88

89

90

91

92

93

94

95

96

97

98

99

100

101

102

103

104

105

106

107

108

109

110

111

112

113

114

115

116

117

118

119

120

121

122

-17 -16 -15 -14 -13 -12 -11 -10 -9 -8 -7 -6 -5 -4 -3 -2 -1 0 1 2 3 4 5 6 7 8 9 10 11 12 13 14 15 16 17

Q [MVAr]

V [%

nom

]Case 3: Strong and weak on same trafo

Tx V [%]

88

90

92

94

96

98

100

102

0 1 2 3 4 5 6 7 8

Tx voltage drops

Both operating

points move

along their droop

slope

39 esbnetworks.ie

80

81

82

83

84

85

86

87

88

89

90

91

92

93

94

95

96

97

98

99

100

101

102

103

104

105

106

107

108

109

110

111

112

113

114

115

116

117

118

119

120

121

122

-17 -16 -15 -14 -13 -12 -11 -10 -9 -8 -7 -6 -5 -4 -3 -2 -1 0 1 2 3 4 5 6 7 8 9 10 11 12 13 14 15 16 17

Q [MVAr]

V [%

nom

]Case 3: Strong and weak on same trafo

Tx V [%]

88

90

92

94

96

98

100

102

0 1 2 3 4 5 6 7 8

“Strong” hits Q action

AVR intervention

triggered

Strong V-ref lowered

Action stops when

“Strong” goes below Q

reset

40 esbnetworks.ie

80

81

82

83

84

85

86

87

88

89

90

91

92

93

94

95

96

97

98

99

100

101

102

103

104

105

106

107

108

109

110

111

112

113

114

115

116

117

118

119

120

121

122

-17 -16 -15 -14 -13 -12 -11 -10 -9 -8 -7 -6 -5 -4 -3 -2 -1 0 1 2 3 4 5 6 7 8 9 10 11 12 13 14 15 16 17

Q [MVAr]

V [%

nom

]Case 3: Strong and weak on same trafo

Tx V [%]

88

90

92

94

96

98

100

102

0 1 2 3 4 5 6 7 8

“Weak” now close to it’s Q

action

Tx V drops

“Weak” hits it’s Q action

AVR intervention triggered

Weak V-ref lowered

Action stops when “Weak” goes

below Q reset

41 esbnetworks.ie

80

81

82

83

84

85

86

87

88

89

90

91

92

93

94

95

96

97

98

99

100

101

102

103

104

105

106

107

108

109

110

111

112

113

114

115

116

117

118

119

120

121

122

-17 -16 -15 -14 -13 -12 -11 -10 -9 -8 -7 -6 -5 -4 -3 -2 -1 0 1 2 3 4 5 6 7 8 9 10 11 12 13 14 15 16 17

Q [MVAr]

V [%

nom

]Case 3: Strong and weak on same trafo

Tx V [%]

88

90

92

94

96

98

100

102

0 1 2 3 4 5 6 7 8

110kV/38kV trafo Standard

Taps Sincal Tap

1 122.5 40.9 5

2 120 40.9 4

3 117.5 40.9 3

4 115 40.9 2

5 112.5 40.9 1

6 110 40.9 0

7 107.5 40.9 -1

8 105 40.9 -2

9 102.5 40.9 -3

10 100 40.9 -4

11 97.5 40.9 -5

12 95 40.9 -6

13 92.5 40.9 -7

14 90 40.9 -8

15 87.5 40.9 -9

16 85 40.9 -10

Tx V drops further

“strong” once again hits Q action

AVR intervention triggered

V ref lowered but hits V min

Tap change initiated

Tap until either or both come

below Q reset

42 esbnetworks.ie

Q /V at TSO-DSO Interface

Tx V against Q at TSO-DSO Interface

88

90

92

94

96

98

100

102

-10 -8 -6 -4 -2 0 2

Q at TSO-DSO Interface [MVar]

Tx V

[%

of

No

m]

Questions ?

CIGRÉ Training Day

2nd December 2013 EI, Dublin

Slide 44 CIGRÉ - Irish National Committee

Managing Voltage Control on a Power

System with High Renewable Penetration

Andrew Keane

RANGE OF SOLUTIONS

Managing reactive power on power

systems with high renewable

penetration

Range of Possible Solutions

December 2013

Dr Andrew Keane

University College Dublin

46

• Function traditionally taken care of by synchronous generators and capacitor banks

– In some cases FACTs devices also employed

• At distribution level tap changers play a big role

Reactive Power/Voltage Control

47

1. Renewable generation causing displacement of conventional generators

2. Renewable generation connecting to distribution system

Changing Circumstances

48

Synchronous Machine Capability

0

10

20

30

40

50

-35 -15 5 25 45

Act

ive

Po

we

r (M

W)

Reactive power (MVAr)

Sync Machine

49

Wind P-Q Capability

0

0.2

0.4

0.6

0.8

1

-0.7 -0.5 -0.3 -0.1 0.1 0.3 0.5

ActivePower (pu)

Reactive Power (pu)

50

• Grid code requirements

• Const. PF

• Const. V

• Const. Q

What can wind do?

MW

Q/Pmax

Registered

Capacity

(Pmax)

A B

C D12% of Registered

Capacity

-0.33 0.33

E F

51

Distributed Generation

PowerFactory 14.0.514

Project:

Graphic: Grid

Date: 4/26/2012

Annex:

Nodes Branches

Sub-sea cable

33 kV

132 kV

Gen. D(8 MW)

Gen. B(12.5 MW)

Gen. C(15 MW)

Gen. A(16 MW)

336

323 325

322

326

328

314&315

301

321&320

313&312

335

334

309

307&308

305&306

304

311

310

339

100

302&303

327

330

329

G~

G~

G~

G~

52

Distribution/Transmission Interface

0

10

20

30

40

50

-35 -25 -15 -5 5 15 25

Act

ive

Po

wer

(M

W)

Reactive Power (MVAr)

Raw (P,Q)

99% Reliability

Cuffe, P., Smith, P. And Keane A., “Capability Chart for Distributed Reactive Power Resources”, IEEE Transactions on Power

Systems, 2013

53

• Provision of additional MVAr capacity

Possible Solutions

54

• Better utilisation of existing capacity

– Software based solution providing enhanced controllability

– Optimised controller settings requiring no operational change

Possible Solutions

55

Test system

132 kV

33 kV

DxCGen: 29 MW

Load: 52 MW

DxBGen: 40 MW

Load: 35 MW

DxAGen: 22 MW

Load: 17 MW

2926

23

1614

28

7

22

24 15

10

3

2

18

30

12

19

20

6

8

17

27

1

5

4

21

25

DG-B318 MW

DG-B115 MW

DG-C325 MW

G~

Gen1200 MW

G~

Gen280 MW

11

DG-B27 MW

DG-A115 MW

11

DG-C29 MW

G~

Gen1130 MW

G~

Gen

835 M

W

00

DG-C120 MW

G~

Gen550 MW

G~

Gen1340 MW

DG

-A2

7 M

W

56

Unity Power Factor

57

Wind Q-V Response

Keane, A., Diskin, E., Cuffe, P, Harrington, P., Hearne, T., Brooks, D., Rylander, M., and Fallon, T., “Evaluation of Advanced

Operation and Control of Distributed Wind Farms to Support Efficiency and Reliability for High Penetrations of Wind Power”,

IEEE Transactions on Sustainable Energy, vol. 3, Oct 2012.

58

Non optimised voltage control

59

• Desired response is given by simultaneously:

– Maximising the aggregate reactive power injection for the lower-voltage periods and the absorption for higher-voltage periods

• Utilise multi scenario ACOPF with embedded models of voltage control and tap changer

• Determines fixed voltage set-points, droops and tap setting

Possible Desired Response

60

Optimised settings

Cuffe, P., and Keane A., “Voltage Responsive Distribution Networks Using Enhanced Generator and Transformer Settings”, IEEE

Transactions on Power Systems, (in review) 2013

61

• Optimised fixed settings for DG and trafo

• Deliver desirable voltage response at transmission

• Distribution constraints all respected

• Real time control could deliver more

Result

62

• Question of capacity and location

• Scope for improvement in control of existing resources

• A lot can be achieved with optimised settings

• Real time control has potential for further benefits

Summary

63

Acknowledgements

CIGRÉ Training Day

2nd December 2013 EI, Dublin

Slide 64 CIGRÉ - Irish National Committee

Managing Voltage Control on a Power

System with High Renewable Penetration

Steve Gough

Douglas Cheung

SOLUTION CASE STUDY

HV Voltage Control

Hitachi’s D-SVC integration onto the 11kV distribution network

Steven Gough – WPD

Douglas Cheung – Hitachi Europe

Customers

Testing innovative solutions to make

it simple for customers to connect Low

Carbon Technologies

Performance

Developing new solutions to

improve network and business performance

Networks

Demonstrating alternative investment strategies to

facilitate the UK’s Low Carbon Transition

Stakeholder Engagement and Knowledge Management

Innovation Strategy

Super Conducting Fault Current

Limiter

Isentropic Energy Storage

Carbon Tracing

Project Specifics

• Two phases

• A 400kVar D-SVC on the end of a 11kV feeder adjacent to a 1.8MW windfarm

• Three 400kVar D-SVCs spread across two feeders of a Primary Substation’s network with a centralised control system D-QVC

• Looking to investigate effectiveness of using reactive power for controlling voltage at feeder ends

• Specifically looking to help the integration for further DG across rural networks

HV Voltage Control

© Hitachi Europe Ltd. 2013. All rights reserved.

LCNF Project Overview

68

Substation

11kv OH line

Wind Farm

D-STATCOM

4 Project Locations

Agreed

Tentative

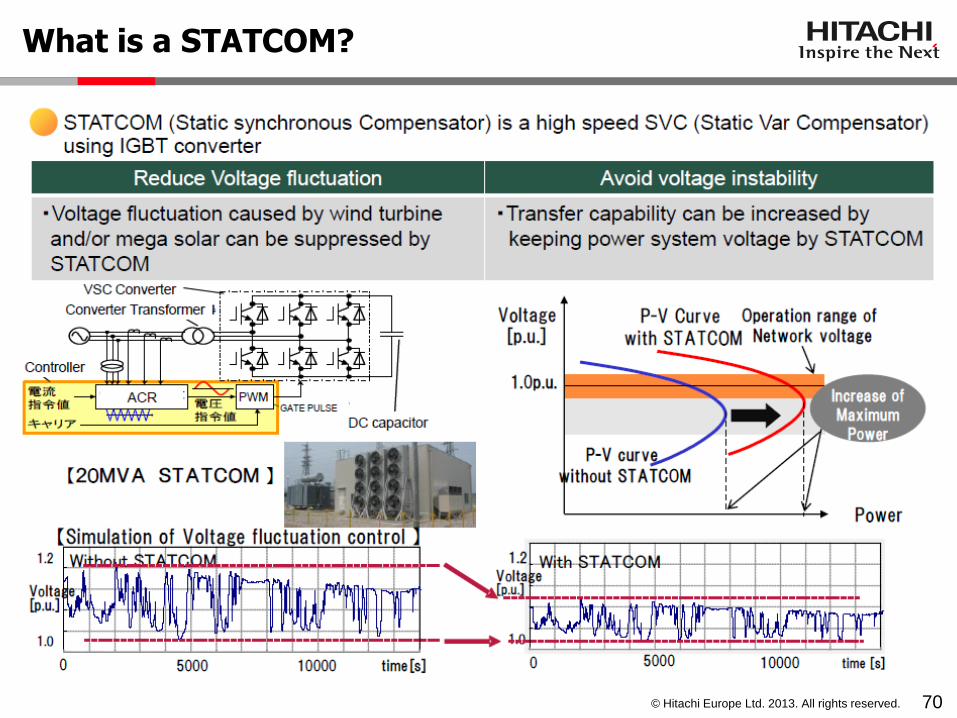
LCNF Tier 1 project • As DG (Distributed Generation) becomes more common, the growing number of renewable connections to distribution lines is expected to cause voltage fluctuations (specifically high or low voltage) due to the variable power output of the DG. In turn this can affect the efficiency and capacity of the distribution network.

• Determine the effectiveness of D-STATCOM as a dynamic voltage control system in rural 11kV networks to address voltage fluctuation.

• Optimise control by using a D-VQC (Voltage and Reactive Power Control System) to network multiple D-STATCOMs.

Goals

• 2 Strand project, initially 1 D-STATCOM as proof of concept, then 3 additional units as well as a D-VQC server.

Scope

• Improvement of power quality and mitigation of voltage spikes issues, thereby increasing network stability, efficiency and load capacity in distribution networks.

• Learning from project will be beneficial for informing DNOs business case for alternative responses to network rebuild.

Expected Benefits

Background

© Hitachi Europe Ltd. 2013. All rights reserved.

© Hitachi Europe Ltd. 2013. All rights reserved.

Power Quality Problems Created by RE

69

shine

cloud

rain

3.2kW PV

1200kW Wind-Power

Fluctuated power output from RE

(a) Reverse Power Flow from RE

(b) Generator Cut Off SVR: Step Voltage Regulator RE: Renewable Energy

Violation of Voltage management level

Line distance

Reverse Power

Violation

voltage

RE SVR

Management level

voltage

P

Drop P

SVR tap change

RE

time Voltage violation

RE cut off

P

P

P

SVR

Management level

Voltage fluctuation

voltage

time

Voltage fluctuation

Management level

© Hitachi Europe Ltd. 2013. All rights reserved. 70

What is a STATCOM?

© Hitachi Europe Ltd. 2013. All rights reserved.

Control Block Diagram of D-SVC/D-STATCOM

71

Mode Block Diagram Target

AVR

All fluctuations

ARV

Long-term fluctuation (minutes)

SFV

Short-term fluctuation (seconds)

s

KK I

PsT11

1

referenceV

V I

pKsT11

1

Moving Average

V I

sT11

1

sT

sT

3

2

1 pKIV

HPF

AVR : Automatic Voltage Regulation, ARV : Average Reference Voltage SFV : Short-term Fluctuation of Voltage, VSC : Voltage Source Converter

© Hitachi Europe Ltd. 2013. All rights reserved.

Using Reactive Power to Control Voltage

72

5600

5800

6000

6200

6400

6600

6800

7000

0 60 120 180 240 300

Time (sec)

Dis

trib

ution L

ine V

oltage (

V)

-450

-300

-150

0

150

300

450

600

Q (

kva

r)

Line Voltage with D-STATCOM

D-STATCOM Q

SVR2 tap

Line Voltage without D-STATCOM (estimation)

-195kVar

-100kVar

60 sec 6250V

6515

V tap 4

tap 3 tap 2

D-STATCOM operation

SVR operation

RE sudden power change

Reactive power can be used to control the distribution line voltage against sudden power change of RE between taps of SVR

Phase 1

HV Voltage Control

• D-SVC is installed on site adjacent to a 1.8MW windfarm in Cornwall

• Protection was installed on the LV side of the transformer as there was not a metering unit

• Monitoring equipment was installed along the feeder

• D-SVC has been running on various modes for nearly a year and a half

D-SVC

G

Summerheath

Roskrow WF

Kernick Industrial Estate

Bickland Hill Primary

Phase 1 Output Graphs (1)

Real and Reactive Power at Windfarm

-200

0

200

400

600

800

1000

1200

1400

1600

1800

00:00 02:00 04:00 06:00 08:00 10:00 12:00 14:00 16:00 18:00 20:00 22:00 00:00

Time

Po

we

r

Average kW

Max kW

Min kW

Average kVar

Max kVar

Min kVar

Real and Reactive Power at SVC

-500

-400

-300

-200

-100

0

100

200

300

400

500

00:00 02:00 04:00 06:00 08:00 10:00 12:00 14:00 16:00 18:00 20:00 22:00 00:00

Time

Po

we

r

Average kW

Max kW

Min kW

Average kVar

Max kVar

Min kVar

Voltage at D-SVC

225

230

235

240

245

250

00:00 02:00 04:00 06:00 08:00 10:00 12:00 14:00 16:00 18:00 20:00 22:00 00:00

TimeP

ha

se

to

Lin

e V

otla

ge

Va

Va(max)

Va(min)

Vb

Vb(max)

Vb(min)

Vc

Vc(max)

Vc(min)

Phase 1 Output Graphs (2)

Voltage at D-SVC

225

230

235

240

245

250

00:00 02:00 04:00 06:00 08:00 10:00 12:00 14:00 16:00 18:00 20:00 22:00 00:00

Time

Ph

ase

to

Lin

e V

otla

ge

Va

Va(max)

Va(min)

Vb

Vb(max)

Vb(min)

Vc

Vc(max)

Vc(min)

Voltage at Windfarm

6000

6050

6100

6150

6200

6250

6300

6350

6400

6450

00:00 02:00 04:00 06:00 08:00 10:00 12:00 14:00 16:00 18:00 20:00 22:00 00:00

TimeP

ha

se

to

Lin

e V

otla

ge

Va

Va(max)

Va(min)

Vb

Vb(max)

Vb(min)

Vc

Vc(max)

Vc(min)

Voltage at Bickland Hill Primary

5950

6000

6050

6100

6150

6200

6250

6300

6350

6400

6450

00:00 02:00 04:00 06:00 08:00 10:00 12:00 14:00 16:00 18:00 20:00 22:00 00:00

Time

Ph

ase

to

Lin

e V

otla

ge

Va

Va(max)

Va(min)

Vb

Vb(max)

Vb(min)

Vc

Vc(max)

Vc(min)

Phase 1 Output Graphs (3)

Voltage at Windfarm with D-SVC Switched In

6050

6100

6150

6200

6250

6300

6350

6400

6450

6500

6550

00:00 02:00 04:00 06:00 08:00 10:00 12:00 14:00 16:00 18:00 20:00 22:00 00:00

Time

Ph

ase

to

Lin

e V

otla

ge

Va

Va(max)

Va(min)

Vb

Vb(max)

Vb(min)

Vc

Vc(max)

Vc(min)

Voltage at Windfarm with D-SVC Switched Out

6050

6100

6150

6200

6250

6300

6350

6400

6450

6500

6550

00:00 02:00 04:00 06:00 08:00 10:00 12:00 14:00 16:00 18:00 20:00 22:00 00:00

Time

Ph

ase

to

Ea

rth

Vo

tla

ge

Va

Va(max)

Va(min)

Vb

Vb(max)

Vb(min)

Vc

Vc(max)

Vc(min)

Plans for Phase 2 • Three D-SVCs will be used on one primary two on a feeder

with multiple small generators and the other a feeder with one larger generator

• A D-VQC (Voltage and Reactive Power (Q) Control System) will be used at the primary to control all three D-SVCs and the tap changer at the primary substations

• This will demonstrate cohesive voltage optimisation across the primary

D-SVC

D-SVC G

D-SVC G G G G G G

Learning so far

• Sizing and impedance the transformer is import to get right for a D-SVC.

• The D-SVC can help smooth the voltage

• The D-SVC can help reduce the voltage range seen on the 11kV

• D-SVC over and under voltage protection needs to be on the HV side of the transformer

Any Questions?

Steven Gough – WPD

Douglas Cheung – Hitachi Europe

CIGRÉ Training Day

2nd December 2013 EI, Dublin

Slide 80 CIGRÉ - Irish National Committee

Questions & Answers

Managing Voltage Control on a

Power System with High Renewable Penetration

PUBLICATIONS

Paris 2012 & 2014

• 2012 - SC B4 HVDC and Power Electronics – PS2 > HVDC and FACTS Technology Developments

• FACTS equipment

– PS3 > Applications of HVDC and FACTS • FACTS equipment for increased AC network performance

• Use of Power Electronics to facilitate the integration of large renewable energy sources into AC networks

• 2014 - SC B4 HVDC and Power Electronics – PS2 > FACTS Systems and Applications

• Renewable Resources Integration

• Increased network performance

Publications • Technical Brochures

– TB 523 System Complexity and Dynamic Performance – TB 310 Coordinated Voltage Control in Transmission Networks. – TB 371 Static Synchronous Series Compensator

• Session Papers / Electra

– Comparison of the dynamic response of wind power generators of different technologies in case of voltage dips

– Voltage and VAr Support in System Operation – Development and testing of ride-through capability solutions for

a wind turbine with doubly fed induction generator using VSC t – Real time dynamic security assessment and control by

combining FACTS and SPS – FACTS for enabling wind power generation


Recommended