and benign clustered microcal~ifications: automated feature analysis and classification. Radiology 1996; 198(3):671-8. 11. Lou SL, Sickles EA, Huang HK, et al. Full-field direct digi- tal telemammography: technical components, study proto- cols, and preliminary results. IEEE Trans on Inform Tech Biom 1997. 12. National Electrical Manufacturers Association. Digital im- aging and communications in medicine (DICOM) (PS3- 1996). Rosslyn, VA: NEMA, 1997. 13. Reiker GG, Blume HR, Slone RM, et al. Filmless digital chest radiography within the radiology department. Proc SPIE 1997; 3035:355-368. 14. Shile PE, Fujii T, Ramamurthy V, Blaine GJ, Cox JR, Jost RG. Observer productivity reading full-field-of view digital mammograms: an evaluation of a soft-copy workstation supported by a high-capacity high performance display buffer. Proc SPIE 1997; 3035:287-290. Session 4: Image Perception and Workstation Design for Mammography This statement starts with a review of the sources of error in mammography. We indicate that at least half of the er- rors are due to faulty image perception. We then describe some of the principles of perception and show how under- standing them can benefit mammography. The research that is needed to achieve these benefits is outlined. In the short term it is important to understand display system and environment tradeoffs that affect the detection and dis- crimination of abnormalities in mammography and to use this information to improve user interfaces. The long term goal is to develop predictive models that allow calculation of how to improve human performance by changes in im- ages, detectors, displays, and the environment. The Importance of Image Perception to Mammography Mammography is a definitive diagnostic procedure. The mammographic exam whether it is film or digitally based is and will be the primary diagnostic procedure for breast cancer detection screening. Other imaging modali- ties such as MRI, ultrasound, or nuclear medicine are used primarily to aid in the diagnosis of breast cancer. A nega- tive mammogram returns the woman to routine screening and a missed cancer becomes a missed opportunity for early treatment. About half of the cancers missed at screening mam- mography are missed for perceptual reasons. The actual number of cancers missed in the usual clinical practice is unknown. Cancers can be missed because the imaging technique has failed to record them adequately or because the reader either does not see the cancer or sees it and de- cides that it is something else. These can be simply classi- fied as technological, perceptual, and interpretational er- rors, respectively. Bird et al. 1 analyzed 77 cancers that were missed dur- ing screening a population of about 77,000 women? The results shown in Table 4-1 indicate that 43% of the misses were perceptual, meaning that the cancer was recorded in the image but not seen. A review of 575 screening-detected cancers and 102 in- terval cancers found in the Canadian National Breast Can- cer Screening Study showed that 46% of the screening-de- tected cancers and 34% of the interval cancers had a pre- vious image that showed the cancer not reported on the initial reading. 3 The data are shown in Table 4-2. There is also a very large variation in cancer detection performance among radiologists. Beam et al. gave 108 ra- diologists a mammography reading test consisting of 79 screening mammograms. 4 The results are summarized in Table 4-3. The median sensitivity of 80% indicates that on average 20% of the cancers known to be visible in the im- ages were missed. In addition, note the wide variation in performance as shown by the minimum and maximum values. These data indicate that observer error is an important issue for mammography and that methods for minimizing observer error should be incorporated into imaging sys- tems. This is why so much effort has been put into CAD. The Perception of Information Displayed on a Workstation The purpose of workstations is to transfer image infor- mation from the display surface to the human perceptual system?, 6 The efficiency of the transfer is influenced by (1) the matching of the physical properties of the display to the visual system, (2) the working environment, (3) the computer interface, and (4) the expertise of the observer. Matching the physical properties of the display to the visual system. • Image size and spatial resolution: The effects of display size and pi×el size on the detectability of abnor- malities on mammograms have not been clearly deter- mined. Mammographers typically use magnifying lenses when searching mammograms for microcalcifications. On a workstation this activity must be accomplished by a zoom and rove operation. S215
Transcript
and benign clustered microcal~ifications: automated feature analysis and classification. Radiology 1996; 198(3):671-8.
11. Lou SL, Sickles EA, Huang HK, et al. Full-field direct digi- tal telemammography: technical components, study proto- cols, and preliminary results. IEEE Trans on Inform Tech Biom 1997.
12. National Electrical Manufacturers Association. Digital im- aging and communications in medicine (DICOM) (PS3- 1996). Rosslyn, VA: NEMA, 1997.
13. Reiker GG, Blume HR, Slone RM, et al. Filmless digital chest radiography within the radiology department. Proc SPIE 1997; 3035:355-368.
14. Shile PE, Fujii T, Ramamurthy V, Blaine GJ, Cox JR, Jost RG. Observer productivity reading full-field-of view digital mammograms: an evaluation of a soft-copy workstation supported by a high-capacity high performance display buffer. Proc SPIE 1997; 3035:287-290.
Session 4: Image Perception and Workstation Design for Mammography This statement starts with a review of the sources of error in mammography. We indicate that at least half of the er-
rors are due to faulty image perception. We then describe
some of the principles of perception and show how under-
standing them can benefit mammography. The research
that is needed to achieve these benefits is outlined. In the
short term it is important to understand display system and
environment tradeoffs that affect the detection and dis-
crimination of abnormalities in mammography and to use this information to improve user interfaces. The long term
goal is to develop predictive models that allow calculation
of how to improve human performance by changes in im-
ages, detectors, displays, and the environment.
The Importance of Image Perception to Mammography
Mammography is a definitive diagnostic procedure. The mammographic exam whether it is film or digitally
based is and will be the primary diagnostic procedure for breast cancer detection screening. Other imaging modali-
ties such as MRI, ultrasound, or nuclear medicine are used
primarily to aid in the diagnosis of breast cancer. A nega-
tive mammogram returns the woman to routine screening
and a missed cancer becomes a missed opportunity for
early treatment.
About half of the cancers missed at screening mam- mography are missed for perceptual reasons. The actual
number of cancers missed in the usual clinical practice is
unknown. Cancers can be missed because the imaging
technique has failed to record them adequately or because
the reader either does not see the cancer or sees it and de-
cides that it is something else. These can be simply classi-
fied as technological, perceptual, and interpretational er- rors, respectively.
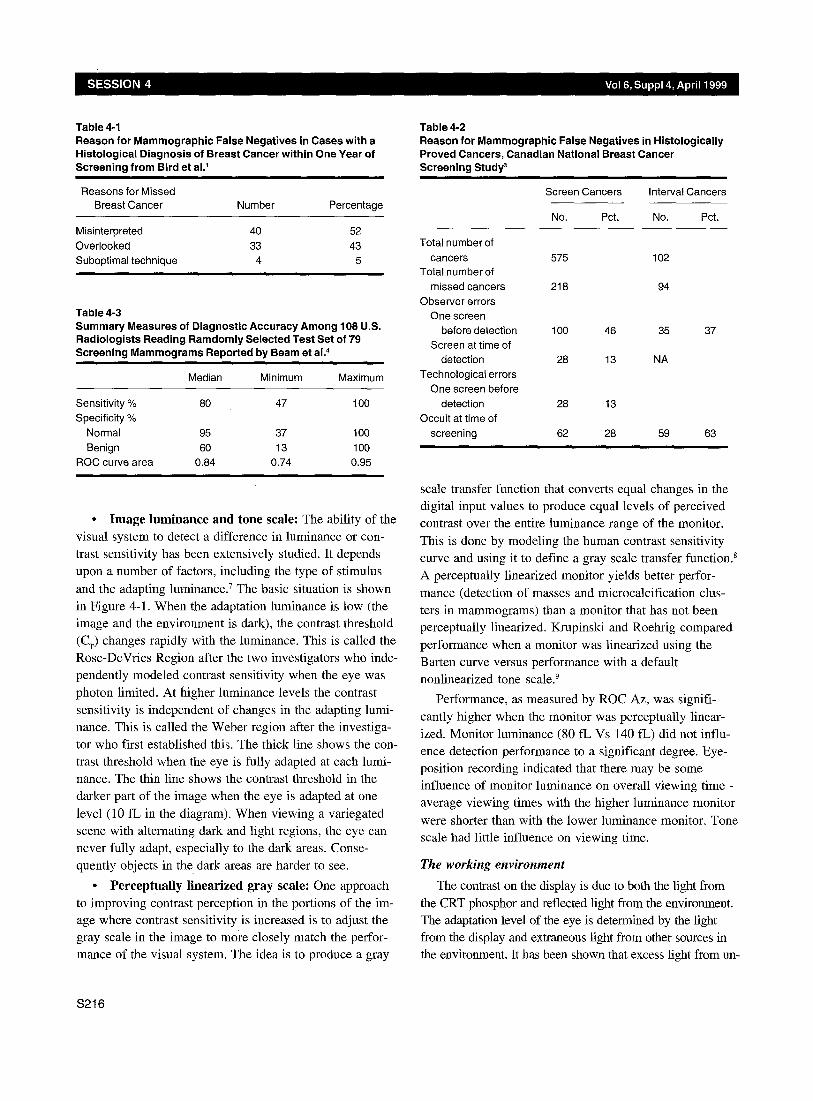
Bird et al. 1 analyzed 77 cancers that were missed dur-
ing screening a population of about 77,000 women? The
results shown in Table 4-1 indicate that 43% of the misses
were perceptual, meaning that the cancer was recorded in
the image but not seen.
A review of 575 screening-detected cancers and 102 in-
terval cancers found in the Canadian National Breast Can-
cer Screening Study showed that 46% of the screening-de-
tected cancers and 34% of the interval cancers had a pre-
vious image that showed the cancer not reported on the
initial reading. 3 The data are shown in Table 4-2.
There is also a very large variation in cancer detection
performance among radiologists. Beam et al. gave 108 ra-
diologists a mammography reading test consisting of 79
screening mammograms. 4 The results are summarized in Table 4-3. The median sensitivity of 80% indicates that on
average 20% of the cancers known to be visible in the im-
ages were missed. In addition, note the wide variation in
performance as shown by the minimum and maximum
values.
These data indicate that observer error is an important
issue for mammography and that methods for minimizing
observer error should be incorporated into imaging sys- tems. This is why so much effort has been put into CAD.
The Perception of Information Displayed on a Workstation
The purpose of workstations is to transfer image infor-
mation from the display surface to the human perceptual
system?, 6 The efficiency of the transfer is influenced by
(1) the matching of the physical properties of the display to the visual system, (2) the working environment, (3) the
computer interface, and (4) the expertise of the observer.
Matching the physical properties of the display to the visual system.
• Image size and spatial resolution: The effects of
display size and pi×el size on the detectability of abnor-
malities on mammograms have not been clearly deter-
mined. Mammographers typically use magnifying lenses when searching mammograms for microcalcifications. On
a workstation this activity must be accomplished by a
zoom and rove operation.
S215
Table 4-1 Reason for Mammographic False Negatives in Cases with a Histological Diagnosis of Breast Cancer within One Year of Screening from Bird et al. 1
Reasons for Missed Breast Cancer Number Percentage
Misinterpreted 40 52
Overlooked 33 43 Suboptimal technique 4 5
Table 4-3 Summary Measures of Diagnostic Accuracy Among 108 U.S. Radiologists Reading Ramdomly Selected Test Set of 79 Screening Mammograms Reported by Beam et al. 4
Median Minimum Maximum
Sensitivity % 80 47 100 Specificity %
Normal 95 37 100 Benign 60 13 100
ROC curve area 0.84 0.74 0.95
• Image luminance and tone scale: The ability of the visual system to detect a difference in luminance or con- trast sensitivity has been extensively studied. It depends
upon a number of factors, including the type of stimulus
and the adapting luminance, v The basic situation is shown
in Figure 4-1. When the adaptation luminance is low (the image and the environment is dark), the contrast threshold (CT) changes rapidly with the luminance. This is called the Rose-DeVries Region after the two investigators who inde- pendently modeled contrast sensitivity when the eye was
photon limited. At higher luminance levels the contrast sensitivity is independent of changes in the adapting lumi- nance. This is called the Weber region after the investiga-
tor who first established this. The thick line shows the con- trast threshold when the eye is fully adapted at each lumi- nance. The thin line shows the contrast threshold in the darker part of the image when the eye is adapted at one
level (10 fL in the diagram). When viewing a variegated scene with alternating dark and light regions, the eye can never fully adapt, especially to the dark areas. Conse-
quently objects in the dark areas are harder to see.
• Perceptual ly l inearized gray scale: One approach
to improving contrast perception in the portions of the im- age where contrast sensitivity is increased is to adjust the gray scale in the image to more closely match the perfor- mance of the visual system. The idea is to produce a gray
Table 4-2 Reason for Mammographic False Negatives in Histologically Proved Cancers, Canadian National Breast Cancer Screening Study 3
Screen Cancers Interval Cancers
No. Pct. No. Pct.
Total number of cancers 575 102
Total number of missed cancers 218 94
Observer errors One screen
before detection 100 46 35 37 Screen at time of
detection 28 13 NA Technological errors
One screen before detection 28 13
Occult at time of screening 62 28 59 63
scale transfer function that converts equal changes in the digital input values to produce equal levels of perceived contrast over the entire luminance range of the monitor.
This is done by modeling the human contrast sensitivity curve and using it to define a gray scale transfer function. 8 A perceptually linearized monitor yields better perfor-
mance (detection of masses and microcalcification clus- ters in mammograms) than a monitor that has not been perceptually linearized. Krupinski and Roehrig compared
performance when a monitor was linearized using the
Barten curve versus performance with a default nonlinearized tone scale. 9
Performance, as measured by ROC Az, was signifi-
cantly higher when the monitor was perceptually linear- ized. Monitor luminance (80 fL Vs 140 fL) did not influ- ence detection performance to a significant degree. Eye- position recording indicated that there may be some influence of monitor luminance on overall viewing time - average viewing times with the higher luminance monitor
were shorter than with the lower luminance monitor. Tone scale had little influence on viewing time.
The working environment
The contrast on the display is due to both the light from
the CRT phosphor and reflected light from the environment. The adaptation level of the eye is determined by the light from the display and extraneous light from other sources in the environment. It has been shown that excess light from un-
S216
Vol 6, Suppl 4, April 1999 REPORT ON DIGITAL M A M M O G R A P H Y
t R o s e - D e V r i e s
W e b e r
I I I I I I 0.01 0.1 1 10 100 1000
Adapting Luminance - fl-
Figure 4l l . Changes in contrast threshold relative to changes in the adapting luminance
masked portions of the display and the ambient illumination
can decrease the detectability of microcalcifications on mam- mograms? ° This effect is due to both loss of display contrast and decreased visual contrast sensitivity.
The computer interface
The arrangement of the images on the display, the use of image processing tools, and the control of the computer
interface have not been studied carefully enough in mam- mography. The success or failure of a workstation may de-
pend more on the way it functions than on the quality of
the images. Time and motion studies are an important and efficient way to design proper and useful computer human interfaces. H These principles have been applied to work-
stations for other imaging applications. 12
The expertise of the observer
Knowledge and experience clearly play a role in the in- terpretation of mammograms. Familiarity with the image content and the task influence diagnostic performance and the way that readers search the images. Krupinski found that readers with more experience tended to detect lesions earlier in search than readers with less experience; but
readers with less experience tended to spend more time overall searching the images and covered more image area than those with more experience. 13 Nodine et al. also ob-
served that experienced readers are characterized by speed and efficiency. TM
M o d e l s for I m a g e P e r c e p t i o n
It is impossible to test clinically every change in an im- aging system. The solution is to develop a model that will
predict how system changes will affect performance. These models have the following form.
Decision theory models have been developed that relate the performance of an ideal observer on a specific task to the physical properties of the image. 15-17 Models can be used to predict how changes in the physical properties of the imaging system (contrast, unsharpness, noise) will af- fect performance. This type of modeling is currently being
extended to include backgrounds that are very similar to those found in mammograms.
M e a s u r i n g O b s e r v e r P e r f o r m a n c e : A c c u r a c y a n d P r o c e s s
When comparing film versus workstation viewing of radiographic images, a number of factors relating to pro-
cess and accuracy can be evaluated. The most important question that must be addressed is whether diagnostic ac- curacy using a workstation is at least as good as that when viewing film images. There are accepted measures of di- agnostic accuracy that can and should be used in an objec- tive assessment of observer performance. Although re-
ceiver operating characteristic (ROC) studies can be time- consuming and laborious, they do measure diagnostic performance reliably and they also permit valid statistical comparisons between viewing modalities. Other measures, such as sensitivity and specificity, and positive and nega- tive predictive value are also accepted objective measures
of diagnostic performance that can be derived without do- ing an ROC based study; however, they are biased by dif- ferences in the use of diagnostic criteria and by the preva- lence of abnormality. Other measures and alternatives to ROC analysis (e.g., alternative forced-choice protocols) also exist and can be used as objective measures of ob-
server performance. Subjective measures are useful and
informative, but should not be used as the sole means of deciding whether one display modality is better than an- other. Subjective assessments of image quality should al- ways be accompanied by objective measures of perfor- mance.
Measures of the process of reading images are also im- portant because they are the determinants of efficiency and fatigue. These measures include viewing time, num- ber of operations performed during viewing, times associ-
$217
ated with viewing particular parts of a display, such as the
time spent looking at the diagnostic image versus the
menu on a computer display, and times associated with
different diagnostic decisions. The time spent viewing various parts of the image and specific diagnostic decision
times can be estimated from eye-position recordings.
R e s e a r c h P r i o r i t i e s
Short term
• Conduct psychophysical studies of the effect of dis- play parameters on detection and discrimination of di-
agnostic features in mammograms:
- Determine the effects of major display parameters
on human detection and discrimination of diagnostic
features in mammograms. This includes studies of
spatial resolution, luminance, contrast range, system
noise, ambient illumination and glare.
- Phantom studies are appropriate, but the relation- ship between performance on the phantom and per-
formance on real imagery must be established. It is
highly likely that the most useful results will be de-
rived from studies of hybrid images consisting of re-
alistic backgrounds that have well-characterized ab- normalities added to them.
- Preference studies may be used in a complementary
fashion but should not be used in lieu of objective
metrics, such as receiver operating characteristic (ROC) parameters, forced choice parameters, ob-
server signal-to-noise ratio measures, or sensitivity
and specificity.
• Conduct time and motion studies on the performance
of image reading tasks in mammography:
- Develop models of the workflow of the radiologist
during image reading tasks. Include as metrics the
time to perform operations and the number of inde-
pendent operations required to complete a task. The
accuracy of models should be verified by compari-
son to the actual radiologist performance. Eye posi-
tion studies can be helpful for defining where atten- tion is directed during various tasks.- These data will
be useful for the system designer working on the
display interface.
Intermediate term
• Determine the effect of image navigation and differ-
ent display protocols on the detection and discrimina-
tion of diagnostic features in mammograms:
- With film on an alternator, numerous images both
present and past, can be viewed simultaneously in their entirety, and a magnifying glass can be used to
detect microcalcifications. With monitors, the num- ber of images displayed at full resolution is limited
and a magnifying glass does not have the same ef- fect with the monitor as with film because the actual
pixels become visible. Some display protocols will be more fatiguing than others and may even affect
diagnostic performance if they are too tedious and
complicated.
Long term
• Develop computational models for predicting human
detection and discrimination performance using real mammograms:
- Testing every change in the physical parameters of
an imaging system on decision outcome is not fea-
sible. A predictive model would be much more use-
ful, and scientific effort should be expended on model development.
• Study the effects of fatigue and vigilance during
screening tasks:
- In the general screening environment the detection
of an actual lesion is a relatively rare event. Vigi-
lance is required at all times by the mammographer
in order to avoid missing these rare events. Al-
though vigilance and fatigue have been well studied
in areas such as the detection of targets using radar, the topic has not been studied well in radiology. The
added factors of viewing images on a monitor and
diverting attention from the diagnostic to the menu
or other icons on the monitor may prove to be im-
portant factors.
References
1. Bird RE, Wallace TW, Yankaskas BC. Analysis of cancers missed at screening mammography. Radiology 1992; 184:613-617.
2. Bird RE. Low-cost screening mammography: report on fi- nances and review of 21,716 consecutive cases. Radiology 1989; 171:87-90.
3. Baines CJ, McFarlane DV, Miller AB. The role of the ref- erence radiologist: estimates of inter-observer agreement and potential delay in cancer detection in the national breast cancer screening study. Invest Radiol 1990; 25:971- 976.
4. Beam CA, Layde PM, Sullivan DC. Variability in the inter- pretation of screening mammograms by U.S. radiologists.
S218
Vol 6, Suppl 4, April 1999 REPORT ON DIGITAL M A M M O G R A P H Y
Arch Intern Med 1996; 156z209-213.
5. Kundel HL. Visual perception and image display terminals. Radiol Clin N Am 1986; 24(1):69-78.
6. Arenson RL, Chakraborty DP, Seshadri SB, Kundel HL. The digital imaging workstation. Radiology 1990; 176:303- 315.
7. Heinemann E. The relation of apparent brightness to the threshold for differences in luminance. Journal of Experi- mental Psychology 1961; 61:389-399.
8. Blume H, Hemminger BM. Image presentation in digital radiology: perspectives on the emerging DICOM display function standard and its application. RadioGraphics 1997; 17:769-777.
9. Krupinski E, Roehrig H. Influence of monitor luminance and tone scale on observer detection performance. Medical Imaging 98: Image Perception 1998; 3340.
Kimme-Smith C, Haus AG, DeBruhl N, Bassett LH. Ef- fects of ambient light and view box luminance on the de- tection of calcifications in mammography. AJR 1997; 168:775-778.
10.
11. Card S, Moran T, Newell A. The psychology of human- computer interaction. Hillsdale, NJ: Erlbaum, 1983.
12. Beard DV, Hemminger BM, Perry JR, et al. Interpretation of CT studies: single-screen workstation versus film alter- nator. Radiology 1993; 187:565-569.
13. Krupinski E. Influence of experience on scanning strategies in mammography. Medical Imaging 96: Image Perception 1996; 2712:95-101.
14. Nodine C, Kundel H, SC. L, Toto L. 1996. The nature of expertise in searching mammograms for masses. Medical Imaging 96: Image Perception 1996; 2712:89-94.
15. Burgess A. Image quality, the ideal observer, and human performance of radiologic detection tasks. Academic Radi- ology 1995; 2:522-526.
16. Wagner RF, Brown DG. Unified SNR analysis of medical imaging systems. Phys Med Biol 1985; 30:489-518.
17. Barrett HH, Denny J, Wagner RF, Meyers KJ. Objective assessment of image quality II: Fisher information, Fourier crosstalk and figures of merit for task performance. J Opt Soc Am 1995; A12:834-852.