21
Fractions, decimals and percentages 6.11.2014

Fractions, decimals and
percentages 6.11.2014

What does the National
Curriculum say?


Visualisation in Mathematics- FDP
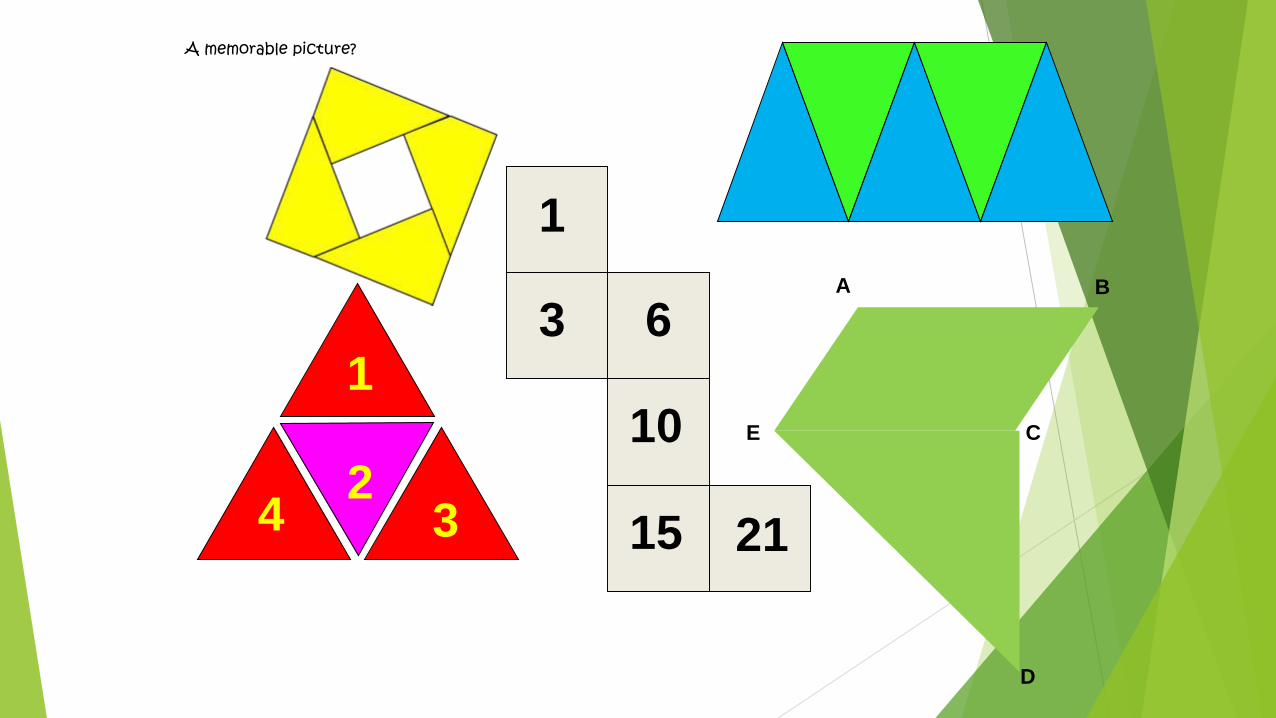
1
32
4
1
3 6
10
15 21
A B
C
D
E
A memorable picture?

Fractions, Decimals and Percentage
• In small groups come up with a statement
defining visualisation in simple terms

A Powerful Force
‘Imagery is a powerful force for perception and
understanding. Being able to “see” something mentally is
a common metaphor for understanding it. An image may
be of some geometrical shape, or of a graph or diagram,
or it may be some set of symbols or some procedure.’
Open University
What’s your current practise?

Activity
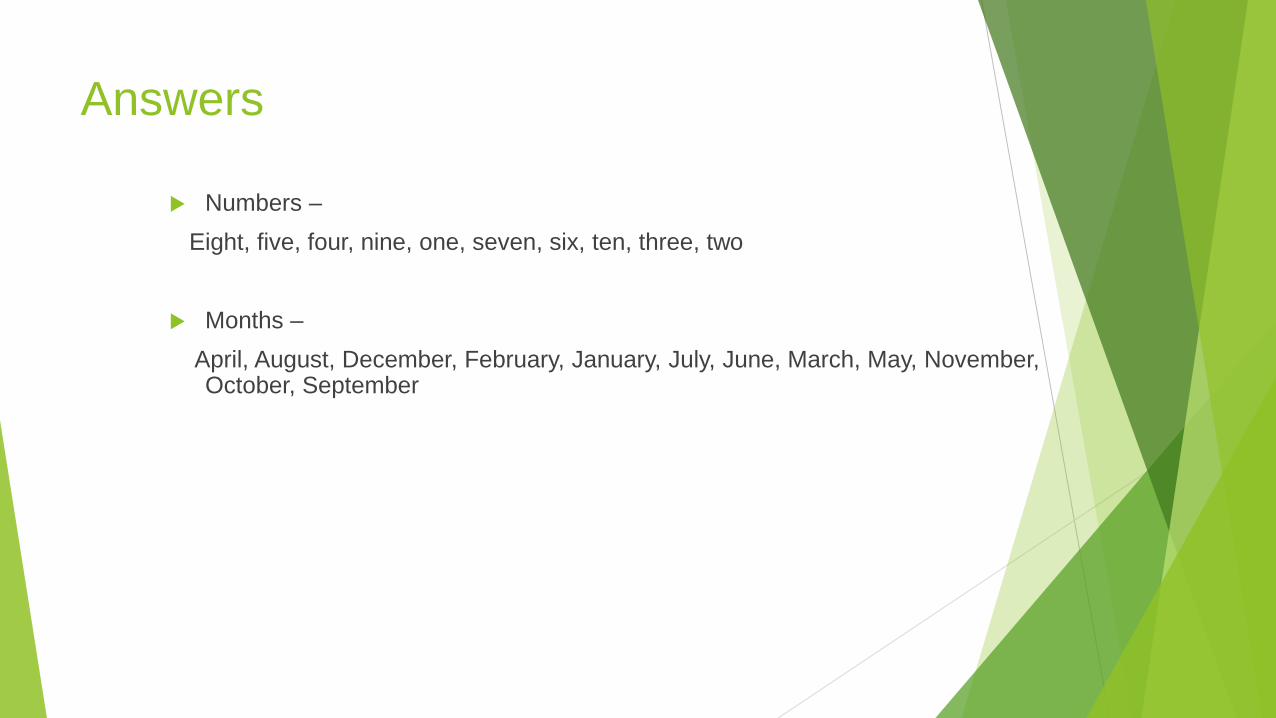
Answers
Numbers –
Eight, five, four, nine, one, seven, six, ten, three, two
Months –
April, August, December, February, January, July, June, March, May, November, October, September

Using a counting stick to Visualise…
https://www.ncetm.org.uk/resources/43609

Fractions of shapes challenges . . .


The Two-Jars Puzzle
Given a 5-litre and a
3-litre jar and an unlimited
supply of water, how
do you measure out 4 litres
exactly?
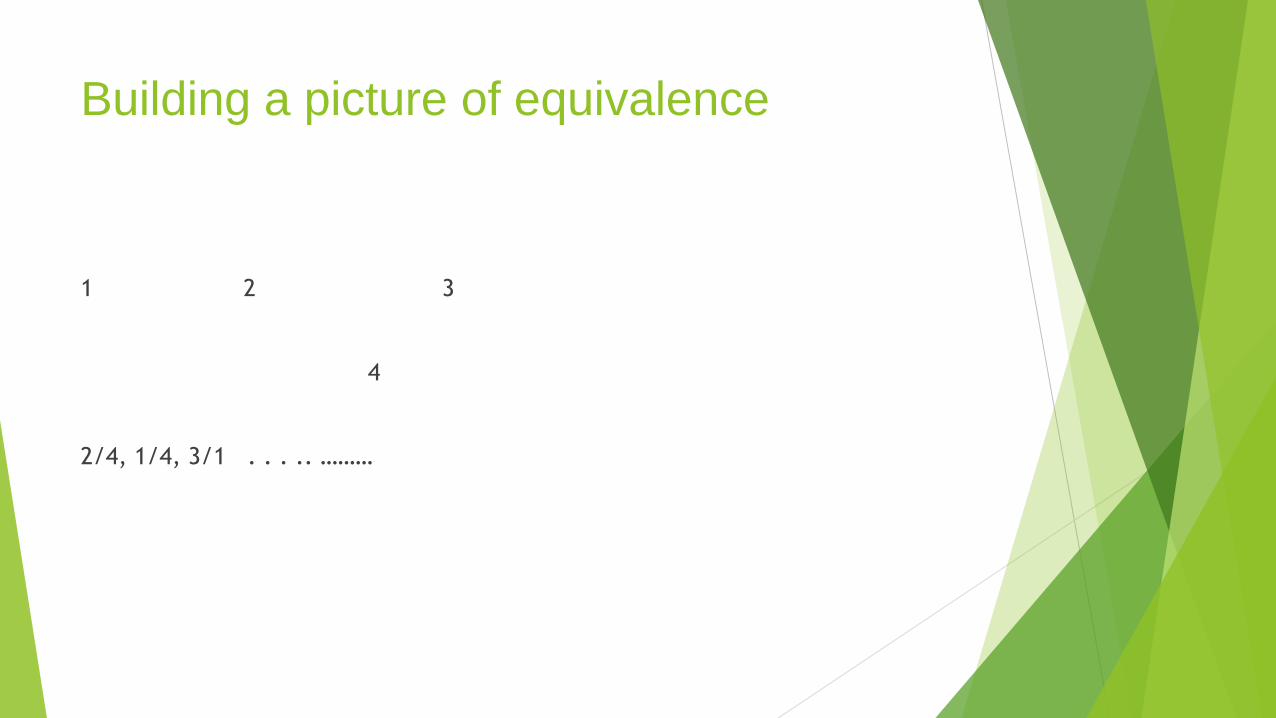
Building a picture of equivalence
1 2 3
4
2/4, 1/4, 3/1 . . . .. ………


Introducing decimals
through
Gattegeno charts. . .http://www.numbergym.co.uk/hosting/NGS/NG_GatChartExpl.html
http://www.taw.org.uk/lic/itp/dec_num_line.html
Number lines

Introducing percentages. . .

Would you rather…
½ of £750
10% of £3000
1/8 of £800
3/10 of £2700
http://uk.pinterest.com/cece09/fractions-decimals-
percents/


Resources
NNS Shape and Space booklet
•Beam – ‘Eyes closed’
•Nunes (2006) Fractions: Difficult but crucial in
mathematics learning
•Anita Straker – ‘Talking Points in Mathematics’
•Maths Trails - Visualisation
•Talk for maths – mind’s eye
•Open University – Learning Space – ‘Using
Visualisation in Mathematics Teaching’
http://uk.pinterest.com/cece09/fractions-decimals-
percents/


