56
1 Session Sponsor
1
Session Sponsor

2
The Age of Human Capital
Partnerships and Alliances To Deliver Technology-Based Education
Learning Sciences The Internet

3
An Investment in Knowledge Pays the Best Return

4
Wealth Today Resides in Human Capital
• Becker and others estimate that roughly 70% of a nation’s wealth today is in the form of human capital rather than physical capital.
• The pecuniary returns to knowledge, education and skill are very high in the United States and even higher outside the most developed countries.
5
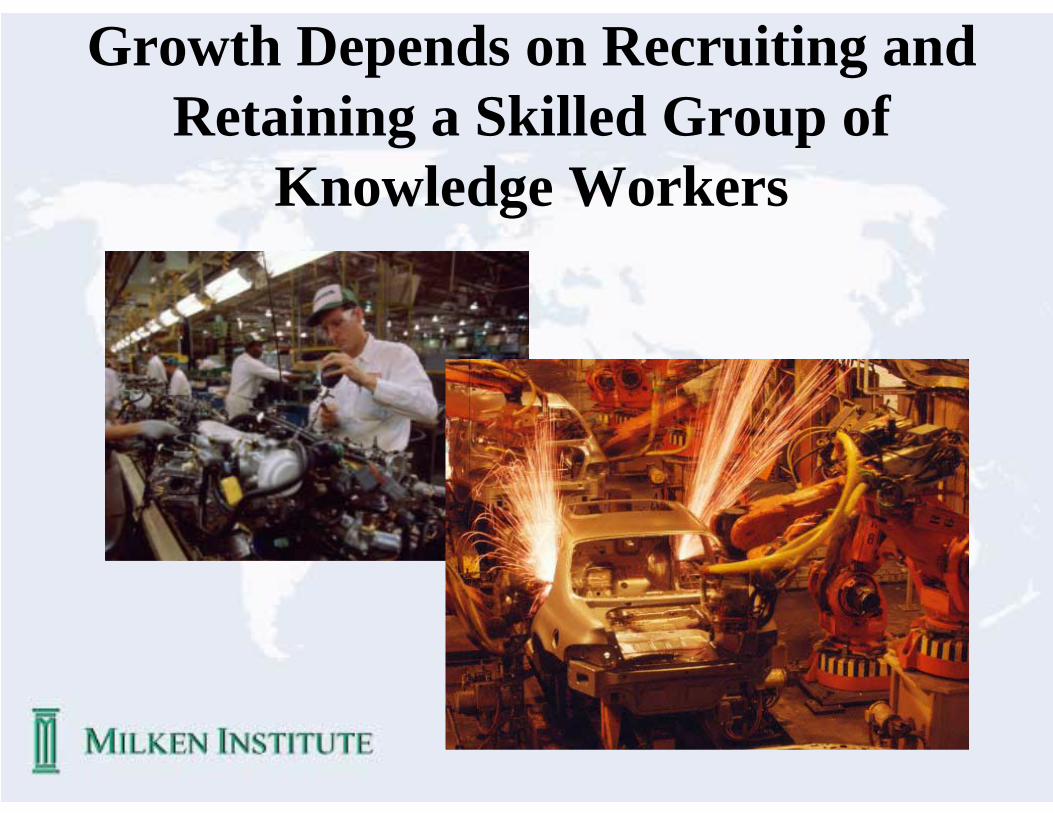
Growth Depends on Recruiting and Retaining a Skilled Group of
Knowledge Workers

6
The Costs of Recruitment Are Staggering

7
Retention Is Critical: Hiring Costs Are Sunk Costs
8
Knowledge Worker “Age-Wage” Gradients Are Steep

9
Investment in Human Capital as a Percent of GDP
17 – 25+Percent
9 - 11%
4 – 6%
4 – 8%
???
Schooling
On the Job Training
Health
Adult Education

10
Raw Labor and Human Capital as a Percentage of National Income
0%
5%
10%
15%
1936 1946 1956 1966 1976 1986 199660%
65%
70%
75%
Raw Labor
Human Capital
Raw Labor Human Capital

11
Post-Secondary Education Premiums 1967-1997

12
College Entry in the United StatesPercentage of High School Graduates That Continue
To College

13
100
110
120
130
140
150
160
170
180
190A
ustra
lia
Cana
da
Fran
ce
Ger
man
y
Swed
en
Switz
erla
nd
Uni
ted
Kin
gdom
Uni
ted
Stat
es
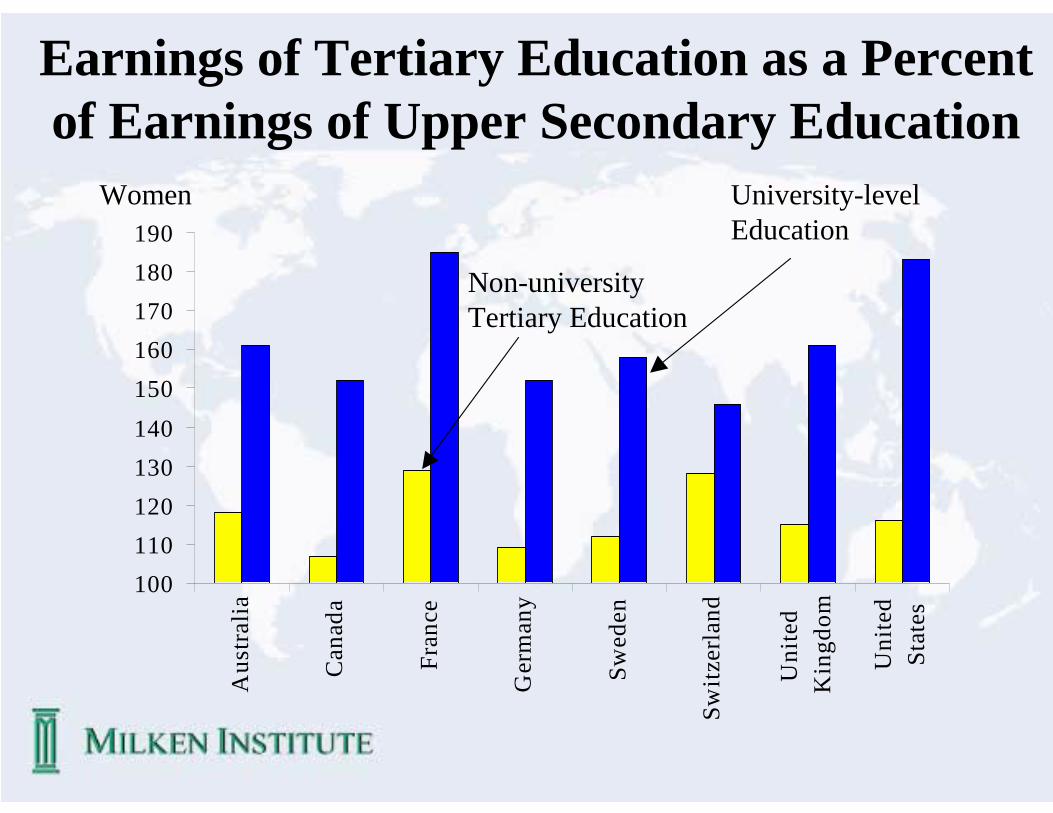
Earnings of Tertiary Education as a Percent of Earnings of Upper Secondary Education
Men University-level Education
Non-university Tertiary Education
14
Earnings of Tertiary Education as a Percent of Earnings of Upper Secondary Education
100110120130140150160170180190
Aus
tral
ia
Can
ada
Fran
ce
Ger
man
y
Swed
en
Switz
erla
nd
Uni
ted
Kin
gdom
Uni
ted
Stat
es
Women
Non-university Tertiary Education
University-level Education
15
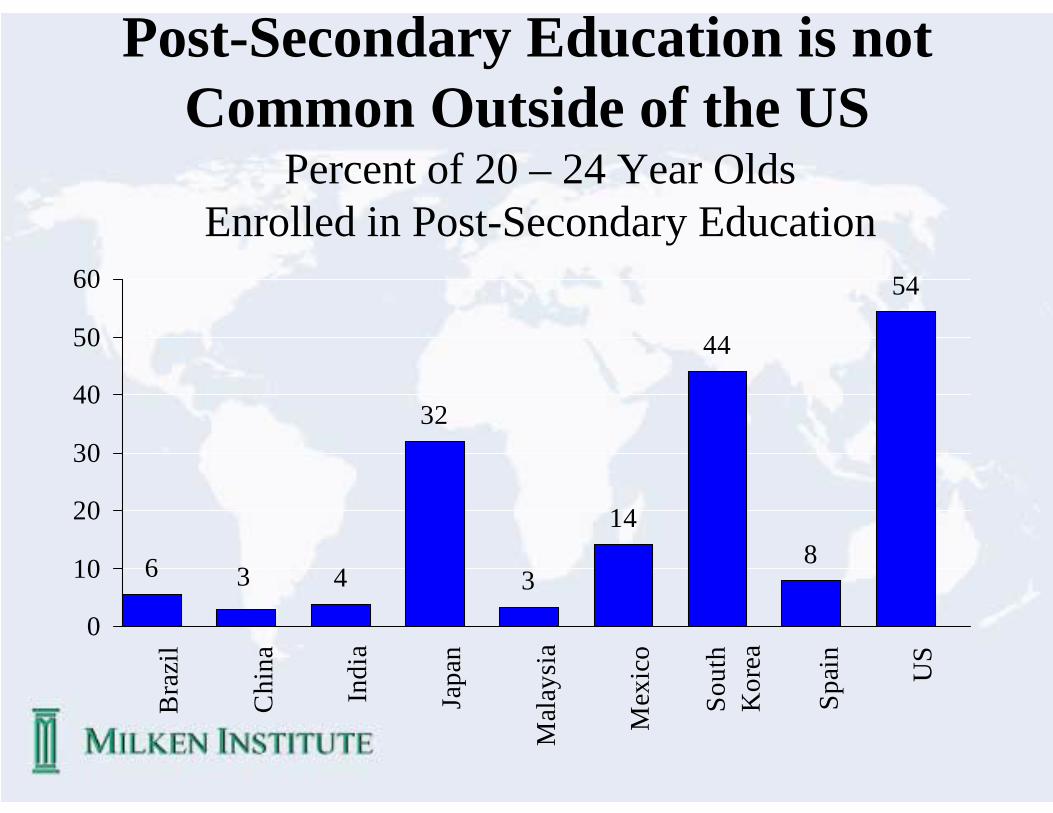
Post-Secondary Education is not Common Outside of the US
6 4
32
3
14
44
8
54
3
0
10
20
30
40
50
60
Bra
zil
Chi
na
Indi
a
Japa
n
Mal
aysi
a
Mex
ico
Sout
hK
orea
Spai
n
US
Percent of 20 – 24 Year Olds Enrolled in Post-Secondary Education

16
18
33
-2
4640
16
1
2116
-10
0
10
20
30
40
50
Bra
zil
Chi
na
Indi
a
Japa
n
Mal
aysi
a
Mex
ico
Sout
hK
orea
Spai
n
US
Growth Coincides Precisely with Limited Supply
Anticipated Percentage Population Growth 1997 - 2020

17
MBA Programs Have Grown Dramatically
0
50,000
100,000
1956
1966
1970
1972
1974
1976
1978
1980
1982
1984
1986
1988
1990
1992
1994
1996
1998
3,280
102,171MBA Degrees Granted 1956 to 1998
18
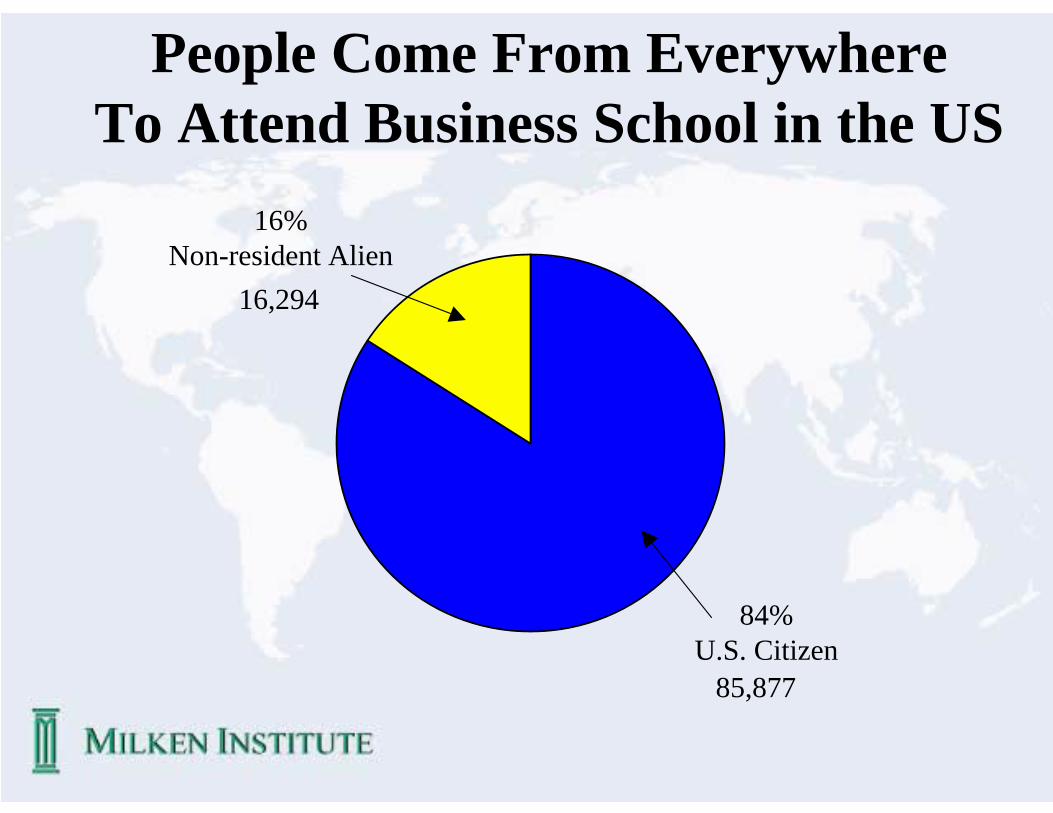
People Come From Everywhere To Attend Business School in the US
16%Non-resident Alien
84%U.S. Citizen
16,294
85,877
19
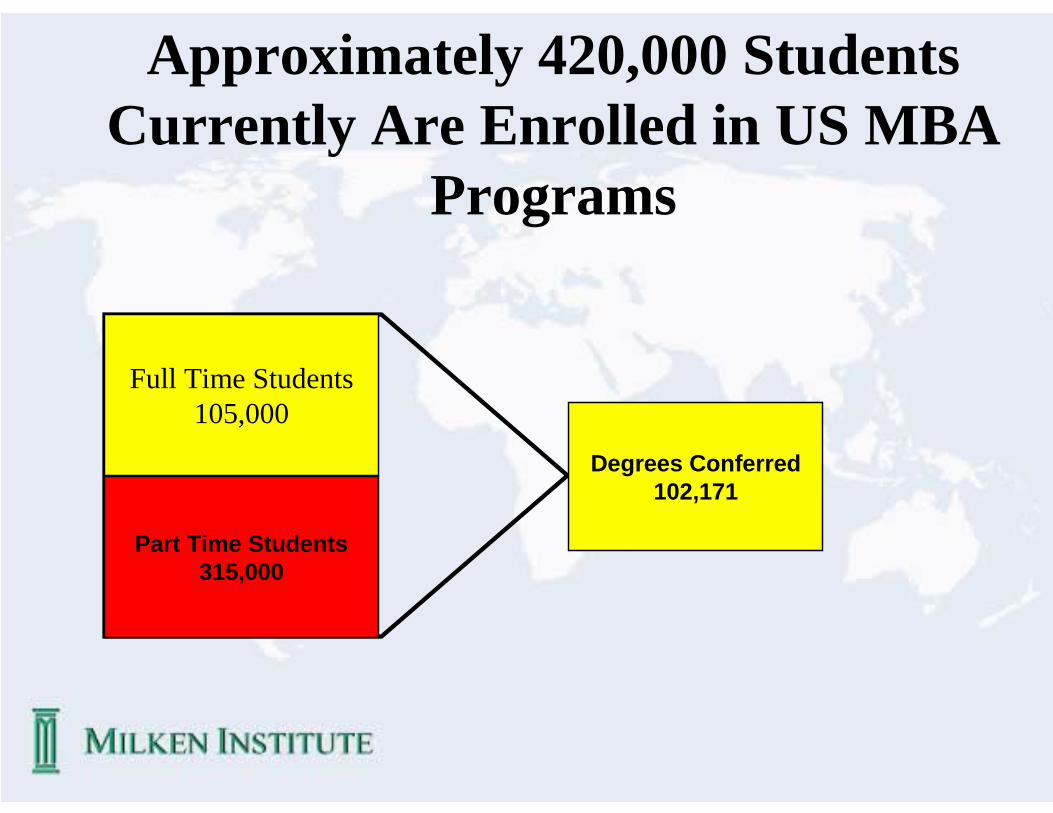
Approximately 420,000 Students Currently Are Enrolled in US MBA
Programs
Full Time Students105,000
Part Time Students315,000
Degrees Conferred102,171

20
Learning Platform Version 1.0

21
Version 1.1
22
Version 1.2
23
One way communication

24
Universities Have Content Knowledge but not Internet or Pedagogical Knowledge

25
The Creation of New Learning Technology
• Only active learning works.• Collaboration is essential.• Problem-based learning is active and
engaging.• To make all of this work,UNext has
created a “knowledge studio” that implements new learning in education and instantiates it in an Internet delivered structural environment
26
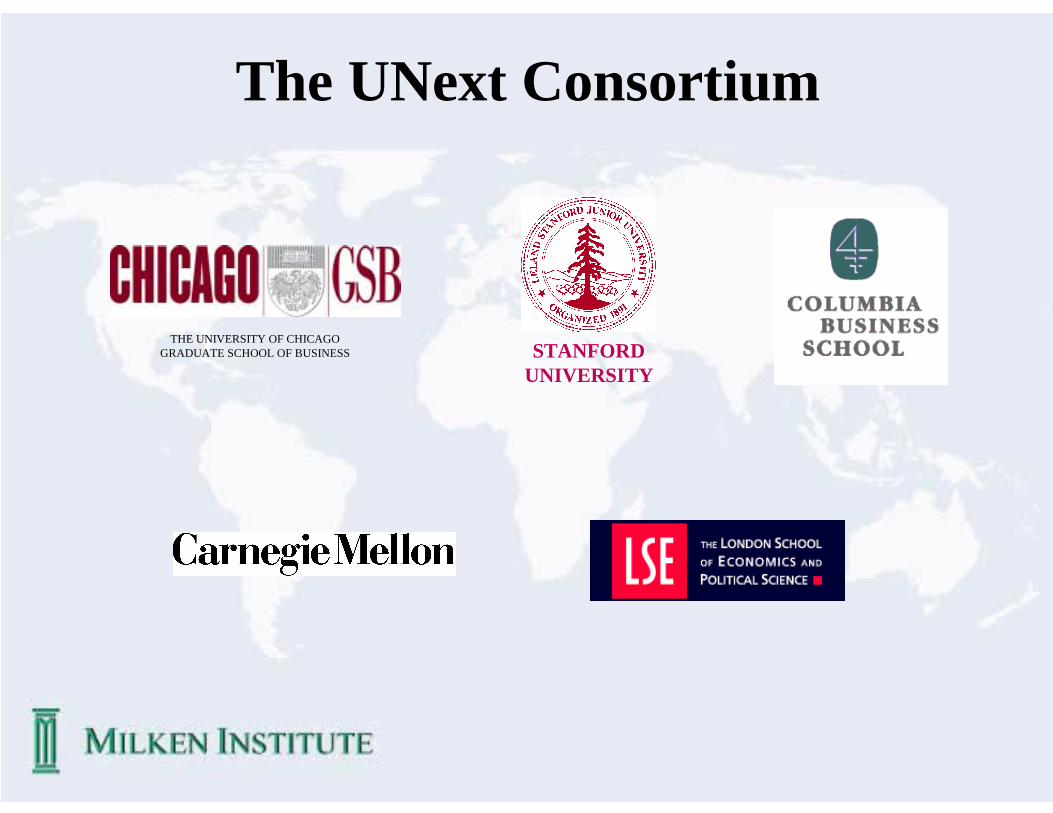
The UNext Consortium
STANFORDUNIVERSITY
THE UNIVERSITY OF CHICAGOGRADUATE SCHOOL OF BUSINESS
27
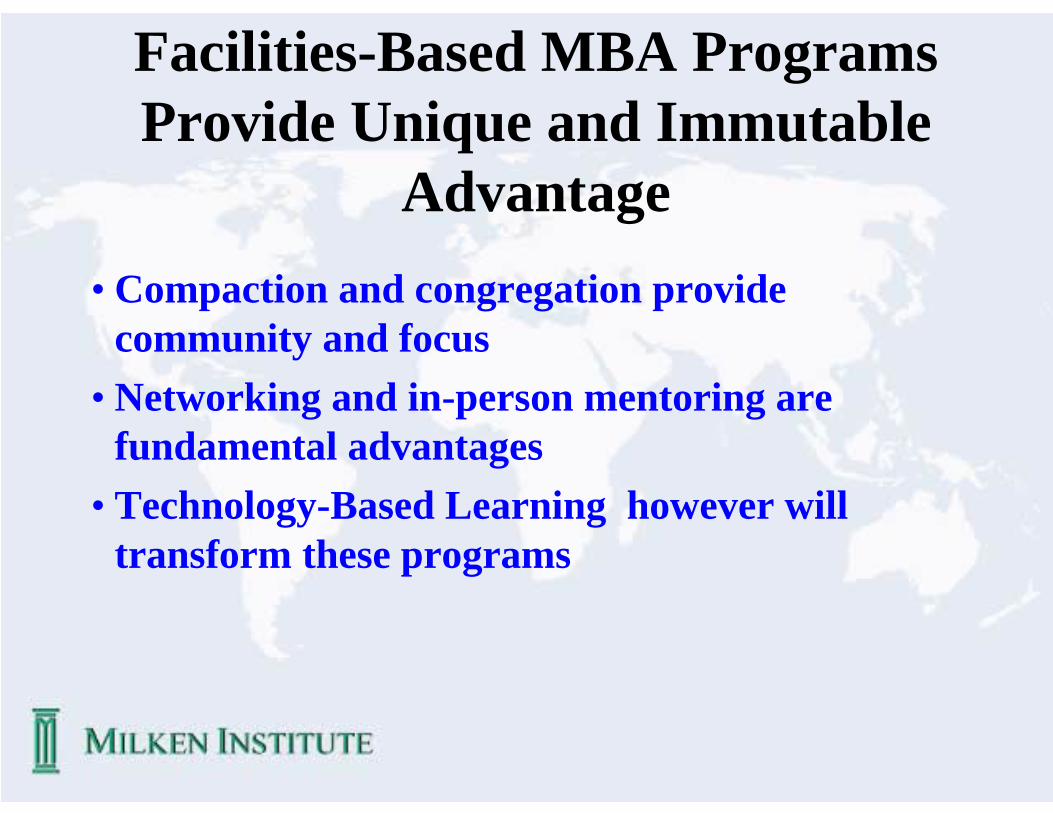
Facilities-Based MBA Programs Provide Unique and Immutable
Advantage• Compaction and congregation provide
community and focus• Networking and in-person mentoring are
fundamental advantages• Technology-Based Learning however will
transform these programs

28
UN2U• In this century, schools must economize on the time of
busy professionals and must find ways to use faculty much more efficiently (to facilitate research and deal with the increasing difficulties of hiring and retaining faculty).
• Programs on a “per-use” or wider basis that mix physical delivery with technology-based learning will be the predominate form of instruction in this century.
• Only those schools that combine these deliveries will survive.
• The UN2U Program addresses this concern by combining physical delivery and state of the art technology based learning.

29
Some People Desire a Fully Internet-Based Delivery
• Extremely busy executives• Those unable to accommodate to “calendarization”
because of the rhythm and beat of the conflicting demands of work and familial obligation
• Those located at distance from quality facilities-based providers
• Itinerant executives who can not realistically expect to live in one place for three or more years
• Cardean serves this group directly
30
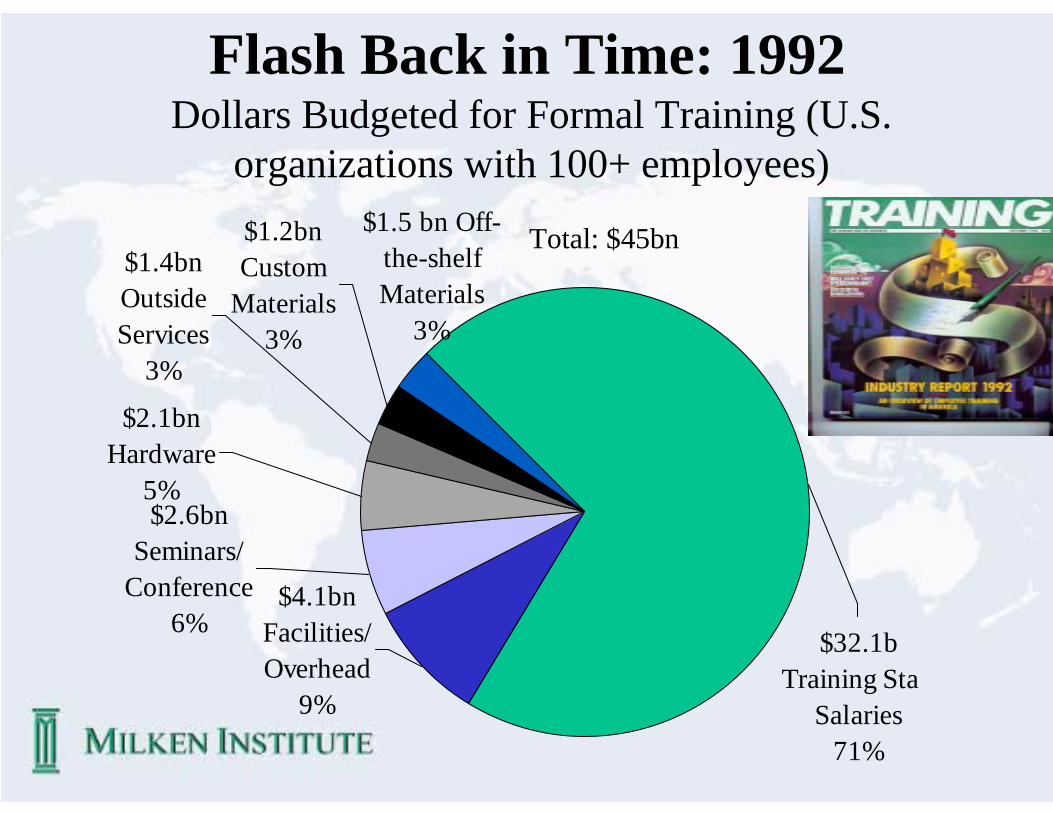
Flash Back in Time: 1992
$4.1bn Facilities/ Overhead
9%
$2.6bn Seminars/
Conference6%
$2.1bn Hardware
5%
$1.4bn Outside Services
3%
$1.2bn Custom
Materials3%
$32.1bTraining Sta
Salaries71%
$1.5 bn Off-the-shelf Materials
3%
Total: $45bn
Dollars Budgeted for Formal Training (U.S. organizations with 100+ employees)

31
Flash Back in Time: 1992
92
90
62
51
46
43
41
27
1710
0 20 40 60 80 100
Videotapes
Lectures
Role Plays
Audiotapes
Slides
Films
Self-Assessment/Self-Testing Instruments
Noncomputerized Self-Study Programs
Multimedia
Video Teleconferencing

32
Flash Back in Time: 1992
RestructuredNon-PrivateAMA
Acquired by FT Knowledge
SubsidiaryForum
Acquired by Times Mirror
SubsidiaryZenger-Miller
Out of BusinessPart of IBMSkill Dynamics
Still PrivatePrivateDDI
Where Are They Now?
Public/PrivateLeading Training Vendors 1992

33
Evolution of Learning Departments: 2002
Companies in the Education BusinessYears in Education BusinessPublic/PrivatePublicly Traded Firms
2001PublicSun Microsystems1984PublicSmartForce
1999PrivateTHINQ1972PublicSAP1997PublicSaba1987PublicPeopleSoft1982PublicIBM1999PrivateKnowledgeplanet1997PublicDocent1973PublicApollo Group
34
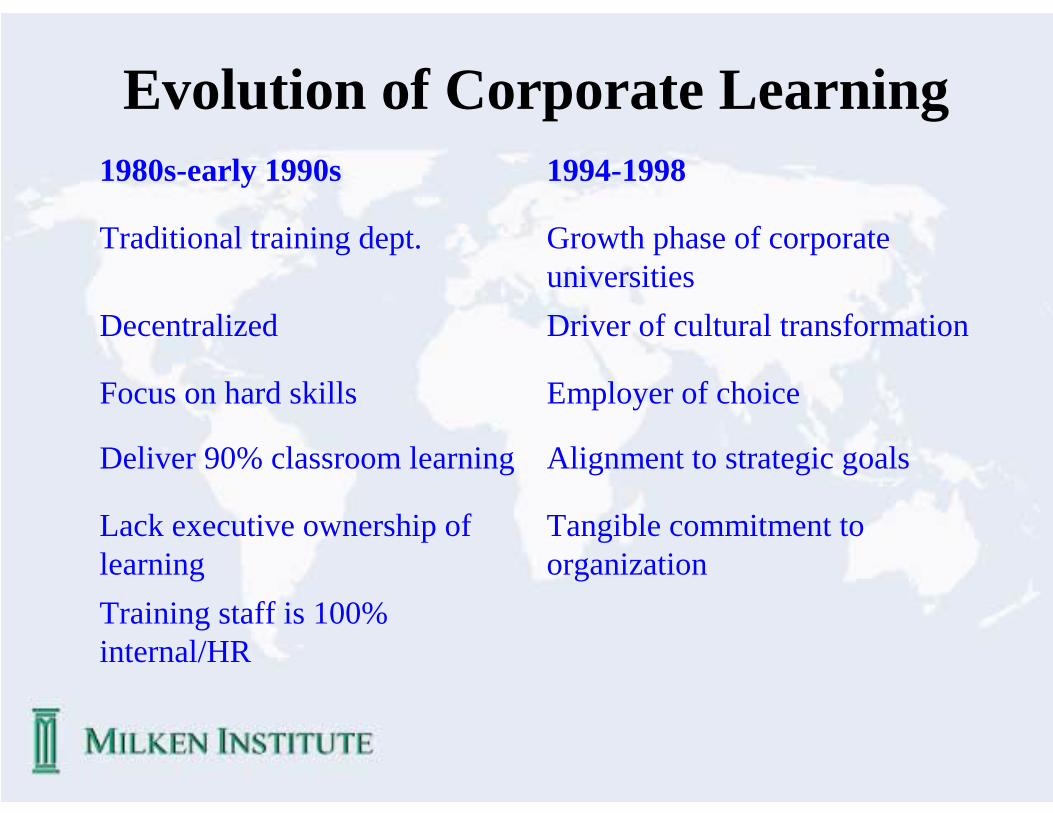
Evolution of Corporate Learning
Training staff is 100% internal/HR
Tangible commitment to organization
Lack executive ownership of learning
Alignment to strategic goalsDeliver 90% classroom learning
Employer of choiceFocus on hard skills
Driver of cultural transformationDecentralized
Growth phase of corporate universities
Traditional training dept.
1994-19981980s-early 1990s

35
Evolution of Corporate Learning
Beyond 2002Metrics: focus on efficiency
Metrics: focus on linkage to business performance
Prescriptive learning
Learning as family benefitVendor management
Learning integrates with knowledge management
Customer education
Big gorillas emergeCompany-specific customized courses
Beyond 20021998-2002
36
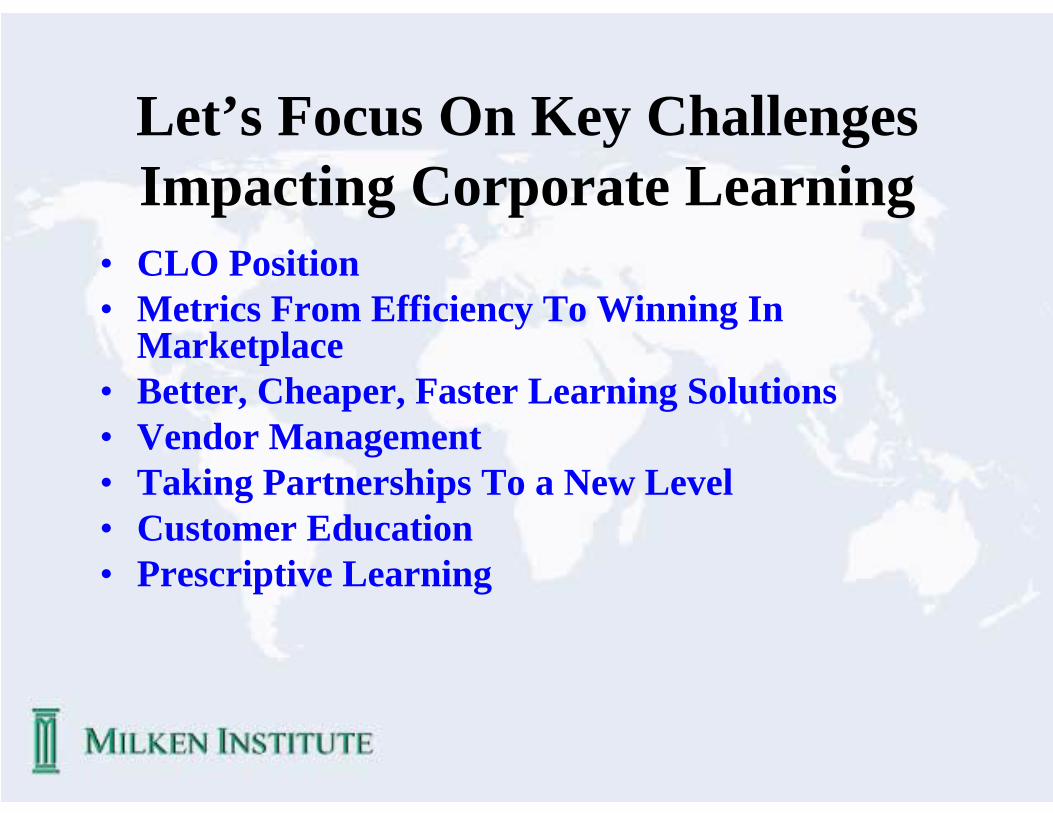
Let’s Focus On Key Challenges Impacting Corporate Learning
• CLO Position• Metrics From Efficiency To Winning In
Marketplace• Better, Cheaper, Faster Learning Solutions• Vendor Management• Taking Partnerships To a New Level• Customer Education • Prescriptive Learning

37
From Trainer To Executive Level Learning Professional
– Funding of Learning Department– Skills and Competencies Required of CL
Evolution of Corporate Learning: 2002
Learning Visionary
Alliance Builder
Leadership Developer
Business Manager

38
Evolution of Learning Departments: 2002Dow Chemical Co.’s [email protected]
Growth of course titles: 15 !!!! 98 !!!! 426 in 2 years209,000 course completions (1999-2000)Offered in 7 languages
Scalability:
Savings of $9.1 million (excluding trainer salaries)- $844K manual record keeping- $3.1 million delivery- $5.2 million class materials
Business results after one year:
$1.3 million initially (1999) + $600,000 maintenance since
Investment:
CIO magazine’s Enterprise Value AwardRecognition:

39
Evolution of Corporate Learning:Company-Specific Certificate & Degree Programs
MA MechatronicsBA Business
MSEE Wireless
Long Island UniversityEmpire State CollegeSt. Joseph’s CollegeSuffolk Community
CollegeNankai University
Symbol USymbol Technologies
MA Supply Chain
Management
Georgia Tech North Carolina State
Milliken University
Milliken
AreaPartnershipsLearning Department
Company
40
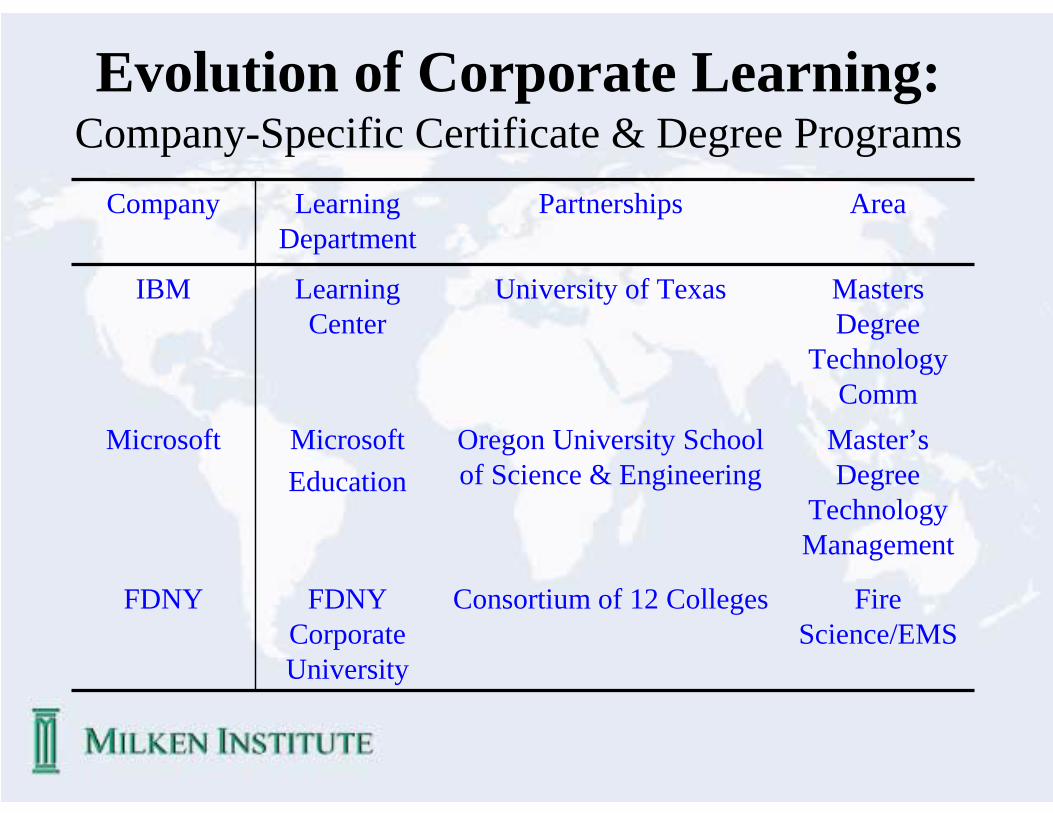
Evolution of Corporate Learning: Company-Specific Certificate & Degree Programs
Fire Science/EMS
Consortium of 12 CollegesFDNY Corporate University
FDNY
Master’s Degree
Technology Management
Oregon University School of Science & Engineering
Microsoft Education
Microsoft
Masters Degree
Technology Comm
University of TexasLearning Center
IBM
AreaPartnershipsLearning Department
Company
41
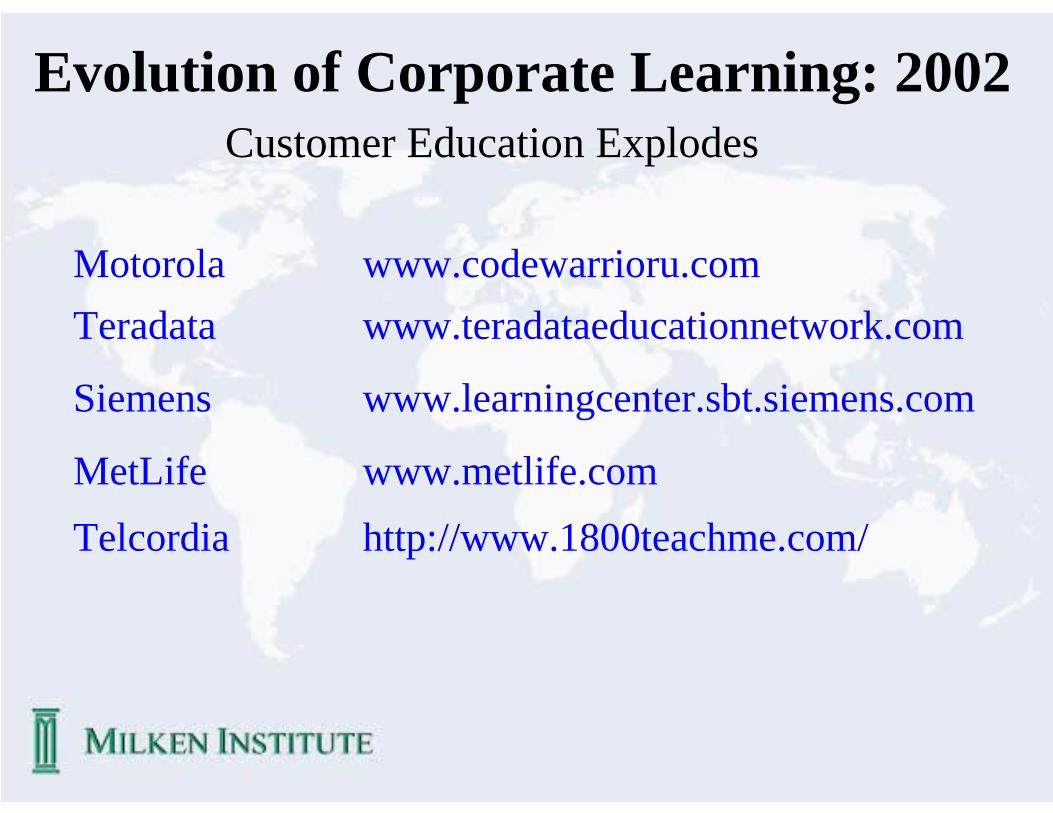
Evolution of Corporate Learning: 2002
http://www.1800teachme.com/Telcordiawww.metlife.comMetLife
www.learningcenter.sbt.siemens.comSiemens
www.teradataeducationnetwork.comTeradatawww.codewarrioru.comMotorola
Customer Education Explodes

42
Website: Portal For Learning Solutions

43
Knowledge in the context of the company: link is built-inKnowledge in the context of the company: link is built-in@Work section applies theory to practice in real time@Work section applies theory to practice in real time
Real-time mentoring with in-house or outside coachesReal-time mentoring with in-house or outside coachesCases in easy-to-use 10-minute chunksCases in easy-to-use 10-minute chunks
Prescriptive Learning EmergesPrescriptive Learning EmergesEvolution of Corporate Learning: 2002

44
Where will Corporate Learning Be in 2010?
• Learning landscape• Learning Organization• Funding & Measurement• Alignment With Business• Opportunities For Us

45
Big Gorillas Emerge
Beyond 2002: Learning Departments
17%$4,379,000,000$25,296,000,000Microsoft
11%$2,000,000,000$18,200,000,000Sun Microsystems
10%$1,100,000,000$10,800,000,000Oracle
19%$320,000,000$1,700,000,000PeopleSoft
8%$145,000,000$1,800,000,000Siebel
23%$60,000,000$251,000,000SmartForce
R&D%(% of
Revenue)
R&D/Product Dev. Budget
(Approx.)
2001 Revenues

46
Beyond 2002: Learning Departments
e-Learning evolves from connecting learners with static PowerPoint presentation to integrating learners with knowledge sharing software
www.askmecorp.com
www.emmperative.com
Learning Integrates with Knowledge Management

47
E-Learning Will be a Sought After Family Benefit
http://edu.symbol.com http://www.ci.nyc.ny.us/html/fdny/home.html
Beyond 2002: Learning Departments
48
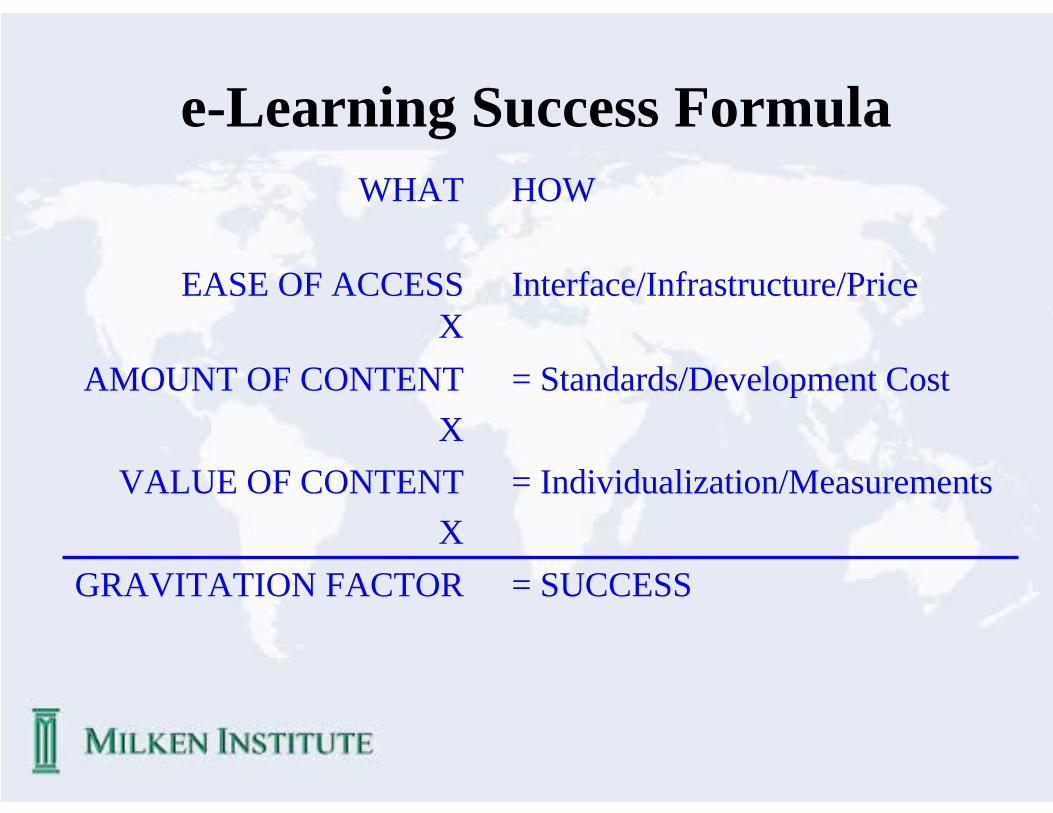
e-Learning Success Formula
= SUCCESSGRAVITATION FACTOR
= Individualization/MeasurementsVALUE OF CONTENT X
= Standards/Development CostAMOUNT OF CONTENT X
Interface/Infrastructure/PriceEASE OF ACCESS X
HOWWHAT
49
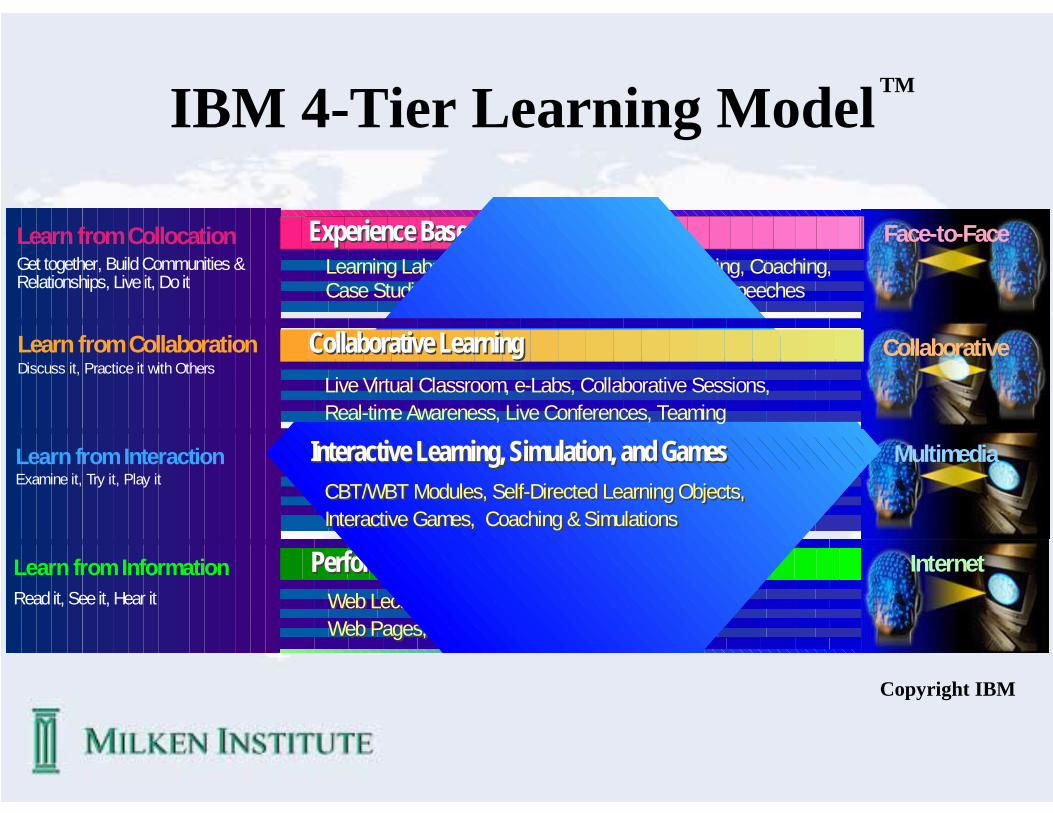
Experience Based LearningExperience Based LearningLearning Labs, Classroom, Mentoring, Role Playing, Coaching, Case Studies, Expert Presentations, Motivational Speeches
Learn from Collocation Get together, Build Communities & Relationships, Live it, Do it
Face-to-Face
Learn from InformationRead it, See it, Hear it
InternetWeb Lectures, Web Books, Web Conferences,Web Lectures, Web Books, Web Conferences,Web Pages, Videos...Web Pages, Videos...
Performance Support & Reference MaterialsPerformance Support & Reference Materials
CBT/WBT Modules, Self-Directed Learning Objects,CBT/WBT Modules, Self-Directed Learning Objects,Interactive Games, Coaching & Simulations Interactive Games, Coaching & Simulations
Learn from InteractionExamine it, Try it, Play it
Interactive Learning, Simulation, and GamesInteractive Learning, Simulation, and GamesCBT/WBT Modules, Self-Directed Learning Objects,CBT/WBT Modules, Self-Directed Learning Objects,Interactive Games, Coaching & Simulations Interactive Games, Coaching & Simulations
Multimedia
CollaborativeLearn from Collaboration Discuss it, Practice it with Others
CollaborativeLive Virtual Classroom, e-Labs, Collaborative Sessions, Real-time Awareness, Live Conferences, Teaming
Collaborative Learning Collaborative Learning
Copyright IBM
IBM 4-Tier Learning ModelTM

50
Tim
e Sp
ent L
earn
ing
2002 Year 2007
F2F Informal
F2F Formal
Collaborative InformalCollaborative FormalInteractive
Reference, EPSS,Video
Predicted Use of Delivery Methods

51
Self-service HR
Collaboration
Learning
Self-service Expense,
Procurement
Instant Messaging
Expert Directory
Content Management
Communications

52
Growth of the Service Sector
69%63%
57%61%62%
71% 72%76%
0%
10%
20%
30%
40%
50%
60%
70%
80%
90%
100%
US UK Germany Japan
1989
2001
Share of Services in GDP, 1989-2001
53
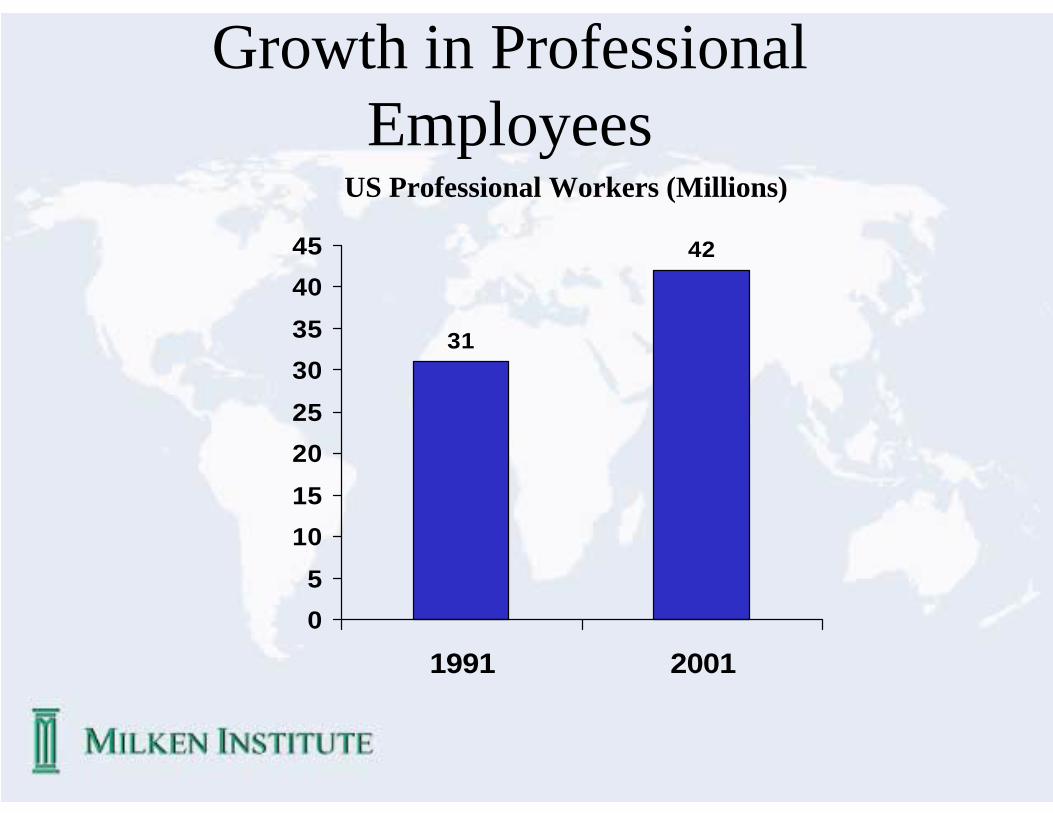
Growth in Professional Employees
31
42
05
1015202530354045
1991 2001
US Professional Workers (Millions)

54
Increasing Globalization
Foreign Holdings of US Assets ($Trillions)
$2.3
$6.2
0
1
2
3
4
5
6
7
1991 2000
US Holdings of Foreign Assets ($Trillions)
$2.0
$8.0
0
1
2
3
4
5
6
7
8
9
1991 2000
55
Rapid Change is the Only Constant
• Information flows fast & freely
• Employees are increasingly mobile & connected
• Business pace continues to accelerate
56
Corporate Learning’s Response
• Learning centralized to gain efficiencies & effectiveness
• Transition from internal to external & local to global providers
• Migration from classroom-based to “virtual” learning


