5th Floor, 100 Victoria Street, Cardinal Place, London SW1E 5JL www.capitaleconomics.com Registered office: as above. Registered in England No. 2484735 VAT No. GB 198 2919 50 SETTING SOCIAL RENT Economic analysis of policy options for social rents after 2020 6 February 2018 A confidential report by Capital Economics for SHOUT, ARCH and LGA Justin Chaloner Melanie Debono Alexandra Dreisin Andrew Evans Mark Pragnell
Transcript
5th Floor, 100 Victoria Street, Cardinal Place, London SW1E 5JL www.capitaleconomics.com
Registered office: as above. Registered in England No. 2484735 VAT No. GB 198 2919 50
SETTING SOCIAL RENT Economic analysis of policy options for social rents after 2020
6 February 2018 A confidential report by Capital Economics for SHOUT, ARCH and LGA
Justin Chaloner Melanie Debono Alexandra Dreisin Andrew Evans Mark Pragnell
P1 | SETTING SOCIAL RENT
Disclaimer: This report has been commissioned by SHOUT, ARCH and LGA. However the views expressed remain those of Capital Economics and are not necessarily shared by SHOUT, ARCH and LGA. While every effort has been made to ensure that the data quoted and used for the research behind this document is reliable, there is no guarantee that it is correct, and Capital Economics Limited and its subsidiaries can accept no liability whatsoever in respect of any errors or omissions. This document is a piece of economic research and is not intended to constitute investment advice, nor to solicit dealing in securities or investments.
P2 | SETTING SOCIAL RENT
KEY MESSAGES
Capital Economics has been commissioned by SHOUT, ARCH and LGA to research and report on the impact of different policy options for social rents after 2020.
In October 2017 the government announced that the increase in social rents will be limited to consumer price inflation plus one per cent for five years from 2020. This will follow on from the current policy which has imposed a one per cent annual fall in social rents in nominal terms in the five years up to 2020. The government also announced that it will remove its plan to limit housing benefit to the local housing allowance rate.
In this report we assess whether the government’s policy of consumer price inflation plus one per cent policy is appropriate. First, we provide some background to the issue by considering the role of social housing. Second, we consider how government rent policy affects different stakeholders. Third, we examine existing policies relevant to social rents. Fourth, we discuss the policy context of future changes to social rent policy. Fifth, we assess whether the government’s proposed consumer price inflation plus one per cent policy is appropriate. Sixth, we consider other factors which would affect the results of our analysis.
Information on the methodology deployed and analysis of individual regional markets can be found in the appendices.
The key messages from our analysis are:
The government was right to conclude that the policy of an annual decrease in social rents of one per cent in cash terms up is not sustainable for registered providers beyond 2020
Differences in regional housing markets mean a single national policy cannot achieve an optimal impact on different stakeholders (government, social landlords and tenants) in all places
In much of the country, the government’s proposed policy of consumer price inflation plus one per cent after 2020 is broadly appropriate. However, higher increases could be sustainable in some areas to provide more properties and larger welfare savings to government, though at some cost to tenants not receiving housing benefit
The sustainability of real increases in social rents is dependent on corresponding increases in the overall benefits cap
P3 | SETTING SOCIAL RENT
Policy implications:
It is sensible to move away from short term policy which does not distinguish between consumption and investment towards a long term investment based approach; the recent announcements on the post 2020 rent assumption and benefits for social tenants are useful steps in that direction
The future framework for investment could be strengthened by:
(i) allowing local flexibility to increase rents by more than consumer price inflation plus one per cent where a clear case can be made in terms of building additional units and achieving reductions in private sector housing benefit caseload
(ii) lifting or up-rating the overall benefit cap
(iii) making long term guarantees on rents and their relationship with the welfare system
(iv) resuming grant for social housing and allowing councils to borrow for HRA development, subject to the prudential code
1. The role of social housing .....................................................................................................................................................5 2. Social rent policy stakeholders .............................................................................................................................................6 3. Relevant policy considerations .............................................................................................................................................9 4. Policy context for social rents ...............................................................................................................................................9 5. The impact of increasing social rents ................................................................................................................................. 11 6. Alternative outcomes ........................................................................................................................................................... 13
Social housing has an important role in ensuring accommodation for individuals and families who might otherwise be priced out of the market.
Registered providers, such as local authorities (directly managed or via arm’s length management organisations) and housing associations, provide low cost rental accommodation at sub-market rents and low cost home ownership. Tenants either pay a social rent, for which there is a ceiling that limits both the current rate and future increases1, or more recently ‘affordable rents’, which can be set at up to 80 per cent of market value.2 The social landlord uses the rental revenue stream to cover maintenance, renewal, management, servicing debts and other business costs. Social landlords also use this rental revenue to help fund new investment in social housing, in stark contrast to revenues received by private landlords which are not re-invested in a social context. (See Figure 1.)
Figure 1: An overview of social housing rental tenures
Source: Capital Economics
1 Set out in detail in Department for Communities and Local Government, Guidance on Rents for Social Housing (Department for Communities and Local Government, London), 2014. 2 The ‘affordable homes’ programme has replaced the provision of new social housing with rents set at up to 80 per cent of market rents. ‘Affordable rents’ are typically higher than social rents. Although completions of ‘affordable rent’ properties have outstripped social rent homes since 2013/14, the overall stock remains small compared to social homes.
What is social
housing?
Who provides
it?
What rents do they charge?
Low cost rental accommodation (sub-market rents) and low cost home ownership
Local authorities (directly managed or via Arm’s Length Management Organizations)
• ALMOs can provide new social housing either on behalf of their LA parent, which will be council housing at social or affordable rent, or in their own right as registered providers or through LA prudential borrowing (social rent if desired)
Registered providers – i.e. Registered with the Homes and Communities Agency
Housing associations
• Independent, provide low-cost social housing on a non-profit-making basis
• Previously referred to as Registered Social Landlords when they were formerly funded and regulated by the Housing Corporation (ceased operation in November 2008 and its functions were transferred to the Homes and Communities Agency and Tenant Services Authority)
Social rent Affordable rent
Up to 80 per cent of market value
Since 2002 each property has a target rent. This is the same as the formula rent. The target rent is calculated using a formula that takes into account the value of the
property (as at January 1999), the size of the property and the average worker’s earnings in the local area. This guideline limit is a ceiling.
Rents are being reduced by one per cent each year until 2020 under current government policy.
P6 | SETTING SOCIAL RENT
2. Social rent policy stakeholders
Social housing rents matter to government, landlords and tenants and there are considerations about the impact of social rent policies in both the short and long-term. (See Figure 2.)
Figure 2: Short and long-term impacts of a new social rent policy
Source: Capital Economics
First, social rents matter to government as it affects its expenditure on housing benefit and the overall welfare bill.
In 2016-17, welfare payments by the state reached £217.8 billion. Although the largest component of this is the state pension, the amount paid out for housing benefit (a regular payment to help tenants pay their rent) was still a considerable £23.5 billion. What’s more, the housing benefit component of the total welfare bill has increased significantly since the turn of the century. (See Figure 3 and Figure 5.)
Government policy Short-term impacts Long-term impacts
Setting of social rents• Level of social rents• Future path of social
rentsIn
vest
men
t in
soci
al h
ousi
ng
Social landlords• Operating margins• Certainty of rental
income
Government• Fiscal position
Tenants• Disposable income after
housing costs• Number and quality of
places to live
Social landlords• Provision of social
housing
Government• Fiscal position
Tenants• Disposable income after
housing costs
P7 | SETTING SOCIAL RENT
Figure 3: Government expenditure on welfare in the United Kingdom, 2016-17 (£ billions, current prices)
Sources: Capital Economics and Department for Work and Pensions
There were 4.6 million recipients of housing benefit in 2016-17, receiving on average £98 per week. Of those housing benefit recipients, 69 per cent were tenants in the social rented sector, while 31 per cent lived in private rented accommodation. Over the last fifteen years, there has been a marked decline in the proportion of housing benefit recipients who live in local authority accommodation, while the proportions in housing provide by registered social landlords and the private rented sector have both risen. (See Figure 4.)
Figure 4: Housing benefit claimants in the United Kingdom by tenure type
Sources: Capital Economics and Department for Work and Pensions
It does not matter for a tenant’s housing benefit eligibility if they are in the private rented sector or if they rent from a social landlord. It does however affect how much the government pays out.
In almost all circumstances, taxpayers pay more to keep families in private rented accommodation than in a social rent tenure. Indeed, on average, private sector tenants receive £113 per week in
0
10
20
30
40
50
60
70
80
90
100
State pension Tax credits andchild benefit
Housing benefit Disabilitybenefits
Incapacitybenefits
Pension credit Carer'sallowance
Income support Unemploymentbenefits
Proportion of housing benefits claimants living in: 1996-97 2001-02 2006-07 2011-12 2016-17
Social rented accommodation 76% 81% 78% 68% 69%
Of which:
Local Authority tenants 61% 54% 42% 30% 28%
Registered social landlords 16% 27% 37% 38% 41%
Private rented accommodation 24% 19% 22% 32% 31%
P8 | SETTING SOCIAL RENT
housing benefit in England compared with £98 per week for those renting from a social rent landlord. Payments to private sector tenants now make up more than a third of the housing benefit bill. (See Figure 5.)
Figure 5: Government expenditure on housing benefit by tenure in the United Kingdom (£ billions, 2017-18 prices)
Sources: Capital Economics and Department for Work and Pensions
Second, social rent policy matters to landlords because it affects their rental income stream and business planning. The rental income stream is used to meet the costs of management and maintenance, service existing debt and provide a surplus to underpin borrowing for investment in new construction and renewal of ageing stock. This directly affects the future supply of social housing.
Third, social rent policy matters to tenants because it can affect their disposable income after housing costs. While an increase in rent will be covered one-for-one by an increase in housing benefit for some tenants, this is not necessarily the case for all. Households will move between phases of not working and benefits will generally cover rent, working on a low income so benefits will cover part of the rent and working on a higher income when they will not receive any housing benefit. Higher rents can therefore affect tenants during phases where they are earning more.
In the long-run, rent policy affects tenants through its impact on house building by social landlords. Good quality social housing delivers knock-on social benefits that touch areas such as health, wellbeing and education and productivity, and affect all age groups in society.3 What’s more, it could help to give tenants greater consumer power. Generally social tenants aren’t able to exercise the same choices as in other markets if they are unhappy with the price and quality of housing offered by their landlord. There is little competition in local markets with one social 3 Capital Economics, Building new social rent homes (Capital Economics, London), 2015
0
5
10
15
20
25
30
1996
-97
1997
-98
1998
-99
1999
-00
2000
-01
2001
-02
2002
-03
2003
-04
2004
-05
2005
-06
2006
-07
2007
-08
2008
-09
2009
-10
2010
-11
2011
-12
2012
-13
2013
-14
2014
-15
2015
-16
2016
-17
Local authority tenants Registered social landlord tenants Private rented sector tenants
P9 | SETTING SOCIAL RENT
landlord owning most of the stock. Building more social homes would help to strengthen tenants’ market position by giving them greater choice.
3. Relevant policy considerations
In this report we focus on the implications of different social rent policies. This is not an isolated policy and other issues related to social housing will also impact upon the stakeholders involved with social housing.
The government’s fiscal policy affects the development of social housing. For example, local authorities’ ability to build new homes is constrained by the government’s rules set using powers in the Localism Act 2011.4 The caps were imposed when the new ‘self-financing’ regime was introduced in April 2012. Under the new regime, councils are allowed to retain the rental incomes from tenants, and plan and control spending over a thirty year period. As councils are not allowed to borrow beyond the debt caps, only those below this threshold will potentially be able to borrow to fund new development while all can use surpluses from the rental stream to fund new developments. However, the extent to which they can fund new developments will also be impacted by the need for investment in the current stock.
The government’s welfare policy interacts with housing benefit and affects tenants’ economic incentives. For example, housing benefit is withdrawn as tenants increase the number of hours worked each week. This can give an effective marginal tax rate of 79 per cent.5
4. Policy context for social rents
Up to 2015, the government has provided for social rent increases above inflation, as a mechanism for financing capital spending on the existing stock and on new developments.6 Following the Summer Budget 2015, this was replaced by a policy that reduces rents, in nominal terms, by one per cent each year over five years until 2020.7 The government’s aim to reduce the amount it spends on housing benefit each year has been achieved. Annual expenditure on housing benefit is forecast to fall by 5.8 per cent in real terms over 2014-15 to 2017-18 in part due to the savings from the fall in social rents.8 However, the policy has had knock-on implications for social landlords and tenants. (See Figure 6.)
4 Great Britain, Localism Act 2011: Elizabeth II. Chapter 20 (The Stationary Office, Norwich), 2011 5 Lisa Stidle, 93% tax?! Effective marginal tax rates explained (Policy in Practice, London), 2015 6 Department for Communities and Local Government, Guidance on Rents for Social Housing (Department for Communities and Local Government, London), 2014 7 HM Treasury, Summer Budget 2015 (HM Treasury, London), 2015 8 Department for Work and Pensions, Spring Budget 2017 Expenditure and Caseload forecasts (Department for Work and Pensions, London), 2017
P10 | SETTING SOCIAL RENT
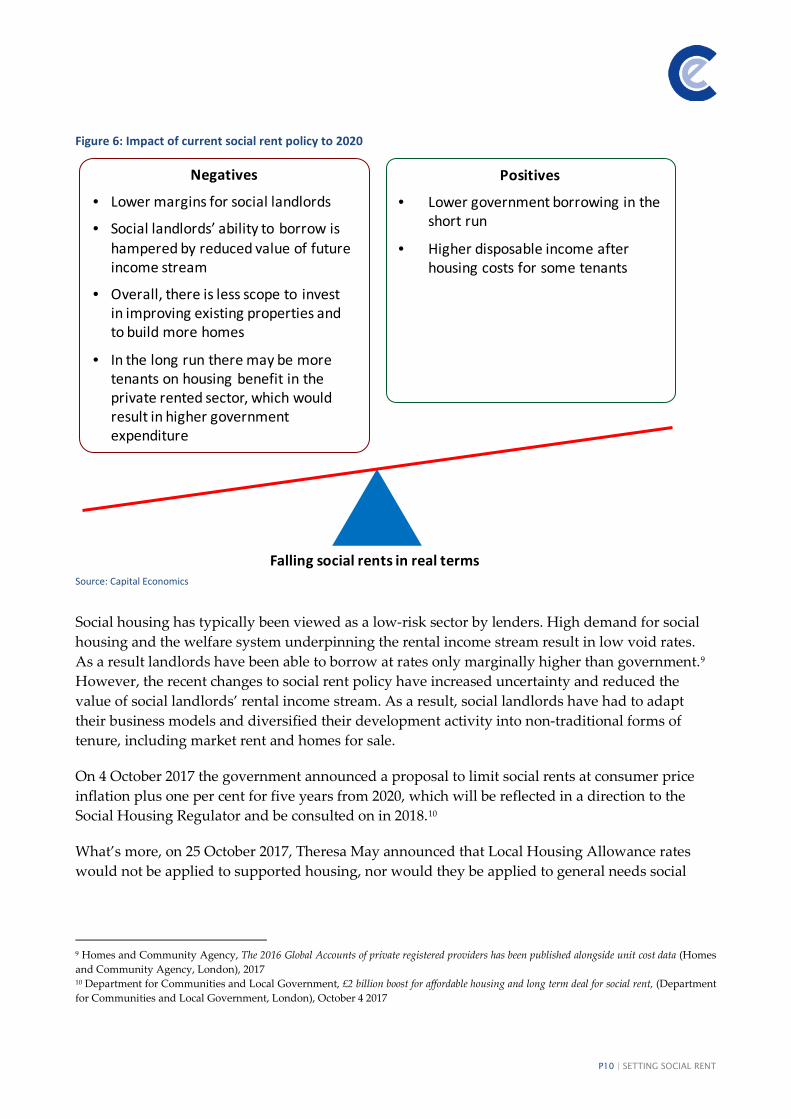
Figure 6: Impact of current social rent policy to 2020
Source: Capital Economics
Social housing has typically been viewed as a low-risk sector by lenders. High demand for social housing and the welfare system underpinning the rental income stream result in low void rates. As a result landlords have been able to borrow at rates only marginally higher than government.9 However, the recent changes to social rent policy have increased uncertainty and reduced the value of social landlords’ rental income stream. As a result, social landlords have had to adapt their business models and diversified their development activity into non-traditional forms of tenure, including market rent and homes for sale.
On 4 October 2017 the government announced a proposal to limit social rents at consumer price inflation plus one per cent for five years from 2020, which will be reflected in a direction to the Social Housing Regulator and be consulted on in 2018.10
What’s more, on 25 October 2017, Theresa May announced that Local Housing Allowance rates would not be applied to supported housing, nor would they be applied to general needs social
9 Homes and Community Agency, The 2016 Global Accounts of private registered providers has been published alongside unit cost data (Homes and Community Agency, London), 2017 10 Department for Communities and Local Government, £2 billion boost for affordable housing and long term deal for social rent, (Department for Communities and Local Government, London), October 4 2017
Falling social rents in real terms
Negatives
• Lower margins for social landlords
• Social landlords’ ability to borrow is hampered by reduced value of future income stream
• Overall, there is less scope to invest in improving existing properties and to build more homes
• In the long run there may be more tenants on housing benefit in the private rented sector, which would result in higher government expenditure
Positives
• Lower government borrowing in the short run
• Higher disposable income after housing costs for some tenants
P11 | SETTING SOCIAL RENT
housing, which had been previously proposed in the Spending Review and Autumn Statement 2015.11
5. The impact of increasing social rents
The analysis we present here about the implications of different social rent policies after 2020 rests crucially on some other government policies being implemented, particularly that the benefit cap and local housing allowance increase in line with rents.
Since 2012, the local housing allowance has been based on the 30th percentile of local private rents among non-housing benefit recipients, with overall caps set based on the size of accommodation, up a maximum of four bedrooms. The local housing allowance rates have not been linked to annual increases in private rents since April 2013 and a freeze that has been largely implemented since April 2016 is set to continue until 2020 under current policy.12 What’s more, the overall benefit cap was reduced in nominal terms in 2016, and is also set to remain frozen to 2020.
In our analysis we assume that after 2020, both the overall benefit cap and local housing allowance increase in line with rents in order to prevent any further decreases in real incomes after housing costs. If this is not the case then our findings about the optimal social rent policy will change and we discuss this further in section 6.
To determine whether a social rent policy based on an increase equivalent to consumer price inflation plus one per cent is optimal in England and Wales we consider its long term impacts in terms of:
• Minimising the government’s net welfare fiscal position
• Maximising disposable income after housing costs for current social tenants
• Maximising the number of housing benefit claimants that can be provided with a new social home
The key drivers determining the impact on government finances are the cost of the welfare bill and the savings from moving housing benefit claimants from private rented accommodation to social housing. An increase in social rents will cause a corresponding increase in housing benefit, until the point that the household reaches the benefit cap. Meanwhile, an increase in social rents will provide the means to build more social homes through larger social landlord surpluses which can support higher levels of borrowing for investment. On average, the government welfare bill is higher for housing benefit claimants that are housed in the private sector, than in social housing,
11 Cassie Barton and Wendy Wilson, Local Housing Allowance Caps and the Social Rented Sector (House of Commons, Briefing Paper Number 07833), 2017 12 Robert Joyce, Matthew Mitchell and Agnes Norris Keiller, The cost of housing for low-income renters (Institute for Fiscal Studies, London), 2017
P12 | SETTING SOCIAL RENT
because of the higher rents. As such, there is a fiscal saving to the government for every household that they can move into a new social home.
Current social housing tenants on benefit will only be impacted by a change in social rents if there is an increase large enough to push them beyond the benefit cap, accounting for other benefits that they receive. If social rents, reach this level then an increase will have a negative impact on tenants’ disposable income after housing costs. Otherwise, any change in social rents will be met with an equal change in housing benefit and will therefore have no impact on tenants’ disposable income, except for a minority of tenants that do not receive benefits.
The number of new social houses built will be driven by the financial position of the housing associations and local authorities providing the housing. For housing associations the capacity to build new social homes will depend on the profitability of housing associations and their ability to borrow against the future revenue stream of new social homes. Higher rents will increase the providers’ margins and therefore increase the capital available to invest in the construction of new homes. Additionally, higher rents will increase the future revenue stream of new homes and, if this is recognised by finance providers, should enable additional borrowing to fund new homes. For local authorities the capacity to build new social homes will depend on their surpluses and their level of housing debt relative to their housing debt cap.
We developed a stylised model to evaluate the impacts of different social rent policies. (See Appendix A.)
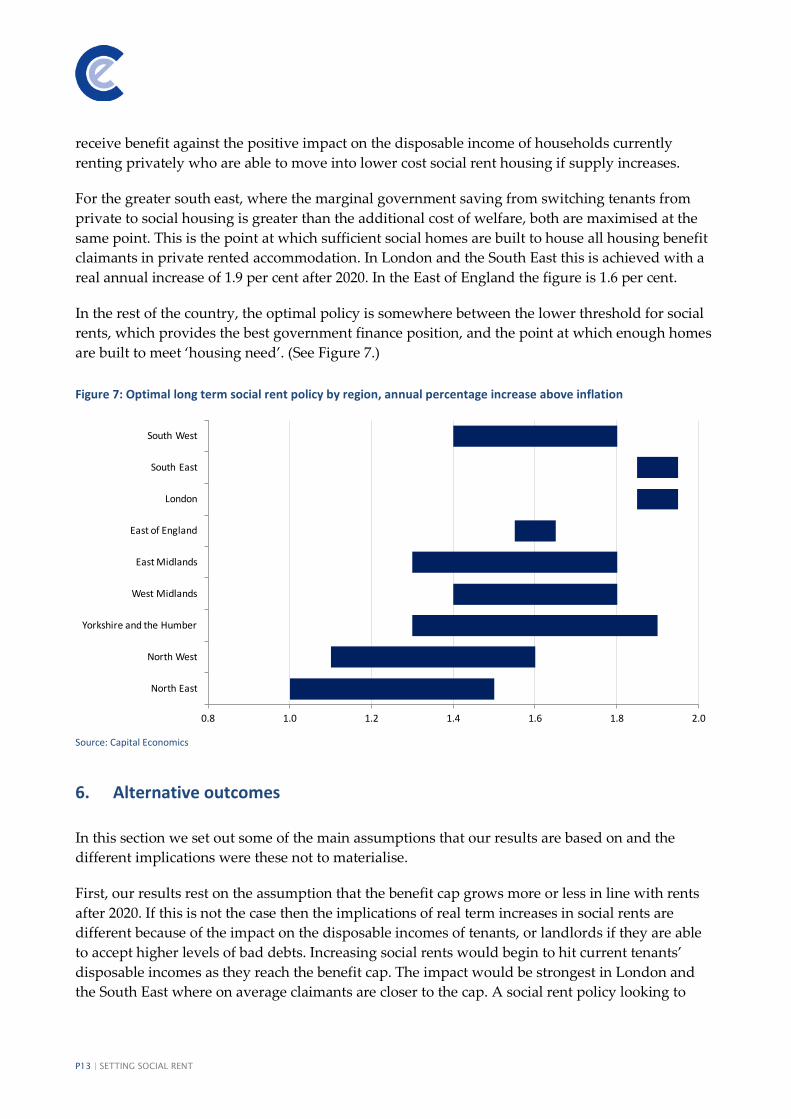
Our analysis suggests that the announced policy of consumer price inflation plus one per cent is broadly appropriate in much of the country. The optimal range for every region under our base assumptions is somewhere between consumer price inflation plus one to two per cent. However, the optimal policy for social rents does vary by region. Regional housing markets and economies have different characteristics and no single policy works for the whole country. There is a particular distinction between the relatively high rent greater south east and the rest of the country. (See Figure 7.)
In the greater south east, and particularly London, private rents are higher relative to earnings compared to the rest of the country. Social rents are also higher but there is a larger gap between private and social rents for housing benefit claimants. This means that there is a larger fiscal saving available to the government from moving claimants currently in the private rented sector to new social homes.
In each region there is a lower threshold for social rent policy below which social landlord margins would become unsustainable. This varies depending on construction and land costs and the levels of household formation which affect underlying growth in demand for social housing. The threshold is lower in the north of the country and highest in the south.
Social housing tenants that receive housing benefit will not normally lose any disposable income as a result of rent increases but a minority of tenants not receiving benefits will be worse off. However, policy needs to balance the negative impact on existing social tenants who do not
P13 | SETTING SOCIAL RENT
receive benefit against the positive impact on the disposable income of households currently renting privately who are able to move into lower cost social rent housing if supply increases.
For the greater south east, where the marginal government saving from switching tenants from private to social housing is greater than the additional cost of welfare, both are maximised at the same point. This is the point at which sufficient social homes are built to house all housing benefit claimants in private rented accommodation. In London and the South East this is achieved with a real annual increase of 1.9 per cent after 2020. In the East of England the figure is 1.6 per cent.
In the rest of the country, the optimal policy is somewhere between the lower threshold for social rents, which provides the best government finance position, and the point at which enough homes are built to meet ‘housing need’. (See Figure 7.)
Figure 7: Optimal long term social rent policy by region, annual percentage increase above inflation
Source: Capital Economics
6. Alternative outcomes
In this section we set out some of the main assumptions that our results are based on and the different implications were these not to materialise.
First, our results rest on the assumption that the benefit cap grows more or less in line with rents after 2020. If this is not the case then the implications of real term increases in social rents are different because of the impact on the disposable incomes of tenants, or landlords if they are able to accept higher levels of bad debts. Increasing social rents would begin to hit current tenants’ disposable incomes as they reach the benefit cap. The impact would be strongest in London and the South East where on average claimants are closer to the cap. A social rent policy looking to
0.8 1.0 1.2 1.4 1.6 1.8 2.0
North East
North West
Yorkshire and the Humber
West Midlands
East Midlands
East of England
London
South East
South West
P14 | SETTING SOCIAL RENT
optimise impacts on the government, tenants and housing supply would therefore likely be lower under this scenario. To illustrate this we look at the annual average change in disposable income of existing social housing tenants over 50 years under different scenarios. With an increasing benefit cap, the impact on tenants that receive housing benefit is unchanged. However, if this remains frozen in real terms, tenants’ incomes will fall depending on the extent of increase in rents and rates of earned income growth. (See Table 1.)
Table 1: Estimated annual change in real disposable income of average existing social housing tenant
Source: Capital Economics. Note: all figures presented in real terms.
Second, our stylised model assumes that a majority of registered providers’ surplus is used to fund new social homes. If this is not the case, the optimal increase in social rents for the supply of social homes would be pushed up. In the greater south east the optimal social rent would rise while in the rest of the country the range between the best rent policy for government finances and for house-building would increase.
Third, our analysis assumes a reasonable rate of borrowing costs for housing providers. If borrowing costs turn out to be higher, social landlords would be able to borrow less for a given future rental stream. As such, optimising social housing supply would require a higher annual increase in social rents.
Fourth, the estimates of the number of homes built through borrowing are based on current rates of government grant. Increases or decreases in government grant for home building will impact upon the overall building levels.
More information on the modelling approach can be found in Appendix A.
0% 1% 2% 3%2% growth in benefit cap, 2% earned income growth 0.9% 0.9% 0.9% 0.9%0% growth in benefit cap, 2% earned income growth 0.9% 0.9% 0.7% 0.0%0% growth in benefit cap, 0% earned income growth 0.0% 0.0% -0.4% -1.8%
Increase in real social rents
P15 | SETTING SOCIAL RENT
APPENDICES
P16 | SETTING SOCIAL RENT
A. Our approach
In this section, we explain our approach to modelling different rent policy options for after 2020.
Overview of model
We have developed a stylised model to evaluate the impacts of different social rent policies. This takes into account: (i) the short-term impacts on the government’s fiscal position, through welfare payments and grant for new house building, social landlords’ operating margins and tenants’ disposable income after housing costs; (ii) the sector’s ability to invest in new homes for social rent and therefore move recipients of housing benefit out of the private rented sector; and (iii) the long-term impacts on the government’s fiscal position, social landlords’ operating margins and tenants’ disposable income after housing costs.
The welfare system and government finances
The benefits system as a whole is complicated – and one must be careful about generalising. The amount of benefits received by a specific individual or household will depend on a variety of different factors – such as level of income, employment status and number of dependent children in the household. The average may not be representative.
Nevertheless, the treatment of support for housing costs specifically within the benefits system is less complicated. Typically, the amount received by a household as contribution to these costs is based on the actual rent paid. There are exceptions – such as for younger single occupancy households or for those close to the benefits cap, but generally the higher the rent, the greater the payment by the state.
We have calculated the benefits payable to a wide and representative range of exemplar households. These 108 case studies take into account the size of household, whether or not they are in employment and the cost of renting relative to the regional average. (See Figure 8.)
P17 | SETTING SOCIAL RENT
Figure 8: Case studies used
Source: Capital Economics
We model how different policy assumptions affect the welfare payments to the households in our case studies. This gives us an understanding of the impact on government finances. The scenarios differ in the number of new homes for social rent that can be built each year and this affects how many households can move from the private rented sector into the social rented sector. Under most circumstances this will lead to a reduction in welfare payments made by the government.
Social landlords
We estimate the annual surplus from existing properties and assume that a proportion of this is used to finance new construction. In addition, we assess how much social landlords can borrow against their future rental income stream. This borrowing, in conjunction with funding from government grant in some cases, is then used to build more social rent homes.
Tenants
We consider the number of households that are in the private rented sector and receive housing benefit that can be moved into the social rented sector in each scenario. In addition, using our case studies, we test the impact of the different policies on households’ disposable income after housing costs.
Policy scenarios
We have considered four exemplar policies for the setting of social rent after 2020 which allow us to understand how changing the rate that social rents can increase affects tenants, social landlords and government finances. From this we have drawn implications about what an optimal policy might be for social rents across the country. (See Table 2.)
Locations Two locations for each region
1. Below average rent in region
Bedrooms Employed Unemployed
1
2
3+
2. Above average rent in region
Bedrooms Employed Unemployed
1
2
3+
East Midlands
East of England
London
North East
North West
South East
South West
West Midlands
Yorkshire and the Humber
Twelve case studies for each region
108 case studies in total
Region Belowaverage rent
Above average rent
North West Allerdale Warrington
North East Gateshead Newcastle
London Bromley Hackney
South West North Devon Bristol
South East Eastleigh Oxford
East Southend Broxbourne
West Midlands Stoke Birmingham
East Midlands Derby Daventry
Yorkshire and the Humber
Hull LeedsScaled up according to existing share of housing benefit claimants in these categories
P18 | SETTING SOCIAL RENT
We consider a range of policies from a real term freeze in rents to a large rise of three per cent above inflation. A long term policy of real term falls in rent is not sustainable for the registered providers while the high case scenario represents what may be expected to happen if housing associations are given rent freedom to set rates however they see best fit.
We compare the outputs of each policy to determine the optimal social rent setting level.
Table 2: Exemplar policies
Source: Capital Economics
to 2020 post 2020
Scenario 1: CPI +1% -3% 1%Scenario 2: Frozen in real terms -3% 0%Scenario 3: CPI +2% -3% 2%Scenario 4: Rent freedom (capped at 90% private rent) -3% 3%Private rent 2% 2%Minimum gap with private rent 10% 10%
Local Housing allowance growth -2% 2%Benefit cap growth 0% 2%Other benefits inside cap growth 0% 0%Other benefits outside cap growth 0% 0%Earned income growth 0% 2%
Landlord costs 0% 1%Current interest rate on debt repayments 2.8%Additional interest on debt repayments 0% 2%Share of debt capital repaid 0% 0%
Real interest rate (Green book) 3.50% 3.50%Construction costs growth 1% 1%Average size of new property 60 60Share of surplus used for social housing new build 80% 80%
P19 | SETTING SOCIAL RENT
B. North East
In this section, we examine the social housing market in the North East and assess the impact of different social rent policies.
Current state of play
There is a total of almost one quarter of a million claimants of housing benefit in the North East, representing nearly fifteen per cent of the working age population. Around 70 per cent of these currently live in social housing while the remaining 30 per cent are in the private rented sector.
In 2016, the number of people on waiting lists across the North East region was just under 60,000, while around 22 per cent of homes overall have been deemed ‘non-decent’.13 There are varying criteria for waiting lists in different districts but will likely include some households who are currently either in poor quality or inappropriate accommodation, homeless or not eligible for housing benefit under current government policy.
House prices and rents in the region are low relative to national averages. Overall, private rents account for twenty per cent of average earnings compared to 30 per cent nationally. According to our modelling, in 2016 social rents in the region were on average nineteen per cent lower than private rents for benefit claimants. Meanwhile, with relatively low housing costs, the average welfare benefits received by households were over £100 per week lower than the average benefit cap.
Table 3: Housing and welfare statistics in the North East, 2016
Sources: Capital Economics, Department for Communities and Local Government, Office for National Statistics
Social rent policy after 2020
We have looked at the impact of social rent policies of between a real terms freeze and an annual three per cent increase above inflation.
13 Waiting list data from Department for Communities and Local Government. Non-decent homes data from poverty.org.uk based on the English Housing Survey of the Department for Communities and Local Government – latest data available from 2009 on regional basis.
North EastNumber of housing benefit claimants (thousands) 246,042 of which in social housing 173,548 of which in private rented 72,494 Number of housing benefit claimants (% of working age population) 14.8%Number of households on local authority waiting list (thousands) 57,678 Average welfare payment for housing benefit claimants in social housing (£ per week) 222Average welfare payment for housing benefit claimants in private rented housing (£ per week) 221Weighted average benefit cap (£ per week) 325Private rent as a share of earnings (% of mean earnings) 20
P20 | SETTING SOCIAL RENT
Over the next ten years we estimate that between 1,000 and 5,900 social homes could be built each year in the North East if housing providers used their surpluses for construction and they were able to borrow adequately against the future revenue stream of the social homes. The number of homes that could be built using housing providers’ surpluses is limited to 500 per year over the period because margins will be hit by the one per cent reduction in social rents up to 2020. The number of homes that can be funded through borrowing increases as the future income stream (social rents) increase.
Higher social rents will facilitate greater house-building. Under a ‘CPI +1%’ social rent policy, and accounting for new household formation, around 4,000 housing benefit claimants currently housed in the private rented sector could move to social housing. Under a ‘CPI +3%’ policy this figure would be 48,000. However, the increase in the welfare bill to cover higher social rents largely offsets this gain and the overall impact of different policies on government finances is minimal.
Tenants’ disposable income after housing costs is not affected by the social rent policy implemented because housing benefit can increase to cover the additional costs without breaching the benefit cap limit.
Table 4: Impact of different social rent policies on the North east economy over ten years
Source: Capital Economics
Over the longer term, social rent policy has different implications for the supply of social housing and government finances.
Relatively low private rents in the North East mean that the government savings from switching tenants from private rented accommodation to social housing is less than in some other regions. As such, with higher social rents, the savings to government of switching housing benefit claimants from the private sector to the social rented sector are outweighed by the increase in welfare spending. Purely in financial terms, the government would best served by setting social rents as low as possible.
However, in this case housing association margins are hit to the extent that they would need to sell off some of their existing stock forcing people out of social housing and into private rented
CPI +0% CPI +1% CPI +2% CPI +3%Real growth in disposable incomes (annual average percentage) 0.4% 0.4% 0.4% 0.4%Number of social houses built through surplus (annual average) 199 297 397 499 Number of social houses built through borrowing (annual average) 829 1,067 1,767 5,360 Total number of social houses built (annual average) 1,028 1,363 2,164 5,859 Number of claimants in social housing (thousands, 2026) 184 188 200 235Number of claimants in private housing (thousands, 2026) 75 71 59 25Total in-year spend on welfare (£ billion, 2026) 3.6 3.7 3.7 3.8of which for social tenants 2.5 2.6 2.9 3.4of which for tenants in the private sector 1.1 1.0 0.9 0.4Government grant spending for house-building (£ billion, 2026) 0.1 0.1 0.1 0.1Total government spend (£ billion, 2026) 3.7 3.8 3.8 3.9
P21 | SETTING SOCIAL RENT
accommodation. This is not a sustainable policy; to keep social housing stock at least at its current levels would require real social rent growth of around one per cent.
In order to increase the supply of social housing to accommodate all of those currently claiming housing benefit in the private rented sector (a proxy for ‘housing need’), the optimal policy would be an annual increase in social rents of 1.5 per cent above inflation; this could deliver sufficient supply to provide a social home for 73,000 households currently in the private sector, as well as accounting for new household formations.
Overall, the optimal social rent policy for the North East would be somewhere between 1.0 to 1.5 per cent above inflation annually.
Table 5: Impact of different social rent policies on the North east economy over fifty years
Source: Capital Economics
CPI +0% CPI +1% CPI +2% CPI +3%Real growth in disposable incomes (annual average percentage) 0.5% 0.5% 0.5% 0.5%Number of social houses built through surplus (annual average) - 117 1,823 3,736 Number of social houses built through borrowing (annual average) 595 870 4,373 6,298 Total number of social houses built (annual average) 595 987 6,196 10,034 Number of claimants in social housing (thousands, 2066) 144 224 289 289Number of claimants in private housing (thousands, 2066) 145 65 0 0Total in-year spend on welfare (£ billion, 2066) 11.2 11.2 13.1 15.7of which for social tenants 4.4 8.1 13.1 15.7of which for tenants in the private sector 6.8 3.1 0.0 0.0Government grant spending for house-building (£ billion, 2066) 0.2 0.2 0.2 0.2Total in-year government spend (£ billion, 2066) 11.4 11.4 13.4 16.0Total cumulative government spend (£ billion, 2016-2066) 303 310 337 379
P22 | SETTING SOCIAL RENT
C. North West
In this section, we examine the social housing market in the North West and assess the impact of different social rent policies.
Current state of play
There are a total of around 540,000 claimants of housing benefit in the North West, representing nearly twelve per cent of the working age population. Around 360,000 these households currently live in social housing while the remaining 175,000 are in the private rented sector.
In 2016, the number of people on waiting lists across the North West region was just under 190,000, while around 34 per cent of homes overall have been deemed ‘non-decent’.14 There are varying criteria for waiting lists in different districts but will likely include some households who are currently either in poor quality or inappropriate accommodation, homeless or not eligible for housing benefit under current government policy.
House prices and rents in the region are low relative to national averages. Overall, private rents account for 22 per cent of average earnings compared to 30 per cent nationally. According to our modelling, in 2016 social rents in the region were on average just eleven per cent lower than private rents for benefit claimants. The average welfare payments for claimants in the private sector are therefore only marginally higher than those for social housing tenants. Meanwhile, with relatively low housing costs, the average welfare benefits received by households were around £90 per week lower than the average benefit cap.
Table 6: Housing and welfare statistics in the North West, 2016
Sources: Capital Economics, Department for Communities and Local Government, Office for National Statistics
Social rent policy after 2020
We have looked at the impact of social rent policies of between a real terms freeze and an annual three per cent increase above inflation.
14 Waiting list data from Department for Communities and Local Government. Non-decent homes data from poverty.org.uk based on the English Housing Survey of the Department for Communities and Local Government – latest data available from 2009 on regional basis.
North WestNumber of housing benefit claimants (thousands) 537,629 of which in social housing 363,558 of which in private rented 174,071 Number of housing benefit claimants (% of working age population) 11.9%Number of households on local authority waiting list (thousands) 189,501 Average welfare payment for housing benefit claimants in social housing (£ per week) 241Average welfare payment for housing benefit claimants in private rented housing (£ per week) 246Weighted average benefit cap (£ per week) 332Private rent as a share of earnings (% of mean earnings) 22
P23 | SETTING SOCIAL RENT
Over the next ten years we estimate that between 2,200 and 10,700 social homes could be built each year in the North West if housing providers used their surpluses for construction and they were able to borrow adequately against the future revenue stream of the social homes. The number of homes that could be built using housing providers’ surpluses rises from 450 per year under a rent freeze to 1,100 per year with high social rent growth. The number of homes that can be funded through borrowing increases as the future income stream (social rents) increase.
Higher social rents will facilitate greater house-building. Under a ‘CPI +2%’ social rent policy, and accounting for new household formation, around 25,000 housing benefit claimants currently housed in the private rented sector could move to social housing. However, the increase in the welfare bill to cover higher social rents offsets this gain and the overall impact of higher social rents on government finances is marginally negative in the short term.
Tenants’ disposable income after housing costs is not affected by the social rent policy implemented because housing benefit can increase to cover the additional costs without breaching the benefit cap limit.
Table 7: Impact of different social rent policies on the North West economy over ten years
Source: Capital Economics
Over the longer term, social rent policy has different implications for the supply of social housing and government finances.
Relatively low private rents in the North West mean that the government savings from switching tenants from private rented accommodation to social housing is less than in some other regions. As such, with higher social rents, the savings to government of switching housing benefit claimants from the private sector to the social rented sector are outweighed by the increase in welfare spending.
Purely in financial terms, the government would best served by setting social rents as low as possible. However, in this case housing association margins are hit to the extent that they would need to sell off some of their existing stock forcing people out of social housing and into private rented accommodation. This is not a sustainable policy; to keep social housing stock at least at its current levels would require real social rent growth of around one per cent.
CPI +0% CPI +1% CPI +2% CPI +3%Real growth in disposable incomes (annual average percentage) 0.4% 0.4% 0.4% 0.4%Number of social houses built through surplus (annual average) 449 668 894 1,124 Number of social houses built through borrowing (annual average) 1,732 2,263 3,924 9,538 Total number of social houses built (annual average) 2,181 2,931 4,817 10,663 Number of claimants in social housing (thousands, 2026) 386 396 422 475Number of claimants in private housing (thousands, 2026) 185 175 149 96Total in-year spend on welfare (£ billion, 2026) 8.7 8.8 8.9 9.1of which for social tenants 5.7 6.0 6.6 7.5of which for tenants in the private sector 3.0 2.8 2.4 1.5Government grant spending for house-building (£ billion, 2026) 0.2 0.2 0.2 0.2Total government spend (£ billion, 2026) 8.9 9.0 9.2 9.3
P24 | SETTING SOCIAL RENT
In order to increase the supply of social housing to accommodate all of those currently claiming housing benefit in the private rented sector (a proxy for ‘housing need’), the optimal policy would be an annual increase in social rents of 1.6 per cent above inflation; this could deliver sufficient supply to provide a social home for 174,000 households currently in the private sector, while accounting for new household formations.
Overall, the optimal social rent policy for the North West would be somewhere between 1.1 to 1.6 per cent above inflation annually.
Table 8: Impact of different social rent policies on the North West economy over fifty years
Source: Capital Economics
CPI +0% CPI +1% CPI +2% CPI +3%Real growth in disposable incomes (annual average percentage) 0.6% 0.6% 0.6% 0.6%Number of social houses built through surplus (annual average) 0 264 4,108 7,121 Number of social houses built through borrowing (annual average) 1,238 1,845 9,863 13,129 Total number of social houses built (annual average) 1,238 2,108 13,971 20,250 Number of claimants in social housing (thousands, 2066) 292 472 650 650Number of claimants in private housing (thousands, 2066) 358 178 0 0Total in-year spend on welfare (£ billion, 2066) 28.3 27.8 32.0 36.1of which for social tenants 9.6 18.5 32.0 36.1of which for tenants in the private sector 18.7 9.3 0.0 0.0Government grant spending for house-building (£ billion, 2066) 0.5 0.5 0.5 0.5Total in-year government spend (£ billion, 2066) 28.8 28.3 32.5 36.6Total cumulative government spend (£ billion, 2016-2066) 749 761 817 885
P25 | SETTING SOCIAL RENT
D. Yorkshire and the Humber
In this section, we examine the social housing market in Yorkshire and the Humber and assess the impact of different social rent policies.
Current state of play
There are a total of around 390,000 claimants of housing benefit in Yorkshire and the Humber, representing nearly twelve per cent of the working age population. Around 270,000 these households currently live in social housing while the remaining 124,000 are in the private rented sector.
In 2016, the number of people on waiting lists across the region was a little under 150,000, while around 34 per cent of homes overall have been deemed ‘non-decent’.15 There are varying criteria for waiting lists in different districts but will likely include some households who are currently either in poor quality or inappropriate accommodation, homeless or not eligible for housing benefit under current government policy.
House prices and rents in the region are low relative to national averages. Overall, private rents account for 23 per cent of average earnings compared to 30 per cent nationally. According to our modelling, in 2016 social rents in the region were on average twenty per cent lower than private rents for benefit claimants. Meanwhile, with relatively low housing costs, the average welfare benefits received by households were over £100 per week lower than the average benefit cap, leaving plenty of scope to raise rents without affecting tenant disposable incomes.
Table 9: Housing and welfare statistics in Yorkshire and the Humber, 2016
Sources: Capital Economics, Department for Communities and Local Government, Office for National Statistics
Social rent policy after 2020
We have looked at the impact of social rent policies of between a real terms freeze and an annual three per cent increase above inflation.
15 Waiting list data from Department for Communities and Local Government. Non-decent homes data from poverty.org.uk based on the English Housing Survey of the Department for Communities and Local Government – latest data available from 2009 on regional basis.
Yorkshire Number of housing benefit claimants (thousands) 393,553 of which in social housing 269,598 of which in private rented 123,955 Number of housing benefit claimants (% of working age population) 11.6%Number of households on local authority waiting list (thousands) 146,149 Average welfare payment for housing benefit claimants in social housing (£ per week) 227Average welfare payment for housing benefit claimants in private rented housing (£ per week) 240Weighted average benefit cap (£ per week) 328Private rent as a share of earnings (% of mean earnings) 23
P26 | SETTING SOCIAL RENT
Over the next ten years we estimate that between 1,300 and 3,900 social homes could be built each year in Yorkshire and the Humber if housing providers used the majority of their surpluses for construction and they were able to borrow adequately against the future revenue stream of the social homes. The number of homes that could be built using housing providers’ surpluses is limited over the next decade because margins will be hit by the one per cent reduction in social rents up to 2020. The number of homes that can be funded through borrowing increases as the future income stream (social rents) increase, from 1,300 annually with a real rent freeze after 2020 to 3,300 with an annual three per cent rise above inflation.
Social rent increases of around 1.3 per cent annually in real terms are needed to provide sufficient margins to housing associations to keep social housing stock at its current levels. With two per cent real increases in social rents after 2020, and accounting for new household formation, around 19,000 housing benefit claimants currently housed in the private rented sector could move to social housing. However, the increase in the welfare bill to cover higher social rents offsets this gain and the overall impact of higher social rents on government finances is marginally negative in the short term.
Tenants’ disposable income after housing costs is not affected by the social rent policy implemented because housing benefit can increase to cover the additional costs without breaching the benefit cap limit.
Table 10: Impact of different social rent policies on the Yorkshire and the Humber economy over ten years
Source: Capital Economics
Over the longer term, social rent policy has different implications for the supply of social housing and government finances.
Relatively low private rents in Yorkshire and the Humber mean that the government savings from switching tenants from private rented accommodation to social housing is less than in some other regions. As such, with higher social rents, the savings to government of switching housing benefit claimants from the private sector to the social rented sector are outweighed by the increase in welfare spending.
CPI +0% CPI +1% CPI +2% CPI +3%Real growth in disposable incomes (annual average percentage) 0.4% 0.4% 0.4% 0.4%Number of social houses built through surplus (annual average) 250 372 498 627 Number of social houses built through borrowing (annual average) 1,086 1,315 1,850 3,309 Total number of social houses built (annual average) 1,336 1,687 2,348 3,936 Number of claimants in social housing (thousands, 2026) 283 288 302 316Number of claimants in private housing (thousands, 2026) 136 132 117 103Total in-year spend on welfare (£ billion, 2026) 6.1 6.2 6.2 6.3of which for social tenants 4.0 4.1 4.4 4.7of which for tenants in the private sector 2.1 2.1 1.8 1.6Government grant spending for house-building (£ billion, 2026) 0.2 0.2 0.2 0.2Total government spend (£ billion, 2026) 6.3 6.3 6.4 6.5
P27 | SETTING SOCIAL RENT
Purely in financial terms, the government would best served by setting social rents as low as possible. However, in this case housing association margins are hit to the extent that they would need to sell off some of their existing stock forcing people out of social housing and into private rented accommodation. This is not a sustainable policy; to keep social housing stock at least at its current levels over the next 50 years would require real social rent growth of around 1.3 per cent.
In order to increase the supply of social housing to accommodate all of those currently claiming housing benefit in the private rented sector (a proxy for ‘housing need’), the optimal policy would be an annual increase in social rents of 1.9 per cent above inflation; this could deliver sufficient supply to provide a social home for 124,000 households currently in the private sector, while accounting for new household formations.
Overall, the optimal social rent policy for the North West would be somewhere between 1.3 to 1.9 per cent above inflation annually.
Table 11: Impact of different social rent policies on the Yorkshire and the Humber economy over fifty years
Source: Capital Economics
CPI +0% CPI +1% CPI +2% CPI +3%Real growth in disposable incomes (annual average percentage) 0.6% 0.6% 0.6% 0.6%Number of social houses built through surplus (annual average) - 147 2,288 4,552 Number of social houses built through borrowing (annual average) 800 1,072 4,146 8,439 Total number of social houses built (annual average) 800 1,219 6,434 12,991 Number of claimants in social housing (thousands, 2066) 236 332 483 483 Number of claimants in private housing (thousands, 2066) 247 151 0 0Total in-year spend on welfare (£ billion, 2066) 19.9 19.8 21.8 25.8of which for social tenants 7.3 12.1 21.8 25.8of which for tenants in the private sector 12.6 7.7 0.0 0.0Government grant spending for house-building (£ billion, 2066) 0.4 0.4 0.4 0.4Total in-year government spend (£ billion, 2066) 20.3 20.2 22.2 26.1Total cumulative government spend (£ billion, 2016-2066) 528 538 566 624
P28 | SETTING SOCIAL RENT
E. West Midlands
In this section, we examine the social housing market in the West Midlands and assess the impact of different social rent policies.
Current state of play
There are a total of around 415,000 claimants of housing benefit in the West Midlands, representing approximately twelve per cent of the working age population. Around 73 per cent these households currently live in social housing while the remaining seventeen per cent are in the private rented sector.
In 2016, the number of people on waiting lists across the region was approximately 94,000, while around 33 per cent of homes overall have been deemed ‘non-decent’.16 There are varying criteria for waiting lists in different districts but will likely include some households who are currently either in poor quality or inappropriate accommodation, homeless or not eligible for housing benefit under current government policy.
House prices and rents in the region are low relative to national averages. Overall, private rents account for 24 per cent of average earnings compared to 30 per cent nationally. According to our modelling, in 2016 social rents in the region were on average 24 per cent lower than private rents for benefit claimants. Meanwhile, with relatively low housing costs, the average welfare benefits received by households were over £100 per week lower than the average benefit cap, leaving plenty of scope to raise rents without affecting tenant disposable incomes.
Table 12: Housing and welfare statistics in the West Midlands, 2016
Sources: Capital Economics, Department for Communities and Local Government, Office for National Statistics
Social rent policy after 2020
We have looked at the impact of social rent policies of between a real terms freeze and an annual three per cent increase above inflation.
16 Waiting list data from Department for Communities and Local Government. Non-decent homes data from poverty.org.uk based on the English Housing Survey of the Department for Communities and Local Government – latest data available from 2009 on regional basis.
West MidlandsNumber of housing benefit claimants (thousands) 415,660 of which in social housing 301,873 of which in private rented 113,787 Number of housing benefit claimants (% of working age population) 11.6%Number of households on local authority waiting list (thousands) 93,792 Average welfare payment for housing benefit claimants in social housing (£ per week) 237Average welfare payment for housing benefit claimants in private rented housing (£ per week) 243Weighted average benefit cap (£ per week) 341Private rent as a share of earnings (% of mean earnings) 24
P29 | SETTING SOCIAL RENT
Over the next ten years we estimate that between 1,500 and 6,800 social homes could be built each year in the West Midlands if housing providers used the majority of their surpluses for construction and they were able to borrow adequately against the future revenue stream of the social homes. The number of homes that could be built using housing providers’ surpluses is limited to fewer than 750 per year over the next decade because margins will be hit by the one per cent reduction in social rents up to 2020. The number of homes that can be funded through borrowing increases as the future income stream (social rents) increases.
Social rent increases of around 1.5 per cent annually in real terms are needed to provide sufficient margins to housing associations to keep social housing stock at its current levels up to 2026. With three per cent real increases in social rents after 2020, and accounting for new household formation, around 39,000 housing benefit claimants currently housed in the private rented sector could move to social housing. However, the increase in the welfare bill to cover higher social rents offsets this gain and the overall impact of higher social rents on government finances is marginally negative in the short term.
Tenants’ disposable income after housing costs is not affected by the social rent policy implemented because housing benefit can increase to cover the additional costs without breaching the benefit cap limit.
Table 13: Impact of different social rent policies on the West Midlands economy over ten years
Source: Capital Economics
Over the longer term, social rent policy has different implications for the supply of social housing and government finances.
Relatively low private rents in the West Midlands mean that the government savings from switching tenants from private rented accommodation to social housing is less than in some other regions. As such, with higher social rents, the savings to government of switching housing benefit claimants from the private sector to the social rented sector are outweighed by the increase in welfare spending.
Purely in financial terms, the government would best served by setting social rents as low as possible. However, in this case housing association margins are hit to the extent that they would
CPI +0% CPI +1% CPI +2% CPI +3%Real growth in disposable incomes (annual average percentage) 0.5% 0.5% 0.5% 0.5%Number of social houses built through surplus (annual average) 296 441 590 742 Number of social houses built through borrowing (annual average) 1,243 1,540 2,293 6,078 Total number of social houses built (annual average) 1,540 1,982 2,883 6,820 Number of claimants in social housing (thousands, 2026) 318 323 340 373Number of claimants in private housing (thousands, 2026) 131 125 108 75Total in-year spend on welfare (£ billion, 2026) 6.7 6.8 6.9 7.0of which for social tenants 4.7 4.8 5.2 5.8of which for tenants in the private sector 2.1 2.0 1.7 1.2Government grant spending for house-building (£ billion, 2026) 0.2 0.2 0.2 0.2Total government spend (£ billion, 2026) 6.9 7.0 7.1 7.2
P30 | SETTING SOCIAL RENT
need to sell off some of their existing stock forcing people out of social housing and into private rented accommodation. This is not a sustainable policy; to keep social housing stock at least at its current levels over the next 50 years would require real social rent growth of around 1.4 per cent.
In order to increase the supply of social housing to accommodate all of those currently claiming housing benefit in the private rented sector (a proxy for ‘housing need’), the optimal policy would be an annual increase in social rents of 1.8 per cent above inflation; this could deliver sufficient supply to provide a social home for 114,000 households currently in the private sector, while accounting for new household formations.
Overall, the optimal social rent policy for the West Midlands would be somewhere between 1.4 to 1.8 per cent above inflation annually.
Table 14: Impact of different social rent policies on the West Midlands economy over fifty years
Source: Capital Economics
CPI +0% CPI +1% CPI +2% CPI +3%Real growth in disposable incomes (annual average percentage) 0.7% 0.7% 0.7% 0.7%Number of social houses built through surplus (annual average) - 174 2,711 5,729 Number of social houses built through borrowing (annual average) 908 1,256 5,717 10,064 Total number of social houses built (annual average) 908 1,430 8,429 15,793 Number of claimants in social housing (thousands, 2066) 259 375 541 541 Number of claimants in private housing (thousands, 2066) 281 166 0 0Total in-year spend on welfare (£ billion, 2066) 22.7 22.7 25.5 31.0of which for social tenants 8.4 14.3 25.5 31.0of which for tenants in the private sector 14.3 8.5 0.0 0.0Government grant spending for house-building (£ billion, 2066) 0.4 0.4 0.4 0.4Total in-year government spend (£ billion, 2066) 23.1 23.1 25.9 31.4Total cumulative government spend (£ billion, 2016-2066) 595 607 645 725
P31 | SETTING SOCIAL RENT
F. East Midlands
In this section, we examine the social housing market in the East Midlands and assess the impact of different social rent policies.
Current state of play
There are a total of around 290,000 claimants of housing benefit in the East Midlands, representing a little less than ten per cent of the working age population. Around 200,000 these households currently live in social housing while the remaining 90,000 are in the private rented sector.
In 2016, the number of people on waiting lists across the region was approximately 85,000, while around 32 per cent of homes overall have been deemed ‘non-decent’.17 There are varying criteria for waiting lists in different districts but will likely include some households who are currently either in poor quality or inappropriate accommodation, homeless or not eligible for housing benefit under current government policy.
House prices and rents in the region are low relative to national averages. Overall, private rents account for 23 per cent of average earnings compared to 30 per cent nationally. According to our modelling, in 2016 social rents in the region were on 21 per cent lower than private rents for benefit claimants. Meanwhile, with relatively low housing costs, the average welfare benefits received by households were over £90 per week lower than the average benefit cap, leaving plenty of scope to raise rents without affecting tenant disposable incomes.
Table 15: Housing and welfare statistics in the East Midlands, 2016
Sources: Capital Economics, Department for Communities and Local Government, Office for National Statistics
Social rent policy after 2020
We have looked at the impact of social rent policies of between a real terms freeze and an annual three per cent increase above inflation.
17 Waiting list data from Department for Communities and Local Government. Non-decent homes data from poverty.org.uk based on the English Housing Survey of the Department for Communities and Local Government – latest data available from 2009 on regional basis.
East MidlandsNumber of housing benefit claimants (thousands) 287,858 of which in social housing 199,360 of which in private rented 88,498 Number of housing benefit claimants (% of working age population) 9.8%Number of households on local authority waiting list (thousands) 84,243 Average welfare payment for housing benefit claimants in social housing (£ per week) 240Average welfare payment for housing benefit claimants in private rented housing (£ per week) 254Weighted average benefit cap (£ per week) 332Private rent as a share of earnings (% of mean earnings) 23
P32 | SETTING SOCIAL RENT
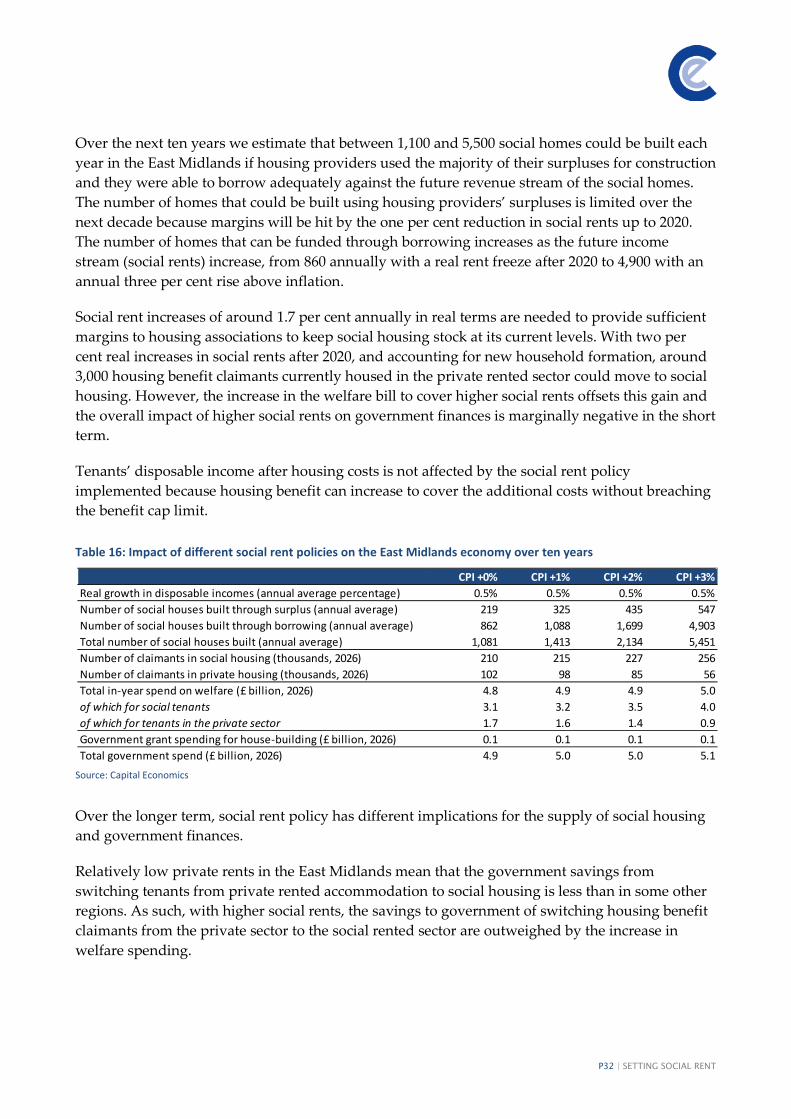
Over the next ten years we estimate that between 1,100 and 5,500 social homes could be built each year in the East Midlands if housing providers used the majority of their surpluses for construction and they were able to borrow adequately against the future revenue stream of the social homes. The number of homes that could be built using housing providers’ surpluses is limited over the next decade because margins will be hit by the one per cent reduction in social rents up to 2020. The number of homes that can be funded through borrowing increases as the future income stream (social rents) increase, from 860 annually with a real rent freeze after 2020 to 4,900 with an annual three per cent rise above inflation.
Social rent increases of around 1.7 per cent annually in real terms are needed to provide sufficient margins to housing associations to keep social housing stock at its current levels. With two per cent real increases in social rents after 2020, and accounting for new household formation, around 3,000 housing benefit claimants currently housed in the private rented sector could move to social housing. However, the increase in the welfare bill to cover higher social rents offsets this gain and the overall impact of higher social rents on government finances is marginally negative in the short term.
Tenants’ disposable income after housing costs is not affected by the social rent policy implemented because housing benefit can increase to cover the additional costs without breaching the benefit cap limit.
Table 16: Impact of different social rent policies on the East Midlands economy over ten years
Source: Capital Economics
Over the longer term, social rent policy has different implications for the supply of social housing and government finances.
Relatively low private rents in the East Midlands mean that the government savings from switching tenants from private rented accommodation to social housing is less than in some other regions. As such, with higher social rents, the savings to government of switching housing benefit claimants from the private sector to the social rented sector are outweighed by the increase in welfare spending.
CPI +0% CPI +1% CPI +2% CPI +3%Real growth in disposable incomes (annual average percentage) 0.5% 0.5% 0.5% 0.5%Number of social houses built through surplus (annual average) 219 325 435 547 Number of social houses built through borrowing (annual average) 862 1,088 1,699 4,903 Total number of social houses built (annual average) 1,081 1,413 2,134 5,451 Number of claimants in social housing (thousands, 2026) 210 215 227 256Number of claimants in private housing (thousands, 2026) 102 98 85 56Total in-year spend on welfare (£ billion, 2026) 4.8 4.9 4.9 5.0of which for social tenants 3.1 3.2 3.5 4.0of which for tenants in the private sector 1.7 1.6 1.4 0.9Government grant spending for house-building (£ billion, 2026) 0.1 0.1 0.1 0.1Total government spend (£ billion, 2026) 4.9 5.0 5.0 5.1
P33 | SETTING SOCIAL RENT
Purely in financial terms, the government would best served by setting social rents as low as possible. However, in this case housing association margins are hit to the extent that they would need to sell off some of their existing stock forcing people out of social housing and into private rented accommodation. This is not a sustainable policy; to keep social housing stock at least at its current levels over the next 50 years would require real social rent growth of around 1.3 per cent.
In order to increase the supply of social housing to accommodate all of those currently claiming housing benefit in the private rented sector (a proxy for ‘housing need’), the optimal policy would be an annual increase in social rents of 1.8 per cent above inflation; this could deliver sufficient supply to provide a social home for 88,000 households currently in the private sector, while accounting for new household formations.
Overall, the optimal social rent policy for the East Midlands would be somewhere between 1.3 to 1.8 per cent.
Table 17: Impact of different social rent policies on the East Midlands economy over fifty years
Source: Capital Economics
CPI +0% CPI +1% CPI +2% CPI +3%Real growth in disposable incomes (annual average percentage) 0.7% 0.7% 0.7% 0.7%Number of social houses built through surplus (annual average) 0 128 1,999 4,097 Number of social houses built through borrowing (annual average) 625 887 4,447 7,095 Total number of social houses built (annual average) 625 1,015 6,447 11,192 Number of claimants in social housing (thousands, 2066) 166 251 372 372Number of claimants in private housing (thousands, 2066) 206 120 0 0Total in-year spend on welfare (£ billion, 2066) 16.7 16.4 18.0 21.6of which for social tenants 5.4 9.8 18.0 21.6of which for tenants in the private sector 11.3 6.6 0.0 0.0Government grant spending for house-building (£ billion, 2066) 0.3 0.3 0.3 0.3Total in-year government spend (£ billion, 2066) 16.9 16.6 18.3 21.9Total cumulative government spend (£ billion, 2016-2066) 431 436 458 512
P34 | SETTING SOCIAL RENT
G. East of England
In this section, we examine the social housing market in the East of England and assess the impact of different social rent policies.
Current state of play
There are around 350,000 claimants of housing benefit in the East of England, representing 9.2 per cent of the working age population. Around 70 per cent of these households currently live in social housing while the rest are in the private rented sector.
In 2016, the number of people on waiting lists across the region was approximately 154,000, while around 29 per cent of homes overall have been deemed ‘non-decent’.18 There are varying criteria for waiting lists in different districts but will likely include some households who are currently either in poor quality or inappropriate accommodation, homeless or not eligible for housing benefit under current government policy.
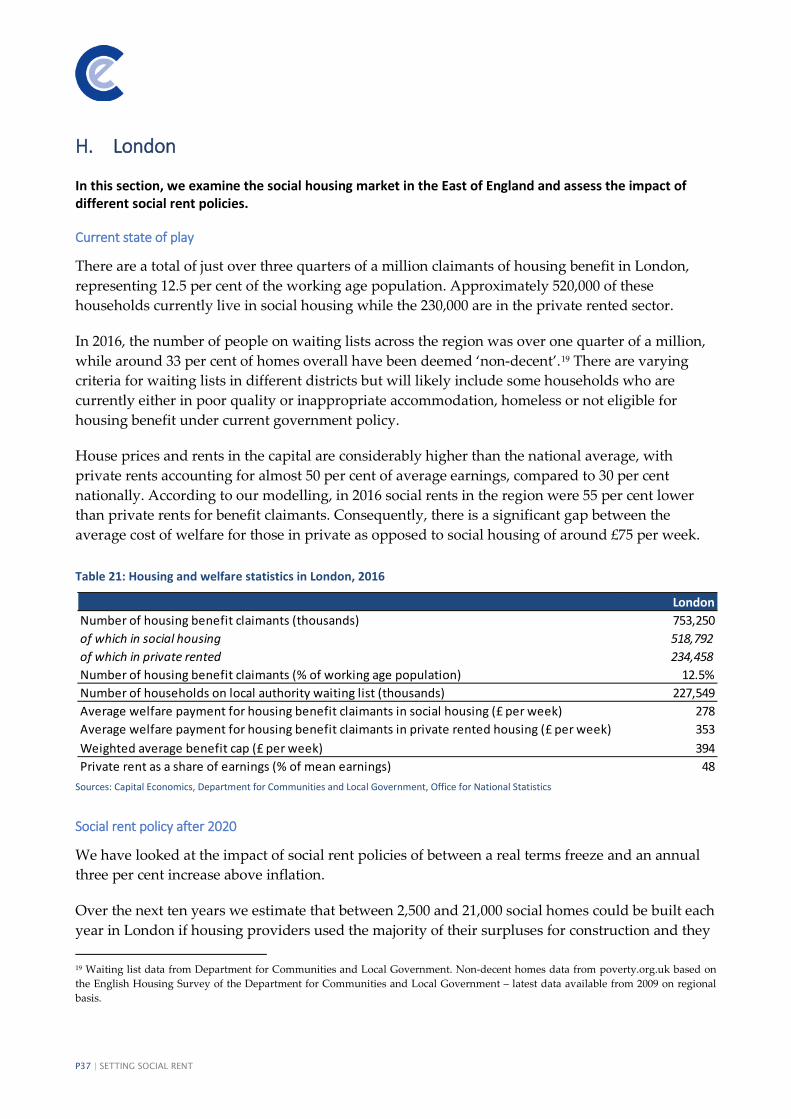
House prices and rents in the region are in line with the national average with private rents accounting for 30 per cent of average earnings compared- equivalent to the national average. According to our modelling, in 2016 social rents in the region were over 40 per cent lower than private rents for benefit claimants. Consequently, there is a significant gap between the average cost of welfare for those in private as opposed to social housing of around £40 per week.
Table 18: Housing and welfare statistics in the East of England, 2016
Sources: Capital Economics, Department for Communities and Local Government, Office for National Statistics
Social rent policy after 2020
We have looked at the impact of social rent policies of between a real terms freeze and an annual three per cent increase above inflation.
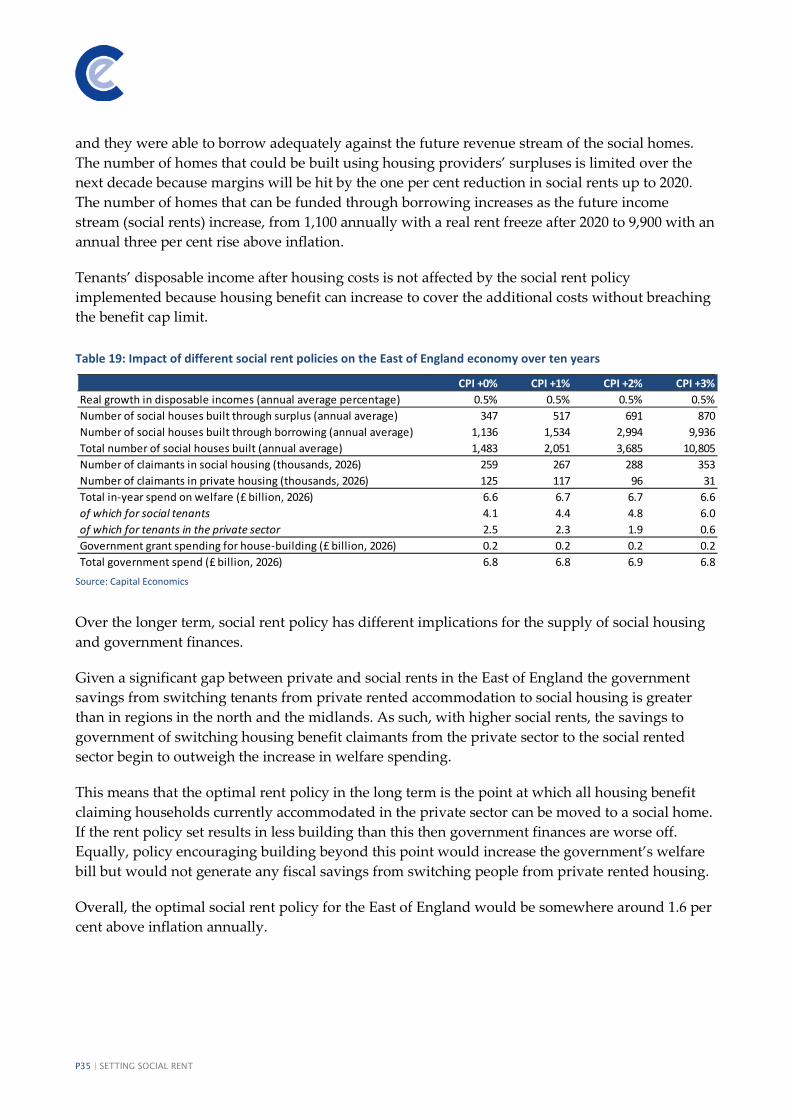
Over the next ten years we estimate that between 1,500 and 10,800 social homes could be built each year in the South East if housing providers used the majority of their surpluses for construction 18 Waiting list data from Department for Communities and Local Government. Non-decent homes data from poverty.org.uk based on the English Housing Survey of the Department for Communities and Local Government – latest data available from 2009 on regional basis.
East of EnglandNumber of housing benefit claimants (thousands) 347,554 of which in social housing 244,286 of which in private rented 103,268 Number of housing benefit claimants (% of working age population) 9.2%Number of households on local authority waiting list (thousands) 103,497 Average welfare payment for housing benefit claimants in social housing (£ per week) 260Average welfare payment for housing benefit claimants in private rented housing (£ per week) 298Weighted average benefit cap (£ per week) 346Private rent as a share of earnings (% of mean earnings) 30
P35 | SETTING SOCIAL RENT
and they were able to borrow adequately against the future revenue stream of the social homes. The number of homes that could be built using housing providers’ surpluses is limited over the next decade because margins will be hit by the one per cent reduction in social rents up to 2020. The number of homes that can be funded through borrowing increases as the future income stream (social rents) increase, from 1,100 annually with a real rent freeze after 2020 to 9,900 with an annual three per cent rise above inflation.
Tenants’ disposable income after housing costs is not affected by the social rent policy implemented because housing benefit can increase to cover the additional costs without breaching the benefit cap limit.
Table 19: Impact of different social rent policies on the East of England economy over ten years
Source: Capital Economics
Over the longer term, social rent policy has different implications for the supply of social housing and government finances.
Given a significant gap between private and social rents in the East of England the government savings from switching tenants from private rented accommodation to social housing is greater than in regions in the north and the midlands. As such, with higher social rents, the savings to government of switching housing benefit claimants from the private sector to the social rented sector begin to outweigh the increase in welfare spending.
This means that the optimal rent policy in the long term is the point at which all housing benefit claiming households currently accommodated in the private sector can be moved to a social home. If the rent policy set results in less building than this then government finances are worse off. Equally, policy encouraging building beyond this point would increase the government’s welfare bill but would not generate any fiscal savings from switching people from private rented housing.
Overall, the optimal social rent policy for the East of England would be somewhere around 1.6 per cent above inflation annually.
CPI +0% CPI +1% CPI +2% CPI +3%Real growth in disposable incomes (annual average percentage) 0.5% 0.5% 0.5% 0.5%Number of social houses built through surplus (annual average) 347 517 691 870 Number of social houses built through borrowing (annual average) 1,136 1,534 2,994 9,936 Total number of social houses built (annual average) 1,483 2,051 3,685 10,805 Number of claimants in social housing (thousands, 2026) 259 267 288 353Number of claimants in private housing (thousands, 2026) 125 117 96 31Total in-year spend on welfare (£ billion, 2026) 6.6 6.7 6.7 6.6of which for social tenants 4.1 4.4 4.8 6.0of which for tenants in the private sector 2.5 2.3 1.9 0.6Government grant spending for house-building (£ billion, 2026) 0.2 0.2 0.2 0.2Total government spend (£ billion, 2026) 6.8 6.8 6.9 6.8
P36 | SETTING SOCIAL RENT
Table 20: Impact of different social rent policies on the East of England economy over fifty years
Source: Capital Economics
CPI +0% CPI +1% CPI +2% CPI +3%Real growth in disposable incomes (annual average percentage) 0.8% 0.8% 0.8% 0.8%Number of social houses built through surplus (annual average) - 204 3,175 7,163 Number of social houses built through borrowing (annual average) 802 1,251 7,558 9,936 Total number of social houses built (annual average) 802 1,454 10,732 17,099 Number of claimants in social housing (thousands, 2066) 182 319 487 487 Number of claimants in private housing (thousands, 2066) 305 167 0 0Total in-year spend on welfare (£ billion, 2066) 28.9 26.0 26.6 35.3of which for social tenants 6.4 13.7 26.6 35.3of which for tenants in the private sector 22.5 12.3 0.0 0.0Government grant spending for house-building (£ billion, 2066) 0.3 0.3 0.3 0.3Total in-year government spend (£ billion, 2066) 29.2 26.4 27.0 35.6Total cumulative government spend (£ billion, 2016-2066) 674 655 652 760
P37 | SETTING SOCIAL RENT
H. London
In this section, we examine the social housing market in the East of England and assess the impact of different social rent policies.
Current state of play
There are a total of just over three quarters of a million claimants of housing benefit in London, representing 12.5 per cent of the working age population. Approximately 520,000 of these households currently live in social housing while the 230,000 are in the private rented sector.
In 2016, the number of people on waiting lists across the region was over one quarter of a million, while around 33 per cent of homes overall have been deemed ‘non-decent’.19 There are varying criteria for waiting lists in different districts but will likely include some households who are currently either in poor quality or inappropriate accommodation, homeless or not eligible for housing benefit under current government policy.
House prices and rents in the capital are considerably higher than the national average, with private rents accounting for almost 50 per cent of average earnings, compared to 30 per cent nationally. According to our modelling, in 2016 social rents in the region were 55 per cent lower than private rents for benefit claimants. Consequently, there is a significant gap between the average cost of welfare for those in private as opposed to social housing of around £75 per week.
Table 21: Housing and welfare statistics in London, 2016
Sources: Capital Economics, Department for Communities and Local Government, Office for National Statistics
Social rent policy after 2020
We have looked at the impact of social rent policies of between a real terms freeze and an annual three per cent increase above inflation.
Over the next ten years we estimate that between 2,500 and 21,000 social homes could be built each year in London if housing providers used the majority of their surpluses for construction and they 19 Waiting list data from Department for Communities and Local Government. Non-decent homes data from poverty.org.uk based on the English Housing Survey of the Department for Communities and Local Government – latest data available from 2009 on regional basis.
LondonNumber of housing benefit claimants (thousands) 753,250 of which in social housing 518,792 of which in private rented 234,458 Number of housing benefit claimants (% of working age population) 12.5%Number of households on local authority waiting list (thousands) 227,549 Average welfare payment for housing benefit claimants in social housing (£ per week) 278Average welfare payment for housing benefit claimants in private rented housing (£ per week) 353Weighted average benefit cap (£ per week) 394Private rent as a share of earnings (% of mean earnings) 48
P38 | SETTING SOCIAL RENT
were able to borrow adequately against the future revenue stream of the social homes. The number of homes that could be built using housing providers’ surpluses is limited over the next decade because margins will be hit by the one per cent reduction in social rents up to 2020. The number of homes that can be funded through borrowing increases as the future income stream (social rents) increase, from 1,800 annually with a real rent freeze after 2020 to 19,300 with an annual three per cent rise above inflation.
Tenants’ disposable income after housing costs is not affected by the social rent policy implemented because housing benefit can increase to cover the additional costs without breaching the benefit cap limit.
Table 22: Impact of different social rent policies on the London economy over ten years
Source: Capital Economics
Over the longer term, social rent policy has different implications for the supply of social housing and government finances.
Given a significant gap between private and social rents in London the government savings from switching tenants from private rented accommodation to social housing is greater than in regions in the north and the midlands. As such, with higher social rents, the savings to government of switching housing benefit claimants from the private sector to the social rented sector begin to outweigh the increase in welfare spending.
This means that the optimal rent policy in the long term is the point at which all housing benefit claiming households currently accommodated in the private sector can be moved to a social home. If the rent policy set results in less building than this then government finances are worse off. Equally, policy encouraging building beyond this point would increase the government’s welfare bill but would not generate any fiscal savings from switching people from private rented housing.
Overall, the optimal social rent policy for the London would be somewhere around 1.9 per cent above inflation annually.
CPI +0% CPI +1% CPI +2% CPI +3%Real growth in disposable incomes (annual average percentage) 0.5% 0.5% 0.5% 0.5%Number of social houses built through surplus (annual average) 662 985 1,317 1,658 Number of social houses built through borrowing (annual average) 1,827 2,441 4,569 19,271 Total number of social houses built (annual average) 2,489 3,426 5,886 20,928 Number of claimants in social housing (thousands, 2026) 544 557 593 732Number of claimants in private housing (thousands, 2026) 332 319 283 144Total in-year spend on welfare (£ billion, 2026) 17.0 17.1 17.2 16.7of which for social tenants 9.1 9.6 10.5 13.3of which for tenants in the private sector 7.9 7.6 6.7 3.4Government grant spending for house-building (£ billion, 2026) 0.3 0.3 0.3 0.3Total government spend (£ billion, 2026) 17.3 17.4 17.5 17.0
P39 | SETTING SOCIAL RENT
Table 23: Impact of different social rent policies on the London economy over fifty years
Source: Capital Economics
CPI +0% CPI +1% CPI +2% CPI +3%Real growth in disposable incomes (annual average percentage) 0.9% 0.9% 0.9% 0.9%Number of social houses built through surplus (annual average) - 388 6,053 13,687 Number of social houses built through borrowing (annual average) 1,295 1,990 13,683 19,461 Total number of social houses built (annual average) 1,295 2,378 19,736 33,148 Number of claimants in social housing (thousands, 2066) 387 641 1,221 1,221 Number of claimants in private housing (thousands, 2066) 833 579 0 0Total in-year spend on welfare (£ billion, 2066) 91.9 83.4 73.2 99.7of which for social tenants 14.3 29.5 73.2 99.7of which for tenants in the private sector 77.6 53.9 0.0 0.0Government grant spending for house-building (£ billion, 2066) 0.7 0.7 0.7 0.7Total in-year government spend (£ billion, 2066) 92.6 84.1 73.8 100.4Total cumulative government spend (£ billion, 2016-2066) 1,973 1,909 1,757 2,028
P40 | SETTING SOCIAL RENT
I. South East
In this section, we examine the social housing market in the South East and assess the impact of different social rent policies.
Current state of play
There are just under half a million claimants of housing benefit in the South East, representing 8.8 per cent of the working age population. Around 320,000 of these households currently live in social housing while the rest are in the private rented sector.
In 2016, the number of people on waiting lists across the region was approximately 154,000, while around 31 per cent of homes overall have been deemed ‘non-decent’.20 There are varying criteria for waiting lists in different districts but will likely include some households who are currently either in poor quality or inappropriate accommodation, homeless or not eligible for housing benefit under current government policy.
House prices and rents in the region are above the national average with private rents accounting for 34 per cent of average earnings compared to 30 per cent nationally. According to our modelling, in 2016 social rents in the region were over 40 per cent lower than private rents for benefit claimants. Consequently, there is a significant gap between the average cost of welfare for those in private as opposed to social housing of around £40 per week. The average welfare benefits received by households in social housing were about £55 per week lower than the average benefit cap, while they were just £35 per week lower for claimants in private rented accommodation.
Table 24: Housing and welfare statistics in the South East, 2016
Sources: Capital Economics, Department for Communities and Local Government, Office for National Statistics
Social rent policy after 2020
We have looked at the impact of social rent policies of between a real terms freeze and an annual three per cent increase above inflation.
20 Waiting list data from Department for Communities and Local Government. Non-decent homes data from poverty.org.uk based on the English Housing Survey of the Department for Communities and Local Government – latest data available from 2009 on regional basis.
South EastNumber of housing benefit claimants (thousands) 492,244 of which in social housing 320,004 of which in private rented 172,240 Number of housing benefit claimants (% of working age population) 8.8%Number of households on local authority waiting list (thousands) 153,933 Average welfare payment for housing benefit claimants in social housing (£ per week) 270Average welfare payment for housing benefit claimants in private rented housing (£ per week) 309Weighted average benefit cap (£ per week) 344Private rent as a share of earnings (% of mean earnings) 34
P41 | SETTING SOCIAL RENT
Over the next ten years we estimate that between 1,500 and 9,400 social homes could be built each year in the South East if housing providers used the majority of their surpluses for construction and they were able to borrow adequately against the future revenue stream of the social homes. The number of homes that could be built using housing providers’ surpluses is limited over the next decade because margins will be hit by the one per cent reduction in social rents up to 2020. The number of homes that can be funded through borrowing increases as the future income stream (social rents) increase, from 1,100 annually with a real rent freeze after 2020 to 8,600 with an annual three per cent rise above inflation.
Tenants’ disposable income after housing costs is not affected by the social rent policy implemented because housing benefit can increase to cover the additional costs without breaching the benefit cap limit.
Table 25: Impact of different social rent policies on the South East economy over ten years
Source: Capital Economics
Over the longer term, social rent policy has different implications for the supply of social housing and government finances.
Given a significant gap between private and social rents in the South East the government savings from switching tenants from private rented accommodation to social housing is greater than in regions in the north and the midlands. As such, with higher social rents, the savings to government of switching housing benefit claimants from the private sector to the social rented sector begin to outweigh the increase in welfare spending.
This means that the optimal rent policy in the long term is the point at which all housing benefit claiming households currently accommodated in the private sector can be moved to a social home. If the rent policy set results in less building than this then government finances are worse off. Equally, policy encouraging building beyond this point would increase the government’s welfare bill but would not generate any fiscal savings from switching people from private rented housing.
Overall, the optimal social rent policy for the South East would be somewhere around 1.9 per cent above inflation annually.
CPI +0% CPI +1% CPI +2% CPI +3%Real growth in disposable incomes (annual average percentage) 0.6% 0.5% 0.5% 0.5%Number of social houses built through surplus (annual average) 352 524 700 881 Number of social houses built through borrowing (annual average) 1,106 1,390 2,153 8,551 Total number of social houses built (annual average) 1,458 1,914 2,853 9,432 Number of claimants in social housing (thousands, 2026) 335 341 359 419Number of claimants in private housing (thousands, 2026) 208 202 183 123Total in-year spend on welfare (£ billion, 2026) 9.8 9.9 10.0 9.9of which for social tenants 5.6 5.8 6.2 7.4of which for tenants in the private sector 4.3 4.1 3.8 2.5Government grant spending for house-building (£ billion, 2026) 0.2 0.2 0.2 0.2Total government spend (£ billion, 2026) 10.0 10.1 10.2 10.1
P42 | SETTING SOCIAL RENT
Table 26: Impact of different social rent policies on the South East economy over fifty years
Source: Capital Economics
CPI +0% CPI +1% CPI +2% CPI +3%Real growth in disposable incomes (annual average percentage) 0.8% 0.8% 0.8% 0.8%Number of social houses built through surplus (annual average) - 206 3,217 7,261 Number of social houses built through borrowing (annual average) 802 1,134 6,464 11,670 Total number of social houses built (annual average) 802 1,340 9,681 18,930 Number of claimants in social housing (thousands, 2066) 256 388 680 680Number of claimants in private housing (thousands, 2066) 424 292 0 0Total in-year spend on welfare (£ billion, 2066) 41.1 39.1 38.4 50.8of which for social tenants 9.4 17.2 38.4 50.8of which for tenants in the private sector 31.7 21.8 0.0 0.0Government grant spending for house-building (£ billion, 2066) 0.4 0.4 0.4 0.4Total in-year government spend (£ billion, 2066) 41.5 39.5 38.8 51.2Total cumulative government spend (£ billion, 2016-2066) 981 975 972 1,105
P43 | SETTING SOCIAL RENT
J. South West
In this section, we examine the social housing market in the South West and assess the impact of different social rent policies.
Current state of play
There are around 330,000 claimants of housing benefit in the South West, representing 9.9 per cent of the working age population. Around 62 per cent of these households currently live in social housing while the remaining 38 per cent are in the private rented sector.
In 2016, the number of people on waiting lists across the region was approximately 127,000, while around 39 per cent of homes overall have been deemed ‘non-decent’.21 There are varying criteria for waiting lists in different districts but will likely include some households who are currently either in poor quality or inappropriate accommodation, homeless or not eligible for housing benefit under current government policy.
House prices and rents in the region are just below the national average with private rents accounting for 29 per cent of average earnings compared to 30 per cent nationally. According to our modelling, in 2016 social rents in the region were 37 per cent lower than private rents for benefit claimants. The gap between the average cost of welfare for those in private as opposed to social housing is around £22 per week. The average welfare benefits received by households in social housing were about over £100 per week lower than the average benefit cap, leaving plenty of scope to raise social rents without negatively affecting tenants’ incomes.
Table 27: Housing and welfare statistics in the South West, 2016
Source: Capital Economics
Social rent policy after 2020
We have looked at the impact of social rent policies of between a real terms freeze and an annual three per cent increase above inflation.
21 Waiting list data from Department for Communities and Local Government. Non-decent homes data from poverty.org.uk based on the English Housing Survey of the Department for Communities and Local Government – latest data available from 2009 on regional basis.
South WestNumber of housing benefit claimants (thousands) 330,451 of which in social housing 205,832 of which in private rented 124,619 Number of housing benefit claimants (% of working age population) 9.9%Number of households on local authority waiting list (thousands) 127,437 Average welfare payment for housing benefit claimants in social housing (£ per week) 235Average welfare payment for housing benefit claimants in private rented housing (£ per week) 257Weighted average benefit cap (£ per week) 338Private rent as a share of earnings (% of mean earnings) 29
P44 | SETTING SOCIAL RENT
Over the next ten years we estimate that between 1,100 and 5,400 social homes could be built each year in the South West if housing providers used the majority of their surpluses for construction and they were able to borrow adequately against the future revenue stream of the social homes. The number of homes that could be built using housing providers’ surpluses is limited over the next decade because margins will be hit by the one per cent reduction in social rents up to 2020. The number of homes that can be funded through borrowing increases as the future income stream (social rents) increase, from 850 annually with a real rent freeze after 2020 to 4,800 with an annual three per cent rise above inflation.
Tenants’ disposable income after housing costs is not affected by the social rent policy implemented because housing benefit can increase to cover the additional costs without breaching the benefit cap limit.
Table 28: Impact of different social rent policies on the South West economy over ten years
Source: Capital Economics
Over the longer term, social rent policy has different implications for the supply of social housing and government finances.
The combination of rents and benefits in the South West results in a position where switching tenants from private to social housing is almost equivalent to the corresponding increase in the welfare bill. This means that the changes in government finances resulting from changes in social rent policies are relatively small.
Purely in financial terms, the government would still be best served by setting social rents as low as possible in the South West. However, in this case housing association margins are hit to the extent that they would need to sell off some of their existing stock forcing people out of social housing and into private rented accommodation. This is not a sustainable policy; to keep social housing stock at least at its current levels over the next 50 years would require real social rent growth of around 1.4 per cent.
In order to increase the supply of social housing to accommodate all of those currently claiming housing benefit in the private rented sector (a proxy for ‘housing need’), the optimal policy would be an annual increase in social rents of 1.8 per cent above inflation; this could deliver sufficient
CPI +0% CPI +1% CPI +2% CPI +3%Real growth in disposable incomes (annual average percentage) 0.5% 0.5% 0.5% 0.5%Number of social houses built through surplus (annual average) 222 330 441 555 Number of social houses built through borrowing (annual average) 854 1,065 1,612 4,818 Total number of social houses built (annual average) 1,076 1,395 2,054 5,373 Number of claimants in social housing (thousands, 2026) 217 221 233 262Number of claimants in private housing (thousands, 2026) 143 139 127 98Total in-year spend on welfare (£ billion, 2026) 5.5 5.6 5.6 5.7of which for social tenants 3.1 3.2 3.5 4.0of which for tenants in the private sector 2.4 2.3 2.1 1.7Government grant spending for house-building (£ billion, 2026) 0.1 0.1 0.1 0.1Total government spend (£ billion, 2026) 5.7 5.7 5.8 5.8
P45 | SETTING SOCIAL RENT
supply to provide a social home for 125,000 households currently in the private sector, while accounting for new household formations.
Overall, the optimal social rent policy for the South West would be somewhere between 1.4 to 1.8 per cent above inflation annually.
Table 29: Impact of different social rent policies on the South West economy over fifty years
Source: Capital Economics
CPI +0% CPI +1% CPI +2% CPI +3%Real growth in disposable incomes (annual average percentage) 0.7% 0.7% 0.7% 0.7%Number of social houses built through surplus (annual average) - 130 2,028 4,304 Number of social houses built through borrowing (annual average) 622 869 4,252 7,427 Total number of social houses built (annual average) 622 999 6,280 11,730 Number of claimants in social housing (thousands, 2066) 171 257 432 432Number of claimants in private housing (thousands, 2066) 261 176 0 0Total in-year spend on welfare (£ billion, 2066) 20.8 20.1 20.7 26.0of which for social tenants 5.4 9.8 20.7 26.0of which for tenants in the private sector 15.4 10.3 0.0 0.0Government grant spending for house-building (£ billion, 2066) 0.3 0.3 0.3 0.3Total in-year government spend (£ billion, 2066) 21.1 20.4 21.0 26.3Total cumulative government spend (£ billion, 2016-2066) 519 521 531 594