Al-Yasi et al. Iraqi Journal of Science, 2016, Vol. 57, No.1C, pp: 678-692 ________________________ *Email: [email protected]678 Setting-up a 3D Integrated Petrophysical Model Using Petrel software for Mishrif Formation in Garraf Oil Field, Southern Iraq Ameen I. Al-Yasi 1 , Mustafa A. Jaed 1 , Firas N. Hasan 2 1 Department of Geology, College of Science, University of Baghdad, Baghdad, Iraq 2 Geology Department, Fields division, Midland Oil Company, Baghdad, Iraq Abstract: Setting-up a 3D geological model both from field and subsurface data is a typical task in geological studies involving natural resource evaluation and hazard assessment. In this study a 3D geological model for Mishrif Formation in Garraf oil field has been set-up using Petrel software. Mishrif Formation represents the most important reservoir in Garraf oil field. Four vertical oil wells (GA-4, GA-A1P, GA-3 and GA-5) and one directional well (GA-B8P) were selected in Garraf Oil Field in order to set-up structural and petrophysical (porosity and water saturation) models represented by a 3D static geological model in three dimensions. Structural model shows that Garraf oil field represents a domal structure that shows continuous growth as indicated by the structural maps at top of reservoir units. The structural closure is shifted from GA-3 well to GA-A1P well. Mishrif Formation was divided into ten zones (top Mishrif, M1, M1.2, M2, L1, L1.2, L2, L2.2, L2.3 and L2.4.). Petrophysical model (porosity and water saturation) for Mishrif Formation was set- up from values of porosity and water saturation using Sequential Gaussian Simulation algorithm. According to data analyses and the results from modeling the units (M1.2, L1 and L1.2) are considered as high quality reservoir units due to the high PHIE and low water saturation. Units (L2, L2.2, L2.3 and L2.4) are considered as poor reservoirs because of low PHIE and high water saturation, and non-reservoir units include (Top Mishrif, M1 and M2) therefore, they represent cap units. Cross sections of petrophysical model were conducted to illustrate the vertical and horizontal distribution of porosity and water saturation between wells in the field. Keywords: Mishrif Formation, Garraf oil field, petrophysical Properties, Petrel software. بناء موديلائي بتروفيزي متكاملبتريلمج الم برناستخدابعاد با ثي ا ث الغراف في حقل لتكوين المشرف النفطي، اق جنوب العر اهيم أمين ابراسي الي1 ، مصطفى عبدالحسين جاعد1 * ، اظم حسن اس ن فر2 1 قسم علمرض، ا كليةعلوم، ال جامعة بغداد، بغداد، اق العر2 حقول،، هيئة اللجيولوجيا قسم ا شركة نفط الوسط، بغداد، اق العر الصة خ يعدمعلوماتد من البعاثي اولوجي ث الجيموديلء ال بناحت ت الحقلية سطحية والة فيساسي مهمة انة تقييم الجيولوجية المتضمسات ا الدر الموارد الطبيعية وتحديد الخطورةبحث بناء موديل . يتضمن هذا البعاد لتكوينثي اولوجي ث جي النفطي ب اف الغر في حقل المشرفلحاسوبيبتريل امج الم برناستخدا ا. يمثل تكوين المشرف المكمن اف الغرة في حقلكثر أهمي ا النفطي. اسةضمنت الدر تة آبار عموديةختيار أربع احد مائلذلك بئر وا وك لغرض بناءائي البتروفيزيموديل ال)لتشبع بالماءمية والمساا( متمث بمودي لولوجي جيISSN: 0067-2904 GIF: 0.851
Transcript
Al-Yasi et al. Iraqi Journal of Science, 2016, Vol. 57, No.1C, pp: 678-692
Setting-up a 3D Integrated Petrophysical Model Using Petrel software for
Mishrif Formation in Garraf Oil Field, Southern Iraq
Ameen I. Al-Yasi 1, Mustafa A. Jaed
1, Firas N. Hasan
2
1Department of Geology, College of Science, University of Baghdad, Baghdad, Iraq 2Geology Department, Fields division, Midland Oil Company, Baghdad, Iraq
Abstract: Setting-up a 3D geological model both from field and subsurface data is a typical
task in geological studies involving natural resource evaluation and hazard
assessment. In this study a 3D geological model for Mishrif Formation in Garraf oil
field has been set-up using Petrel software. Mishrif Formation represents the most
important reservoir in Garraf oil field. Four vertical oil wells (GA-4, GA-A1P, GA-3
and GA-5) and one directional well (GA-B8P) were selected in Garraf Oil Field in
order to set-up structural and petrophysical (porosity and water saturation) models
represented by a 3D static geological model in three dimensions. Structural model
shows that Garraf oil field represents a domal structure that shows continuous
growth as indicated by the structural maps at top of reservoir units. The structural closure is shifted from GA-3 well to GA-A1P well. Mishrif Formation was divided
into ten zones (top Mishrif, M1, M1.2, M2, L1, L1.2, L2, L2.2, L2.3 and L2.4.).
Petrophysical model (porosity and water saturation) for Mishrif Formation was set-
up from values of porosity and water saturation using Sequential Gaussian
Simulation algorithm. According to data analyses and the results from modeling the
units (M1.2, L1 and L1.2) are considered as high quality reservoir units due to the
high PHIE and low water saturation. Units (L2, L2.2, L2.3 and L2.4) are considered
as poor reservoirs because of low PHIE and high water saturation, and non-reservoir
units include (Top Mishrif, M1 and M2) therefore, they represent cap units. Cross
sections of petrophysical model were conducted to illustrate the vertical and
horizontal distribution of porosity and water saturation between wells in the field.
لتكوين المشرف في حقل الغراف ثالثي االبعاد باستخدام برنامج البتريل متكامل بتروفيزيائي بناء موديل جنوب العراق النفطي،
2فراس ناظم حسن ،*1جاعد عبدالحسينمصطفى ،1الياسيأمين ابراهيم العراق بغداد، بغداد،جامعة العلوم،كلية االرض،قسم علم 1
العراق شركة نفط الوسط، بغداد،قسم الجيولوجيا، هيئة الحقول، 2
خالصةالمهمة اساسية في سطحية والحقليةالتحت بناء الموديل الجيولوجي ثالثي االبعاد من المعلومات يعد
. يتضمن هذا البحث بناء موديل الخطورةالطبيعية وتحديد المواردالدراسات الجيولوجية المتضمنة تقييم يمثل .استخدام برنامج البتريل الحاسوبيالمشرف في حقل الغراف النفطي بجيولوجي ثالثي االبعاد لتكوين
اختيار أربعة آبار عمودية تضمنت الدراسة. النفطي األكثر أهمية في حقل الغراف المكمنتكوين المشرف جيولوجي لبمودي متمثال)المسامية والتشبع بالماء( الموديل البتروفيزيائيبناء لغرضوكذلك بئر واحد مائل
ISSN: 0067-2904 GIF: 0.851
Al-Yasi et al. Iraqi Journal of Science, 2016, Vol. 57, No.1C, pp: 678-692
679
. ازيح االنغالق التركيبي من بئر ًاقبوي ًاحقل الغراف يمثل تركيبان الموديل التركيبي اظهر اإلبعاد الثالثة.بGA-3 الى بئرGA-A1P.تم بناء الموديل المكمني بصورة اساسية باالعتماد على الخواص البتروفيزيائية .
،Top Mishrif، M1، M1.2، M2، L1تقسيم تكوين المشرف الى الوحدات االتية: ) تمفي هذه الدراسة L1.2، L2، L2.2، L2.3، L2.4 ) موديل. تم بناء مختلفةكل من هذه الوحدات بصفات مكمنية وتمتاز
لتحليل المحاكاة. وفقا ب خاصةباستخدام خوارزمية المائيالمسامية والتشبع قيم المشرف منلتكوين بتروفيزيائي( ذات مواصفات مكمنية عالية نظرا الى المسامية M1.2 ،L1 ،L1.2اعتبرت الوحدات )البيانات والنتائج
اعتبرت فقد ( L2، L2.2، L2.3، L2.4الوحدات )اما الفعالة العالية التي تمتلكها والتشبع المائي الواطئ. ،Top Mishrif، M1) العالي. الوحدات الالمكمنية تشمللمسامية الفعالة الواطئة والتشبع المائي ل نتيجةفقيرة (M2 عموديالتوزيع اللتوضيح البتروفيزيائي للموديلالمقاطع العرضية اعدت .لذا فهي تمثل وحدات غطائية
بين اآلبار في الحقل. المائيلمسامية والتشبع لواألفقي
Introduction: A large number of reservoir models can be quickly created with relatively geostatistical tools, such
as Petrel modeling software, one of the most popular modeling software in oil industry, but often, a
limited number must be selected for input to flow simulation because of computational time requirements [1]. 3D model is the process of developing a mathematical representation of any three-
dimensional surface of object (either inanimate of living) via specialized software. The product is
called a 3D model [2]. In general, a model is representation of some object or event in the real world.
A model is good if it adequately describes the property or some properties of the real world that is relevant to the study. For example, a 3D geological model of an area is good if it gives back the values
of the real world in reservoir simulations and reservoir modeling. According to the definition above,
for various purposes different models will provide the best results. A geological model is a special representation of the distribution of sediments and rocks in the subsurface. The model is traditional
presented by 2D cross-section, but increasingly visualized as digital 3D models [3].
The aim of this study is to set-up a 3D geological model for five wells of Mishrif Formation in
Garraf oil field. Mishrif Formation belongs to (Cenomanian- Early Turonian). Four vertical wells (GA-4, GA-A1P, GA-3 and GA-5) and one directional well (GA-B8P) were drilled in Garraf Oil Field
have been selected. The 3D geological model includes structural modes (structural maps) and well
correlations have been also constructed and the petrophysical properties (porosity and water saturation) have been distributed in the model as well.
Study area:
The study area covers Garraf Oil Field, which is located in Dhi Qar Governorate, approximately 265 Km. southeast of Baghdad city and 85 km. north of Nasiriya city. Garraf Oil Field is a NS
trending anticline with an area of 24 km. length and 5km. width [4], see Figures-1 and -2.
Figure 1- Map of Iraq showing location of the study
area (GIS, 2015).
Figure 2- Structure contour map of top Mishrif in
Garraf oil field.
Al-Yasi et al. Iraqi Journal of Science, 2016, Vol. 57, No.1C, pp: 678-692
680
Methodology:
Petrel software 2013 has been used to set-up a 3D model. Petrel is a PC- based workflow
application for subsurface interpretation and modeling [5]. Data preparation is the basic for geologic model. On this basic of software demand and research area characteristics, the data prepare for this
3D-geological model are well heads, well tops, well logs and depth maps. The input data are imported
from files- on file for each data object. These data include: 1. Well head: includes the position of each well in 3-dimentions, and the measured depth along the
path.
2. Well tops: markers represent significant points (well picks) along the well path, normally a change in stratigraphy.
3. Well logs: the data cover effective porosity and water saturation values along the well path.
4. Depth maps: structural contour maps obtained from seismic acquisition.
Model Design Workflow: The main steps of building a static model of a petroleum reservoir using Petrel software are:
Data import.
Input data editing and quality check (Q.C).
Well correlation.
Structural modeling, which includes: a. Pillar gridding, b. Make horizons, c. Layering.
Property modeling, which includes: a. Scale up, b. Petrophysical modeling.
Quality Check
In any modeling study, the input data need to be pre-processed to make it suitable for building the model. Similarly, results may require post-processing prior to mapping and reporting. Processing
includes: editing, removing or adding data, as well as logical, mathematical and object related
operations. Therefore, it is important to check the statistics whenever any processing operation has been performed, and it is necessary to compare always those statistics before and after the operation to
check if the results seem logical or not.
Well correlation:
Well correlation concept may shed light on the distribution of petrophysical properties (i.e., changes in porosity and water saturation), extents and thickness of different units in Mishrif reservoir
[6]. Accurate correlation can almost be viewed as an art or craft hence there can often be much
argument and dispute over the results. Well correlation in Petrel allows the possibility to bring up multiple wells in a well section, create marker picks and bring up new wells to compare with already
correlated wells [5]. Figure-3 illustrates the vertical and horizontal variations in thickness of Mishrif
units as well as the variations in petrophysical properties.
Mishrif Formation in Garraf oil field has been divided into three main parts, upper, middle & lower. The upper & middle parts are divided by marl units. The upper part from top of Mishrif to M1
unit. However, there is oil shows within this part it is not considered within reservoir zone, because it
is not producible. Middle & lower parts are reservoir units. They extend from M1 to top of Rumaila Formation. The Mishrif Formation (middle & lower) parts contain several reservoir units (M1.2, L1,
L1.2, L2, L2.2, L2.3 and L2.4) that have been sealed by two cap layers (M1 and M2).
Structural Modeling: Structural modeling represents building structural contour map for each unit in Mishrif Formation.
It is subdivided into three processes as follows: fault modeling, pillar gridding, and vertical layering.
All the three operations are performed one after the other to form one single data model [7]. Contour
maps can be made by computer from the surface information and correlated boreholes [8]. Figure-4 represents the 3D structural modeling for Mishrif Formation. This model reflects the steps of the
growth of domal structure of Garraf oil field.
Al-Yasi et al. Iraqi Journal of Science, 2016, Vol. 57, No.1C, pp: 678-692
681
Figure 3- Correlation section of Mishrif Formation in Garraf oil field.
3D Grid Construction: In simple terms, a 3D grid divides a model up into boxes each box is called a grid cell and will
have a single rock type, one value of porosity, one value of water saturation, etc. [5].
A 3D grid construction is the first step to build the 3D model. In simple terms, these are referred to as the cell's properties. This is a simplification of the true case, but allows us to generate a
representation of reality that can be used in calculations, etc. [9].
Pillar Gridding Pillar gridding is the process of generating the grid, which represents the base of all modeling. The
skeleton is a grid consisting of top, mid and base skeleton grids for Mishrif Formation in Garraf oil
field Figure-5.
Make Horizons: The next step in structural modeling is to insert the structural horizons into the pillar grid. It is a
step for building the vertical layering of the 3D grid in Petrel.
The contraction of horizons generates independent geological horizons from X, Y, and Z input data and it is used to generate additional horizons using relative distance to existing horizons [5]. Figure-6
shows horizons of Mishrif Formation in Garraf oil field.
Al-Yasi et al. Iraqi Journal of Science, 2016, Vol. 57, No.1C, pp: 678-692
682
Figure 4- Structural modeling of Mishrif Formation in Garraf oil field.
Figure 5- The skeletons of Mishrif Formation in Garraf oil field.
Top
Skeleton
Mid.
Skeleton
Base
Skeleton
Al-Yasi et al. Iraqi Journal of Science, 2016, Vol. 57, No.1C, pp: 678-692
683
Figure 6- Main Horizons of Mishrif Formation in Garraf oil field.
Layering: Layering is the final vertical subdivision of the framework. The layering will be part of the zone,
and will not have a direct filter like the zones do; layering however, is defined as the internal layering
reflecting the geological deposition of a specific zone [7].
Zones can be added to the model by introducing thickness data in the form of isochore maps, constant thickness, and percentages. Well tops can also be used to tie the top structures to the well
picks. Layers subdivide the grid between the zone- related horizons. Table-1 represents the layering of
Mishrif units Figure-7.
Scale up Well logs: The Scale up well logs process averages the values to the cells in the 3D grid that are penetrated by
the wells. Each cell gets one value per up scaled log. These cells are later used as a starting point for property modeling [7]. There are many statistical methods used to scale up such as the well logs
(arithmetic, harmonic, and geometric methods). The porosity and water saturation values in the current
model have been scaled up using the arithmetic and geometric method while in the facies have been
scaled up by using most of the methods. Figure-7 represents Scale up of PHIE and SW logs for well GA-4 in correlation window. Figure-8 represents Scale up of PHIE of Mishrif Formation in Garraf oil
field.
Table 1- Layering of Mishrif units
Units Number of layers
Top Mishrif & L1.2 20
M1 & M2 5
M1.2 12
L1 & L2 15
L2.2 & L2.3 & L2.4 10
Al-Yasi et al. Iraqi Journal of Science, 2016, Vol. 57, No.1C, pp: 678-692
684
Figure 7- The layering of Mishrif Formation in Garraf oil field.
Figure 8- Scale up of PHIE and SW logs for well GA-4.
Property Modeling Petrophysical property modeling is the process of assigning petrophysical property values
(porosity, water saturation) to each cell of the 3D grid.
Al-Yasi et al. Iraqi Journal of Science, 2016, Vol. 57, No.1C, pp: 678-692
685
The objective of property modeling is to distribute properties between the available wells so it
realistically preserves the reservoir heterogeneity and matches the well data; therefore, property
modeling is the process of filling the cells of the grid with discrete or continuous (Petrophysics)
properties [7]. The 3D property modeling is based on well logs data. This includes a calculation for solving complex mathematical equations involving one or several 3D property models; i.e. SW
transforms based on porosity 3D model [9].
The aim of a geological reservoir model is to provide a complete set of continuous reservoir parameters (i.e. porosity, and water saturation) for each cell of the grid. Many different techniques can
be used to generate these parameters [10].
Results and Discussion: The correlation of the wells in Garraf field shows that Mishrif zones extent all over the field except
M2, L1 and L1.2 zones. M2 zone that represents cap rock of L1 and L1.2 extends over the field from
GA-4 well in the southeast to the well GA-3 as well as L1.2 reservoir zone. While L1 reservoir zone
extends from GA-4 well in the southeast to well GA-B8P in the middle of the field. From porosity and water saturation models for each unit of Mishrif Formation, the following points
can be shown:
Top Mishrif Unit: The thickness of this unit is nearly similar. There are oil shows within this
unit but it is not considered within reservoir zone, because it is not producible. It shows low PHIE Figure-9 and water saturation Figure-10 average values that reach 9% and 93%, respectively.
M1.2 Reservoir Unit: The unit thickens towards GA-5 and GA-4 wells. Generally, this unit
shows good PHIE Figure-11 and water saturation Figure-12 average values that can reach 18%
and 43%, respectively. However, the reservoir quality decreases in the area between GA-5 and GA-3 as indicated by the higher water saturation and lower PHIE values.
L1 Reservoir Unit: The L1 reservoir unit pinches out towards GA-3 well. The direction of
thinning is associated with decreasing PHIE values and increasing water saturation. The average
PHIE Figure-13 is 12% and water saturation Figure-14 is 39%.
L1.2 Reservoir Unit: The L1.2 unit is characterized by high reservoir properties. This unit thins
towards GA-3 and GA-4 wells. In most wells, little changes in PHIE Figure-15 and water saturation Figure-16 have been observed. The average of PHIE is 26%, and water saturation
reaches 16%. Therefore, it represents the best reservoir unit in Garraf oil field.
L2 Reservoir Unit: The L2 unit has low reservoir quality. The L2 unit thickens towards GA-5
that has lowest reservoir properties. The average of PHIE Figure-17 is 14%, and water saturation Figure-18 reaches 58%.
The L2.2 unit: The L2.2 unit has low reservoir quality with 15% PHIE Figure-19 and 73% water
saturation Figure-20. Lowest reservoir properties occur in GA-3 and GA-B8P.
L2.3 Reservoir Unit: The L2.3 reservoir unit is the lower reservoir quality as indicated by the
values of PHIE and water saturation in GA-3 and GA-B8P wells. Other wells have higher reservoir quality. In general, the L2.3 unit has poor reservoir quality with 15% PHIE Figure-21,
and 88% water saturation Figure-22.
L2.4 Reservoir Unit: This unit is similar to L2.3 reservoir unit. The GA-4 and GA-A1P wells
have the lowest PHIE values. Other wells have higher values. However, L2.4 unit is considered
as a poor reservoir due to low average PHIE Figure-23 (13%) and high water saturation Figure-24 (100%).
Figures-25,-26 show the final porosity and water saturation models for Mishrif Formation in Garraf
oil field which are built from porosity and water saturation values using Sequential Gaussian Simulation algorithm as a statistical method after scale up of porosity and water saturation.
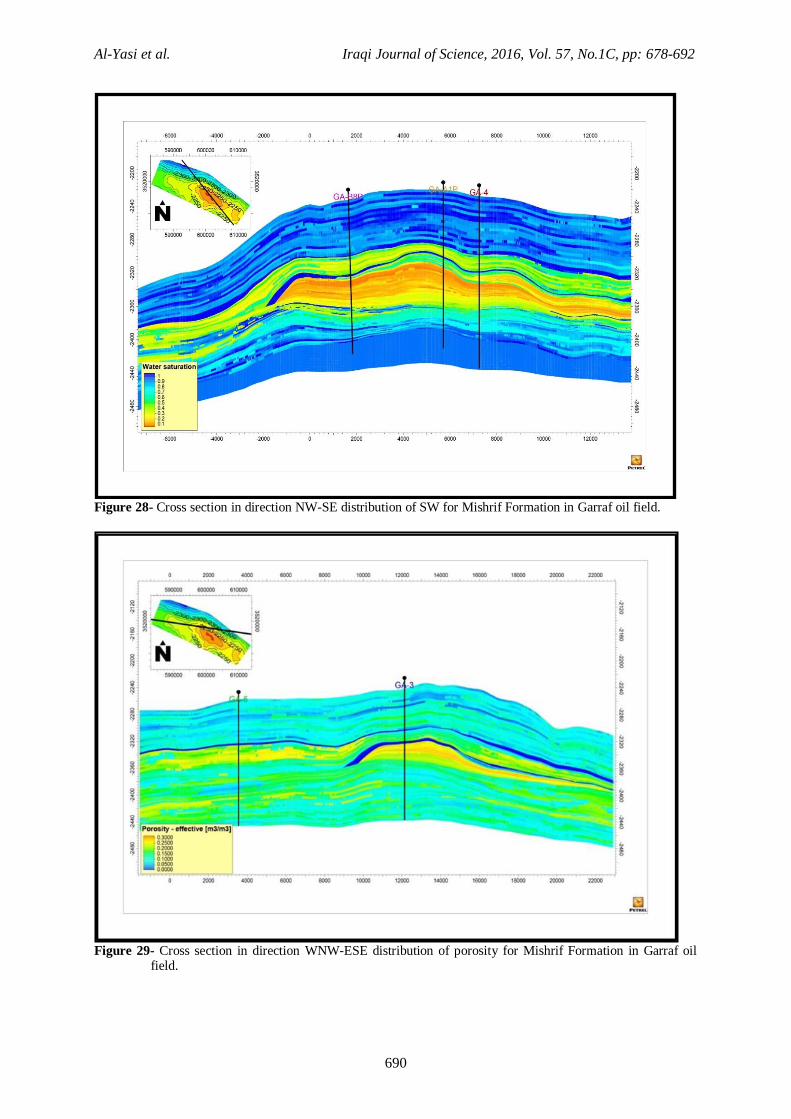
Finally, the cross sections in NW-SE and WNW-ESE directions for porosity and water saturation
models were set in order to illustrate the vertical and horizontal distribution of porosity and water
saturation in each well under study. Figures-27,-28, -29 and -30 show that the best location characterized by good reservoir properties is between well GA-4 and GA-3 especially in the units
M1.2 and L1.2 and they decrease gradually toward well GA-5 which become bad reservoir properties.
Al-Yasi et al. Iraqi Journal of Science, 2016, Vol. 57, No.1C, pp: 678-692
686
Figure 9-PHIE model for top Mishrif unit Figure 10- SW model for top Mishrif unit
Figure 11- PHIE model for M1.2 unit Figure 12- SW model for M1.2 unit
Figure 13- PHIE model for L1 unit Figure 14- SW model for L1 unit
Al-Yasi et al. Iraqi Journal of Science, 2016, Vol. 57, No.1C, pp: 678-692
687
Figure 15- PHIE model for L1.2 unit Figure 16- SW model for L1.2 unit
Figure 17- PHIE model for L2 unit Figure 18- SW model for L2 unit
Figure 19- PHIE model for L2.2 unit Figure 20- SW model for L2.2 unit
Al-Yasi et al. Iraqi Journal of Science, 2016, Vol. 57, No.1C, pp: 678-692
688
Figure 21- PHIE model for L2.3 unit Figure 22- SW model for L2.3 unit
Figure 23- PHIE model for L2.4unit Figure 24- SW model for L2.4 unit
Figure 25- Final porosity model for Mishrif Formation in Garraf oil field.
Al-Yasi et al. Iraqi Journal of Science, 2016, Vol. 57, No.1C, pp: 678-692
689
Figure 26- Final water saturation model for Mishrif Formation in Garraf oil field.
Figure 27- Cross section in direction NW-SE distribution of porosity for Mishrif Formation in Garraf oil field.
Al-Yasi et al. Iraqi Journal of Science, 2016, Vol. 57, No.1C, pp: 678-692
690
Figure 28- Cross section in direction NW-SE distribution of SW for Mishrif Formation in Garraf oil field.
Figure 29- Cross section in direction WNW-ESE distribution of porosity for Mishrif Formation in Garraf oil
field.
Al-Yasi et al. Iraqi Journal of Science, 2016, Vol. 57, No.1C, pp: 678-692
691
Figure 30- Cross section in direction WNW-ESE distribution of SW for Mishrif Formation in Garraf oil field.
Conclusions:
1. The structural model of Garraf Field constructed by using Petrel software showed that Garraf oil
field represents a domal structure as indicated by the structural maps at top of reservoir units. The structural closure is shifted from GA-3 well to GA-A1P well.
2. Horizons for Mishrif Formation are divided into 3 essential parts, as well as ten zones. Layers
were built for each zone depending on petrophysical properties.
3. Mishrif zones extent allover the field except M2, L1 and L1.2 zones. M2 zone that represent cap rock of L1 and L1.2 extends over the field from GA-4 well in the southeast to well GA-3 as well
as L1.2 reservoir zone. While the L1 reservoir zone extends from GA-4 well in the southeast to
well GA-B8P in the middle of the field. 4. Petrophysical model (porosity and water saturation) for Mishrif Formation in Garraf oil field was
built from porosity and water saturation values using Sequential Gaussian Simulation algorithm
as a statistical method after scale up of porosity and water saturation. The model includes top Mishrif, M1, M1.2, M2, L1, L1.2, L2, L2.2, L2.3 and L2.4. Each unit is characterized by different
reservoir properties. The units M1.2, L1 and L1.2 are considered as high quality reservoir units
due to the high PHIE and low water saturation values. Units L2, L2.2, L2.3 and L2.4 are
considered as poor reservoirs because of low PHIE and high water saturation, and non-reservoir units include Top Mishrif, M1 and M2 therefore, they represent cap units.
5. From cross sections for porosity and water saturation models which built in NW-SE and WNW-
ESE directions show that the best location characterized by good reservoir properties is between well GA-4 and GA-3 and these properties decrease gradually toward well GA-5.
References:
1. Caumon, G., Carlier de Veslud, C., Viseur, S. and Sausse, J. 2009. Surface-Based 3D Modeling of Geological Structures. Interpretation Association for Mathematical Geosciences, Math Geosci,
4, pp: 927-945.
2. Branets, L.V., Ghai, S.S., Lyons, S.L. and Xiao-Hui Wu, 2008. Challenges and technologies in
Reservoir Modeling. Communication in Computational Physics, 6(1), pp: 1-23. 3. Schlumberger. 2013. Petrel Geology and Modeling, Petrel Introduction Course, p:559.
4. Oil Exploration Company (O.E.C.). 1995. An Integrated Geological Evaluation Study of the
Gharraf Field, (in Arabic), Baghdad, Iraq, p:91. (unpublished report).
Al-Yasi et al. Iraqi Journal of Science, 2016, Vol. 57, No.1C, pp: 678-692
7. Schlumberger. 2010. Petrel introduction course. Schlumberger, pp:13-493. 8. Pack, S. 2000. Creating 3D models of lithology using 3D grids, Dynamic graphics INC.,
Alameda.
9. Schlumberger. 2007. Petrel Structural modeling course .Schlumberger, pp:105-123. 10. Bellorini, J. P., Casas J., Gilly P., Jannes, P., and Matthews P. 2003. Definition of a 3D Integrated
Geological Model in a complex and Extensive Heavy Oil Field, Oficina Formation, Faja de