TexasCoastGeology.com 1 Severe Beach Erosion at Surfside, Texas Caused by Engineering Modifications to the Coast and Rivers February, 2003 P.O. Box 1040 Port Aransas, TX 78373 (361) 749-4152 (253) 981-0412 fax
Transcript
TexasCoastGeology.com
1
Severe Beach Erosion at Surfside, TexasCaused by Engineering Modifications
to the Coast and Rivers
February, 2003
������������ �������
��� �������������� �P.O. Box 1040
Port Aransas, TX 78373(361) 749-4152 (253) 981-0412 fax
TexasCoastGeology.com
2
EXECUTIVE SUMMARY
It is well established that there is a severe and accelerating beach erosion problem at5Surfside, Texas. While a small part of the erosion may be due to natural causes, such asdecreased sand transport to the coast by rivers and global sea level rise, it is obvious, atthis location, most of the erosion is caused by man-made changes to the Brazos River andthe Freeport Harbor entrance channel. Diversion of the river 7 miles in the downdriftdirection has starved the Surfside and Quintana beaches of river sand. Numerous10upstream dams and reservoirs on the Brazos river have drastically reduced the amount ofsand the river now carries to the coast.
Construction of long jetties and a deep channel precludes sand transport in eitherdirection across the harbor entrance. In addition, sand moving southwest along the beach15at Surfside is carried out along the east jetty and deposited in the channel, where it isforever lost to the Surfside beach, unless it is placed back on the beach by a dredgeduring beach nourishment accompanying channel maintenance.
The Corps of Engineers and the Bureau of Economic Geology maintain that the lack of20an updrift fillet of sand and the recently accelerated erosion at surfside beach may be dueto wave amplification by the recently extended east jetty or sand inventory reduction bydredging of the channel. Since the jetty was extended in 1992 and the channel wasdeepened to 45 feet, the amount of sediment dredged annually from the outer bar channelhas nearly doubled.25
It has been nearly 75 years since the Brazos river was diverted to the south, and the oldBrazos delta has completely eroded away and no longer serves as a nearshore source forsand that waves can bring onshore to nourish the beach. There is, now, little sandoffshore, with only a thin veneer of sand over deltaic mud. Likewise, dunes in the30Surfside area are very small and store only a small volume of sand which can betransported offshore during storms to flatten the beach profile and reduce wave attack. Ifany of that sand is washed offshore onto the clay zone, it will not be transported back tothe beach.
35Finally, extraction of large amounts of ground water for the Freeport industries hascaused subsidence of the land surface at Surfside, resulting in at least one foot of relativesea level rise. Extrapolation of the rate of subsidence suggests the total is now two or 2.5ft. at Surfside, resulting in additional shoreline retreat.
40Distant man-made changes in the shoreline have drastically reduced the amount of sandwhich is available to be transported to the southwest along the coast. About 11 millioncu.yd. of sand has been lost inward through Rollover Pass since it was built in 1956 andmore than 30 million cu.yd. of sand have been caught and permanently stored east of thejetties at Bolivar Roads. A smaller amount of sand is stored in the fillet at East Beach,45Galveston in the wave shadow of the jetties.
TexasCoastGeology.com
3
The best solution to provide a beach at Surfside (and to stop further erosion) is to nourishthe beaches with beach quality sand from nearby sources. The problem is that there maynot be adequate nearby sources of sand. It appears that the only beach quality sand beingdredged from the channel is near station 0+00 at the end of the jetties. That is most likely5sand eroded from Surfside beaches and can be pumped back onto the beach by a pipelinedredge. If that part of the channel is maintained with hopper dredges, it is unlikely thesand can be placed back on the beach. There may also be a sand source in Oyster Creek,which used to flow to the coast, but now terminates in the Intracoastal Waterway. Thereare no surface sand deposits in the offshore area which are suitable for beach10nourishment. In a recent study, Texas A&M Galveston researchers found a buriedchannel below the Beaumont clay offshore from Surfside (Dellapenna, Allison, and Seitz,2002). It is likely a sand-filled channel and could possibly be a source of beach sand.However, exploitation of this sand resource would require deep dredging and wouldleave a deep hole offshore in which beach sand may be lost during storms.15
One of the greatest drawbacks of using seawalls and revetments such as at Galveston andat Sargent is they accelerate beach erosion in the downdrift direction. This should not bea concern if these structures are used at Surfside and Quintana because the beachesdowndrift of the Freeport jetties are receiving no sand from the updrift beaches at present20and the beaches downdrift of the new Brazos delta are being nourished by sand from thedelta and the Brazos River. There are few locations where armoring the shoreline wouldcause less downdrift damage that such structures at Surfside and Quintana.
There is no other location on the coast which is subject to such a complete collection of25man-made causes of beach erosion. Of the possible man-induced causes of beacherosion: river diversion, reduced sand output by a nearby river, jetty construction,maintenance of a deep channel, land subsidence due to water or oil extraction, andblockage of updrift sand sources, all are present at Surfside. In addition, Surfside islocated on an eroding delta which is composed largely of mud with little in the way of30nearshore sand sources.
The severe beach erosion at both Surfside and Quintana is almost entirely due to man-made changes in the Brazos River and the coastline. Only man-made changes in the formof beach nourishment and/or armoring the shoreline with a sea wall or revetment will35stop the erosion.
TexasCoastGeology.com
4
INTRODUCTION
Most of the Texas coast has been undergoing erosion during the past 100 years, with theexception of Central Padre Island, beaches protected by jetties, and the new Brazos River5delta. Prior to the development of deep inlets with long jetties, necessary for commercialtraffic, and damming the rivers that flowed to the Gulf for flood control and water supplyduring the 20th century, much of the Texas coast was stable or accreting and beacherosion was not a problem.
10Development of navigation inlets with long jetties has compartmentalized the coast andrestricted longshore sediment transport along the coast, confining it to cells betweenmajor jettied inlets. Huge amounts of sand are trapped and stored in fillets adjacent to theupdrift jetties and sometimes adjacent to long downdrift jetties. Sand is also lost inwardto flood tidal deltas and jetted offshore by ebb currents to depths where waves cannot15return the sand to the beach. Additional sand is lost by dredge material disposal inlocations where the sand cannot return to the longshore transport system of the beach.Since the longshore sediment transport of system of the Texas Coast carries sand westand south along the coast to a convergence at Central Padre Island (Watson, 1971), sandmoving southwest along the Bolivar Peninsula is now trapped at the east Galveston jetty20and can no longer nourish beaches on Galveston Island and Follets Island.
Damming the Sabine River andthe Brazos River has alsoreduced sand supply to the upper25Texas coast by trapping sand inthe reservoirs, and reducing peakflows which could carry sandsized material to the coast. Thelower Texas coast is even more30severely starved for sandbecause the flow in the RioGrande River has been soreduced by reservoirs foragricultural and municipal use,35that the entrance has recentlybeen closed by a bar leavingzero flow into the Gulf. On thelower coast longshore sedimenttransport is north to the40convergence area on CentralPadre Island (Watson, 1971).
In addition, rising sea level due to both natural and manmade causes further retreat of thebeaches along the Texas coast.45
Figure 1. Brazos River to Surfside(Map by Delorme Topo-USA)
TexasCoastGeology.com
5
The beach at Surfside Texas (Fig. 1), has been suffering accelerating beach erosion inrecent years due to all of these factors and some additional significant manmade changesspecifically affecting the Surfside area. The Surfside area may be unique in that it issubject to ALL of the manmade and natural causes of beach retreat operating on theTexas coast. These include: diverting the Brazos River to a location 6.5 miles south of its5original outlet, lengthening, widening and deepening the Freeport Ship Channel in 1992,and groundwater withdrawal by Freeport industry which has caused several feet ofsubsidence, and thus relative sea level rise at Surfside, resulting in considerable shorelineretreat. Prior to the diversion of the Brazos River mouth from the location of the FreeportHarbor Entrance to a location 6.5 miles to the south in 1929, Surfside was located on a10stable river delta. Now, the delta is building at the new location, and the old delta haseroded away, leaving no sand supply for Surfside or the beaches at Quintana or BryanBeach. The Freeport Harbor Entrance was widened, and lengthened in 1992, whichresulted in doubling the dredge maintenance volume and rapidly increasing erosion of thebeach at Surfside.15
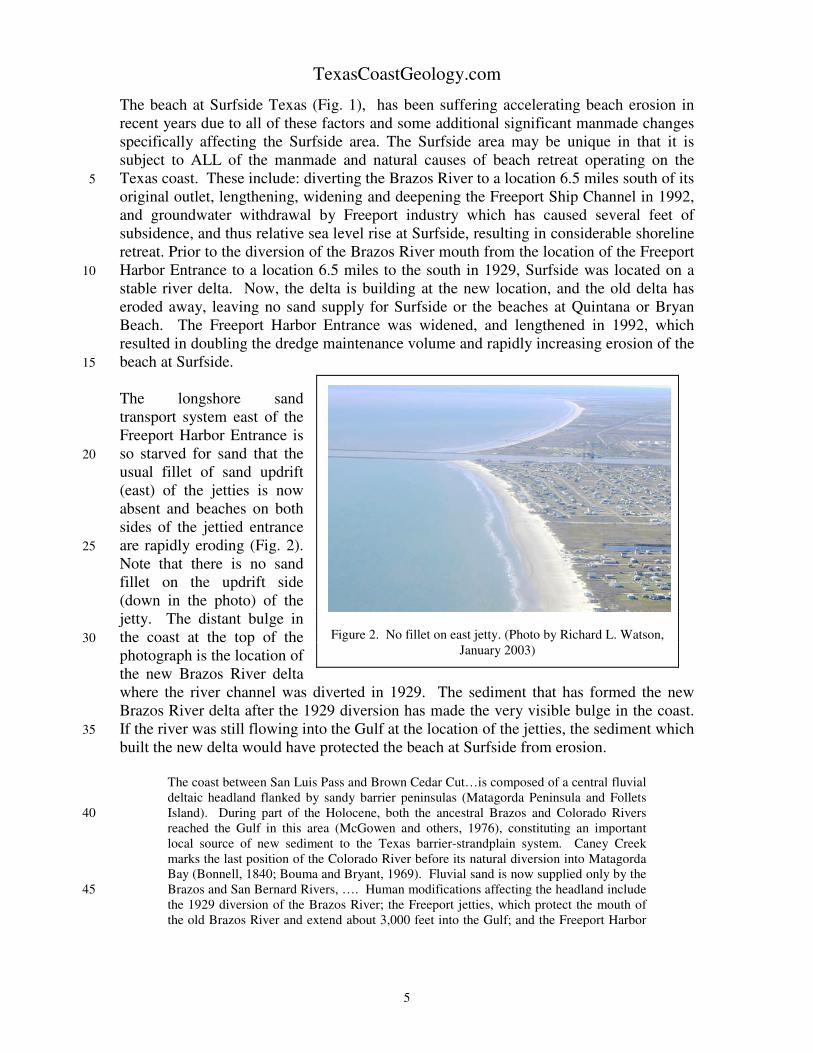
The longshore sandtransport system east of theFreeport Harbor Entrance isso starved for sand that the20usual fillet of sand updrift(east) of the jetties is nowabsent and beaches on bothsides of the jettied entranceare rapidly eroding (Fig. 2).25Note that there is no sandfillet on the updrift side(down in the photo) of thejetty. The distant bulge inthe coast at the top of the30photograph is the location ofthe new Brazos River deltawhere the river channel was diverted in 1929. The sediment that has formed the newBrazos River delta after the 1929 diversion has made the very visible bulge in the coast.If the river was still flowing into the Gulf at the location of the jetties, the sediment which35built the new delta would have protected the beach at Surfside from erosion.
The coast between San Luis Pass and Brown Cedar Cut…is composed of a central fluvialdeltaic headland flanked by sandy barrier peninsulas (Matagorda Peninsula and FolletsIsland). During part of the Holocene, both the ancestral Brazos and Colorado Rivers40reached the Gulf in this area (McGowen and others, 1976), constituting an importantlocal source of new sediment to the Texas barrier-strandplain system. Caney Creekmarks the last position of the Colorado River before its natural diversion into MatagordaBay (Bonnell, 1840; Bouma and Bryant, 1969). Fluvial sand is now supplied only by theBrazos and San Bernard Rivers, …. Human modifications affecting the headland include45the 1929 diversion of the Brazos River; the Freeport jetties, which protect the mouth ofthe old Brazos River and extend about 3,000 feet into the Gulf; and the Freeport Harbor
Figure 2. No fillet on east jetty. (Photo by Richard L. Watson,January 2003)
TexasCoastGeology.com
6
Channel, dredged to a depth of 36 ft (U.S. Army Corps of Engineers, 1986). The channeland jetties both trap longshore sediment (Paine and Morton, 1989).
TexasCoastGeology.com
7
COASTAL PROCESSES
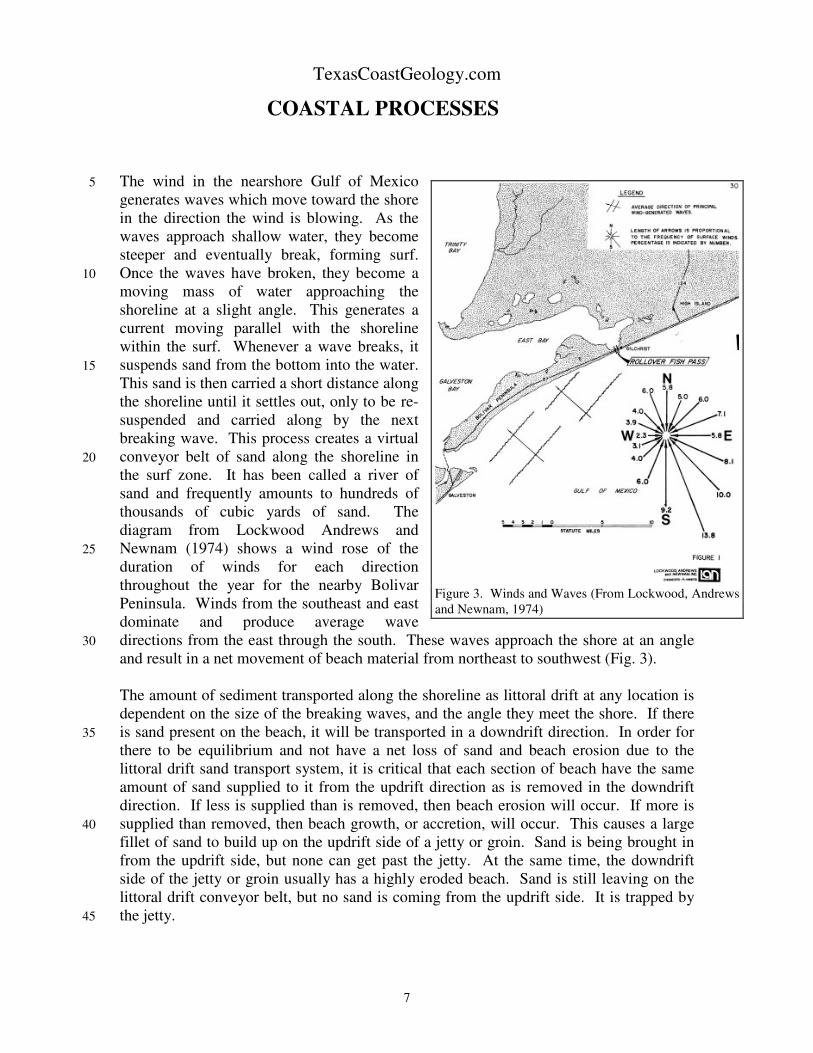
The wind in the nearshore Gulf of Mexico5generates waves which move toward the shorein the direction the wind is blowing. As thewaves approach shallow water, they becomesteeper and eventually break, forming surf.Once the waves have broken, they become a10moving mass of water approaching theshoreline at a slight angle. This generates acurrent moving parallel with the shorelinewithin the surf. Whenever a wave breaks, itsuspends sand from the bottom into the water.15This sand is then carried a short distance alongthe shoreline until it settles out, only to be re-suspended and carried along by the nextbreaking wave. This process creates a virtualconveyor belt of sand along the shoreline in20the surf zone. It has been called a river ofsand and frequently amounts to hundreds ofthousands of cubic yards of sand. Thediagram from Lockwood Andrews andNewnam (1974) shows a wind rose of the25duration of winds for each directionthroughout the year for the nearby BolivarPeninsula. Winds from the southeast and eastdominate and produce average wavedirections from the east through the south. These waves approach the shore at an angle30and result in a net movement of beach material from northeast to southwest (Fig. 3).
The amount of sediment transported along the shoreline as littoral drift at any location isdependent on the size of the breaking waves, and the angle they meet the shore. If thereis sand present on the beach, it will be transported in a downdrift direction. In order for35there to be equilibrium and not have a net loss of sand and beach erosion due to thelittoral drift sand transport system, it is critical that each section of beach have the sameamount of sand supplied to it from the updrift direction as is removed in the downdriftdirection. If less is supplied than is removed, then beach erosion will occur. If more issupplied than removed, then beach growth, or accretion, will occur. This causes a large40fillet of sand to build up on the updrift side of a jetty or groin. Sand is being brought infrom the updrift side, but none can get past the jetty. At the same time, the downdriftside of the jetty or groin usually has a highly eroded beach. Sand is still leaving on thelittoral drift conveyor belt, but no sand is coming from the updrift side. It is trapped bythe jetty.45
Figure 3. Winds and Waves (From Lockwood, Andrewsand Newnam, 1974)
TexasCoastGeology.com
8
Inlets also produce beach erosion by starving the downdrift beaches of sand. Sand flowsin through the inlet and is deposited in the bay. The beaches, downdrift of the inlet, arestarved by the amount of sand that flows in through the inlet.
5In addition to washing sand into the baysand forming a flood tidal delta in thebay, the ebb jet washes material offshoreand forms an ebb tidal delta as well (Fig.4). The sand in the ebb and flood tidaldeltas is no longer available for transportdown the beaches.
Tropical storms and hurricanes causeboth permanent and temporary loss ofbeach sand. During a storm, the upperbeach and dunes are eroded and much ofthat sand is carried offshore into anearshore bar system. With the return ofcalm waves after the storm, that materialis carried back up onto the beach over aperiod of many months and sometimes
years. Once the sand is deposited on the beach by waves, the wind will blow it inland tothe first vegetation and a dune ridge will form. This is important, because the sand in thatdune ridge will be carried Gulfward to the bar system in the next large storm. This cyclerepeats with every storm. In some cases, if there is no dune ridge and the barrier island orpeninsula is very low, a considerable amount of sand is carried inland and deposited asflats on the bay side of the barrier.
If there is no dune ridge storing sand between storms, and sand is carried inland, orfurther offshore out of reach of the gentle waves which can carry it back onshore, there ispermanent beach erosion. The sand body in the vicinity of Surfside is very thin and isunderlain by clay. When storms attack a clay shore, all of the clay is carried permanently10away in suspension. It is not deposited just offshore in the bar system to be carried backonshore with the return of gentle waves.
Figure 4. Ebb and Flood deltas (From Bales andHolley, 1984)
TexasCoastGeology.com
9
History of Brazos River Mouth and Freeport Entrance
Table 1 presents the chronology of Federal improvements at the Freeport HarborEntrance. The first major change affecting erosion of the beach at Surfside was the5diversion of the BrazosRiver to a location 6.5miles south of theoriginal location at thejetty entrance. The outer10bar channel wasdeepened to 38 feet in1961 and 47 feet in 1990.In 1992, a major projectmoved the north jetty15640 feet to the northeast,increasing the distancebetween the jetties to1,200 feet. Finally, thejetty channel was20deepened to 45 feet in1992. The north jettywas also extended 500feet into the Gulf in1993.25
Prior to channelmodification (in1992), the averagedredging cycle for30the entrance atFreeport was 1.2years to remove 1.2 million cubic yards of material. Maintenance dredging of theFreeport Outer Bar and Jetty Channels has been performed by hopper dredge and thematerial placed in an offshore disposal area located southwest of the Outer Bar Channel.35An average shoaling rate of 960,000 cubic yards per year was calculated for this channel.…. Historical records showing grain size of the material removed from the channelindicate a very low percentage of sand at all stations from 1957 through 1976, generallyless than 20%. Samples taken in December 1976 had sand percentages ranging from 0%to 50% with the exception of one sample showing 71% sand at station 0+00 (the end of40the jetties). Samples taken in the channel from 1983 to 1989 between stations -100+000to 50+000 show the sand content to range from 3% to 52%. From this data it wasconcluded that dredged material from the Freeport Outer Bar and Jetty Channels isnot considered suitable for placement on beaches. (U.S. Army Engineer District,Galveston, Tx. August, 1992, p. 19).45
The lower 5 miles of the Brazos River is known as the Brazos River Diversion Channel.It was completed in 1929 by the Federal Government in an effort to divert the sediment-laden waters of the Brazos River away from the deep-draft navigation facilities located atFreeport along the lower portion of the river. This was accomplished by damming the50
Table 1. Chronology of Federal Improvements at FreeportChannel. (From U.S. Army Engineer District, Galveston, Tx.,August 1992., p. 18.)
TexasCoastGeology.com
10
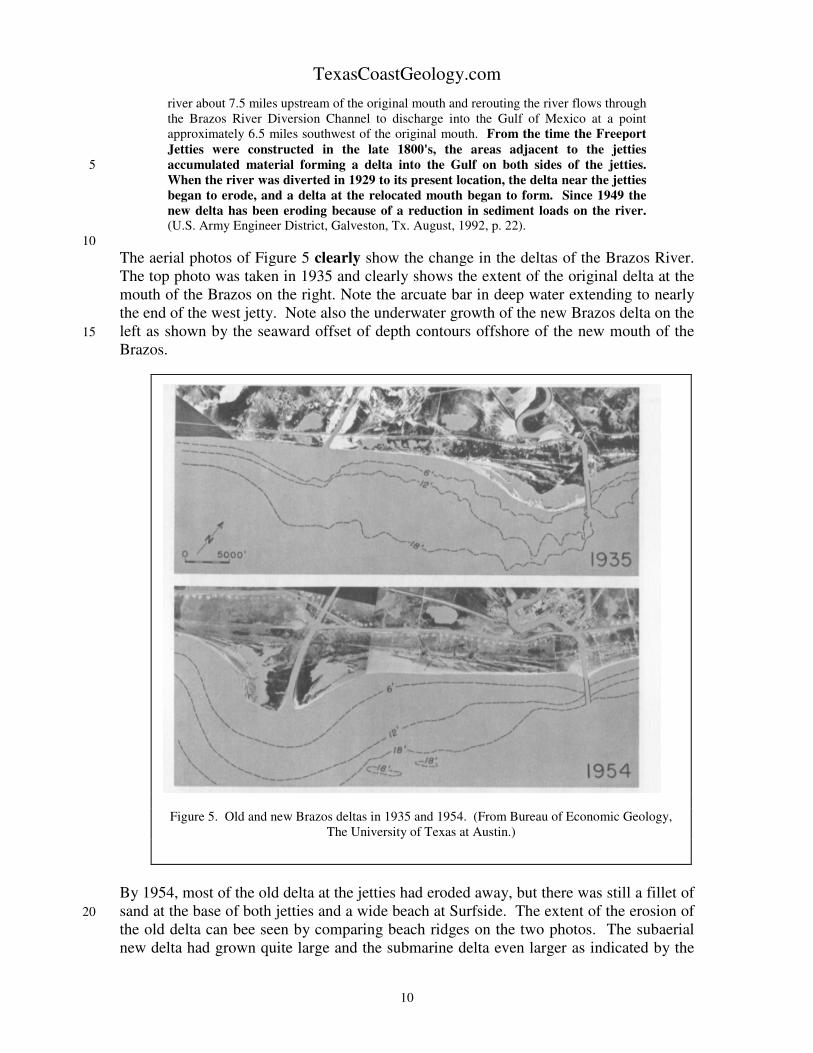
river about 7.5 miles upstream of the original mouth and rerouting the river flows throughthe Brazos River Diversion Channel to discharge into the Gulf of Mexico at a pointapproximately 6.5 miles southwest of the original mouth. From the time the FreeportJetties were constructed in the late 1800's, the areas adjacent to the jettiesaccumulated material forming a delta into the Gulf on both sides of the jetties.5When the river was diverted in 1929 to its present location, the delta near the jettiesbegan to erode, and a delta at the relocated mouth began to form. Since 1949 thenew delta has been eroding because of a reduction in sediment loads on the river.(U.S. Army Engineer District, Galveston, Tx. August, 1992, p. 22).
10The aerial photos of Figure 5 clearly show the change in the deltas of the Brazos River.The top photo was taken in 1935 and clearly shows the extent of the original delta at themouth of the Brazos on the right. Note the arcuate bar in deep water extending to nearlythe end of the west jetty. Note also the underwater growth of the new Brazos delta on theleft as shown by the seaward offset of depth contours offshore of the new mouth of the15Brazos.
By 1954, most of the old delta at the jetties had eroded away, but there was still a fillet ofsand at the base of both jetties and a wide beach at Surfside. The extent of the erosion of20the old delta can bee seen by comparing beach ridges on the two photos. The subaerialnew delta had grown quite large and the submarine delta even larger as indicated by the
Figure 5. Old and new Brazos deltas in 1935 and 1954. (From Bureau of Economic Geology,The University of Texas at Austin.)
TexasCoastGeology.com
11
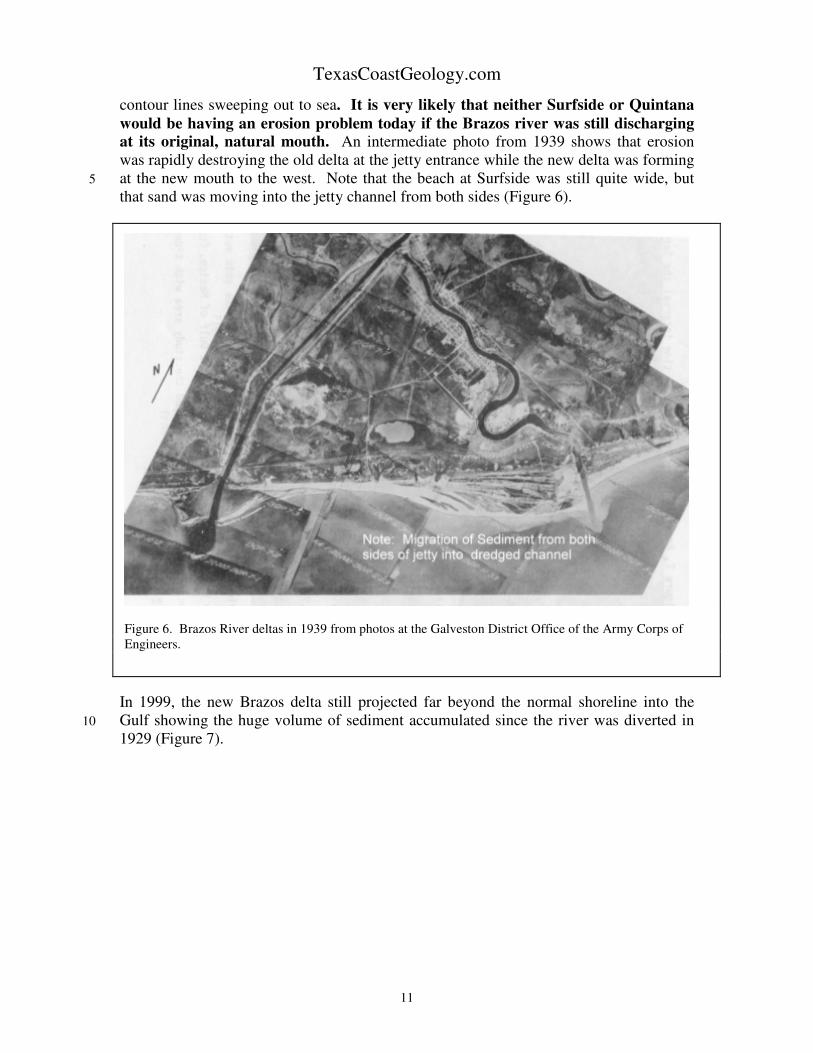
contour lines sweeping out to sea. It is very likely that neither Surfside or Quintanawould be having an erosion problem today if the Brazos river was still dischargingat its original, natural mouth. An intermediate photo from 1939 shows that erosionwas rapidly destroying the old delta at the jetty entrance while the new delta was formingat the new mouth to the west. Note that the beach at Surfside was still quite wide, but5that sand was moving into the jetty channel from both sides (Figure 6).
In 1999, the new Brazos delta still projected far beyond the normal shoreline into theGulf showing the huge volume of sediment accumulated since the river was diverted in101929 (Figure 7).
Figure 6. Brazos River deltas in 1939 from photos at the Galveston District Office of the Army Corps ofEngineers.
TexasCoastGeology.com
12
The following graph (Figure 8) was created from dredging data provided by the U. S.Army Engineer District in Galveston. This data is for the outer bar channel from the endof the jetties to the seaward limit of the channel. Note that the average annual dredgemaintenance nearly doubled from about 1 million cubic yards per year to 1.9 million5cubic yards per year when the channel was deepened, widened and extended in 1992.This long, wide and deep channel is a total barrier to sediment moving along the coast ineither direction.
Figure 7. New Brazos River delta in 1999. The river in the foreground is theSan Bernard River. The Freeport Harbor Entrance is at the top left of the photo(photo by Richard L. Watson, 1999).
TexasCoastGeology.com
13
Figure 8. Freeport Outer Bar Channel Maintenance Dredging
Any sand from the Surfside beaches swept to the southwest by the longshore sedimenttransport system and carried seaward when it intercepts the east jetty will sweep aroundthe end of the jetty and be permanently lost to the Surfside beaches into the channel. The5Corps determined that the highest concentration of sand in its dredged material was fromstation 0+00 which is at the end of the east jetty (U.S. Army Engineer District, Galveston,Texas. August 1992, p. 19).. This is likely sand eroded from the Surfside beach. TheCorps concludes that of all of the jettied inlets on the Texas coast, only two have such ahigh ratio of clay-silt to sand that the material is unsuitable for beach nourishment. They10are the Sabine Neches and Freeport. So, while sand from the beaches is being lost intothe channel at the jetty mouth, it is mixed with too much clay and silt to be usable for thebeaches except at the end of the jetties near station 0+00.
15
20
25
TexasCoastGeology.com
14
UPSTREAM CHANGES IN BRAZOS RIVER
The Brazos River is one of only three major rivers carrying beach grade sand directly tothe Gulf beaches in recent time. The other two are the Rio Grande River and the Sabine5River. For a short time from about 1926 to 1992, the Colorado River also flowed directlyto the Gulf beaches, but it was diverted into East Matagorda Bay in 1992. The dischargeof water by all of these rivers has been significantly reduced by construction of upstreamreservoirs for water supply and flood control. A side effect has been very significantreduction of beach grade sand delivered to the Gulf Beaches of Texas. This shortage of10sand supply by the major rivers of Texas is a major factor in the present erosion of Texasbeaches.
Major dam and reservoir development within the Brazos River Basin is correlative with asignificant decrease in the suspended sediment load of the river and with increased15coastal erosion rates near the delta (Figure 9). A hydrologic analysis of the riverdischarge, by use of cumulative frequency curves, shows that discharge control by damregulation has reduced the frequency of high discharges, thus smoothing out the riverhydrograph and reducing the amount of sediment the river is able to carry and deliver tothe coastal zone. In addition, the reservoirs are presently trapping about 76% of all sand20produced within the basin. An analysis of bed load samples taken downstream of thedams indicates that the sand sizes necessary for beach nourishment are not beingtransported through the lower reaches of the river. The amount of sand denied to thecoastal zone through the loss of the river’s transporting ability and reservoirentrapment has been determined, and is shown to be enough to account for the25entire increase in the coastal erosion rates in the study area since at least 1937(Mathewson and Minter, 1976, p. ii).
Figure 9. Historical suspended sediment discharge at Richmond.Heavy solid line is least squares fit. Dashed line is the approximate30cumulative storage value of major reservoirs upstream of Richmondthrough time. (Mathewson and Minter, 1976, p. 5).
…After 1948, the new Brazos delta began to be eroded. By 1952, the old delta (at thelocation of the Freeport Harbor Entrance) had approximated its 1852 shoreline and was35
TexasCoastGeology.com
15
no longer supplying sediment to the new delta. Because the new delta was eroding andcoastal erosion rates continued to increase, the sand loss must have resulted from adecreased sand supply from the Brazos River…..The history of major water resourcedevelopment within the Brazos River Basin began with the completion of Mineral wellsReservoir on Rock Creek in 1920. Twenty-eight additional reservoirs with storage5capacity in excess of 5,000 acre-feet were completed by 1972….. Regulation of flow forflood control of the Brazos River began with the completion of Possum KingdomReservoir in 1941 (Mathewson and Minter, 1976, p14).
The peak discharge flow of the Brazos river decreased 52% at Waco, 46% at Bryan and1030% at Richmond due to construction of reservoirs by 1942 (Mathewson & Minter, 1976,p. 37).
Seelig and Sorensen (1973) have used Welborn’s chart to estimate the historic annual bedload and sand discharge at Richmond. …. Their data indicate an average annual15reduction of 35% in the bed load discharge at Richmond since 1941 (Mathewson andMinter, 1976, p40).
In addition to reduction of bed load sand discharge due to reduced maximum river flows,large amounts of sand are trapped and permanently stored in the reservoir basins.20Mathewson and Minter, p. 60, estimate that 1.9 million cubic yards of sand is trappedannually in Possum Kingdom Reservoir, 540,000 cu.yd. in Whitney-GranburyReservoirs, 200,000 cubic feet in Waco, 350,000 cu.yd. at Belton, 70,000 cu.yd. atSomerville, and 1.1 million total for the remaining 23 major reservoirs. This amounts toa total of 4.1 million cu.yd. of sand trapped every year in the reservoirs of the Brazos25River. Mathewson and Minter estimate that an additional 1.3 million cu.yd. of sand istrapped in the 714 smaller reservoirs and an estimated 125,000 farm ponds. Constructionof the flood control and water supply reservoirs on the Brazos River has reduced the sandavailable that could be transported to the beach by over 5 million cubic yards per year.For the period 1930-70, Mathewson and Minter (p. 72) estimate that 1,616 million cubic30feet of sand have been denied access to the coast. That amounts to a loss of 60 millioncu. yd. for the entire time period, or an average loss of 1.5 million cu.yd. per year .
The increase in the rate of beach erosion along the Texas coastline supplied by sedimentsfrom the Brazos River can be related to increased water resource development within the35Brazos River Basin. The major changes to the river system brought about by reservoirconstruction are a change in the hydrology of the river and a reduction in the amount ofsand available to be delivered to the coastal zone.
The frequency of occurrence of high discharges and a reduction in the peak flood40discharges at gauging stations below the Whitney Dam have greatly reduced theBrazos River’s ability to transport large quantities of sand downstream. Control ofriver discharge by dams is less effective at greater distances downstream, and as aresult, much of the sand is left in the upstream portion of the channel. Even thoughthe river farther downstream has the potential of carrying a larger sand load, the45sand is not available to be transported.
Of the 195.4 million cubic feet (7.2 million cubic yards) produced annually within gheBrazos River Basin, approximately 76% is trapped within the reservoirs and other smallerponds within the basin. Although all of the sand trapped would not reach the coast were50it allowed to naturally pass through the system, the reduction in the amount of sandavailable for transport has obvious implications. Calculations of the amount of sand
TexasCoastGeology.com
16
denied access to the coast since major water resource development was initiated showsthat it is sufficient to account for the entire increase in coastal erosion since at least 1937(Mathewson and Minter, 1976, p78).. {Note RLW, this applies to erosion from the newBrazos delta through the Sargent area.}
5In a study of the effects of changes in the Brazos River on erosion at Sargent Beach,Seelig and Sorenson (1973) estimated that the amount of sand carried to the coast afterconstruction of upstream reservoirs was reduced by two-thirds.
TexasCoastGeology.com
17
EROSION AT SURFSIDE
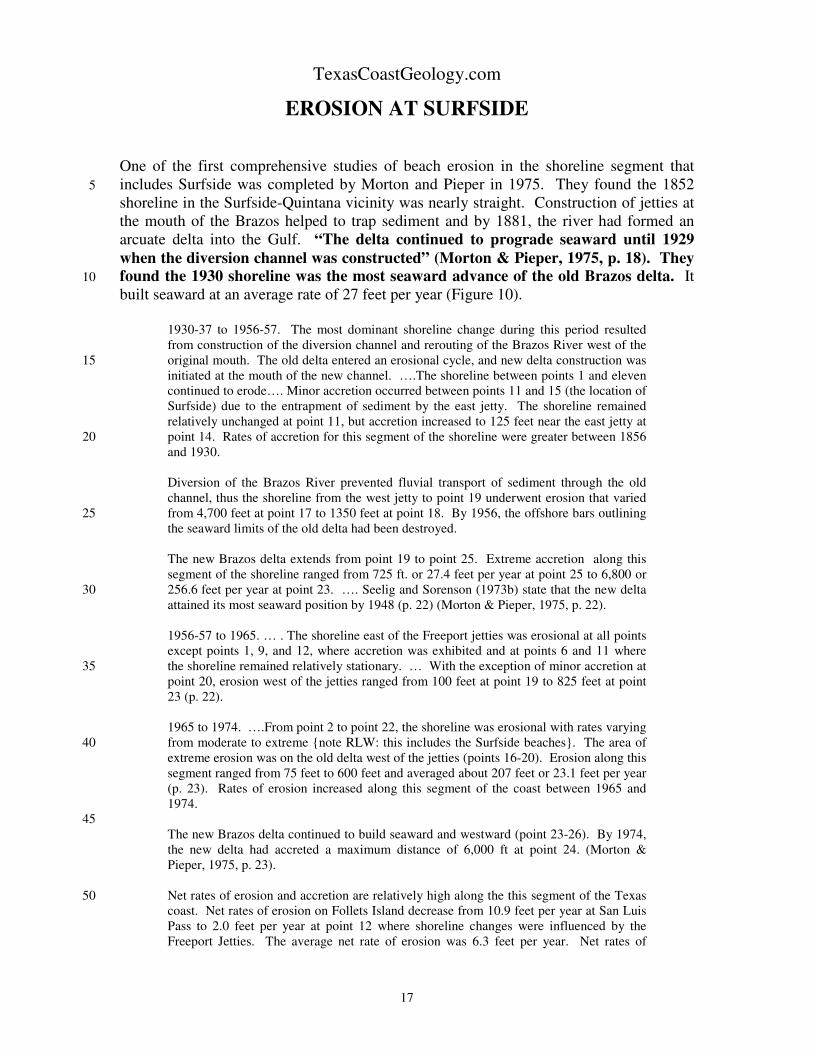
One of the first comprehensive studies of beach erosion in the shoreline segment thatincludes Surfside was completed by Morton and Pieper in 1975. They found the 18525shoreline in the Surfside-Quintana vicinity was nearly straight. Construction of jetties atthe mouth of the Brazos helped to trap sediment and by 1881, the river had formed anarcuate delta into the Gulf. “The delta continued to prograde seaward until 1929when the diversion channel was constructed” (Morton & Pieper, 1975, p. 18). Theyfound the 1930 shoreline was the most seaward advance of the old Brazos delta. It10built seaward at an average rate of 27 feet per year (Figure 10).
1930-37 to 1956-57. The most dominant shoreline change during this period resultedfrom construction of the diversion channel and rerouting of the Brazos River west of theoriginal mouth. The old delta entered an erosional cycle, and new delta construction was15initiated at the mouth of the new channel. ….The shoreline between points 1 and elevencontinued to erode…. Minor accretion occurred between points 11 and 15 (the location ofSurfside) due to the entrapment of sediment by the east jetty. The shoreline remainedrelatively unchanged at point 11, but accretion increased to 125 feet near the east jetty atpoint 14. Rates of accretion for this segment of the shoreline were greater between 185620and 1930.
Diversion of the Brazos River prevented fluvial transport of sediment through the oldchannel, thus the shoreline from the west jetty to point 19 underwent erosion that variedfrom 4,700 feet at point 17 to 1350 feet at point 18. By 1956, the offshore bars outlining25the seaward limits of the old delta had been destroyed.
The new Brazos delta extends from point 19 to point 25. Extreme accretion along thissegment of the shoreline ranged from 725 ft. or 27.4 feet per year at point 25 to 6,800 or256.6 feet per year at point 23. …. Seelig and Sorenson (1973b) state that the new delta30attained its most seaward position by 1948 (p. 22) (Morton & Pieper, 1975, p. 22).
1956-57 to 1965. … . The shoreline east of the Freeport jetties was erosional at all pointsexcept points 1, 9, and 12, where accretion was exhibited and at points 6 and 11 wherethe shoreline remained relatively stationary. … With the exception of minor accretion at35point 20, erosion west of the jetties ranged from 100 feet at point 19 to 825 feet at point23 (p. 22).
1965 to 1974. ….From point 2 to point 22, the shoreline was erosional with rates varyingfrom moderate to extreme {note RLW: this includes the Surfside beaches}. The area of40extreme erosion was on the old delta west of the jetties (points 16-20). Erosion along thissegment ranged from 75 feet to 600 feet and averaged about 207 feet or 23.1 feet per year(p. 23). Rates of erosion increased along this segment of the coast between 1965 and1974.
45The new Brazos delta continued to build seaward and westward (point 23-26). By 1974,the new delta had accreted a maximum distance of 6,000 ft at point 24. (Morton &Pieper, 1975, p. 23).
Net rates of erosion and accretion are relatively high along the this segment of the Texas50coast. Net rates of erosion on Follets Island decrease from 10.9 feet per year at San LuisPass to 2.0 feet per year at point 12 where shoreline changes were influenced by theFreeport Jetties. The average net rate of erosion was 6.3 feet per year. Net rates of
TexasCoastGeology.com
18
accretion recorded from points 13 to 25 ranged from 2.7 feet per year immediately east ofthe jetties at point 13 to 49.6 feet per year on the new Brazos delta at point 23. Theaverage net rate of accretion was 10 feet per year (Morton & Pieper, 1975, p. 25).
Figure 10. Location map of points of measurement, beach profiles and hurricane landfall(Morton and Pieper, 1975, p. 20)
TexasCoastGeology.com
19
Between 1974 and 1982, the shoreline was relatively stable for much of Follets Islandbetween San Luis Pass and the Freeport jetties, while erosion between the jetties and thenew Brazos River mouth was severe (Figure 11).
Shorelines along the headland were relatively stable northeast of the Freeport jetties5(stations 11 to 15) between 1974 and 1982. Three of the five monitoring sites along thissegment showed no detectable shoreline change, and the other two recorded minimalrates of retreat (1.6 to 3.4 ft/yr.). In contrast, most of the shoreline between the Freeportjetties (old Brazos River) and the new Brazos River retreated at relatively high rates (3.1to 19.5 ft/yr at stations 16 to 24 between 1974 and 1982) (Paine and Morton, 1989)10(Figure 12).
Figure 11. Shoreline and vegetation-line changes between San Luis Pass and Brown Cedar Cut, 1974-1982(From Paine and Morton, 1989, p. 21).
Figure 12. Shoreline and vegetation-line changes between San Luis Pass and Brown Cedar Cut, 1974-1982(From Paine and Morton, 1989, p. 20).
TexasCoastGeology.com
20
In 1981 Mason studied 5 Texas inlets for the Army Corps of Engineers. He found damconstruction on the Brazos River in the 1940’s reduced river flows and significantlyreduced sediment transport to the coast. He noted this caused recession of the newBrazos delta.5
The major change in the bathymetry offshore of Freeport entrance between 1946 and1966 was a general deepening of the entire area (Seelig and Sorenson, 1973). ….
Within the survey limits on the east side of the entrance, a loss of 3.3 million cubic yards10occurred between 1966 and 1975, mostly in a zone centered about 4,000 feet east of thejetties (Figure 13). Some material accumulated in a localized area between this erosionzone and the jetties, and about 4,000 feet offshore. These zones of deposition and erosionwere formed primarily between 1970 and 1975. Within the scour zone, the 12 and 20foot contours moved inshore. This erosion may have contributed to the current increased15shoreline recession rates east of the jetties by allowing larger waves to reach theforeshore, particularly at the apex of the zone where recent MSL retreat rates have beenabout 33 feet per year. However, subsidence is also a possible contributing factor.
20
On the west side of the entrance, an accretion zone occurred between 1966 and 1975 inthe same relative position with respect to the jetties as on the east side: 4,000 feetoffshore and 4,000 feet west of the jetties. However, a net erosion of 2.1 million cubicyards occurred between 1966 and 1975. Along the offshore limits of the control area,25extensive erosion occurred between 1966 and 1970, with some accretion immediatelyadjacent to the west jetty (Mason, 1981).
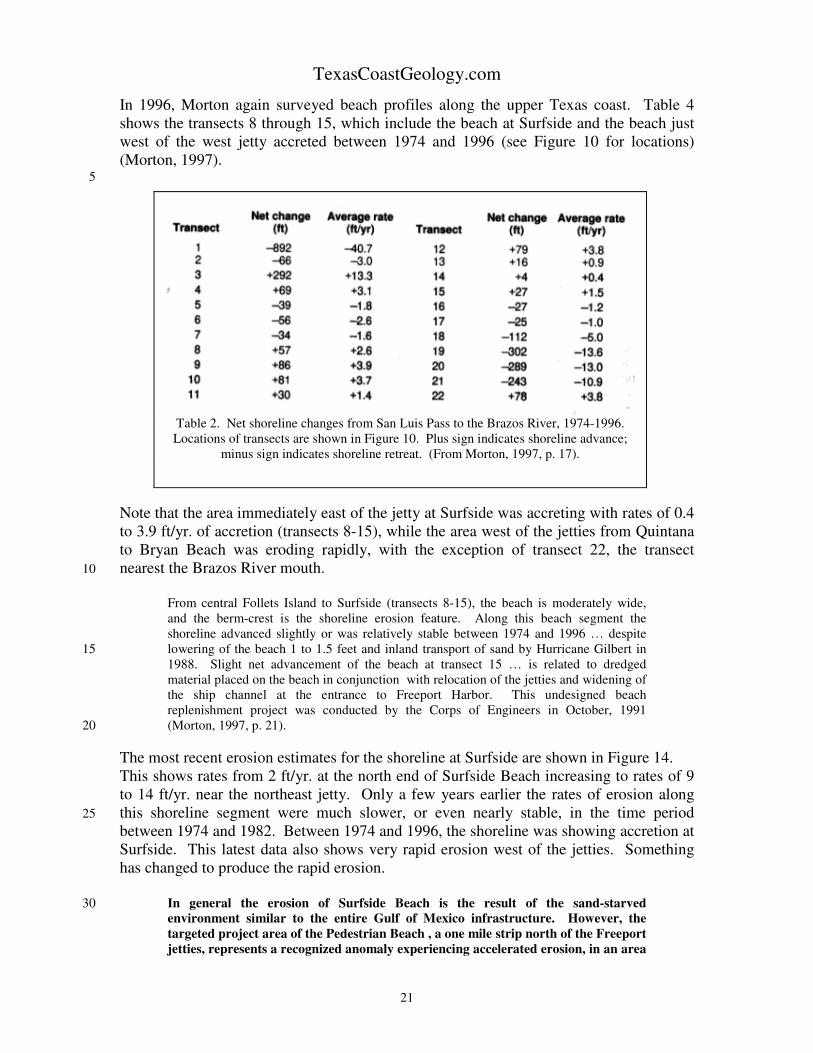
In 1996, Morton again surveyed beach profiles along the upper Texas coast. Table 4shows the transects 8 through 15, which include the beach at Surfside and the beach justwest of the west jetty accreted between 1974 and 1996 (see Figure 10 for locations)(Morton, 1997).
5
Note that the area immediately east of the jetty at Surfside was accreting with rates of 0.4to 3.9 ft/yr. of accretion (transects 8-15), while the area west of the jetties from Quintanato Bryan Beach was eroding rapidly, with the exception of transect 22, the transectnearest the Brazos River mouth.10
From central Follets Island to Surfside (transects 8-15), the beach is moderately wide,and the berm-crest is the shoreline erosion feature. Along this beach segment theshoreline advanced slightly or was relatively stable between 1974 and 1996 … despitelowering of the beach 1 to 1.5 feet and inland transport of sand by Hurricane Gilbert in151988. Slight net advancement of the beach at transect 15 … is related to dredgedmaterial placed on the beach in conjunction with relocation of the jetties and widening ofthe ship channel at the entrance to Freeport Harbor. This undesigned beachreplenishment project was conducted by the Corps of Engineers in October, 1991(Morton, 1997, p. 21).20
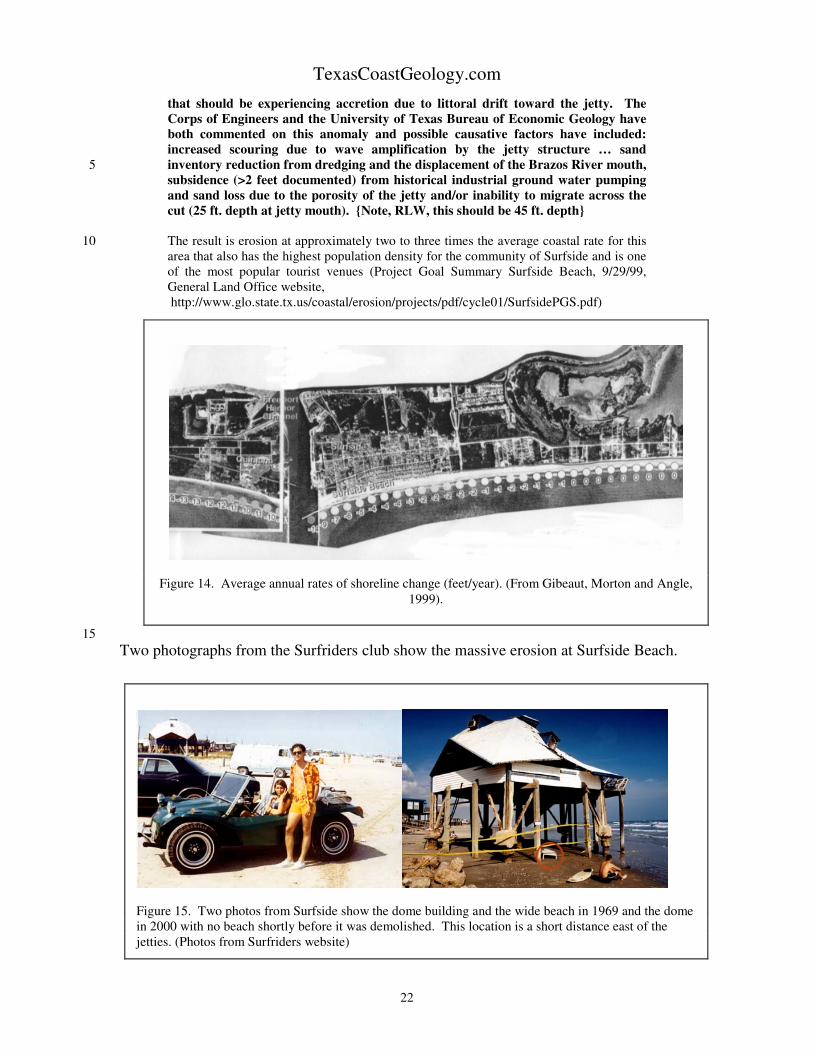
The most recent erosion estimates for the shoreline at Surfside are shown in Figure 14.This shows rates from 2 ft/yr. at the north end of Surfside Beach increasing to rates of 9to 14 ft/yr. near the northeast jetty. Only a few years earlier the rates of erosion alongthis shoreline segment were much slower, or even nearly stable, in the time period25between 1974 and 1982. Between 1974 and 1996, the shoreline was showing accretion atSurfside. This latest data also shows very rapid erosion west of the jetties. Somethinghas changed to produce the rapid erosion.
In general the erosion of Surfside Beach is the result of the sand-starved30environment similar to the entire Gulf of Mexico infrastructure. However, thetargeted project area of the Pedestrian Beach , a one mile strip north of the Freeportjetties, represents a recognized anomaly experiencing accelerated erosion, in an area
Table 2. Net shoreline changes from San Luis Pass to the Brazos River, 1974-1996.Locations of transects are shown in Figure 10. Plus sign indicates shoreline advance;
minus sign indicates shoreline retreat. (From Morton, 1997, p. 17).
TexasCoastGeology.com
22
that should be experiencing accretion due to littoral drift toward the jetty. TheCorps of Engineers and the University of Texas Bureau of Economic Geology haveboth commented on this anomaly and possible causative factors have included:increased scouring due to wave amplification by the jetty structure … sandinventory reduction from dredging and the displacement of the Brazos River mouth,5subsidence (>2 feet documented) from historical industrial ground water pumpingand sand loss due to the porosity of the jetty and/or inability to migrate across thecut (25 ft. depth at jetty mouth). {Note, RLW, this should be 45 ft. depth}
The result is erosion at approximately two to three times the average coastal rate for this10area that also has the highest population density for the community of Surfside and is oneof the most popular tourist venues (Project Goal Summary Surfside Beach, 9/29/99,General Land Office website, http://www.glo.state.tx.us/coastal/erosion/projects/pdf/cycle01/SurfsidePGS.pdf)
15Two photographs from the Surfriders club show the massive erosion at Surfside Beach.
Figure 14. Average annual rates of shoreline change (feet/year). (From Gibeaut, Morton and Angle,1999).
Figure 15. Two photos from Surfside show the dome building and the wide beach in 1969 and the domein 2000 with no beach shortly before it was demolished. This location is a short distance east of thejetties. (Photos from Surfriders website)
TexasCoastGeology.com
23
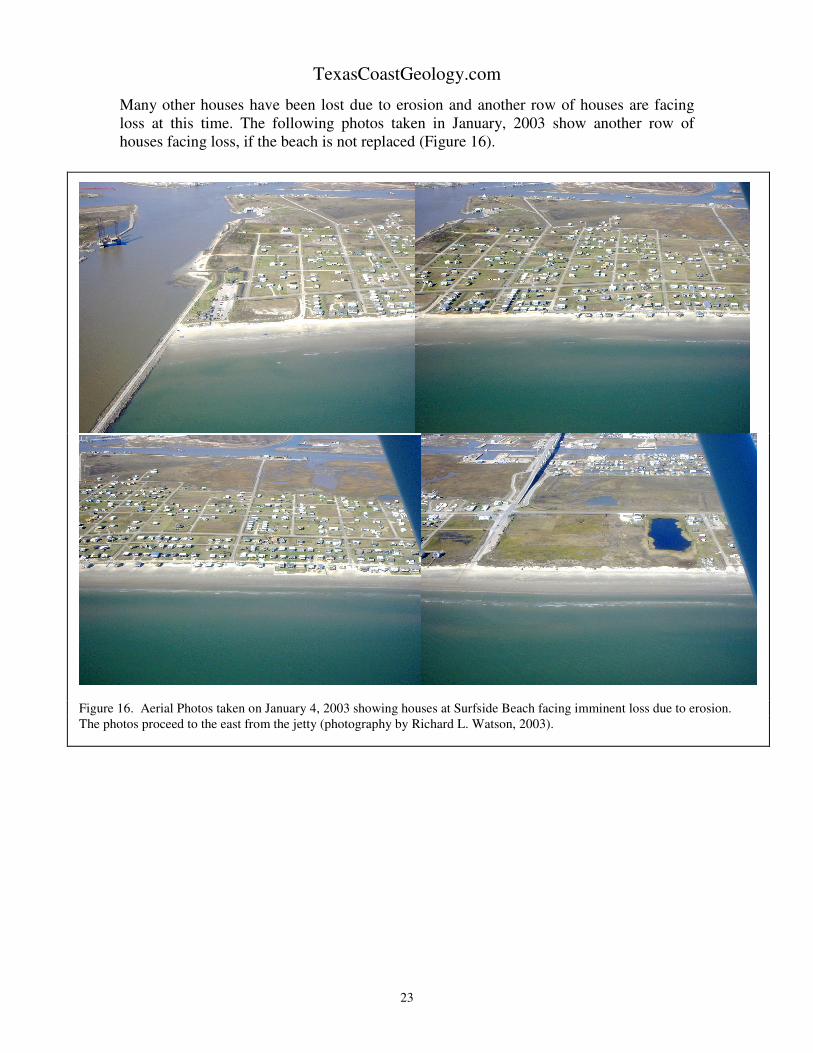
Many other houses have been lost due to erosion and another row of houses are facingloss at this time. The following photos taken in January, 2003 show another row ofhouses facing loss, if the beach is not replaced (Figure 16).
Figure 16. Aerial Photos taken on January 4, 2003 showing houses at Surfside Beach facing imminent loss due to erosion.The photos proceed to the east from the jetty (photography by Richard L. Watson, 2003).
TexasCoastGeology.com
24
CAUSES OF SEVERE BEACH EROSIONAT SURFSIDE
Most of the Texas Gulf coast beaches are undergoing erosion. Some of the fastest ratesof erosion are on deltaic headlands such as the Colorado River - San Bernard River -5Brazos River headland. This includes Surfside Beach on the eastern margin of theheadland. Natural erosion may be due to reduced sand supply on the nearshore shelf thatcan be transported to the beaches by wave action, naturally reduced sand supply from themajor rivers which reach the Gulf Beaches due to reduced rainfall in the past severalthousand years, and slowly rising sea level. However, these natural causes of beach10erosion are dwarfed by man-made changes in the rivers and the longshore sedimenttransport system along much of the coast. “On the Texas coast nearly half of the totalbeach sand supplied by updrift erosion, presently a major sediment source, has beentrapped by jetties at harbor entrances. This impoundment of sand at impermeable barrierstogether with reduced sediment influx from damming of rivers suggest that15anthropogenic augmentation of natural shoreline erosion will likely increase from local toregional effects” (Morton, 1979, p 1101).
At Surfside, man-made changes are causing extremely high rates of erosion. “Thestrongest indictments against human-induced shoreline changes are the unpredictable but20rapid local responses attendant with engineering modifications. For example, maximumsustained rates of accretion (+75 m/yr.) and erosion (-55m/yr) documented for the Texascoast were associated with jetty construction and subsequent channel diversion at themouth of the Brazos River (Morton and Pieper, 1975)” (Morton, 1979, p. 1108).
25Nearly 36 million cubic meters of sand and mud were deposited near the jetties between1855-57 and 1937. Maximum net deposition, however, was probably greater becauseerosion was coincident with river diversion eight years prior to the hydrographic survey.For the same reason, net erosion of 42 million cubic meters between 1937 and 1974 …may underestimate total erosion since river diversion. Net bathymetric changes between301855-57 and 1974 are erosional with nearly equal volumes from updrift and downdrifterosion. ... Total net losses amount to about 5.35 million cubic meters. The latest trend,however, is erosional and recent rates of shoreline erosion, have been extremely high,especially east of the jetties (Morton, 1977a, p. 280.)
35After the jetties were constructed in the1890s, the shoreline built seaward asmuch as 6,000 feet in a 40-year span.But in 1929 the Brazos River mouth wasdiverted westward about 6 miles where40it now empties into the Gulf. The reasonthis story is important to the homedweller in this area is that diverting theriver cut off an important supply ofbeach sand and caused very rapid45erosion at Surfside and Quintana on theorder of 10 to 15 feet per year (Morton,et al., 1983, p. 71) Fig. 17 . Figure 17. Beach house eroding at Surfside in the
early 1980s. (From Morton, et al., 1983, p. 76)
TexasCoastGeology.com
25
Both global sea-level rise and local relative sea-level rise due to natural sedimentcompaction and man-made subsidence from withdrawal of ground water have causedsome of the shoreline retreat at Surfside.
During the 20th century along the upper Texas coast, the rate of relative sea-level rise has5been 0.022 ft/yr (about 1 foot in 46 years) as measured by the Pier 21 tide gauge onGalveston Island (fig. 18). This rise is caused by compaction of sediments causing alowering of the sand surface …. and by a raising of the global ocean surface caused bymelting glaciers and thermal expansion of sea water. The upper Texas coast has arelatively high rate of relative sea-level rise compared to other Gulf of Mexico locations10because of the high rate of land subsidence (Gibeaut, White, and Tremblay, 2000, p. 4).
Figure 18. Monthly average sea level since 1909 as measured by Pier 21 tide gauge in Galveston.Straight line is a linear regression through all the data points (From Gibeaut, White, and Tremblay,2000, p. 4).
TexasCoastGeology.com
26
In the past, there was sufficient sand available for the beaches to build up and keep pacewith rising sea levels; however, this is no longer true for most of the Texas beaches. Thissituation is particularly critical in areas such as Surfside and the Brazos-Colorado deltaicheadland in general, where the beaches and peninsulas are only a thin veneer of sand overmud and the offshore bottom is mostly mud.5
In the Houston, Texas City and Freeport areas there has been significant land subsidencedue to subsurface extraction of groundwater and/or petroleum by deep wells. Figure 19shows subsidence of about 2 ft. in the Freeport area and about 1 ft. at surfside. Groundwater extraction has continued. It is likely that there has been more subsidence at10Surfside since 1978, the latest data presented on this map. Rising sea-levels due to globalsea-level rise or local land subsidence do not cause beach erosion, but the rise in sea levelresults in a shift of the shoreline in the landward direction which has the same net effecton the shoreline.
15
Within an historic time frame, the cause of subsidence in the Houston-Galveston area isprimarily due to ground-water withdrawal and secondarily oil and gas production thatbegan in the early part of this century. In the Houston-Galveston area, ground water isproduced from sand aquifers as deep as 3,000 ft. Subsidence occurs as water levels are20lowered in the aquifers and interbedded clay begins to lose water and compact. Thereduction in water or artesian pressure reduces the support for overlying sedimentarystrata and the land surface begins to sink or subside. Most of the compaction is
permanent because of the inelastic nature of the clay. However, if ground-waterpumpage is stopped or reduced so that the aquifer water levels are maintained or raised,clays are no longer exposed to drying, and subsidence rates are greatly reduced (Gibeaut,White, and Tremblay, 2000, p. 21).
5Swanson and Thurlow (1973) used tide gauge data from Florida to Texas to estimaterates of relative sea-level rise that were due to land subsidence. For Freeport, theyestimated from 1955 to 1971 the rate of subsidence at Freeport was 1.12 cm/yr. (Swansonand Thurlow, 1973, p. 2668). This would be equal to 0.44 in/yr. This rate would meanthat the subsidence from 1960 to 2003 would be a total of about 1.5 feet of relative sea-10level rise due to subsidence. This alone can account for considerable shoreline retreat ona gently sloping shoreline.
Gibeaut and White (1999) summarize the effects of man-made structures on shorelineretreat on the upper Texas Coast.15
Overall, the shoreline from High Island to the Brazos River is retreating at a rate of2 to 10 feet per year….. There are areas of notable exception to the overall erosionrates. These areas are related to San Luis Pass which is a natural tidal inlet, and tocoastal structures. As mentioned above, the supply of sand is very limited along the20upper Texas coast. In fact, the major source of sand for a particular beach is thatwhich is eroded from beaches elsewhere. Because the net direction of alongshoresand movement is to the southwest, the supply for any given beach generally lies tothe northeast. Any feature that prevents the beach from eroding or traps sand thatcame from the beaches farther to the northeast, will cause enhanced erosion to the25southwest. The upper Texas coast has natural and unnatural features that havereduced the sand supply to beaches to the southwest.
The jetties and dredged channels at Freeport Channel, Bolivar Roads and SabinePass serve to keep the shipping lanes open, but they have also trapped much sand30and have enhanced shoreline retreat away from them to the southwest. Jettyconstruction and dredging activities began at these channels in the late 1800’s andwere completed by 1910 (Gibeaut and White, 1999, p. 9,10).
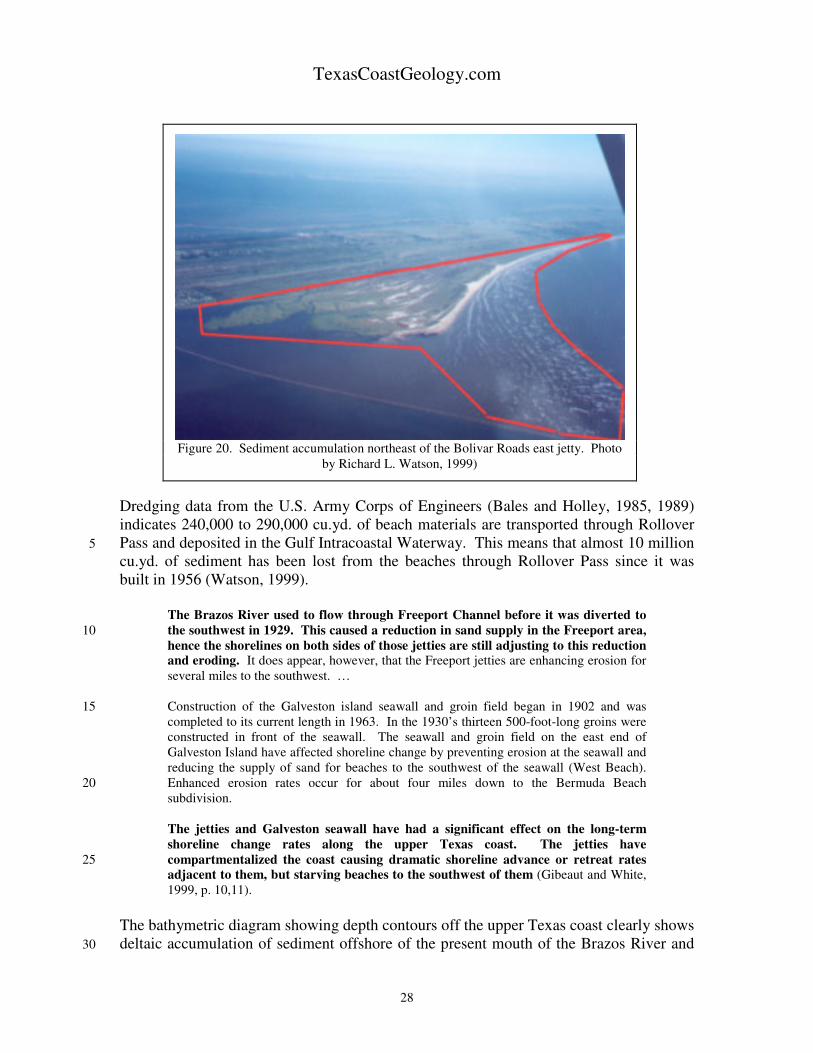
The area enclosed in red in Figure 20 clearly shows the huge amount of sediment trapped35and permanently stored by the east jetty of Bolivar Roads since the jetty was built in1876. Morton, et al. 1983 noted: “The most recent shoreline accretion on the Peninsula’swestern tip can be attributed to sediment supplied by beach erosion and trapped by thenorth jetty at Bolivar Roads. Over 28 million cubic yards of sand have been added to thebeach and along the jetties by coastal processes since jetty construction in 1876.” “This40huge accumulation of beach materials that was carried west along the shore of BolivarPeninsula and accumulated north of the jetty at the Galveston Entrance Channel is shownin Figure 20. This amounts to about 260,000 cuyd/yr and may be a good estimate of thenet longshore sediment transport to the southwest along Bolivar Peninsula” (Watson,1999). This huge amount of sand is forever denied to the beaches further downdrift along45the coast on Galveston Island and Follets Island, including the beach at Surfside. Thejetties at Bolivar Roads are so long they provide a wave shadow on the west side of thepass which protects the beaches from waves coming from the northeast. This has causedanother large accumulation of sand trapped at East Beach in Galveston which furtherstarves downdrift beaches to the southwest.50
TexasCoastGeology.com
28
Dredging data from the U.S. Army Corps of Engineers (Bales and Holley, 1985, 1989)indicates 240,000 to 290,000 cu.yd. of beach materials are transported through RolloverPass and deposited in the Gulf Intracoastal Waterway. This means that almost 10 million5cu.yd. of sediment has been lost from the beaches through Rollover Pass since it wasbuilt in 1956 (Watson, 1999).
The Brazos River used to flow through Freeport Channel before it was diverted tothe southwest in 1929. This caused a reduction in sand supply in the Freeport area,10hence the shorelines on both sides of those jetties are still adjusting to this reductionand eroding. It does appear, however, that the Freeport jetties are enhancing erosion forseveral miles to the southwest. …
Construction of the Galveston island seawall and groin field began in 1902 and was15completed to its current length in 1963. In the 1930’s thirteen 500-foot-long groins wereconstructed in front of the seawall. The seawall and groin field on the east end ofGalveston Island have affected shoreline change by preventing erosion at the seawall andreducing the supply of sand for beaches to the southwest of the seawall (West Beach).Enhanced erosion rates occur for about four miles down to the Bermuda Beach20subdivision.
The jetties and Galveston seawall have had a significant effect on the long-termshoreline change rates along the upper Texas coast. The jetties havecompartmentalized the coast causing dramatic shoreline advance or retreat rates25adjacent to them, but starving beaches to the southwest of them (Gibeaut and White,1999, p. 10,11).
The bathymetric diagram showing depth contours off the upper Texas coast clearly showsdeltaic accumulation of sediment offshore of the present mouth of the Brazos River and30
Figure 20. Sediment accumulation northeast of the Bolivar Roads east jetty. Photoby Richard L. Watson, 1999)
TexasCoastGeology.com
29
the absence of any such accumulation at the Freeport jetties, the location of the BrazosRiver prior to its diversion in 1929 (Figure 21). Even though the amount of sand carriedto the coast by the Brazos has been significantly reduced due to upstream dam andreservoir construction, the post 1929 mouth of the Brazos River is still maintaining both asubaerial and submarine delta. If the river had not been diverted, that sediment would be5dumping into the Gulf at the Freeport jetties and the present severe shoreline retreat andbeach erosion either would not be occurring or would be occurring at a much slower rate.The large sand accumulation adjacent to each of the Bolivar Roads jetties is alsoapparent.
Figure 21. Upper Texas Coast (From Gibeaut and White, 1999, p. 3)
TexasCoastGeology.com
30
CONCLUSIONS
It is well established that there is a severe and accelerating beach erosion problem atSurfside, Texas. While a small part of the erosion may be due to natural causes, such as5decreased sand transport to the coast by rivers and global sea level rise, it is obvious thatat this location, most of the erosion is caused by man-made changes to the Brazos Riverand the Freeport Harbor entrance channel. Diversion of the river 7 miles in the downdriftdirection has starved the Surfside and Quintana beaches of river sand. Numerousupstream dams and reservoirs on the Brazos river have drastically reduced the amount of10sand the river now carries to the coast.
Construction of long jetties and a deep channel precludes sand transport in eitherdirection across the harbor entrance. In addition, sand moving southwest along the beachat Surfside is carried out along the east jetty and deposited in the channel, where it is15forever lost to the Surfside beach, unless it is placed back on the beach by a dredgeduring beach nourishment.
The Corps of Engineers and the Bureau of Economic Geology maintain that the lack ofan updrift fillet of sand and the recently accelerated erosion at surfside beach may be due20to wave amplification by the recently extended east jetty or sand inventory reduction bydredging of the channel. Since the jetty was extended in 1992 and the channel wasdeepened to 45 feet, the amount of sediment dredged annually from the outer bar channelhas nearly doubled.
25It has been nearly 75 years since the Brazos river was diverted to the south, and the oldBrazos delta has completely eroded away and no longer serves as a nearshore source forsand that waves can bring onshore to nourish the beach. There is, now, little sandoffshore, with only a thin veneer of sand over deltaic mud. Likewise, dunes in theSurfside area are very small and store only a small volume of sand which can be30transported offshore during storms to flatten the beach profile and reduce wave attack. Ifany of that sand is washed offshore onto the clay zone, it will not be transported back tothe beach.
Finally, extraction of large amounts of ground water for the Freeport industries has35caused subsidence of the land surface at Surfside, resulting in at least one foot of relativesea level rise. Extrapolation of the rate of subsidence suggests the total is now two or 2.5ft. at Surfside, resulting in additional shoreline retreat.
Distant man-made changes in the shoreline have drastically reduced the amount of sand40which is available to be transported to the southwest along the coast. About 11 millioncu.yd. of sand has been lost inward through Rollover Pass since it was built in 1956 andmore than 30 million cu.yd. of sand have been caught and permanently stored east of thejetties at Bolivar Roads. A smaller amount of sand is stored in the fillet at East Beach,Galveston in the wave shadow of the jetties.45
TexasCoastGeology.com
31
In the middle part of the 20th century, hard structures such as groins and seawalls alongwith beach nourishment were the primary methods used to slow or stop beach erosion.Since groins and jetties starve downdrift beaches and merely pass the erosion problem todowndrift beaches, they have fallen into disfavor. Seawalls accelerate erosion of thebeach in front of them, rather than protect it, while they protect the landward property as5long as they last. However, unless they are truly massive such as the Galveston seawall,they usually fail in severe storms. By the end of the 20th century, it has become thepractice to just allow beaches to erode or to use beach nourishment with beach qualitysand, when it is economically feasible to do so.
10The best solution to provide a beach at Surfside (and to stop further erosion) is to nourishthe beaches with beach quality sand from nearby sources. The problem is that there maynot be adequate nearby sources of sand. It appears that the only beach quality sand beingdredged from the channel is near station 0+00 at the end of the jetties. That is most likelysand eroded from Surfside beaches and can be pumped back onto the beach by a pipeline15dredge. If that part of the channel is maintained with hopper dredges, it is unlikely thesand can be placed back on the beach. There may also be a sand source in Oyster Creek,which used to flow to the coast, but now terminates in the Intracoastal Waterway. Thereare no surface sand deposits in the offshore area which are suitable for beachnourishment. In a recent study, Texas A&M Galveston researchers found a buried20channel below the Beaumont clay offshore from Surfside (Dellapenna, Allison, and Seitz,2002). It is likely a sand-filled channel and could possibly be a source of beach sand.However, exploitation of this sand resource would require deep dredging and wouldleave a deep hole offshore in which beach sand may be lost during storms.
25Sources of beach quality sand to nourish the beaches at Surfside are limited, and even ifexploited, will not be sufficient to serve long into the future. Even though there isreluctance to armoring the shoreline with seawalls or revetments, such structures may bethe only long term solution to erosion and shoreline retreat at Surfside and at Quintana.Such structures will mean there will be no usable pedestrian beach in front of them in the30future, but they can stabilize the shoreline and prevent further erosion for a long time.This was done in the Sargent area to protect the Intracoastal Waterway and the remaininghouses seaward of the waterway.
One of the greatest drawbacks of using seawalls and revetments such as at Galveston and35at Sargent is they accelerate beach erosion in the downdrift direction. This should not bea concern if these structures are used at Surfside and Quintana because the beachesdowndrift of the Freeport jetties are receiving no sand from the updrift beaches at presentand the beaches downdrift of the new Brazos delta are being nourished by sand from thedelta and the Brazos River. There are few locations where armoring the shoreline would40cause less downdrift damage that such structures at Surfside and Quintana.
There is no other location on the coast which is subject to such a complete collection ofman-made causes of beach erosion. Of the possible man-induced causes of beacherosion: river diversion, reduced sand output by a nearby river, jetty construction,45maintenance of a deep channel, land subsidence due to water or oil extraction, and
TexasCoastGeology.com
32
blockage of updrift sand sources, all are present at Surfside. In addition, Surfside islocated on an eroding delta which is composed largely of mud with little in the way ofnearshore sand sources.
The severe beach erosion at both Surfside and Quintana is almost entirely due to man-5made changes in the Brazos River and the coastline. Only man-made changes in the formof beach nourishment and/or armoring the shoreline with a sea wall or revetment willstop the erosion.
TexasCoastGeology.com
33
REFERENCESBales, J.D., and Holley, E.R., 1984. Introductory Concepts Related to Feasibility of Rollover FishPass Hydraulic Model Study. The University of Texas Center for Research in Water Resources.5The University of Texas at Austin.
Bales, J.D., and Holley, E.R., 1985 (Section 1). Evaluation of Existing Conditions and Possible DesignAlternatives at Rollover Fish Pass, Texas. Center for Research in Water Resources. UT Austin. CRWR210.10
Bales, J.D., and Holley, E.R., 1989. Sand transport in Texas tidal inlet. Pp. 427-443 in Jour. Waterway,Port, Coastal and Ocean Engineering, v.115, No. 4, July, 1989.
Bouma, A.H., and Bryant, W.R., 1969. Rapid Delta Growth in Matagorda Bay, Texas, inCastanares, A.A., and Phleger, F.B., Eds. Coastal Lagoons, a Symposium: Universidad NacionalAutonoma de Mexico-UNESCO, Mexico, D.F., p. 171-189.20
Dellapenna, T.M., Allison, M., Seitz, W., 2002. 2000-2002 GLO-CMP Cycle 5 Project-SandResources and Movement off Surfside Beach. Texas A&M University, Galveston, Texas.
Gabrysch, R.K., 1982. Ground-Water Withdrawals and Land-Surface Subsidence in the Houston-25Galveston Region, Texas 1906-1980. U.S. Geological Survey Open File Report 82-571. Preparedin Cooperation with the Texas Department of Water Resources and the Harris-Galveston CoastalSubsidence District, Austin, Texas, 68p.
Gibeaut, J.C., Morton, R.A., and Angle, E.S., 1999. Gulf of Mexico Shoreline Change from San30Luis Pass to the Brazos River, Texas. Prepared for the Texas Coordination Council pursuant toNational Oceanic and Atmospheric Administration Award No. NA770Z0202 by the Bureau ofEconomic Geology of The University of Texas at Austin, 81p.
Gibeaut, J.C., White, W.A., 1999. Coastal Hazards Atlas of Texas: A Tool for Hurricane35Preparedness and Coastal Management – Volume 1, Brazoria, Galveston, and Harris Counties.A report of the Texas Coastal Coordination Council pursuant to National Oceanic andAtmospheric Administration Award No. NA770Z0202, Bureau of Economic Geology, TheUniversity of Texas at Austin, 69p.
40Gibeaut, J.C., White, W.A., and Tremblay, T.A., 2000. Coastal Hazards Atlas of Texas: A Toolfor Hurricane Preparedness and Coastal Management – Volume 1, The Southeast Coast. A reportof the Texas Coastal Coordination Council pursuant to National Oceanic and AtmosphericAdministration Award No. NA770Z0202, Bureau of Economic Geology, The University of Texasat Austin, 69p.45
Lockwood, Newnam and Andrews, Inc., 1974. Localized Erosion at Rollover FishPass, Bolivar Peninsula, Texas, Houston, Tex.
Mason, C., 1981. Hydraulics and Stability of Five Texas Inlets. Misc. Report No. 81-1. U.S.50Army Corps of Engineers Coastal Engineering Research Center, Fort Belvoir, Va., 105p.
Mathewson, C.C. and Minter, L.L., 1976. Impact of Water Resource Development on CoastalErosion, Brazos River, Texas; Texas Water Resources Institute, Technical Report 77, Texas A&MUniversity, 85p.55
TexasCoastGeology.com
34
McGowen, J.H., Brown, L.F., Jr., Evans, T.J., Fisher, W.L., and Groat, C.G., 1976.Environmental Geologic Atlas of the Texas Coastal Zone – Bay City-Freeport Area: Bureau ofEconomic Geology, The University of Texas at Austin, 98p.
5Morton, R.A., and Pieper, M.J., 1975. Shoreline Changes in the Vicinity of the Brazos River Delta(San Luis Pass to Brown Cedar Cut) An Analysis of Historical Changes of the Texas GulfShoreline. Geol. Circ. 75-4, Bureau of Economic Geology, The University of Texas at Austin,Austin, Texas 1975.
10Morton, R.A., 1977a. Nearshore Changes at Jettied Inlets, Texas Coast. American Society ofCivil Engineers, Coastal Sediment ’77 Symposium, p. 267-286.
Morton, R.A., 1977b. Historical Shoreline Changes and Their Causes, Texas Gulf Coast.Transactions of the Gulf Coast Association of Geological Societies, v.XXVII, p 352-364.15
Morton, R.A., 1979. Temporal and Spatial Variations in Shoreline Changes and theirImplications, Examples from the Texas Gulf Coast. Journal of Sedimentary Petrology, v.49, No.4, p. 1101-1112.
20Morton, R.A., Pilkey, O.H., Jr., Pilkey, O.H., Sr., and Neal, W.J., 1983. Living with the TexasShore. Duke University Press, Durham, NC, 190p.
Morton, R.A., 1997. Gulf Shoreline Movement Between Sabine Pass and the Brazos River, Texas:1974 to 1996. Geological Circular 97-3, Bureau of Economic Geology, The University of Texas25at Austin, 46p.
Paine, J.G., and Morton, R.A., 1989. Shoreline and Vegetation-Line Movement, Texas Gulf Coast,1974-1982. Geological Circular 89-1, Bureau of Economic Geology, The University of Texas atAustin, 50p.30
Seelig, W.N., and Sorenson, R.M., 1973. Investigation of Shoreline Changes at Sargeant Beach,Texas: Texas A&M University, Sea Grant Report TAMU-SG-73-212, 153P.
Swanson, R.L., and Thurlow, C.I., 1973. Recent Subsidence Rates along the Texas and Louisiana35Coasts as Determined by Tide Measurements, Journal of Geophysical Research, v.78, No. 15,2665-2671.
Watson, R.L., 1968. Origin of shell beaches, Padre Island, Texas, Master's Thesis, The Universityof Texas at Austin, 121p.40
Watson, R.L., 1971. Origin of Shell Beaches, Padre Island, Texas, Journal of SedimentaryPetrology, v.41, No. 4, 1105-1111.
Watson, R.L., 1999. Severe Beach Erosion Caused by Permanent Sand Loss Through Rollover45Fish Pass, Bolivar Peninsula, Texas. Unpublished report for J. Martin Green and Alan McNeill,Attorneys at Law, 60p.
U.S. Army Engineer District, Galveston, Southwestern Division, 1992. Inlets Along the TexasCoast, Section 22 Report, August 1992, 56p.50