82
Newport News Severe Weather Plan December, 2017 1 Severe Weather Plan 2017

Newport News Severe Weather Plan December, 2017
1
Severe Weather Plan
2017

Newport News Severe Weather Plan December, 2017
2
Table of contents
Basic Severe Weather Plan ............................................................................................................. 3 Promulgation ............................................................................................................................... 4 I. Purpose .................................................................................................................................... 5
II. Scope and Risk ....................................................................................................................... 5 Scope ....................................................................................................................................... 5 Risk ......................................................................................................................................... 5
III. Organization and Responsibilities ........................................................................................ 6 IV. Concept of Operations .......................................................................................................... 7
Threat Recognition and Notifications ..................................................................................... 7 Protection Priorities and Critical Facilities ............................................................................. 8
Pre-event Actions .................................................................................................................. 10 General Response Actions .................................................................................................... 10 Post-event Assessment, Re-entry, and Initial Recovery Activities....................................... 10
V. Evaluation ............................................................................................................................ 12
Hazard Specific References .......................................................................................................... 13 Special Events Weather Criteria ............................................................................................... 14 Flooding .................................................................................................................................... 16
Reference Materials .............................................................................................................. 23 Hurricane or Tropical System ................................................................................................... 25
Pre-Storm Actions ................................................................................................................. 30 Reference Materials .............................................................................................................. 32
Winter Storm ............................................................................................................................. 59 Reference Materials .............................................................................................................. 62
Storms - Thunderstorms, Tornadoes, Derechos and Lightning ................................................ 72 Reference Materials .............................................................................................................. 75
Extreme Heat ............................................................................................................................ 77
Reference Materials .............................................................................................................. 81

Newport News Severe Weather Plan December, 2017
3
Basic Severe Weather Plan

Newport News Severe Weather Plan December, 2017
4
Promulgation
The purpose of the Severe Weather Plan is to provide a guide for an effective and coordinated response on the part of local government and supporting organizations in the event of a severe weather emergency including hurricanes, floods, severe thunderstorms, winter storms and extreme heat. The Severe Weather Plan is an Annex to the City of Newport News Emergency Operations Plan (EOP) and includes more detailed information, decision-making tools and research information to support decision making.
The plan has been reviewed by the following City officials and is intended to be approved by the City Council as an official policy document.
_________________________________ Cynthia D. Rohlf Director of Emergency Management City Manager
_________________________________ Chief R.B. Alley Coordinator of Emergency Management Fire Department
_________________________________ George Glazner, Deputy Coordinator Division of Emergency Management
_________________________________ Michael Poplawski Director Parks, Recreation and Tourism Dept.
_________________________________ Michael Grinstead Acting Chief, Police Department
_________________________________ Reed Fowler Director Public Works Department

Newport News Severe Weather Plan December, 2017
5
I. Purpose
The purpose of this plan is to provide guidelines for managing severe weather events. The plan covers a number of potential severe weather events. They are combined into one annex since severe weather rarely presents a single threat. For example, hurricanes and severe thunderstorms are uniquely different events, however they can both produce damages from high winds and flooding. Nor’Easters, are similar to hurricanes, yet can also have elements of winter weather. This plan is an annex to the Newport News Emergency Operations Plan. II. Scope and Risk
Scope
This plan addresses five types of severe weather which could affect Newport News. Including:
Flooding – tidal, riverine, and urban flooding from heavy rainfall
Hurricane or Tropical Storms
Winter Storms – snow, ice and Nor’easters
Storms – thunderstorms, tornadoes, derechos and lightning
Temperature Extremes – heat or cold
While each is different in scope, magnitude and complexity, the effect of all of these events can be reduced to:
High Winds
High Water
Snow/Ice
Temperature Extremes
Risk
The cause and effects of the above types of severe weather are discussed in depth in the 2016 update of the Hampton Roads Hazard Mitigation Plan, Section 4, Hazard Identification and Analysis. The following are excerpts from that plan in relation to these specific threats:
NN has experienced 11 presidential
disaster declarations between 1996 and
2016, all of which were weather related

Newport News Severe Weather Plan December, 2017
6
including 8 for hurricanes/tropical storms and 3 for winter storms.
There is one high hazard dam Lee Hall Reservoir which is operated by NN
Waterworks and is key to providing drinking water for the peninsula.
Tropical Storms and Hurricanes - 78 storms have passed within 75 miles of
Newport News since records began in 1851. Two estimated as Category 3
hurricanes passed within 75 miles of the region (unnamed storms in 1879 and
1899), eight were Category 2 hurricanes, 16 were Category 1 hurricanes and 49
were tropical storms. The remainder were tropical or extra-tropical depressions.
In addition to the notable historical tropical storms and hurricanes affecting NN,
the mitigation plan also lists 26 reported flooding events between 1995 - 2015,
(7 Coastal/Tidal flooding events, 19 other flooding events).
Sea level rise, combined with land substance, will result in more frequent and
deeper flooding in the future.
Tornadoes are very infrequent and tend to be EF 0 to EF 1 range, however there
have been at least three EF 3 tornadoes in surrounding counties since 1995.
Hampton Roads has experienced 23 significant winter storm events including
snow and ice storms, since 1995.
Though rare, an extreme straight line wind event called a derecho affected the
region in 2012 resulting in significant power outages.
III. Organization and Responsibilities

Newport News Severe Weather Plan December, 2017
7
Severe Weather
PRIMARY:
Emergency Management
SUPPORT:
Codes Compliance/Zoning
Communications (911/311)
Engineering
Fire
Health
Human Service
Police
Planning
Public Works
Schools
Water Works
COORDINATION:
All City departments
VDEM/State/Federal agencies
Public/Private Partners
Responsibilities for severe weather preparedness, response and recovery include:
Compliance with the guidelines set forth in the Emergency Operations Plan and associated annexes.
Implement Departmental COOP as needed
Situational and damage assessment
Alerting and Warning
Flood fighting/mitigation where applicable
Public information
Evacuation
Roadway clearance
Rescue/Safety
Traffic control
Mass care and sheltering
Debris clearance
Utility restoration
Emergency repairs
Transition to long term recovery
IV. Concept of Operations
All activities performed under this annex will conform to the Newport News Emergency Operations Plan.
Severe weather events have varying times for warnings and emergency preparedness/mitigation activities.
The National Weather Service has the primary responsibility for providing alerts to local governments as well as issuing watches and waning to the public.
The Division of Emergency Management is responsible for monitoring and alerting key departmental personnel of approaching severe weather.
The Emergency Communications Center is responsible for rapid onset/no notice warnings and reporting of significant impacts which would trigger a response by city departments.
Threat Recognition and Notifications
Severe weather events are typically preceded by forecasts which can provide time for some last minute preparations. This time also provides an opportunity to monitor the development of the weather and provide notification and warnings as they approach.

Newport News Severe Weather Plan December, 2017
8
Threat recognition and notifications occur throughout the year. For example: “Hurricane season” is from June 1 to November 30, sharply peaking from late August through September. During this time the National Hurricane Center produces daily forecasts and tracking of active and developing storms. These forecasts typically provide several days’ notice and are monitored by DEM staff and others. Notifications for local departments and key officials are made by DEM whenever threatening storms are predicted to effect the Hampton Roads area. The likelihood of flooding, severe storms and other severe weather are possible throughout the year and are typically predicted a day or more in advance. They are also monitored by DEM staff as well as 911 and others via email, text, NOAA weather radio, IPAWS, and the National Warning System (NAWAS). The City of Newport News relays warning information from the National Weather Service to city personnel and registered citizens via the City’s website and “NNalert” email and text messages. These are not designed to replace, but supplement the notifications provided from the National Weather Service disseminated via IPAWS, NOAA Weather Radio and local new media outlets. Many media and private services also provide text and email alerts to reach “subscribers” on a personal basis. 911 dispatchers also disseminate warning information to public safety personnel via the radio system. Beginning in late 2017, local alerts from the City’s flood gauges will provide automatic notifications to residents via the mass notification system. Additional emergency related public information is also disseminated via all of the above sources. Beginning in the fall of 2017, a mass notification system will be available for residents to sign up to receive alerts form the city’s new mass notification system, the system provides notifications via voice calls, texts and email. Protection Priorities and Critical Facilities
Protection priorities as identified in the Emergency Operations Plan include:
Save Human Lives
Save Animals
Protect Property
Protect the Environment
Stabilize the Economy
Restore the Community There are two specific subsets in the above priorities which deserve additional attention, especially due to the potential for community wide effects from weather events. Vulnerable Populations:

Newport News Severe Weather Plan December, 2017
9
Vulnerable populations include a very broad range of people including, but not limited to, those with access and functional needs, the sick, elderly, and very young. In addition there are residents and visitors to Newport News who may not be fluent in the English language, as well as those who are homeless and/or those with temporary medical conditions require additional assistance. While there may be a few areas where vulnerable populations are more likely to be located, the fact is that they are found in every neighborhood and community within Newport News. With the advances in home health care, as well as those once considered “disabled” are now often completely or nearly self-sufficient. Therefore these “vulnerable” populations are likely to be encountered in any residence and the numbers and locations change often. Estimates of 25% to 33% or more of the population could fall into one of these categories. Therefore it is incumbent upon us to be prepared to provide whatever assistance we can reasonably provide to everyone during an emergency. Examples of preparedness measures to assist those in need include the use of accessible bus transportation, accessible shelters with emergency power, partnerships with various community groups, and multi-lingual public information. We also have a limited supply of medical cots, wheelchairs, and related equipment for shelter operations. DEM and the Peninsula Health District (VA DPH) use the EMPower database from the Department of Health and Human Services to identify the potential needs of vulnerable populations receiving assistance from programs administered by the Center for Medicare Services (CMS). Following a major disaster, VA DPH will request address specific data in order to conduct health and welfare checks to ensure there are no underserved persons. This detailed data is typically not released in advance due to privacy laws. Critical Facilities: For purposes of this plan, these include emergency services facilities, medical facilities, schools and daycares, adult and residential care facilities, governmental communications, primary governmental offices and equipment storage areas, as well as water and waste water facilities. Facilities related to other utilities are covered in other plans but city responders will interface with the owners/operators of such facilities as needed. These facilities are located on the Newport News GIS system so their proximity to where the affected areas are can be quickly identified and appropriate response and notifications can be made.

Newport News Severe Weather Plan December, 2017
10
Pre-event Actions
Pre-event activities vary by department and lead time before the severe weather begins. The following are examples:
Mitigation activities such as home buyouts, and promoting homeowner mitigation measures.
Stormwater management activities such as collection, drainage, debris clearance, etc.
Floodplain management including enforcement of building codes and land use.
In advance of major storms: o departmental staffs meet to discuss preparations and anticipated impact o public information will be provided to inform citizens what actions they
should take to ensure their safety and to minimize property damage o departments take individual preparations including preposition of
equipment and increased staffing o in the event significant impact is expected, the NN EOC will be staffed in
advance of the storm General Response Actions
Response activities during severe weather are somewhat limited to emergency activities. During a storm, the primary responses are emergency calls for services like downed wires, blocked or icy roadways, persons trapped, crashes, etc. During extreme temperatures and extended periods without power, the responses also include related medical issues. Until these escalate to require evacuations, the need for emergency sheltering, resources shortages, they are handled routinely. Incidents of larger magnitude trigger activation of the city’s emergency plans and the Emergency Operations Center (EOC) for coordination and resource support.
During very severe storms, conditions may limit or even prevent responders from reaching persons needing assistance. The most frequent weather related issues are blocked or impassable roads and/or extremely high winds from a severe storms or hurricane. To the extent actives can be conducted safely, Public Works will clear access to the emergency scene and/or remove any storm water blockages to drain flood waters. Once conditions improve, damage assessment and more permanent cleanup and restoration will be completed.
Post-event Assessment, Re-entry, and Initial Recovery Activities
Post Event Assessment

Newport News Severe Weather Plan December, 2017
11
Following a severe weather event, and assessment of calls made to 911 and reports from field personnel. If necessary, personnel will be dispatched to the identified areas to conduct a quick drive by damage assessment. Sometimes referred to as a windshield assessment. If conditions appear severe enough to request State and/or Federal disaster assistance, damage assessment teams will be sent to document the damages and report them as appropriate.
The assessments are conducted for the purpose of determining is certain thresholds have been made to trigger the activation of certain disaster assistance programs, typically administered through the Federal Emergency Management Agency (FEMA). The details of specific programs are covered in more depth in the Recovery Plan which is a companion document to the Emergency Operations Plan.
Re-Entry
Following damages to an area, public safety officials will determine if it is safe to allow residents to remain in the damage areas and may implement an evacuation and/or restrict re-entry until the life safety issues are mitigated. Such orders can be issued by the Police or Fire officials’ on-scene. The Police will enforce these orders and control access and manage traffic around the area as necessary. In the event of widespread and/or catastrophic damages, VDEM and other state agencies will support and reinforce these restrictions. Access priorities will following these “tiers”
Closed – No public assess, with activities limited to search and rescue, reopening roadways for emergency vehicles, power and utility assessments and rendering safe conditions and emergency repairs.
Restricted – local residents/businesses, damage assessment teams and emergency restoration, etc. would be allowed access. This access may be further restricted to certain times of day such as daylight hours only. This is sometimes referred to as “look and leave” and would be implemented in the event conditions are not safe for residents to stay in the area overnight.
Limited – This would basically allow access to those with a “need to be there”. In addition to those listed above, repair and restoration contractors, and workers assisting residents salvage belongings and begin repairs, to include volunteer relief organizations. The intent is to allow those necessary to begin the recovery process while limiting the general public and sightseers. If the area becomes tightly congested, some form of shuttle services may be implemented. Again, additional limitations such as time of day may be implemented.
Open – no restrictions

Newport News Severe Weather Plan December, 2017
12
Initial Recovery
Initial recovery activities are typically those activities which ensure the property/area is “safe, sanitary and secure”. These are also immediate activities which are made to prevent additional damages and to allow as many residents as possible to remain in homes with minor damage such as leaky roofs and broken windows. Additional examples are “muck out” and dry out activities following flooding or penetrating rainfall. These allow residents and businesses to minimize additional losses and conduct salvage activities.
As time passes, these activities extend past emergency repairs to more permanent repairs and or reconstruction. Such repairs and or reconstruction may fall under the current codes and zoning regulations. It is important that residents are aware of the requirements as soon after the disaster as possible to prevent any unauthorized repairs and to ensure that restoration activities helps them to recover than they were before. Again, there are a number of programs and financial opportunities unique to disaster recovery to assist the survivors.
This is the time to consider hazard mitigation activities and to review long range community and city planning goals. Often disasters offer unique opportunities to make changes which otherwise not be practical. The key is being prepared and moving quickly to help the community get back to normal or a new normal without lengthy and confusing delays. Again, following the promise of helping the survivors recover with safer and more resilience in their community and their homes and businesses.
V. Evaluation
Evaluation of this plan and the overall effectiveness of the responses to severe weather will be measured in a number of ways:
Exercises and/or actual responses: At a minimum, at least one annual exercise or actual response will be conducted annually. Since flooding is the most common hazard and a Community Rating System (CRS) requirement, flooding will be included at least once each year.
Following each exercise and/or event, and after action report will be prepared including a corrective action plan for any areas needing improvement.
Public comments and news coverage will also be monitored for evaluation purposes. This will include surveys, social media posts, emails and comments sent to the city communications office and other departments.
Public comments will also be solicited at outreach and public educational events.

Newport News Severe Weather Plan December, 2017
13
Hazard Specific References

Newport News Severe Weather Plan December, 2017
14
Special Events Weather Criteria
A variety of outdoor special events as well as training and exercises, are conducted in Newport News throughout the year. Due to our varied weather threats and in the interest of public health and safety, the following information is provided as policy guidelines for emergency planning for such events. Event management, as identified on the permit, is responsible for adherence. Police, Fire and/or the Parks Department representatives retain ultimate authority to halt any permitted events when, in their opinion, conditions meet the criteria attached and pose an imminent threat to the health, safety and well-being of those present at the event. As a guide for scheduling events, the following weather conditions chart should be helpful in assessing the climate conditions typical for each month. Source: NWS Wakefield

Newport News Severe Weather Plan December, 2017
15

Newport News Severe Weather Plan December, 2017
16
Flooding
In Newport News, flooding can be caused by heavy rainfall resulting in urban flooding, tidal flooding, riverine flooding and/or storm surge. Typically, flooding results from multiple causes simultaneously. Due to our position on the Chesapeake Bay and the James River, the risk areas from riverine and tidal flooding are similar. In many cases, these areas also correspond to the FEMA/NFIP identified flood zones. The flood plain management program restricts construction in these areas and has resulted in minimizing persons and property at risk. Storm surge, though much less frequent, has the potential in impact a much greater area of the city. Due to the city’s relatively flat terrain, flooding tends to be relatively shallow (less than a few feet) and generally drains quickly. The exceptions are flooding caused by storm surge from hurricanes and during nor’easters lasting multiple tidal cycles. These are discussed further in the Hurricane or Tropical Storm section of this plan. A. Hazards: (Ref: the Haz Mit Plan 2016)
Areas of the city are low and subject to tidal flooding during hurricanes and severe nor’easters. Flood duration is typically shorter for hurricanes and tropical storms than for nor’easters because the storms tend to move faster and affect only 1 to 2 tidal cycles. The main impacts from flooding are typically:
Inundation of low-lying residential neighborhoods and subsequent damage to
structures, garages, and landscaping;
Impassable road crossings and consequential risk for people and cars attempting to
traverse flooded crossings;
Damage to public and private infrastructure, possibly including but not limited to water
and sewer lines, bridge embankments, and both small and large drainage ways;
Wave action responsible for shoreline damage, and damage to boats and facilities,
including ships, ports and shipyards;
Inundation of critical infrastructure, possibly including some pumping stations,
roadways, utility equipment, etc.
Recovery time needed to bring critical infrastructure and employers back online. Of
particular concern in the region are transportation routes, housing for displaced
residents and debris management.
What the consequences of flooding will be, depend on:
the type of water (fresh vs. salt) and the amount of water that floods the area,
the size, height and other physical aspects of the area that floods,
the depth of the water in the area,

Newport News Severe Weather Plan December, 2017
17
how long the water remains in the area,
how fast the water flows and if there are rocks, dirt, debris, trees, cars or even (parts of) houses carried with it,
the presence of people, businesses, structures, etc. in the flooded area. B. Vulnerable Demographics
The following tables illustrate the demographics of the population in identified flood prone areas.
(Created 1/26/2017 Source: U.S. Census Bureau, 2010-2014 American Community Survey) % of total
Total Households 3,736
Total Population 9,182
Households with Pop 65+ 906 24.3%
1-Person 397 10.6%
2+ Person Family 484 13%
Nonfamily 26 0.7%
Total Housing Units 4,155
Housing Units with Mortgage 1,508
Language (# not well or not at all fluent in English)
Spanish (Ages 18-64) 21
Spanish (Ages 65+) 11
other Indo-European languages (Ages 18-64) 12
Asian and Pacific Island languages (Ages 18-64) 5
Asian and Pacific Island languages (Ages 65+) 3
Potential Access and Functional Needs
Households w/o Vehicle 308
Household Income below poverty level 458 12.3%
Households with someone on Social Security 1045 28%
Households with someone on Retirement Income 933 25%
Households on Public Assistance 87 2.3%
Households on Food Stamps/SNAP 406 10.9%
Households with at least one person w/”disability” 1,059 28.3%

Newport News Severe Weather Plan December, 2017
18
Flood Insurance Policies as of 3/31/2016
Policies In force = 2,168
Insurance In-force = 554,558,700
Written Premium In-force = 1,424,730
NFIP Repetitive Loss Properties 129
Value of Losses $ 13,037,268
Number of Losses 294
Average Payment per Claim $ 44,344
HAZUS Potential Loss Analysis for a 1% flood event
Number Buildings Moderately Damaged (15-49%) 463
Number Buildings Substantially Damaged 8
Building Losses $ 49,965,691
Content Losses $ 102,837,473
Inventory Losses $ 48,883,533
C. Vulnerable Geographical Areas
Newport News has flood related data available on the City’s GIS web site. Additional layers, such as common flood prone areas are available on secure maps for emergency management purposes. Some of these layers include the NFIP maps, storm surge maps, evacuation zones, critical facilities, road and drainage networks, etc.
Flooding is possible throughout Newport News, but three specific areas are subject to more frequent flooding. The areas, drawn in purple, correspond to the NFIP repetitive losses as well as a HAZUS level 1 analysis for damages from a 1% flood. The Southeast Community, especially around Salters Creek is one of the more frequently flood prone areas. Flooding here is also exacerbated by tidal flooding. The city has two water level monitoring gauges on
Slaters Creek, designated by the symbol to detect rising waters and warn residents of the impending danger.
Note: Flood threats from storm surge and evacuation areas are shown
in the Hurricane Section of this plan.

Newport News Severe Weather Plan December, 2017
19
Another area known for frequent flooding is along Newmarket Creek on either side of Mercury Blvd. with the most repetitive loss claims associated with City Line Apartments. A separate response plan has been developed for the apartments and apartment management provides warnings to the residents to facilitate evacuation as needed. The city has also placed three flood monitors on Newmarket Creek and the Government Ditch to alert residents and city officials to rising water in the area. The northwestern part of the city, in the Denbigh area, has pockets of flood prone areas as well. Many of these are also prone to riverine and tidal flooding. There are two sensors in the area. The sensor on the Shellabarger Bridge can detect and measure rising waters from rainfall, riverine flooding, tidal flooding as well as any breach from the Lee Hall reservoir.

Newport News Severe Weather Plan December, 2017
20
D. Critical Infrastructure
There is no critical infrastructure at significant risk from flooding other than from major hurricane storm surges (addressed in the Hurricane section of this plan). The city does have pumping stations which could have access blocked by high water. While this does not affect the operation of the station and/or increase flooding, it could affect the ability to effect repairs and refill the fuel tanks of emergency generators. The following is a list of those pumping stations:
PS# Tidal Rain Event Description
1 yes yes Manholes flood or lateral under water
2 yes yes Tidal flooding from river and yacht basin
16 yes Under pass floods due to drainage issues
39 yes Low area ditch will flood during rain event
49 yes yes Ditch floods the driveway but station is fine
53 yes yes River behind the station floods
72 yes yes River behind station street flooding
96 yes yes Berdella Lake floods and back feeds on roadway
99 yes Low area and tidal flooding possible
125 yes yes James River floods at 16th street E. Alerts and Notifications
The public and operators of all critical facilities have the option of choosing to register to receive emergency notifications from the National Weather Service, as well as the notifications provided by the City of Newport News. All city employees are automatically registered in the notification system, ensuring personnel with specific preparedness and response activities have notification of pending flooding or when flooding is in progress. The system is also linked to the stream sensors installed at key locations throughout the city. These sensors are configured to activate the alert notification automatically when certain thresholds are reached. Each sensor has 3 preset public notifications. The preset notifications are for:
1. Rapidly rising water 2. Flood level reached 3. Water levels dropping

Newport News Severe Weather Plan December, 2017
21
F. Emergency Preparedness Actions
The primary responsibility for flood control and stormwater management lays with the Department of Public Works supported by the Departments of Engineering and Codes Compliance and others. In addition to managing runoff and land use, Public Works takes proactive measures to ensure the stormwater system works as efficiently as possible. A common cause of failure of any drainage system is debris restricting the flow of water. To prevent this from happening, Public Works has identified potential restriction points and has a maintenance schedule to check and keep them clear and free flowing. These areas have “inlet protection devices” (screens and grates) which keep debris from clogging pipes. These are routinely maintained and are rechecked anytime heavy rainfall is expected. In addition to the stormwater pumping stations throughout the city, the city and private property owners have containment or catchment areas to help regulate stormwater runoff. Four of the city managed areas, are equipped with pumps to help regulate the water flow to reduce flooding. They are located at Chelsie Place, Tack Court, Kiln Creek and near Suite Life Circle. G. Emergency Response Actions
Due to the nature of the flood threat and the relatively flat terrain, flood levels tend to only be less than 3 to 4 feet. Therefore, response to flooding is somewhat limited to the effects of the individual storm. The first and most important is the element is the pre-event public education and alerts during an event. This provides the public time to evacuate before the roadways become impassable and gives them an opportunity to take expedient emergency protective measures. As previously stated, Public Works pumps water from the listed containment areas to regulate the flow of the run-off during a heavy rain event. In addition, during a high rainfall event and immediately afterward, personnel check and clear debris from drains to keep the water flowing. Since Newport News is located at the convergence of the James River and the Chesapeake Bay, riverine flooding is similar to tidal flooding and is limited to the coastal shoreline. More severe tidal flooding associated with storm surge potentially could impact a much larger area, especially if coupled with heavy rainfall. This is addressed in more detail in the Hurricane section of this plan, however, the only response differences are the advanced warning time and greater emphasis on evacuation of those in the threatened area. The National Weather Service and the National Hurricane Center provide the official watches and warnings which trigger local notifications to residents and businesses.

Newport News Severe Weather Plan December, 2017
22
In the event rescues are necessary, the city utilizes a military style high water vehicle as well as school busses. In extreme cases, other large vehicles such as dump trucks could be used. The city has a marine unit and water rescue capabilities within the Fire Department.

Newport News Severe Weather Plan December, 2017
23
Reference Materials
www.stormsense.com https://maps.nnva.gov/arcgis/apps/webappviewer/index.html?id=b8560eb85e774538a00fadc9e25d5403 Locations of Tidal/Flood Gauges

Newport News Severe Weather Plan December, 2017
24
Locations of Weather Stations Wunderground.com

Newport News Severe Weather Plan December, 2017
25
Hurricane or Tropical System
Hurricanes are among nature's most powerful and destructive phenomena. On average, 12 tropical storms, 6 of which become hurricanes form over the Atlantic Ocean, Caribbean Sea, or Gulf of Mexico during the hurricane season which runs from June 1 to November 30 each year. Over a typical 2-year period, the U.S. coastline is struck by an average of 3 hurricanes, 1 of which is classified as a major hurricane (winds of 111 mph or greater). A. Hazards
Storm surge is the most dangerous part of a hurricane's hazards. This hazard is historically the
leading cause of hurricane related deaths in the United States. The storm surge is water that is
pushed onto shore by a hurricane. It is rarely a "wall of water" as often claimed, but rather a rise
of water that can be as rapid as several feet in just a few minutes. The storm surge moves with
the forward speed of the hurricane--typically 10 - 15 mph. This wind-driven water moving at 10 -
15 mph has tremendous power. A cubic yard of sea water weighs 1,728 pounds--almost a ton. A
one-foot deep storm surge can sweep a car off the road, and it is difficult to stand in a six-inch
surge. Compounding the destructive power of the rushing water is the large amount of floating
debris that typically accompanies the surge. Trees, pieces of buildings, and other debris float on
top of the storm surge and act as battering rams that can cave in any buildings unfortunate
enough to stand in the way. For persons in the threatened areas, evacuation well ahead of an
approaching storm is important. The storm surge can begin to rise a day before the storm hits,
cutting off escape routes when low-lying roadways are flooded. Ref: Jeff Masters…
Flooding from heavy rains is the second leading cause of fatalities during landfalling tropical
cyclones. Widespread torrential rains from tropical storms and hurricanes often cause flooding
hundreds of miles inland. This flooding can persist for several days after a storm.
Winds from a hurricane can destroy buildings and mobile homes. Debris, such as signs, roofing
material, and items left outside can become flying missiles during hurricanes.
Tornadoes are often produced by landfalling tropical storms and hurricanes. These tornadoes
typically occur in rain bands well away from the center of the hurricane.
Dangerous waves produced by a hurricane's strong winds can pose a significant hazard to
coastal residents and mariners. These waves can cause deadly rip currents, significant beach
erosion, and damage to structures along the coastline, even when the storm is more than a
1,000 miles offshore.
Varying Impact Examples: Oct. 19, 1749: This tremendous hurricane raised The Chesapeake Bay an amazing 15 feet and washed up 800 acres of sand that now forms Willoughby Spit. The storm destroyed Fort George at Old Point Comfort after the Virginia General Assembly had tried in 1727 to strengthen it after the damage done by the 1667 hurricane.

Newport News Severe Weather Plan December, 2017
26
Sept. 3, 1821: One of the most violent hurricanes on record. The eye passed over Norfolk then moved northeast along the New Jersey coast onto Long Island. Aug. 18, 1879, "The Great Tempest": A gale blew from the northeast for 24 hours before the winds shifted northwest and increased to 70 mph. The eye passed about 50 miles west of Norfolk, raising the tide to nearly eight feet. Average wind speed at Cape Henry was 76 mph with estimated gusts of 100 mph. July 8, 1896: Hurricane spawned at least seven tornadoes in Virginia. Oct. 25, 1897: Lasted 60 hours. Norfolk tides 8.1 feet above Mean Lower Low Water. Aug. 23, 1933: The hurricane was born off the Cape Verde Islands and reached Category 4 strength but weakened to a Category 2 before making landfall. The storm caused record high tides up the entire west side of the Chesapeake Bay, with damages the highest ever recorded from a storm surge, causing 18 deaths and $79 million in damages in Virginia. Virtually the entire Tidewater area including Virginia Beach was paralyzed by the storm through loss of communication, electricity, water service and roads. Sept. 16, 1933: The hurricane developed east of the Bahamas and strengthened to a Category 3 storm, making landfall near Cape Lookout, N.C. The tide surpasses eight feet at Sewells Point, causing floods in the Tidewater area less than one month after the Aug. 23 storm. June 21, 1972, Tropical Storm Agnes: Agnes was only a weak hurricane when it developed over the Gulf of Mexico and struck the Florida panhandle, entering Virginia as a depression. Agnes produced devastating floods in Pennsylvania, Maryland and Virginia. Sixteen inches of rain was recorded in Chantilly in Fairfax County, and both the Potomac and James rivers experienced major flooding. Richmond was hard hit. The water supply, sewage treatment, electric and gas plants were inundated. Only one of the five bridges crossing the James survived; the downtown section was closed for several days. More than 60 counties and 23 cities in the Commonwealth qualified for federal disaster relief. Sixteen people died in Virginia and damage was estimated at $222 million. Sept. 15-16, 1999, Hurricane Floyd: Hurricane Floyd, at one time a large Category 4 storm, had weakened to a minimal hurricane as it reached Virginia. However, rain associated with Floyd began well in advance of the storm and intensified as the storm neared and crossed Virginia Beach on the 16th. Rainfall amounts averaged 10 to 20 inches in a 50 to 75 mile path over southeast Virginia. More than 300 roads were closed in the peak of the storm from flooding and downed trees. Sept. 18, 2003, Hurricane Isabel: Made landfall near Ocracoke North Carolina. The center passed west of Emporia and west of Richmond. Fastest 1 minute wind speed NE 54 mph with gusts to 75 mph at Norfolk NAS; NE 61 mph with gusts to 74 mph at the South Island

Newport News Severe Weather Plan December, 2017
27
Chesapeake Bay Bridge-Tunnel. Highest tide at Sewells Point was 7.9 feet above MLLW, which was a 5 foot surge. Sept. 17, 2004, Hurricane Ivan: Made landfall near the Florida/Alabama border as a Category 3 hurricane. It weakened to a tropical depression and moved northeast, tracking along the Appalachian Mountains through western Virginia, then northeast and offshore the mid-Atlantic coast. A total of 40 tornadoes were produced in Virginia September 1, 2006, Tropical Storm Ernesto: The remnants of Tropical Storm Ernesto interacted with an unusually strong high pressure are over New England to generate strong winds, heavy rainfall, and storm surge related tidal flooding and damage. Five to eight inch rainfall amounts were common across central and eastern Virginia. This rainfall caused flooding in many areas, although no substantial river flooding resulted from the heavy rain. Wind gusts of 60 to 70 mph occurred on the Eastern Shore of Virginia, as well as areas adjacent to the Chesapeake Bay from Yorktown northward. Tides were particularly high from communities adjacent to the York River, northward through the Rappahannock River to tidal portions of the Potomac River. Tides of 4 to 5 feet above normal, combined with 6 to 8 foot waves, caused significant damage to homes, piers, bulkheads, boats, and marinas across portions of the Virginia Peninsula and Middle Peninsula near the Chesapeake Bay and adjacent tributaries. B. Storm Surge Vulnerabilities
The Southeastern portion of the city is at the highest risk from flooding from storm surge. The City’s GIS also has the capability to estimate the scope of tidal and storm surge flooding relative to the NOAA, USGS and local StormSense gauges.

Newport News Severe Weather Plan December, 2017
28
Structures in Storm Surge Zones: as of 2015
4-5 ft 6-8 ft 9-12 ft
Residential 334 2,103 5,680
Commercial 66 370 640
Public
C. Evacuation Zones
Evacuation zones designated A through D are in place across coastal Virginia. In the event of a storm or other emergency, residents of one or more zones may be directed to evacuate depending on tides, storm intensity, path, and other factors. The new tiered evacuation zones identify areas vulnerable to flooding with precision that was not available until now. The newest technology and data allows emergency managers to tell residents of coastal Virginia more clearly whether they need to evacuate or shelter at home during a storm or other emergency. The new program consolidates hundreds of complex local evacuation areas into easy-to-understand zones; making it much easier to communicate with residents as a storm approaches.

Newport News Severe Weather Plan December, 2017
29
Key Evacuation Zone Demographics
Zone Zone A Zone B (A+B)
Zone C (NONE)
Zone D A+B+D)
Population 4,521 13,824 N/A 18739
Households 1,872 5913 N/A 7414
Housing Units 2,033 6494 N/A 8338
Pop over 65 yrs 639 1789 N/A 11.6%
Owner Occupied 1,261 2543 N/A 2903
Renter Occupied 627 2970 N/A 4511
Total Housing Units 2047 6509 N/A 7414
Vacancy Rate 8.9% N/A 11.1%
Owner Occupied % 66.8% 49.8% N/A 39.2%
Owner w/Mortgage 51.2% 36.7% N/A 26.3%
Owner w/o Mortgage 15% 13.1% N/A 12.8%
Renter Occupied % 33.2% 50.2% N/A 60.8%

Newport News Severe Weather Plan December, 2017
30
Pre-Storm Actions
Task Time Critical Org
Expect VECTOR activation -144 Yes VDEM
Expect Governor's Declaration -120 Yes VEOC
Consider declaration of local emergency -120 Yes City Manager
Notify VEOC to create WebEOC Incident for planned events
-120 EOC
Review plans and procedures -96 Yes All
Conduct regular exercises with all personnel -96
STATE lane reversal decision point -96 VEOC
Review fund balances and pcard limits -96 All
Request a check of exterior building for hazards like clogged drains, tree/limb hazards, etc.
-96 DEM
Check schedule of upcoming events/reschedule? -96 DEM
Notify activation teams (red, blue, etc. see comments) -96 Yes DEM
Consider STATE resource request meeting (see comments)
-96 DEM
Inventory supplies and reorder as necessary -96 Yes All
Remind Purchasing to review maintenance and emergency contracts
-96 DEM
Conduct additional tests of equipment -96 Yes All
Expedite or request early maintenance/service (copier/printer, refueling, etc.)
-96 DEM
Conduct just-in-time training -96 DEM
Confirm readiness of key departments -72 Yes DEM
Consider need to alert mass care personnel -72 Yes
Coordinate with Communications Dept. for public messaging
-72 Yes
Governor's evacuation briefing -72
Issue departmental notifications -72 Yes DEM
Request EOC Staff to declare availability -72 Yes All
Confirm activation team schedule and staff availability -72 Yes DEM
Review maintenance request status -72 DEM
STATE lane reversal implemented -72
Time permitting, complete Condition 2 items -72 All
Confirm delivery of any ordered supplies -72 DEM
Conduct final equipment/systems checks -48 No
Review previous checklists if time allows -48 No

Newport News Severe Weather Plan December, 2017
31
Task Time Critical Org
Conduct final review of plans and procedures -48
Verify adequate supplies on-hand -48 Yes
Conduct just-in-time training -48
Conduct an activation Team briefing (Red, Blue, etc.) -48 Yes
Expect Hurricane Watch to be issued -48
Conference calls begin with stakeholders -48
Governor's consultation of mandatory evacuation with local officials
-48
Consider actions if STATE mandatory evacuation is implemented
-36
Expect Hurricane Warning Issued -36
Governor's lane reversal go/no-go decision point -36
Implement Partial EOC activation if evacuation is ordered
-36
Place Debris Management Contractors on Stand-by (if not already done)
-30 Yes
Review previous checklists if time allows -30
Consider EOC activation timing (see comments) -30
Complete final preparations if time allows -24 Yes
Closely monitor for changing conditions -24 Yes
Conduct Planning Team Meeting (see comments) -24
Open EOC in preparation for activation -14
Decision point for opening shelters -12
Activate EOC if not already completed -12 Yes
Order meals for current operational period (see comments)
-12
Consider Opening ROLRs -12
Be prepared to adjust timing w/ little or no additional warning.
-6 Yes
Initiate termination of lane reversal -6
Terminate preparedness activities and prepare to take shelter
0 Yes
Arrival of Tropical storm winds 0 Yes
Conduct final just in time training (see comments) 0
Complete Damage Assessment 72 Yes All

Newport News Severe Weather Plan December, 2017
32
Reference Materials
Optional… http://www.nhc.noaa.gov/pdf/sshws_table.pdf Tropical Depression: A tropical cyclone with max sustained winds of 38 mph (33 knots) or less. Tropical Storm: A tropical cyclone with max sustained winds of 39 to 73 mph (34 to 63 knots).
Saffir-Simpson Hurricane Wind Scale
Category Sustained Winds Types of Wind Damages
1 74-95 mph
Very dangerous winds will produce some damage: Well-constructed frame homes could have damage to roof, shingles, vinyl siding and gutters. Large branches of trees will snap and shallowly rooted trees may be toppled. Extensive damage to power lines and poles likely will result in power outages that could last a few to several days.
2 96-110 mph
Extremely dangerous winds will cause extensive damage: Well-constructed frame homes could sustain major roof and siding damage. Many shallowly rooted trees will be snapped or uprooted and block numerous roads. Near-total power loss is expected with outages that could last from several days to weeks.
3 (Major)
111-129 mph
Devastating damage will occur: Well-built framed homes may incur major damage or removal of roof decking and gable ends. Many trees will be snapped or uprooted, blocking numerous roads. Electricity and water will be unavailable for several days to weeks after the storm passes.
4 130-156 mph
Catastrophic damage will occur: Well-built framed homes can sustain severe damage with loss of most of the roof structure and/or some exterior walls. Most trees will be snapped or uprooted and power poles downed. Fallen trees and power poles will isolate residential areas. Power outages will last weeks to possibly months. Most of the area will be uninhabitable for weeks or months.
5 157 mph or higher
Catastrophic damage will occur: A high percentage of framed homes will be destroyed, with total roof failure and wall collapse. Fallen trees and power poles will isolate residential areas. Power outages will last for weeks to possibly months. Most of the area will be uninhabitable for weeks or months.

Newport News Severe Weather Plan December, 2017
33

Newport News Severe Weather Plan December, 2017
34
Residential Demographics Details for Evacuation Zone A

Newport News Severe Weather Plan December, 2017
35

Newport News Severe Weather Plan December, 2017
36

Newport News Severe Weather Plan December, 2017
37

Newport News Severe Weather Plan December, 2017
38

Newport News Severe Weather Plan December, 2017
39
Residential Demographics Details for Evacuation Zone A

Newport News Severe Weather Plan December, 2017
40

Newport News Severe Weather Plan December, 2017
41
Demographics Details for Evacuation Zone B (Comprised of Zones A plus B)

Newport News Severe Weather Plan December, 2017
42

Newport News Severe Weather Plan December, 2017
43

Newport News Severe Weather Plan December, 2017
44

Newport News Severe Weather Plan December, 2017
45

Newport News Severe Weather Plan December, 2017
46

Newport News Severe Weather Plan December, 2017
47
Business Demographics Details for Evacuation Zone B (Comprised of Zones A plus B)

Newport News Severe Weather Plan December, 2017
48

Newport News Severe Weather Plan December, 2017
49

Newport News Severe Weather Plan December, 2017
50
Demographics Details for Evacuation Zone C
There is no Zone C in Newport News

Newport News Severe Weather Plan December, 2017
51
Demographics Details for Evacuation Zone D (Comprised of Zones A plus B plus D)

Newport News Severe Weather Plan December, 2017
52

Newport News Severe Weather Plan December, 2017
53

Newport News Severe Weather Plan December, 2017
54

Newport News Severe Weather Plan December, 2017
55

Newport News Severe Weather Plan December, 2017
56
Business Demographics Details for Evacuation Zone D (Comprised of Zones A + B +D)

Newport News Severe Weather Plan December, 2017
57

Newport News Severe Weather Plan December, 2017
58

Newport News Severe Weather Plan December, 2017
59
Winter Storm
Winter Weather impacts: Why do we need to care about winter weather in Hampton Roads? The reason is that although winter weather may seem harmless, and oftentimes fleeting for the majority of the state, the underlying hazards can significantly impact everyday life. The impacts of winter weather can essentially be broken down into two categories: Areas: how does winter weather affect your environment? People: how can winter weather directly impact you?
1. Areas A. Roads
70% of winter weather related injuries are the result of vehicle accidents. A thick blanket of snow or ice on roads makes driving difficult, and a bad idea. If the road is covered by a blanket of snow, it is difficult to determine where the road ends and a ditch or other hazard begins; driving becomes even more perilous when two cars are attempting to travel down a road with no visible lanes, and inclined roads can become impassible. In the event of an accident, drivers may be stranded for many hours in harsh weather conditions waiting for assistance.
Freezing rain and sleet can dramatically worsen the driving hazard by creating a dangerously slick, icy road surface.
Clearing ice or snow covered roads is also a problem; with limited equipment in VA due to the relative infrequency of events, priority is given to main thoroughfares and secondary roads are largely untouched during the initial hours after a storm has passed.
Black ice is also a major hazard associated with frozen precipitation on roads, and it doesn’t begin until the storm has ended! When snow and ice begin to melt, the resultant liquid can linger on the roadways until night, and if temperatures fall below freezing can refreeze creating a thin sheet of ice that is impossible to see. It is called black ice because of the fact that it blends in with the road surface, and is very difficult to detect while driving.
The melting/refreezing process can occur for many days after a storm, and will only end once all moisture is melted and evaporated, and roads are dry.
B. Ice Accrual
Freezing rain accumulation on trees can cause large limbs, or even whole trees, to snap and possibly fall on homes, cars, or power lines. This also

Newport News Severe Weather Plan December, 2017
60
creates a very dangerous environment to be outside in; if a large limb snaps while you’re driving or walking underneath it, significant injury can occur.
The other major concern in icing from freezing rain events is power outages; when large amounts of ice accumulate on power lines and poles, widespread outages are likely to occur.
The results of significant icing can be economically and sociologically devastating; power companies that are not properly prepared for such an event may not be able to restore power to everyone for many days, which leaves thousands of customers shivering in often brutally cold weather, resulting in potentially dangerous attempts to heat their homes. Businesses without power are forced to shut down, resulting in huge financial losses for the local economy.
2. People A. Visibility
Heavy snow can create dangerous driving conditions by severely limiting the visibility of drivers, sometimes to mere feet. This is commonly referred to as "white out" conditions. During moderate to heavy snowfall, visibilities can be reduced to as little as 0 to .25 miles. The lack of visibility combined with slick, snow covered roads greatly increases the probability of an accident.
B. Loss of Power (Heating Hazards)
Residents can lose power during a winter storm when snow or ice accumulates on trees and causes them to fall onto a power line, or if enough ice accrues on a power line it may simply collapse on its own.
Power outages during very cold conditions can result in a potentially dangerous situation. If the power is out for a prolonged period, residents are forced to find alternative means to heat their homes. The danger arises from carbon monoxide poisoning, which is a scentless, deadly gas released from improperly ventilated heating sources such as space or kerosene heaters, furnaces, water heaters, gas stoves, fireplaces, and blocked chimneys. The danger can be prevented by providing proper maintenance and ventilation.
C. Dangerously Cold Temperatures
Dangerously cold temperatures, although uncommon, do occur in VA winters. When a cold air outbreak sends temperatures down into the teens and single digits, it becomes much more dangerous to be outside for prolonged periods.
Some of the major threats include: 1. Wind Chill: a measure of what the temperature feels like when
accounting for the wind speed. As the wind increases, more heat is able to be removed from your body by the wind.
Newport News Severe Weather Plan December, 2017
61
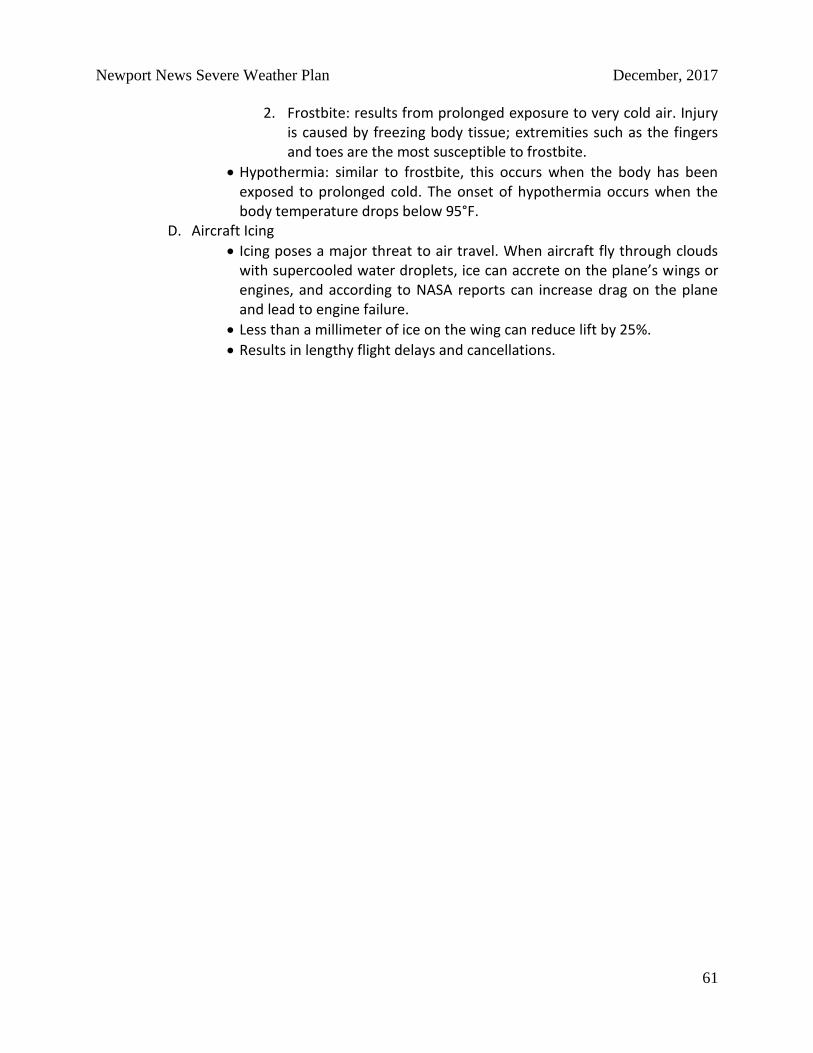
2. Frostbite: results from prolonged exposure to very cold air. Injury is caused by freezing body tissue; extremities such as the fingers and toes are the most susceptible to frostbite.
Hypothermia: similar to frostbite, this occurs when the body has been exposed to prolonged cold. The onset of hypothermia occurs when the body temperature drops below 95°F.
D. Aircraft Icing
Icing poses a major threat to air travel. When aircraft fly through clouds with supercooled water droplets, ice can accrete on the plane’s wings or engines, and according to NASA reports can increase drag on the plane and lead to engine failure.
Less than a millimeter of ice on the wing can reduce lift by 25%.
Results in lengthy flight delays and cancellations.

Newport News Severe Weather Plan December, 2017
62
Reference Materials
https://www.ready.gov/winter-weather http://www.nws.noaa.gov/om/winter/index.shtml
Key Terms: Windchill Wind chill is a measure of how cold people feel due to the combined effect of wind and cold temperatures; the Windchill Index is based on the rate of heat loss from exposed skin. Both cold temperatures and wind remove heat from the body; as the wind speed increases during cold conditions, a body loses heat more quickly. Eventually, the internal body temperature also falls and hypothermia can develop. Animals also feel the effects of windchill; but inanimate objects, such as vehicles and buildings, do not. They will only cool to the actual air temperature, although much faster during windy conditions.

Newport News Severe Weather Plan December, 2017
63
Nor'easter A Nor’easter is a storm along the East Coast of North America, so called because the winds over the coastal area are typically from the northeast. These storms may occur at any time of year but are most frequent and most violent between September and April. Some well know Nor’easters include the notorious Blizzard of 1888, the “Ash Wednesday” storm of March 1962, the New England Blizzard of February 1978, the March 1993 “Superstorm” and the recent Boston snowstorms of January and February 2015. Past Nor’easters have been responsible for billions of dollars in damage, severe economic, transportation and human disruption, and in some cases, disastrous coastal flooding. Damage from the worst storms can exceed a billion dollars. Nor’easters usually develop in the latitudes between Georgia and New Jersey, within 100 miles east or west of the East Coast. These storms progress generally northeastward and typically attain maximum intensity near New England and the Maritime Provinces of Canada. They nearly always bring precipitation in the form of heavy rain or snow, as well as winds of gale force, rough seas, and, occasionally, coastal flooding to the affected regions. The heavily populated region between Washington D.C., Philadelphia, New York and Boston, the “I-95 Corridor,” is especially impacted by Nor’easters. The U.S. East Coast provides an ideal breeding ground for Nor’easters. During winter, the polar jet stream transports cold Arctic air southward across the plains of Canada and the United States, then eastward toward the Atlantic Ocean where warm air from the Gulf of Mexico and the Atlantic tries to move northward. The warm waters of the Gulf Stream help keep the coastal waters relatively mild during the winter, which in turn helps warm the cold winter air over the water. This difference in temperature between the warm air over the water and cold Arctic air over the land is the fuel that feeds Nor’easters. In addition to high winds, snowfall potential, tidal flooding is a common occurrence. Blizzard: Sustained winds or frequent gusts of 35 mph or more with snow and blowing snow frequently reducing visibility to less than a quarter mile for 3 hours or more.

Newport News Severe Weather Plan December, 2017
64
Ice Storms Heavy accumulations of ice can bring down trees and topple utility poles and communication towers. Ice can disrupt communications and power for days while utility companies repair extensive damage. Even small accumulations of ice can be extremely dangerous to motorists and pedestrians. Bridges and overpasses are particularly dangerous because they freeze before other surfaces.
Black Ice Black ice is a deadly driving hazard defined as patchy ice on roadways or other transportation surfaces that cannot easily be seen. It is often clear (not white) with the black road surface visible underneath. It is most prevalent during the early morning hours, especially after snow melt on the roadways has a chance to refreeze over night when the temperature drops below freezing. Black ice can also form when roadways are slick from rain and temperatures drop below freezing overnight.

Newport News Severe Weather Plan December, 2017
65
Winter Storm Safety Heavy snow can immobilize a region and paralyze a city, stranding commuters, closing airports, stopping the flow of supplies, and disrupting emergency and medical services. The weight of snow can cause roofs to collapse and knock down trees and power lines. Homes may be isolated for days and could be deadly for outdoor pets. The cost of snow removal, repairing damages, and the loss of business can have severe economic impacts on the City. If you see any of the following conditions, do NOT go out on the ice:
Cracks, holes or breaks in the ice
Flowing water around the edges, just below the surface, or over the top of the ice
Ice that appears to have thawed and refrozen
Newport News Severe Weather Plan December, 2017
66
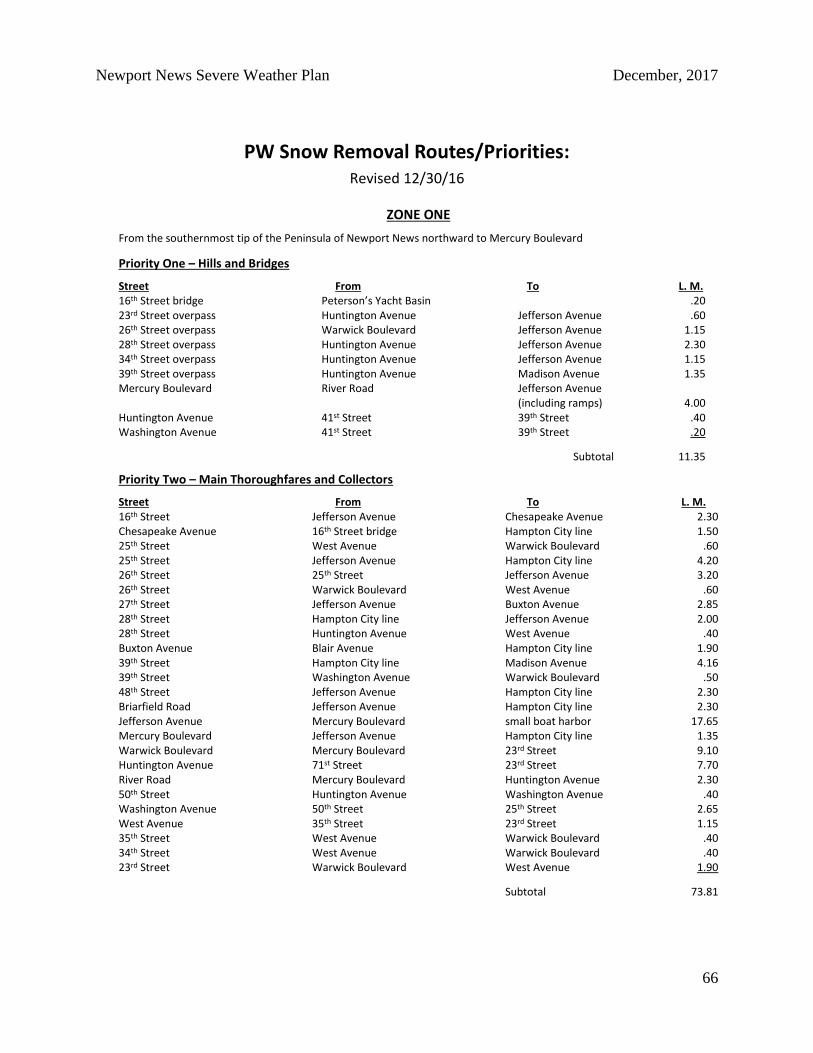
PW Snow Removal Routes/Priorities: Revised 12/30/16
ZONE ONE
From the southernmost tip of the Peninsula of Newport News northward to Mercury Boulevard
Priority One – Hills and Bridges Street From To L. M. 16th Street bridge Peterson’s Yacht Basin .20 23rd Street overpass Huntington Avenue Jefferson Avenue .60 26th Street overpass Warwick Boulevard Jefferson Avenue 1.15 28th Street overpass Huntington Avenue Jefferson Avenue 2.30 34th Street overpass Huntington Avenue Jefferson Avenue 1.15 39th Street overpass Huntington Avenue Madison Avenue 1.35 Mercury Boulevard River Road Jefferson Avenue (including ramps) 4.00 Huntington Avenue 41st Street 39th Street .40 Washington Avenue 41st Street 39th Street .20
Subtotal 11.35 Priority Two – Main Thoroughfares and Collectors Street From To L. M. 16th Street Jefferson Avenue Chesapeake Avenue 2.30 Chesapeake Avenue 16th Street bridge Hampton City line 1.50 25th Street West Avenue Warwick Boulevard .60 25th Street Jefferson Avenue Hampton City line 4.20 26th Street 25th Street Jefferson Avenue 3.20 26th Street Warwick Boulevard West Avenue .60 27th Street Jefferson Avenue Buxton Avenue 2.85 28th Street Hampton City line Jefferson Avenue 2.00 28th Street Huntington Avenue West Avenue .40 Buxton Avenue Blair Avenue Hampton City line 1.90 39th Street Hampton City line Madison Avenue 4.16 39th Street Washington Avenue Warwick Boulevard .50 48th Street Jefferson Avenue Hampton City line 2.30 Briarfield Road Jefferson Avenue Hampton City line 2.30 Jefferson Avenue Mercury Boulevard small boat harbor 17.65 Mercury Boulevard Jefferson Avenue Hampton City line 1.35 Warwick Boulevard Mercury Boulevard 23rd Street 9.10 Huntington Avenue 71st Street 23rd Street 7.70 River Road Mercury Boulevard Huntington Avenue 2.30 50th Street Huntington Avenue Washington Avenue .40 Washington Avenue 50th Street 25th Street 2.65 West Avenue 35th Street 23rd Street 1.15 35th Street West Avenue Warwick Boulevard .40 34th Street West Avenue Warwick Boulevard .40 23rd Street Warwick Boulevard West Avenue 1.90
Subtotal 73.81

Newport News Severe Weather Plan December, 2017
67
Priority Three – Secondary Streets Street From To L. M. Buxton Avenue 16th Street Blair Avenue .18 Blair Avenue Buxton Avenue Buxton Avenue .09 Walnut Avenue Chesapeake Avenue Hampton Drive .37 Hampton Drive Walnut Avenue Oak Avenue .37 Hampton Avenue Oak Avenue Jefferson Avenue 2.30 Chestnut Avenue 16th Street Hampton City line 8.30 Roanoke Avenue 16th Street Hampton City line 6.80 Orcutt Avenue Briarfield Road Hampton City line 1.89 Wickham Avenue 16th Street 35th Street 2.08 35th Street Chestnut Avenue Wickham Avenue 1.13 Marshall Avenue 16th Street Hampton City line 6.65 Subtotal 30.16
Total Lane Miles Zone One: 115.32 lane miles

Newport News Severe Weather Plan December, 2017
68
ZONE TWO From Mercury Boulevard northward to Oyster Point Road
Priority One – Hills and Bridges Street From To L. M. Oyster Point Road over railroad tracks next to Operations 1.13 Oyster Point Rd overpass at I-64 5.11 Old Oyster Pt Rd overpass at I-64 .60 Harpersville Rd overpass at I-64 .60 J. Clyde Morris Blvd Jefferson Avenue Warwick Boulevard 4.50 Warwick Blvd bridge over Lake Maury .20 Museum Drive bridge at Lake Maury .60 Main Street underpass between Jefferson Ave Warwick Boulevard .37 Center Ave underpass between Jefferson Ave Warwick Boulevard .37 Lakeside Drive between Museum Dr Sunset Rd .10 Madison Lane (N) (PAVERS) Deep Creek Road Blount Point Road 1.51 River Road James River Drive Main Street 1.13 Normandy Lane Maxwell Lane Deep Creek Road 1.70 Church Road Normandy Lane Deep Creek Road 1.14 City Center Blvd Jefferson Avenue Warwick Blvd. 3.80 Subtotal 28.86 Priority Two – Main Thoroughfares and Collectors Street From To L. M. Oyster Point Road Warwick Boulevard at I-64 overpass 7.00 Victory Boulevard I-64 overpass York County line .95 Boxley Boulevard Warwick Boulevard Menchville Road 3.03 Nettles Drive Oyster Point Road Warwick Boulevard 3.22 Jefferson Avenue Oyster Point Road Mercury Boulevard 38.63 Warwick Boulevard (PAVERS) Oyster Point Road Mercury Boulevard 36.87 J. Clyde Morris to Nettles Drive (PAVERS) J Clyde Morris Boulevard Jefferson Avenue York County Line 11.64 Old Oyster Point Road Canon Boulevard J. Clyde Morris Blvd 2.65 Harpersville Road (include incline at Tyler)
J. Clyde Morris Boulevard Warwick Boulevard 7.95
Saunders Road Harpersville Road Hampton City line 1.51 Old Harpersville Road Warwick Boulevard Harpersville Road .37 Main Street River Road Hampton City line 3.59 Center Avenue Warwick Boulevard Jefferson Avenue .37 Hampton Roads Center Parkway Jefferson Avenue Hampton City Line 4.16 Rock Landing Drive Diligence Drive dead end 3.78
Diligence Drive J. Clyde Morris Blvd Thimble Shoals Boulevard 3.03 Omni Boulevard Rock Landing Drive Canon Boulevard .94 Blue Crab Road Rock Landing Drive circle past Tugboat Lane 1.51 Tugboat Lane Blue Crab Road Middle Ground Boulevard .37 City Center Blvd. Warwick Blvd Rock Landing Drive 7.96 Canon Blvd Oyster Point Road Thimble Shoals Blvd 6.40 Triton Court Canon Blvd circle 0.10 Fishing Point Drive Thimble Shoals Blvd circle 1.0 Gum Rock Court Fishing Point Drive circle .18 Thimble Shoals Blvd (PAVERS) Jefferson Avenue J. Clyde Morris Boulevard 4.92 Town Center Drive (PAVERS) Thimble Shoals Boulevard Canon Boulevard .83 Lakefront Commons (PAVERS) Merchants Walk Canon Boulevard .52
Newport News Severe Weather Plan December, 2017
69
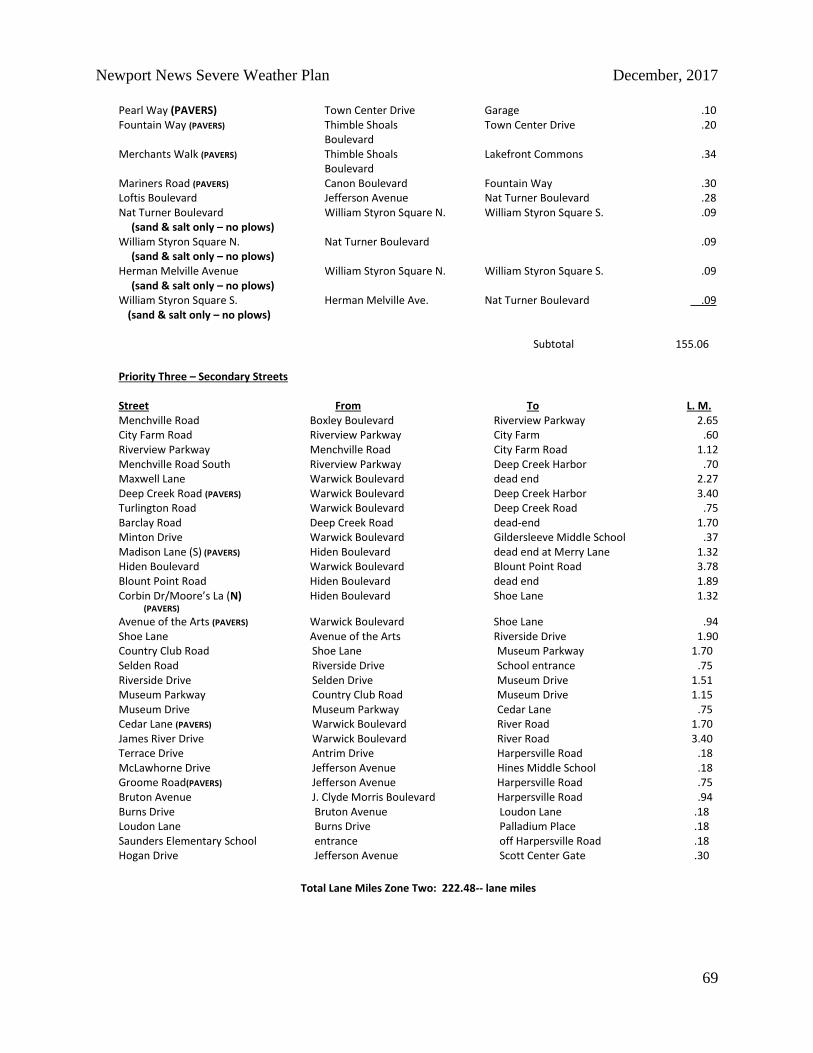
Pearl Way (PAVERS) Town Center Drive Garage .10 Fountain Way (PAVERS) Thimble Shoals
Boulevard Town Center Drive .20
Merchants Walk (PAVERS) Thimble Shoals Boulevard
Lakefront Commons .34
Mariners Road (PAVERS) Canon Boulevard Fountain Way .30 Loftis Boulevard Jefferson Avenue Nat Turner Boulevard .28 Nat Turner Boulevard William Styron Square N. William Styron Square S. .09
(sand & salt only – no plows) William Styron Square N. Nat Turner Boulevard .09
(sand & salt only – no plows) Herman Melville Avenue William Styron Square N. William Styron Square S. .09
(sand & salt only – no plows) William Styron Square S. Herman Melville Ave. Nat Turner Boulevard .09
(sand & salt only – no plows) Subtotal 155.06
Priority Three – Secondary Streets Street From To L. M. Menchville Road Boxley Boulevard Riverview Parkway 2.65 City Farm Road Riverview Parkway City Farm .60 Riverview Parkway Menchville Road City Farm Road 1.12 Menchville Road South Riverview Parkway Deep Creek Harbor .70 Maxwell Lane Warwick Boulevard dead end 2.27 Deep Creek Road (PAVERS) Warwick Boulevard Deep Creek Harbor 3.40 Turlington Road Warwick Boulevard Deep Creek Road .75 Barclay Road Deep Creek Road dead-end 1.70 Minton Drive Warwick Boulevard Gildersleeve Middle School .37 Madison Lane (S) (PAVERS) Hiden Boulevard dead end at Merry Lane 1.32 Hiden Boulevard Warwick Boulevard Blount Point Road 3.78 Blount Point Road Hiden Boulevard dead end 1.89 Corbin Dr/Moore’s La (N) (PAVERS)
Hiden Boulevard Shoe Lane 1.32
Avenue of the Arts (PAVERS) Warwick Boulevard Shoe Lane .94 Shoe Lane Avenue of the Arts Riverside Drive 1.90 Country Club Road Shoe Lane Museum Parkway 1.70 Selden Road Riverside Drive School entrance .75 Riverside Drive Selden Drive Museum Drive 1.51 Museum Parkway Country Club Road Museum Drive 1.15 Museum Drive Museum Parkway Cedar Lane .75 Cedar Lane (PAVERS) Warwick Boulevard River Road 1.70 James River Drive Warwick Boulevard River Road 3.40 Terrace Drive Antrim Drive Harpersville Road .18 McLawhorne Drive Jefferson Avenue Hines Middle School .18 Groome Road(PAVERS) Jefferson Avenue Harpersville Road .75 Bruton Avenue J. Clyde Morris Boulevard Harpersville Road .94 Burns Drive Bruton Avenue Loudon Lane .18 Loudon Lane Burns Drive Palladium Place .18 Saunders Elementary School entrance off Harpersville Road .18 Hogan Drive Jefferson Avenue Scott Center Gate .30
Total Lane Miles Zone Two: 222.48-- lane miles

Newport News Severe Weather Plan December, 2017
70
ZONE THREE From Oyster Point Road northward to City Line at York County/James City County
Priority One – Hills and Bridges
Street From To L. M. Jefferson Avenue overpass Freedom Way Brick Kiln Boulevard 3.40 Bland Boulevard overpass Chatham Drive Campbell Road 2.27 Newport News Airport ramp to new terminal .75 Denbigh Blvd overpass Richneck Road Pocohontas Drive 3.03 Old Courthouse Way Denbigh Boulevard Warwick Boulevard .20 Lucas Creek Road bridge Sandpiper Street Anchorage Drive .20 Warwick Boulevard Bridge ramps at Ft Eustis Blvd 3.78 Ft Eustis Boulevard bridges I-64 overpass bridge across reservoir 3.78 Warwick Boulevard hill at Skiffs Creek 1.13 Jefferson Avenue bridge over reservoir between Newport News Park and Campsites .20 Jefferson Avenue hill I-64 overpass JCC at Skiffs Creek 1.89 Beechmont Drive bridge (PAVERS) .20 Shellabarger Drive Warwick Boulevard Ft. Eustis gate .47 Subtotal 21.30
Priority Two-Main Thoroughfares and Collectors Street From To L. M. Jefferson Avenue Oyster Point Road JCC line 46.45
Jefferson Ave & Richneck Rd (PAVERS) Warwick Boulevard Oyster Point Road JCC line 25.75 Bland Boulevard Warwick Boulevard Pebbles Drive 4.16 Siemens Way Bland Boulevard McManus Boulevard .36 McManus Boulevard Siemens Way Denbigh Boulevard 2.27 Denbigh Boulevard York County line Boat ramp-Moyer Road 16.28 Old Denbigh Boulevard Denbigh Boulevard York County line 1.32 Richneck Road Denbigh Boulevard York County line 4.92 Ft Eustis Boulevard Ft Eustis Boulevard York County line 7.54 Route 238 (Yorktown Rd) Warwick Boulevard York County line 4.54 Subtotal 113.59 Priority Three – Secondary Streets Street From To L. M. Kiln Creek Boulevard York County line York County line 5.30 Brick Kiln Boulevard Jefferson Avenue Kiln Creek Parkway 6.43 Woodside Lane Denbigh Boulevard Melrose Terrace 1.88 Melrose Terrace Woodside Lane Red Oak Circle .37 Red Oak Circle (PAVERS) Melrose Terrace Woodside Lane .05 Woodside Lane Red Oak Circle Richneck Road .32 Shields Road Jefferson Avenue Chowan Place 3.21 Chowan Place Shields Road Tyner Drive .37 Tyner Drive Richneck Road Monroe Avenue .37 Monroe Avenue Tyner Drive Ridgewood Parkway .75 Ridgewood Parkway Richneck Road Windsor Castle Drive .56 Galahad Drive Windsor Castle Drive Ridgewood Parkway .56 Windsor Castle Drive Ridgewood Parkway Buchanan Drive .75 Buchanan Drive Windsor Castle Drive Richneck Road .94 Ridgewood Parkway Galahad Drive Denbigh Boulevard 1.13

Newport News Severe Weather Plan December, 2017
71
Jouett Drive (PAVERS) Ridgewood Parkway Woodside Lane 1.13 Shields Road Jouett Drive Denbigh Boulevard .37 Industrial Park Drive Warwick Boulevard Ft Eustis Boulevard 4.92 Enterprise Drive Warwick Boulevard dead end 5.68 Harwood Drive Enterprise Drive Enterprise Drive .94 Pickett’s Lane Warwick Boulevard Enterprise Drive 3.40 Thorncliff Drive Warwick Boulevard Cypress Terrace .75 Snidow Blvd/Lakeshore Dr Warwick Boulevard Linda Drive 1.51 Curtis Tignor Drive Warwick Boulevard Old Coach Lane .75 Lucas Creek Road Warwick Boulevard dead end at Epes Elementary 1.32 Beechmont Drive (PAVERS) Warwick Boulevard Moyer Road 2.84 Moyer Road Denbigh Boulevard dead end 3.03 Catalina Drive Denbigh Boulevard Beechmont Drive 1.52 Campbell Road Warwick Boulevard Bland Boulevard 2.08 Tabbs Lane Warwick Boulevard Linbrook Drive 1.13 Lucas Creek Road Denbigh Boulevard Youngs Road 5.11 Colony Road Warwick Boulevard Hertzler Road 4.35 Hertzler Road Colony Road Miller Road .56 Miller Road Hertzler Road Lucas Creek Road .94 Eastwood Drive Warwick Boulevard Lucas Creek Road 3.78 Nicewood Drive Eastwood Drive Menchville Road .56 Allison Road Eastwood Drive Menchville Road .37 Menchville Road Warwick Boulevard Boxley Boulevard 2.27 Youngs Road Lucas Creek Road Menchville Road .75 Crafford Road Yorktown Road County line .75 Tailaferro Road Crafford Road County line .33 Old Ft Eustis Boulevard Ft. Eustis Boulevard Woodside Lane .71 Lee’s Mill Road Warwick Boulevard Charles Street .38 Charles Street Lee’s Mill Road Lee’s Mill Road .28 Old Courthouse Way Tabbs Lane Warwick Blvd 1.76 Deloice Crescent Denbigh Blvd Campbell Road 1.05 Flint Drive Deloice Crescent Pocohantas Drive .49 Oriana Road Denbigh Blvd Warwick Blvd .65 Woodcreek Road Jefferson Avenue Trails Lane 1.00 Williamson Drive Warwick Blvd Bethel Road .16 Williamson Park Drive Williamson Drive Patricia Drive .36 Bethel Road Williamson Drive Dead End .30 Judy Drive Warwick Blvd Patricia Drive .57 Atkinson Way Warwick Blvd Compost Site Gate .76 Stanley Drive McKinley Drive Astor Drive .23 Astor Drive Stanley Drive Snidow Blvd .51 Rexford Drive Snidow Boulevard Rexford Drive West .80 Rexford Drive West Rexford Drive Rexford Drive East .48 Rexford Drive East Rexford Drive West Rexford Drive .31 Subtotal 84.93
Total Lane Miles Zone Three: 219.82 lane miles
TOTAL LANE MILES ZONE 1: 115.32 TOTAL LANE MILES ZONE 2: 222.48 TOTAL LANE MILES ZONE 3: 219.82
TOTAL LANE MILES ALL ZONES: 557.62
Newport News Severe Weather Plan December, 2017
72
Storms - Thunderstorms, Tornadoes, Derechos and Lightning
Severe storms, including tornados and derechos present many of the same threats as other types of severe weather, primarily high winds and heavy rains. Severe storms occur any time of the year The NWS defines a severe thunderstorm as any storm that produces one or more of the following elements:
A tornado.
Damaging winds or speeds of 58 mph (50 knots) or greater.
Hail 1 inch in diameter or larger. The SPC further defines significant severe thunderstorms as any storm that produce one or more of the following elements:
A tornado that produces EF2 or greater damage.
Wind speeds of 75 mph (65 knots) or greater.
Hail 2 inch in diameter or larger. Tornadoes can and often do occur without a tornado warning. There is no substitute for staying alert to the sky. Besides an obviously visible tornado, here are some things to look and listen for:
Strong, persistent rotation in the cloud base.
Whirling dust or debris on the ground under a cloud base -- tornadoes sometimes have no funnel!
Hail or heavy rain followed by either dead calm or a fast, intense wind shift. Many tornadoes are wrapped in heavy precipitation and can't be seen.
Day or night - Loud, continuous roar or rumble, which doesn't fade in a few seconds like thunder.
Night - Small, bright, blue-green to white flashes at ground level near a thunderstorm (as opposed to silvery lightning up in the clouds). These mean power lines are being snapped by very strong wind, maybe a tornado.
Night - Persistent lowering from the cloud base, illuminated or silhouetted by lightning -- especially if it is on the ground or there is a blue-green-white power flash underneath.
Severe Storm History Near Newport News:
Tornadoes in VA have occurred in every month with the peak “season” July-Sept with only 2 in Dec.
Newport News Severe Weather Plan December, 2017
73
Virginia has seen as few as one tornado in a year (1982) to as many as 84 tornadoes (2004).
At least 8 tornados have struck Newport News between 1950 and 2007. October 7, 1965: About 6 PM a possible tornado struck the Stuart Gardens section of Newport News. A violent wind downed a large tree, tore limbs from many more, toppled a chimney to a home and damaged numerous roofs. A funnel cloud was unofficially reported. One person reported the wind lifting his automobile from the ground momentarily then depositing it again upright.
September 5, 1979: Hurricane David spawned 34 tornadoes, 8 of which were in Virginia and 6 of those were strong ones. Two cities and five counties were hit. An F3 tornado struck Newport News, injuring two people and doing $2 million in damage. The tornado struck the James landing section, destroying 3 homes and doing major damage to 36 others and causing lessor damage to another 36. Hundreds of trees were broken off, uprooted or significantly damaged.
June 1, 1982: Strong winds and a possible tornado developed in thunder squalls ahead of a slow moving cold front. 69 MPH winds were recorded in the area.
May 8, 1984: One person was killed by a falling tree in a thunderstorm. Wind gusts were recorded at 67 mph
August 6, 1993: A tornado struck Newport News a little past 3 p.m. A man on the James River Bridge saw three funnel clouds over the river. Two dissipated and while the third touched down moving through the woods on the Newport News side of the river. The tornado tracked 12 miles through Newport News, Hampton and Langley Air Force Base (AFB). In Newport News, eight people were injured, 163 homes were damaged, 12 were condemned and damage costs were 1.2 million. In Hampton, two people were injured, 85 homes were damaged, eight condemned with damage costs near three-quarters of a million dollars. On Langley AFB, the tornado damaged several F-15s parked at the end of a runway for an air show scheduled for the next day.
September 4, 1999: An F2 tornado touched down in the City of Hampton. It did extensive damage to a three block area. There was numerous minor injuries with six people transported to the hospital. Three apartment complexes and an assisted living facility were condemned. Two additional apartment complexes were partially condemned. The damage caused 460 people to be moved from their homes. Many roofs were lifted off buildings and as many as 800 vehicles were damaged. The tornado formed from a thunderstorm band ahead of Hurricane Dennis.
August 11, 2001: Weak tornado (F0) damaged a couple of mobile homes and produced minor damage at a townhouse complex near Fort Eustis.

Newport News Severe Weather Plan December, 2017
74
April 16, 2011: Tornadoes struck several locations in Virginia, including a destructive tornado in Gloucester County and another one near Rockbridge County. A tornado touched down at the Surry Nuclear Power Plant in southeastern Virginia, cutting off external power, which caused its two reactors to trip. Because of this, the lowest level of emergency was declared. Shutdown and cooling of the plant proceeded as designed with no physical damage to the reactors or release of radiation. A fuel oil leak occurred at an above-ground storage tank near the station’s garage.
What is a derecho? Though very rare in Hampton Roads, a derecho is a widespread, long-lived wind storm associated with a band of rapidly moving showers or thunderstorms variously known as a squall line, bow echo, or quasi-linear convective system. Although a derecho can produce destruction similar to that of a tornado, the damage typically occurs in one direction along a relatively straight swath. As a result, the term "straight-line wind damage" sometimes is used to describe derecho damage. How strong are derecho winds? By definition, a derecho must include wind gusts of at least 58 mph (50 knots or 93 km/h) or greater along most of its length. While derecho winds typically are less than 100 mph, gusts as high as 130 mph have been recorded --- equivalent to those with strong EF2 tornadoes. In addition, a derecho wind damage swath must extend more than 240 miles. Response Actions Storms of these types typically occur quickly and may strike with little or no official warnings. The following are actions steps to be taken as time allows:
Stay abreast of weather forecasts, both daily and longer range. Typically there are indications that severe weather could be possible as much as 2 days in advance.
Monitor daily forecasts NWS Watches and Warnings. Watches may be issued a few hours prior to a storm. Warnings are not issued until the event is imminent or already in progress. Warnings may or may not have been preceded by a Watch.
During the storm, like other events are responded to as reported.
Following the storm, a review of reports is conducted to determine if there are any damages reported. Public Works, Parks, and others respond in addition to Police and Fire to address immediate needs.
Should areas needing further assessment be identified, a rapid needs assessment will be conducted.
If structural damage is found, damage assessment teams will conduct a more detailed assessment to determine if State and/or Federal assistance is needed.
All storm related costs are tracked in the event insurance and/or public assistance become available to apply for.

Newport News Severe Weather Plan December, 2017
75
Reference Materials
Tornados

Newport News Severe Weather Plan December, 2017
76
Newport News Severe Weather Plan December, 2017
77
Extreme Heat
Introduction
Purpose:
The purpose of this plan is to establish procedures that identify specific criteria for opening designated City of Newport News facilities as cooling centers and for notifications to be disseminated to the appropriate City staff and the general public.
Scope:
This plan applies to all City departments and agencies that may be involved in planning, notification, or operating cooling centers during times of extreme heat conditions.
Definitions:
Extreme Heat Conditions: Any time the heat index value is at or above 105º F (41 °C).
Heat Index: Sometimes referred to as the apparent temperature is given in degrees Fahrenheit. The Heat Index is a measure of how hot it really feels when relative humidity is factored with the actual air temperature.
Heat Advisory: A NWS statement issued when there is an anticipated heat index of at least 105°F but less than 115°F for less than 3 hours per day or if nighttime low temperatures are above 80°F for 2 consecutive days.
Excessive Heat Warning: Extreme heat index making it feel very hot, typically above 105 °F for 3 hours or more during the day for two consecutive days or above 115 °F (46 °C) at any time.
Heat Wave: A heat wave is an extended period of extreme heat, and is often accompanied by high humidity. These conditions can be dangerous and even life-threatening for humans who do not take proper precautions.
Situation:
During times of extreme temperatures, it is important for individuals to monitor and limit their exposure to the heat. The very young, elderly, and those with certain medical conditions are especially vulnerable to prolonged exposure to excessive heat. In order to provide citizens with a safe place to get out of the heat, the city has designated certain facilities as cooling centers. These locations will be opened to the public during normal operating hours in order to provide an air-conditioned space to provide relief from the heat.
Assumptions:
1. There will be a significant number of days during the summer that meet or exceed the excessive heat threshold;
2. On any given day, there may significant number of people who do not have access to air-conditioned space;

Newport News Severe Weather Plan December, 2017
78
3. If promptly implemented, this plan can expedite relief and assistance for those adversely affected;
4. This plan has been developed as a first line means to provide relief; additional steps such as extending hours of operations will be taken at the direction of the Director of Emergency Management (City Manager).
5. This plan does not provide for any hydration, other than water fountains nor for any medical support.
6. Persons suffering from symptoms of severe heat stress should be encouraged to seek medical attention immediately
Policies:
Concept of Operations
Organization:
Under the direction of the Director of Emergency Services, the DEM is designated as the primary agency for activation of this plan. Any modifications to the plan will be at the discretion of the Director. Once the plan has been activated, each individual department will operate under their own policies and procedures unless otherwise directed by the Director of Emergency Services.
Responsibilities:
1. DEM
a. Monitor all pertinent NWS notifications and maintain a continuous state of situational awareness regarding heat conditions.
b. Maintain a list of the appropriate persons to notify when the NWS issues a heat warning.
c. Coordinate a plan of action for release of a public announcement with the facility operators and the PIO.
d. Provide support to other agencies as may be needed.
2. PIO
a. When notified of the decision to open cooling centers, prepare a statement with details of the operation for public dissemination containing all pertinent information
b. Once notified by the DEM, issue the statement to the public.
c. Issue updates as necessary.
3. Libraries/Parks and Recreation

Newport News Severe Weather Plan December, 2017
79
a. Designate representatives to serve as contact points for cooling station operation notification;
b. Ensure that facilities are properly staffed and prepared for cooling center operation;
c. Ensure that staff assigned to designated cooling center facilities have been properly briefed on proper procedures;
4. Supporting Departments/Organizations
a. Designate representatives to serve as contact points to receive information regarding cooling centers;
b. Be prepared to offer assistance as may be requested by the DEM or the facility operators;
Procedure:
The DEM staff will monitor weather statements issued by the NWS and maintain a situational awareness regarding potential heat related issues.
When the NWS issues a Heat Advisory or Heat Warning, the DEM will notify the identified primary agencies to coordinate the details of opening the cooling centers. Each primary agency will provide a point of contact to the DEM for notification purposes.
In most instances, the opening of the cooling centers have pre-established hours of opening and closing. If these details cannot be determined when the facilities are open, the default closing time will be the normal closing time of each individual facility unless otherwise directed by the Director of Emergency Services. Since Recreation Centers are closed to the public on Sundays, those facilities will not be included for Sunday opening unless authorized by the Director of Emergency Services.
Once the details have been established, the PIO will prepare a statement for dissemination to the public at a designated time.
The facility operators will make internal notifications to their staffs in order to have the cooling centers properly staffed at the designated opening time.
The DEM will make notifications to departments and organizations that may be called upon for assistance as situations arise.
In a Heat Wave, cooling centers may be necessary for extended periods. If the City of Newport News is in a Heat Wave, representatives from the Primary Agencies involved in this plan will hold a planning meeting to ensure that adequate preparations are made to handle the situation. Additionally, this may involve direct participation from the Supporting Departments/Organizations.

Newport News Severe Weather Plan December, 2017
80
Who is at highest risk:
People aged 65 and older
Infants and children
People with chronic medical conditions
Low income
Outdoor workers
Athletes Exposure to extreme natural heat poses a public health problem because it may result in heat-related illness (e.g., heat cramps, heat exhaustion, heat syncope, and heat stroke) and heat-related death. Exposure to extreme natural heat also may result in death because it exacerbates preexisting chronic conditions (e.g., cardiovascular, cerebral, and respiratory diseases), and because patients receiving psychotropic drug treatment for mental disorders and those taking medications that affect the body’s heat regulatory system or have anticholinergic effects are more susceptible to heat effects. Numerous studies have identified subpopulations at increased risk of heat-related morbidity and mortality: older adults, young children (0–4 years), males, and African Americans. Moreover, alcoholics, narcotics users, persons confined to bed or unable to care for themselves, socially isolated persons, those living on the top floor of multistory buildings, those without access to air conditioning, and persons who work or exercise outdoors are also at increased risk.

Newport News Severe Weather Plan December, 2017
81
Reference Materials

Newport News Severe Weather Plan December, 2017
82


