32
| www.gtai.com ©Chris Schmidt - istockphoto Sewage Sludge Treatment in Germany: Current Data & Facts Flérida Regueira Cortizo, Monique Heim, Johannes Ludsteck & Andreas Kessler 03.03.2015

| www.gtai.com
©Chri
s S
chm
idt
- is
tockphoto
Sewage Sludge Treatment in Germany: Current Data & Facts
Flérida Regueira Cortizo, Monique Heim, Johannes Ludsteck & Andreas Kessler
03.03.2015
03.03.2015 | www.gtai.com 2
I. Germany Trade & Invest
II. Regulatory Framework in Germany / Drivers
III. Data & Facts
IV. Advantages of Germany as an Investment Location

03.03.2015 | www.gtai.com 3
The Agency
The foreign trade and inward investment promotion agency of the
Federal Republic of Germany
Company Tasks
Investment Attraction
Location Promotion Export Promotion
German Parliament Resolutions for Founding/Financing
Federal Government
Federal Ministry of Economics and Energy - Shareholder

03.03.2015 | www.gtai.com 4
I. Germany Trade & Invest
II. Regulatory Framework in Germany / Drivers
III. Data & Facts
IV. Advantages of Germany as an Investment Location

03.03.2015 | www.gtai.com 5
Regulatory Framework in Germany
Source: 1) BMU/UBA – “Water Framework Directive – The way towards healthy waters”. based on the data of the portal WasserBLICK/BfG, status 03/2010, in
Profile of the German Water Sector, 2011 – Edited by ATT, BDEW, DBVW, DVGW, DWA, VKU – Graphics provided by BDEW (2013)
2) Coalition agreement from December 2013: own translation
Regulatory Framework – sewage sludge ordinance (AbfKlärV)
The sewage sludge ordinance (German: Klärschlammverordnung
(AbfKlärV)) regulates the application of sewage sludge on
agriculturally or horticulturally used soils. It contains
conditions for its use, maximum pollutant contents and
standards for soil sampling, sample preparation and the
examination of sewage sludge and soils.
In 2009, only 10 % of the surface water bodies and 62 % of
the groundwater bodies achieved the level as good status of
water bodies”. One of the main reasons for the non-
fulfillment was the diffuse nutrient pollution, mainly from
agricultural sources. In the case of groundwater, the main
reasons for not achieving the set targets consisted almost
always in diffuse nitrogen pollution (nitrate) from agricultural
sources.1
Groundwater bodies’ quality in 2009
Excerpt from the new coalition agreement (Dec 2013): „The protection of the water bodies against
nutrient contamination and pollutants shall increasingly and legally be regulated so that undesirable
developments are corrected. The application of sewage sludge for fertilization will be terminated
and phosphor and other nutrients will be recovered.“2

03.03.2015 | www.gtai.com 6
Consultative Communication on the Sustainable Use of Phosphorus
Source: European Commission 2013
COMMUNICATION FROM THE COMMISSION TO THE EUROPEAN PARLIAMENT, THE COUNCIL, THE EUROPEAN ECONOMIC AND SOCIAL
COMMITTEE AND THE COMMITTEE OF THE REGIONS
Consultative Communication on the Sustainable Use of Phosphorus
The purpose of this Consultative Communication is to draw attention to the sustainability of phosphorus use and to initiate a debate on the state of play and the actions that should be considered.
03.03.2015 | www.gtai.com 7
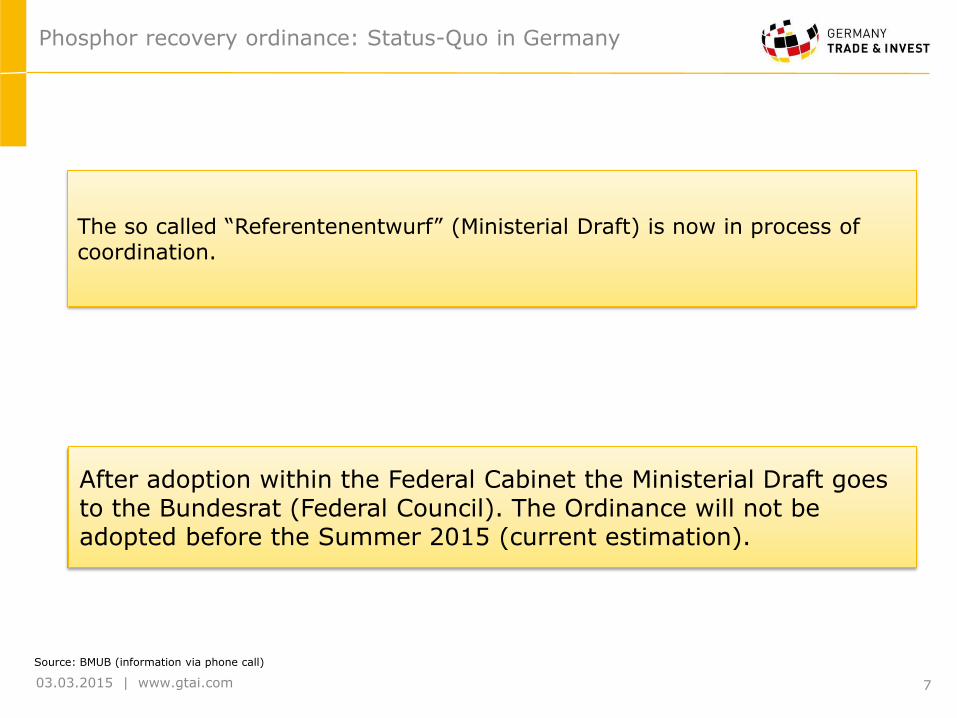
Phosphor recovery ordinance: Status-Quo in Germany
Source: BMUB (information via phone call)
The so called “Referentenentwurf” (Ministerial Draft) is now in process of coordination.
After adoption within the Federal Cabinet the Ministerial Draft goes to the Bundesrat (Federal Council). The Ordinance will not be adopted before the Summer 2015 (current estimation).

03.03.2015 | www.gtai.com 8
I. Germany Trade & Invest
II. Regulatory Framework in Germany / Drivers
III. Data & Facts
IV. Advantages of Germany as an Investment Location
03.03.2015 | www.gtai.com 9
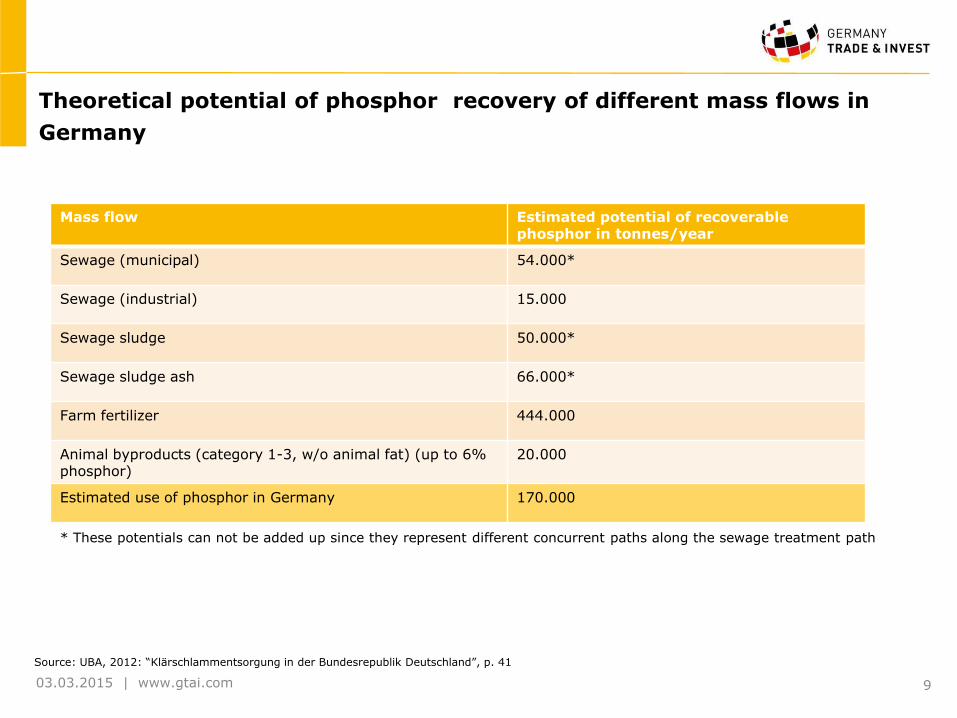
Source: UBA, 2012: “Klärschlammentsorgung in der Bundesrepublik Deutschland”, p. 41
Theoretical potential of phosphor recovery of different mass flows in
Germany
Mass flow Estimated potential of recoverable phosphor in tonnes/year
Sewage (municipal) 54.000*
Sewage (industrial) 15.000
Sewage sludge 50.000*
Sewage sludge ash 66.000*
Farm fertilizer 444.000
Animal byproducts (category 1-3, w/o animal fat) (up to 6% phosphor)
20.000
Estimated use of phosphor in Germany 170.000
* These potentials can not be added up since they represent different concurrent paths along the sewage treatment path

03.03.2015 | www.gtai.com 10
Source: UBA, 2012: “Klärschlammentsorgung in der Bundesrepublik Deutschland”, p. 54
Sewage sludge utilization in Europe in 2010
Amount of sewage sludge in million kg dry substance per year
2,000
1,640
1,500
1,300
1,280
95
17,4
30
50
0
20
14,3
70
20
1
10 13
25
20 25
30
80
11,3
65
15
5
15
92
11,1
65
10
20
0
0
10
20
30
40
50
60
70
80
90
100
share ofpopulation
connected to
municipal
sewage plant
share of totalEuropeanamount of
sewage sludge
agriculturalutilization
combustion landfill other options
%
Germany
United Kingdom
Italy
France
Spain
Utilization of sewage sludge in %
n.a
.
n.a
.

03.03.2015 | www.gtai.com 11
Source: UBA, 2012: “Klärschlammentsorgung in der Bundesrepublik Deutschland”, p. 44
Planned sewage sludge treatment plants in Germany (status 2010)
operator/ location technology input output amount of phosphor/year
status
VTS Koop Schiefer / Unterloquitz (Thuringia)
Thermal rotary furnace
30,000 tonnes/year animal byproducts
8,000 tonnes/year phosphate fertilizer
Approx. 1,100 tonnes In approval procedure
Feldmann IBS/ Nordwalde Soil Skimming Liquid pig manure (1.1 kg P/cbm)
P and straw Approx. 4.2 tonnes Not yet realized due to deficits in the means available
Ash Dec now Outotec (RETERRIA) (Brandenburg)
SUSAN thermo-chemical
Sewage sludge ash (approx. 9% P) (12,000 tonnes/year)
Approx. 10,000 tonnes/year phosphate fertilizer
Approx. 1,000 tonnes/year
Planned commissioning 2012/2013
Ingitec (Bavaria) Mephrec (metallurgical)
Sewage sludge (25% TS), 60,000 tonnes/year (or sewage sludge ash)
P-slag 12,000 tonnes/year
Approx. 500 tonnes Planned commissioning 2013
P-Roc (Neuburg) Cristallisation Sewage water P-fertilizer 20-30% of the dissolved phosphorous
Completion of pilot phase mid 2012
03.03.2015 | www.gtai.com 12
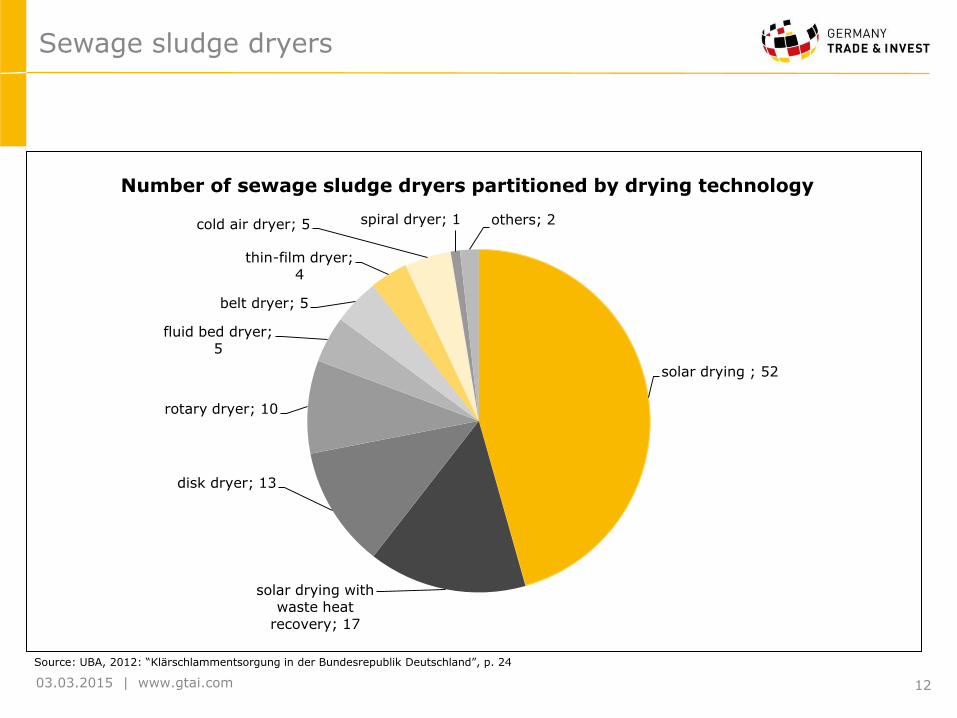
Sewage sludge dryers
Source: UBA, 2012: “Klärschlammentsorgung in der Bundesrepublik Deutschland”, p. 24
solar drying ; 52
solar drying with waste heat
recovery; 17
disk dryer; 13
rotary dryer; 10
fluid bed dryer; 5
belt dryer; 5
thin-film dryer; 4
cold air dryer; 5 spiral dryer; 1 others; 2
Number of sewage sludge dryers partitioned by drying technology

03.03.2015 | www.gtai.com 13
Source: UBA, 2013: “Klärschlammverbrennung – Stand und Perspektiven”, p. 3
In 2011 municipal sewage sludge amounted to 1,950,126 t of dry
substance (DS).
42
28
2,7
9
16
39
15,5
9
8,3
31,7
28,9
16
6,6
31,1
26,5
22,8
3,5
27,8
24,1
31,5
0,2
28,8
21,6
49,4
0,1
28,6
18,8
52,5
0
30,1
17,3
52,5
0
30
16,8
53,2
0
29,1
16,2
54,7
0
10
20
30
40
50
60
landfill agricultural utilisation landscaping,composting and other
material utilisation
combustion
Sh
are in
% o
f
dry s
ub
sta
nce*
1991
1995
1998
2001
2004
2007
2008
2009
2010
2011
*changeover of the method of collection data: summation of values before 2007 do not total to 100%
Sewage sludge disposal between 1991 and 2011

03.03.2015 | www.gtai.com 14
Costs of sewage sludge disposal (1)
Source: UBA, 2012: “Klärschlammentsorgung in der Bundesrepublik Deutschland”, p. 57
Costs of sewage sludge disposal (including costs of dewatering and transport) in
EUR per tonne of dry residue
0
50
100
150
200
250
300
350
400
450
agriculture, wet,approx. 4% dry
substance
agriculture,mechanicallydewatered,
approx. 25% drysubstance
recultivation,mechanicallydewatered,
approx. 25% drysubstance
co-incineration,mechanicallydewatered,
approx. 25% drysubstance
combustion,mechanicallydewatered,
approx. 25% drysubstance
co-incineration incement plant, drysubstance >90%
EU
R/
ton
ne
of
dry r
esid
ue

03.03.2015 | www.gtai.com 15
Costs of sewage sludge disposal (2)
Source: UBA, 2012: “Klärschlammentsorgung in der Bundesrepublik Deutschland”, p. 58
Costs of sewage sludge disposal
Disposal technology Costs of disposal (EUR per tonne of moist substance) condition
Min. Max.
Co-incineration in hard coal power plants
80 130 Dried >85%
Co-incineration in cement plants 90 100 Dried >85%
Combustion (Monoverbrennung) 80 120 Mechanically dewatered, 20-45% dry substance
Co-incineration in a waste incineration plant
80 100 Mechanically dewatered, 20-45% dry substance
Co-incineration in a hard-coal fired power plant
75 100 Mechanically dewatered, 20-45% dry substance
Co-incineration in a lignite-fired power plant
50 75 Mechanically dewatered, 20-45% dry substance
Recultivation 30 45 Mechanically dewatered, 20-45% dry substance
Agriculture, supra-regional 33 45 Mechanically dewatered, 20-45% dry substance
Agriculture, regional 25 30 Mechanically dewatered, 20-45% dry substance
Agriculture, liquid 8 12 Liquid, 4-5% dry substance

03.03.2015 | www.gtai.com 16
Maximum pollutant contents
Source: UBA, 2012: “Klärschlammentsorgung in der Bundesrepublik Deutschland”, p. 99
Sewage Sludge Ordinance (AbfKlärV ) 1992 Draft Sewage Sludge Ordinance (AbfKlärV) 2010
pollutant maximum pollutant content in mg/kg dry substance
soil sewage sludge soil* sewage sludge**
Heavy metals As Pb Cd Cr Cu Ni Hg Th Zn
100 1.5 100 60 50 1 200
900 10 900 800 200 8 2,500
40 – 100 0.4 – 1.5 30 – 100 20 – 60 15 – 70 0.1 – 1 60 – 200
18 150 3 120 800 100 2 1.5 1,800
Organic persistent pollutants PCB PCDD/PCDF B(a)P PFC (PFOA and PFOS)
0.2 per congener 100 ng/kg of dry substance
0.1 per congener 30 ng TE/kg of dry substance 1 0.1
AOx 500 400
Salmonella spp. No germs/ 50 g wet substance
* The maximum heavy metal contents may not exceed the prevention values from subparagraph 4.1 of the annex 2 of the Federal Soil Protection and
Contaminated Sites Ordinance (BBodSchV) in the corresponding effective version. The maximum contents apply according to the soil type. They are least for sand,
medium for clay/silt and highest for argil.
** The maximum contents for arsenic, lead, cadmium, chrome, copper, nickel, mercury, thallium, zinc and perfluorinated compounds are effective until
December 31, 2014. As of January 1, 2015 the maximum contents from annex 2, table 1, subparagraph 1.4 of the Fertiliser Ordinance (DüMV) are effective.
03.03.2015 | www.gtai.com 17
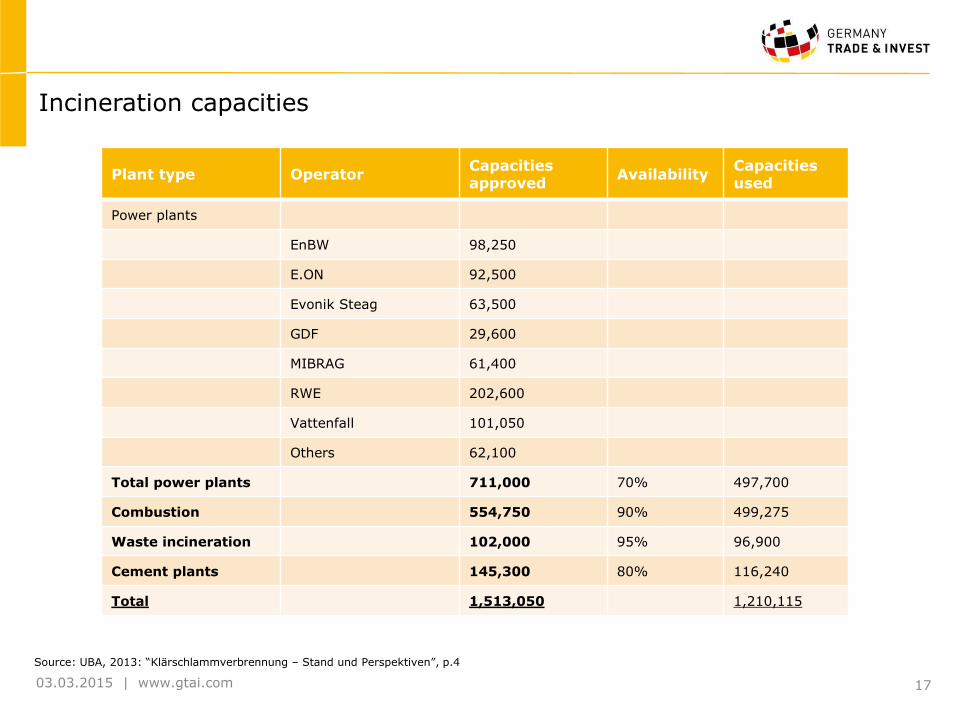
Source: UBA, 2013: “Klärschlammverbrennung – Stand und Perspektiven”, p.4
Incineration capacities
Plant type Operator Capacities approved
Availability Capacities used
Power plants
EnBW 98,250
E.ON 92,500
Evonik Steag 63,500
GDF 29,600
MIBRAG 61,400
RWE 202,600
Vattenfall 101,050
Others 62,100
Total power plants 711,000 70% 497,700
Combustion 554,750 90% 499,275
Waste incineration 102,000 95% 96,900
Cement plants 145,300 80% 116,240
Total 1,513,050 1,210,115
03.03.2015 | www.gtai.com 18
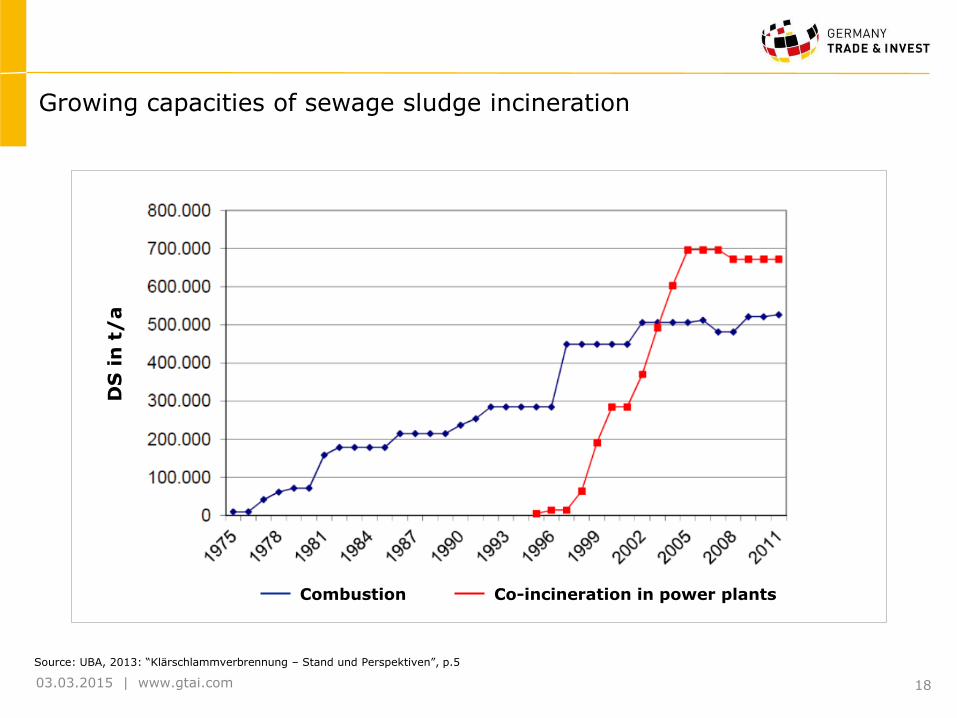
Source: UBA, 2013: “Klärschlammverbrennung – Stand und Perspektiven”, p.5
Growing capacities of sewage sludge incineration D
S i
n t
/a
Combustion Co-incineration in power plants

03.03.2015 | www.gtai.com 19
Source: UBA, 2013: “Klärschlammverbrennung – Stand und Perspektiven”, p.6
Selection of incineration plants for sewage sludge
Location Federal State
Operator Combustion technology
Capacity Operates since
[-] [-] [-] [DS in t/a] [-]
Plants mainly for municipal sewage sludge
Altenstadt BY Emter GmbH Grate-firing 55,000 2008
Balingen BW Zweckverband
Abwasserreinigung Balingen Fluidized-bed
gasifier 1,200 2002
Berlin-Ruhleben BE Berliner Wasserbetriebe Fluidized bed 84,100 1985
Plants mainly for industrial sewage sludge
Burghausen BY Wacker Chemie Fluidized bed 4,125 1976
Leverkusen NW Currenta GmbH Multiple-hearth
furnace 32,250 1988
Bitterfeld-Wolfen ST GKW Fluidized bed 15,200 1997
Gendorf/ Burgkirchen
BY Infraserv GmbH Fluidized bed 6,000 2006
03.03.2015 | www.gtai.com 20
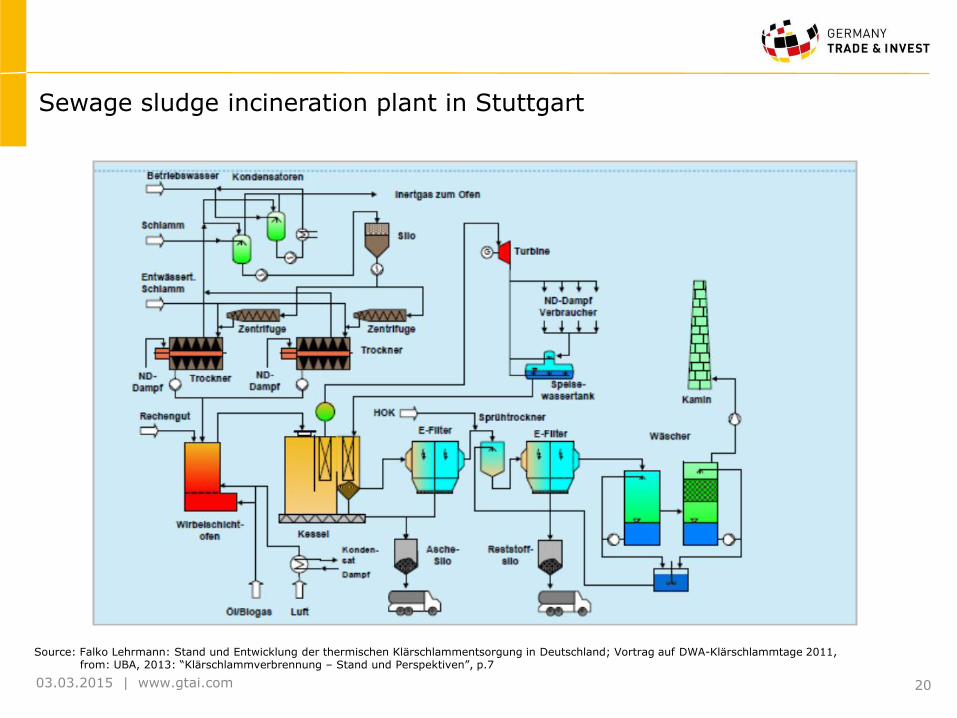
Source: Falko Lehrmann: Stand und Entwicklung der thermischen Klärschlammentsorgung in Deutschland; Vortrag auf DWA-Klärschlammtage 2011, from: UBA, 2013: “Klärschlammverbrennung – Stand und Perspektiven”, p.7
Sewage sludge incineration plant in Stuttgart

03.03.2015 | www.gtai.com 21
Sources: Pyreg GmbH; Sülzle Kopf Anlagenbau GmbH, from: UBA, 2013: “Klärschlammverbrennung – Stand und Perspektiven”, p. 8
Alternative processes
Sülzle Kopf: Sewage sludge gasification in Mannheim
PYREG: Sewage sludge carbonation

03.03.2015 | www.gtai.com 22
Sewage sludge can be co-incinerated in mechanically dewatered, dried or
partially dried form, both in brown coal and hard coal-fired power stations.
Source: RWE AG, from: UBA, 2013: “Klärschlammverbrennung – Stand und Perspektiven”, p. 10
Co-incineration in the power plant of Berrenrath

03.03.2015 | www.gtai.com 23
In power plants:
The additional use of sewage sludge must not endanger the utilization of ash or slag and FGD gypsum.
Technological and spatial requirements for a sewage sludge acceptation and co-incineration are not
present in every power plant.
Since there is a new generation of coal-fired power plants with optimised efficiency and the integration of
new materials, guarantee issues hinder the realisation of co-incineration for now.
If all coal-fired power plants in Germany would accept the co-incineration of sewage sludge with a share of
fuel of 4% (brown coal) and 1.5% (hard coal), theoretically about 4.3 mil tonnes of dry substance could be
burned every year.
Due to the strong increase of Renewable Energies in the last years, the use of coal-fired power stations is
getting more and more irregular.
In co-incineration plants:
Risk of dried sludge „sifting“ on the grate
Max. 20% sludge content in waste, otherwise sewage sludge can clump together and will not burn out
Increased dust and SO2 load in the raw exhaust gas
Source: UBA, 2013: “Klärschlammverbrennung – Stand und Perspektiven”, p. 11/12, 19
Barriers of co-incineration

03.03.2015 | www.gtai.com 24
Source: JohannTrenkwalder; Abwärmenutzung zur Klärschlammtrocknung und Mitverbrennung im Zementwerk; Vortrag auf DWA-Klärschlammtage 2011, from: UBA, 2013: “Klärschlammverbrennung – Stand und Perspektiven”, p. 14/ 15
Co-incineration in cement plants
Cement plant of Karlstadt (purely) Use of dried sewage sludge (>90% DS)
High level of phosphorus content can affect the quality of the cement
Increased mercury discharge needs to be considered (cf. 17. BImSchV)
Long revision periods in the winter season (security of disposal)
Increase of co-incineration capacities is not expected

03.03.2015 | www.gtai.com 25
Dried, partially dried or dewatered sewage sludge
Blending to waste by use of gripper or scattering devices
Source: UBA, 2013: “Klärschlammverbrennung – Stand und Perspektiven”, p. 17
Co-incineration in a waste incineration plant
Location Federal State
Operator
Burned Sludge from Municipal Waste Water Treatment [in Mg/a]
Bamberg BY Zweckverband Müllheizkraftwerk Stadt und Landkreis Bamberg 14,032
Coburg BY Zweckverband für Abfallwirtschaft in Nordwest-Oberfranken 3,314
Hamburg, Borsigstr. HH MVB GmbH 2,642
Hamburg, Rugenb. HH MVR Müllverwertung Rugenberger Damm GmbH & Co. KG 3,226
Hamburg, Stellingen HH Stadtreinigung Hamburg 12,150
Ingolstadt BY Zweckverband Müllverwertungsanlage Ingolstadt 628
Kamp-Lintfort NRW Kreis Weseler Abfallgesellschaft mbH & Co. KG 3,700
Cologne NRW AVG Köln mbH
Krefeld NRW EGK Entsorgungsgesellschaft Krefeld GmbH & Co. KG 1,281 / 11,872
Munich BY AWM – Abfallwirtschaftsbetrieb München 9,730
Velsen SL AVA Velsen GmbH 125
Würzburg BY Zweckverband Abfallwirtschaft Raum Würzburg 8,445
Zella-Mehlis TH Zweckverband für Abfallwirtschaft Südwestthüringen (ZASt) 2,848.76
Burgau BY Landkreis Günzburg Kreisabfallwirtschaftsbetrieb -
7 other plants, not known 4,250
4 values
Average value 5,424
Total 65,091

03.03.2015 | www.gtai.com 26
Source: Falko Lehrmann: Stand und Entwicklung der thermischen Klärschlammentsorgung in Deutschland; Vortrag auf DWA-Klärschlammtage 2011, from: UBA, 2013: “Klärschlammverbrennung – Stand und Perspektiven”, p.18
Co-incineration in EGK Krefeld

03.03.2015 | www.gtai.com 27
I. Germany Trade & Invest
II. Regulatory Framework in Germany / Drivers
III. Data & Facts
IV. Advantages of Germany as an Investment Location

03.03.2015 | www.gtai.com 28
General Introduction
Germany offers various public funding instruments for different business
activities.
Incentives in Germany
Mezzanine Capital
Grants Loans Equity Capital
Guarantees
Public funding instruments:
Personnel Investments Working Capital
Specific Purposes
Research & Development
Required funding for:
Financing available by any of the following public funding instruments (combinations of instruments usually possible)
www.gtai.com
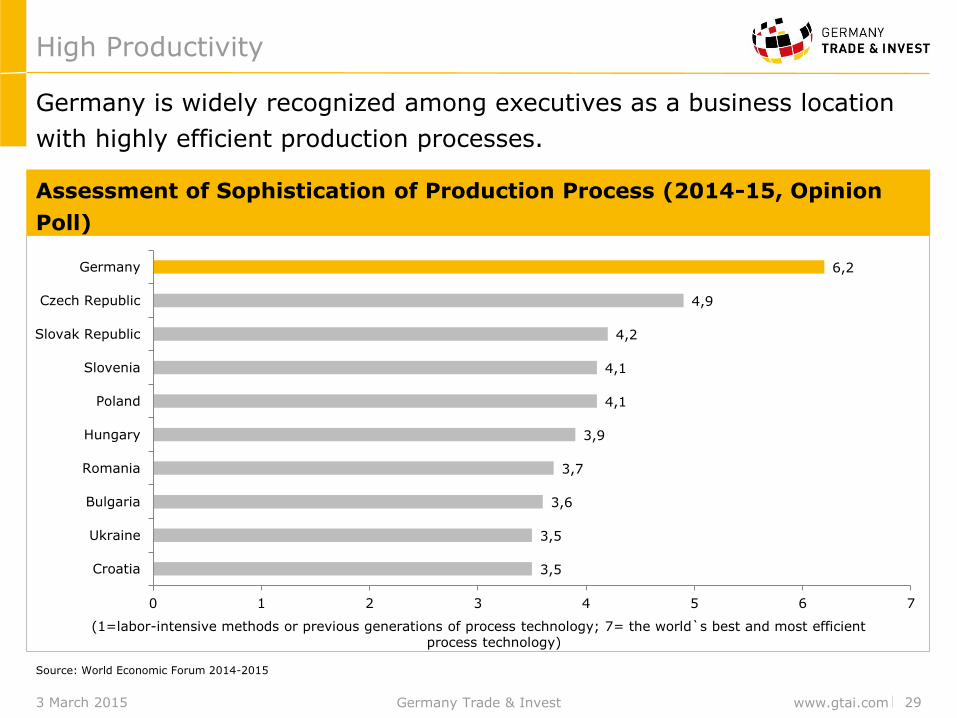
High Productivity
Assessment of Sophistication of Production Process (2014-15, Opinion
Poll)
Source: World Economic Forum 2014-2015
3 March 2015 29 Germany Trade & Invest
Germany is widely recognized among executives as a business location
with highly efficient production processes.
3,5
3,5
3,6
3,7
3,9
4,1
4,1
4,2
4,9
6,2
0 1 2 3 4 5 6 7
Croatia
Ukraine
Bulgaria
Romania
Hungary
Poland
Slovenia
Slovak Republic
Czech Republic
Germany
(1=labor-intensive methods or previous generations of process technology; 7= the world`s best and most efficient process technology)

www.gtai.com
Labor Costs
Growth of Labor Costs in Business Economy1 (2004-2013, yr. average
growth in %)
Germany has the most stable labor costs in Europe, one of the decisive
factors for Germany's competitiveness.
Note: 1Business Economy includes NACE Rev. 2, B-N
Source: Eurostat 2014
3 March 2015 30 Germany Trade & Invest
12,5
10,0
5,8
5,3
5,0
4,6
4,2
2,8
1,8
0,00 2,00 4,00 6,00 8,00 10,00 12,00 14,00
Romania
Bulgaria
Hungary
Poland
Slovak Rep.
Czech Rep.
Slovenia
EU-28
Germany
03.03.2015 | www.gtai.com 31
The share of thermal disposal on the total sewage sludge disposal increased
from 12 % in 1995 to present 54%
Gradual phase-out of agricultural recovery is striven and expected
Generation of new combustion capacities is necessary
Trend towards smaller decentralized plants
Alternative processes pushing on the market
Increment of the total capacity requires bigger plants
Need for optimization of existing systems (esp. combustion plants)
Research and subsidy requirements for phosphorus recovery
Probably restriction of co-incineration
Source: UBA, 2013: “Klärschlammverbrennung – Stand und Perspektiven”, p. 27/28
Perspectives of sewage sludge disposal according to the Federal Environmental Agency in 2013

www.gtai.com
Mumbai Office Tokyo Office
Berlin - Headquarters
Mr. Thomas Grigoleit Director Renewable Energies & Resources T. +49 30 200 099-224 [email protected]
Mr. Tobias Rothacher Senior Manager Photovoltaics and Bioenergy T. +49 30 200 099-225 [email protected]
Contact Data
Mr. Markus Hempel China Representative Beijing, China T. +86 10 6539 6725 F. +86 10 6590 6167 [email protected]
North America
Europe
Asia-Pacific
© 2015 Germany Trade & Invest All information provided by Germany Trade & Invest has been put together with the utmost care. However, we assume no liability for the accuracy of the information provided.
Mr. Iwami Asakawa Japan Representative Tokyo, Japan T. +81 3 5275 2072 F. +81 3 5275 2012 [email protected]
Mr. Claus Habermeier Director New York, USA T: +1 212 584 9715 F: +1 212 262 6449 [email protected]
Ms. Angelika Geiger Director San Francisco, USA T: +1 415 248 1246 F: +1 415 627 9169 [email protected]
Ms. Heena Nazir India Representative Mumbai, India T. +91 22 6665 2177 [email protected]
New York Office San Francisco Office
Beijing Office
Energy, Environment and Resources Division:
Mr. Heiko Staubitz Senior Manager Energy Storage and Smart Grid T. +49 30 200 099-226 [email protected]
Ms. David Warne Senior Manager Geo Energy T. +49 30 200 099-601 [email protected]
Ms. Esther Frey Manager Wind T. +49 30 200 099-253 [email protected]
Ms. Anne Bräutigam Manager Wind T. +49 30 200 099-228 [email protected]
Mr. Henning Ellermann Manager Energy Efficiency T. +49 30 200 099-257 [email protected]
Mrs. Flérida Regueira Cortizo Senior Manager Environmental Technologies T. +49 30 200 099-230 [email protected]


