77
Cobar Shire Council Sewerage Network Asset Management Plan Version 1.02 April 2013

Cobar Shire Council
Sewerage Network
Asset Management Plan
Version 1.02
April 2013

Cobar Shire Council – Sewerage Network Asset Management Plan
Document Control
Sewerage Network
Asset Management Plan
Document ID: cobarsc_2013_amp_sewer_v1
Rev No Date Revision Details Author Reviewer Approver
1.01 2/04/2013 First Draft for Review SV AM, JM,
TW
1.02 9/04/2013 Final Draft for Approval SV AM, TW
1.03 15/04/2013 Final SV TW TW
© Copyright 2012 – All rights reserved.
The Institute of Public Works Engineering Australia.
www.ipwea.org.au/namsplus
Cobar Shire Council – Sewerage Network Asset Management Plan
TABLE OF CONTENTS
1. EXECUTIVE SUMMARY................................................................................................................... 1 Context .......................................................................................................................................... 1 The Asset Plan Methodology ......................................................................................................... 1 What does it Cost?......................................................................................................................... 1 What we will do............................................................................................................................. 2 What we cannot do ....................................................................................................................... 2 Managing the Risks........................................................................................................................ 2 Confidence Levels .......................................................................................................................... 2 The Next Steps............................................................................................................................... 2
2. INTRODUCTION ............................................................................................................................. 4 2.1 Background............................................................................................................................ 4 2.2 Goals and Objectives of Asset Management.......................................................................... 6 2.3 Plan Framework..................................................................................................................... 7 2.4 Core and Advanced Asset Management ................................................................................ 9 2.5 Community Consultation ....................................................................................................... 9
3. LEVELS OF SERVICE ...................................................................................................................... 10 3.1 Customer Research and Expectations .................................................................................. 10 3.2 Strategic and Corporate Goals ............................................................................................. 10 3.3 Legislative Requirements..................................................................................................... 13 3.4 Current Levels of Service...................................................................................................... 15 3.5 Desired Levels of Service...................................................................................................... 19
4. FUTURE DEMAND ........................................................................................................................ 19 4.1 Demand Drivers................................................................................................................... 19 4.2 Demand Forecast................................................................................................................. 19 4.3 Demand Impact on Assets ................................................................................................... 19 4.4 Demand Management Plan ................................................................................................. 20 4.5 Asset Programs to meet Demand ........................................................................................ 21
5. LIFECYCLE MANAGEMENT PLAN .................................................................................................. 22 5.1 Background Data ................................................................................................................. 22 5.2 Infrastructure Risk Management Plan ................................................................................. 25 5.3 Routine Operations and Maintenance Plan ......................................................................... 26 5.4 Renewal/Replacement Plan................................................................................................. 29 5.5 Creation/Acquisition/Upgrade Plan..................................................................................... 33 5.6 Disposal Plan ....................................................................................................................... 35 5.7 Service Consequences and Risks .......................................................................................... 36
6. FINANCIAL SUMMARY ................................................................................................................. 37 6.1 Financial Statements and Projections .................................................................................. 37 6.2 Funding Strategy.................................................................................................................. 49 6.4 Key Assumptions made in Financial Forecasts ..................................................................... 52 6.5 Forecast Reliability and Confidence ..................................................................................... 52
7. PLAN IMPROVEMENT AND MONITORING.................................................................................... 54 7.1 Status of Asset Management Practices ................................................................................ 54 7.2 Improvement Program ........................................................................................................ 56 7.3 Monitoring and Review Procedures..................................................................................... 56 7.4 Performance Measures........................................................................................................ 57
8. REFERENCES................................................................................................................................. 58 9. APPENDICES ................................................................................................................................ 59
Appendix A Maintenance and Renewal Requirements to Sustain Levels of Service................. 60 Appendix B Projected 10 year Capital Renewal and Replacement Works Program.................. 61 Appendix C Projected Upgrade/Exp/New 10 year Capital Works Program .............................. 63 Appendix D Budgeted Expenditures Accommodated in LTFP................................................... 64 Appendix E Abbreviations ....................................................................................................... 65 Appendix F Glossary................................................................................................................ 66

1
Cobar Shire Council – Sewerage Network Asset Management Plan
1. EXECUTIVE SUMMARY
Context
Cobar Shire is situated in the centre of New South
Wales at the crossroads of the Barrier Highway and
the Kidman Way and has excellent road, rail and air
links to most of Australia's capital cities. With an area
of 45,609 square kilometres, the Shire is
approximately two-thirds the size of Tasmania. It is
home to approximately 5,120 people. The Shire's
prosperity is built around the thriving mining - copper,
lead, silver, zinc, gold - and pastoral industries, which
are strongly supported by a wide range of attractions
and activities, that make it a major tourist destination.
Council provides and maintains the Wastewater
systems and reticulation network in the town of
Cobar.
The Wastewater System network comprises:
• Pump Stations
• Treatment Works
• Sewerage Connection
• Sewerage Junctions
• Sewerage Manholes
• Sewerage Pipelines
• Sewerage Vent Stacks
These infrastructure assets have a replacement value
of $17,242,000.
The Asset Plan Methodology
One of the important aspects of the asset
management plan is the forecast of existing asset
renewal requirements. For the Cobar Shire Council
Sewerage Network Asset Management Plan, three
scenarios have been considered when developing the
forecast.
Scenario 1 uses the council’s asset register valuation
data to project the renewal costs. In this scenario the
acquisition year of an asset is added to the useful life
of the asset to estimate the year when renewal is due.
The cost to renew the asset category can be
aggregated to estimate the total renewal
requirements for each year of the planning period.
Scenario 2 uses capital renewal expenditure
projections assessed by technical staff. This
assessment uses a combination of detailed technical
analysis and an estimate of the average network
renewals required to sustain current service levels
over the next 10 years as a minimum.
Scenario 3 determines what can be achieved with the
available funds in the Long Term Financial Plan
therefore providing the resulting service level and risk
consequences.
The results for the 3 scenarios described are included
in this asset management plan and they reveal some
inconsistencies. Scenario 1 indicates that the funds to
meet the forecast renewal requirements can be met
by the current funding being planned and that the
condition of the network is good. The assessment
under Scenario 1 is inconsistent with the community
feedback on the satisfaction with Infrastructure and
also with the technical estimates made of the network
renewals required.
Scenario 2 was prepared using the technical estimates
of what renewal is required to sustain the current
levels of service, and this estimated that the renewal
requirements will be beyond the current funding
capacity of council. This position is more consistent
with the community feedback and the overall
assessment of the network made by Cobar Shire
Council Technical staff
Scenario 3 is a reflection of the actual funding
available. The difference between Scenario 2 and
Scenario 3 represents “what we can’t do”. The
discussion about this “gap” will lead us into a much
better informed community discussion about what are
achievable and acceptable service levels, as well as
giving a focus on managing risk
It is most probable that the valuation registers used in
Scenario 1 are not yet developed to a level of maturity
where they are reliable for producing a realistic
renewal forecast. Ideally when this asset register is
sorted by remaining life from 1 to 10 years this should
be consistent with the capital renewal program. For
Cobar Shire Council the refinement of the asset
register to achieve this situation should become an
important part of the asset management
improvement plan.
What does it Cost?
The forecast of the projected outlays necessary to
provide the services covered by this Asset
Management Plan (AM Plan) includes operations,
maintenance, renewal and upgrade of existing assets
over the 10 year planning period is $9,084,000 or
$908,000 on average per year. This is based on the
Scenario 2 methodology as it is currently the most
reliable estimate.
2
Cobar Shire Council – Sewerage Network Asset Management Plan
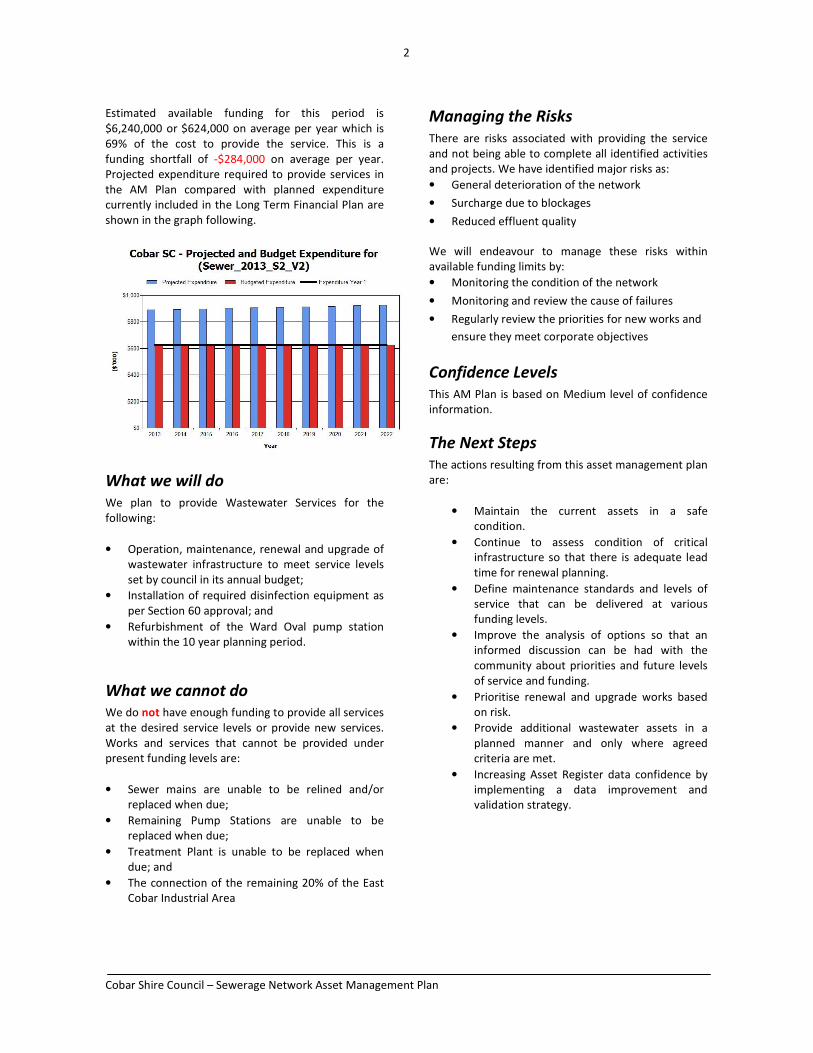
Estimated available funding for this period is
$6,240,000 or $624,000 on average per year which is
69% of the cost to provide the service. This is a
funding shortfall of -$284,000 on average per year.
Projected expenditure required to provide services in
the AM Plan compared with planned expenditure
currently included in the Long Term Financial Plan are
shown in the graph following.
What we will do
We plan to provide Wastewater Services for the
following:
• Operation, maintenance, renewal and upgrade of
wastewater infrastructure to meet service levels
set by council in its annual budget;
• Installation of required disinfection equipment as
per Section 60 approval; and
• Refurbishment of the Ward Oval pump station
within the 10 year planning period.
What we cannot do
We do not have enough funding to provide all services
at the desired service levels or provide new services.
Works and services that cannot be provided under
present funding levels are:
• Sewer mains are unable to be relined and/or
replaced when due;
• Remaining Pump Stations are unable to be
replaced when due;
• Treatment Plant is unable to be replaced when
due; and
• The connection of the remaining 20% of the East
Cobar Industrial Area
Managing the Risks
There are risks associated with providing the service
and not being able to complete all identified activities
and projects. We have identified major risks as:
• General deterioration of the network
• Surcharge due to blockages
• Reduced effluent quality
We will endeavour to manage these risks within
available funding limits by:
• Monitoring the condition of the network
• Monitoring and review the cause of failures
• Regularly review the priorities for new works and
ensure they meet corporate objectives
Confidence Levels
This AM Plan is based on Medium level of confidence
information.
The Next Steps
The actions resulting from this asset management plan
are:
• Maintain the current assets in a safe
condition.
• Continue to assess condition of critical
infrastructure so that there is adequate lead
time for renewal planning.
• Define maintenance standards and levels of
service that can be delivered at various
funding levels.
• Improve the analysis of options so that an
informed discussion can be had with the
community about priorities and future levels
of service and funding.
• Prioritise renewal and upgrade works based
on risk.
• Provide additional wastewater assets in a
planned manner and only where agreed
criteria are met.
• Increasing Asset Register data confidence by
implementing a data improvement and
validation strategy.

3
Cobar Shire Council – Sewerage Network Asset Management Plan
Questions you may have
What is this plan about?
This asset management plan covers the sewer
infrastructure assets that serve the Cobar Shire’s
community’s wastewater needs. These assets include:
• Pump Stations
• Treatment Works
• Sewerage Connection
• Sewerage Junctions
• Sewerage Manholes
• Sewerage Pipelines
• Sewerage Vent Stacks
These assets have been provided throughout the
Council area and contribute to good public health for
the community and protection of the environment.
What is an Asset Management Plan?
Asset management planning is a comprehensive
process to ensure delivery of services from
infrastructure is provided in a financially sustainable
manner.
An asset management plan details information about
infrastructure assets including actions required to
provide an agreed level of service in the most cost
effective manner. The plan defines the services to be
provided, how the services are provided and what
funds are required to provide the services.
Why is there a funding shortfall?
A proportion of the organisation’s sewer network was
constructed by developers and from government
grants, often provided and accepted without ongoing
operations, maintenance and replacement needs.
As these assets are approaching the later years of their
life and require replacement, services from the assets
are decreasing and maintenance costs are increasing.
Our present funding levels are insufficient to provide
the required sewer network renewal and upgrades.
What options do we have?
Resolving the funding shortfall involves several steps:
1. Improving asset knowledge so that data
accurately records the asset inventory, how assets
are performing and when assets are not able to
provide the required service levels,
2. Improving our efficiency in operating,
maintaining, renewing and replacing existing
assets to optimise life cycle costs,
3. Identifying and managing risks associated with
providing services from infrastructure,
4. Making trade-offs between service levels and
costs to ensure that the community receives the
best return from infrastructure,
5. Identifying assets surplus to needs for disposal to
make saving in future operations and
maintenance costs,
6. Consulting with the community to ensure that
wastewater systems services and costs meet
community needs and are affordable,
7. Developing partnership with other bodies, where
available to provide services,
8. Seeking additional funding from governments and
other bodies to better reflect a ‘whole of
government’ funding approach to infrastructure
services.
What happens if we don’t manage the shortfall?
It is likely that we will have to reduce service levels in
some areas, unless new sources of revenue are found.
For the Sewerage network the service level reduction
may include:
• Reduction in effluent quality;
• Environmental license requirements may be
compromised; and
• Increased odour and blockage complaints.
What can we do?
We can develop options, costs and priorities for future
wastewater services, consult with the community to
plan future services to match the community service
needs with ability to pay for services and maximise
community benefits against costs.

4
Cobar Shire Council – Sewerage Network Asset Management Plan
2. INTRODUCTION
2.1 Background
The purpose of Cobar’s wastewater system is to collect, and treat wastewater, meeting health and environmental
guidelines, and provide a clean and healthy environment that meets community expectations. The system accepts
domestic waste, as well as commercial and industrial trade waste pre-treated to domestic strength.
Cobar Shire Council is responsible for the management of one wastewater reticulation and treatment system
consisting of approximately 42.6 km of 150 to 380mm diameter AC, PVC and reinforced concrete mains. These mains
are generally in good condition although AC pipe is a medium not known for reliable service in gravity sewers. Three
pumps stations transport sewerage from low points to the main pump station at Ward Oval which then pumps the
sewerage to the treatment plant.
The treatment plant consists of an aeration tank and effluent ponds. The treated effluent is stored in ground tanks
prior to reuse for irrigation on Ward Oval and the Cobar Golf Course. Other development in the Cobar LGA utilises on-
site treatment and disposal facilities for the management of wastewater.
The infrastructure needed to provide this service includes:
• Pump Stations
• Treatment Works
• Sewer Connection
• Sewer Junctions
• Sewer Manholes
• Sewer Pipelines
• Sewer Vent Stacks
This asset management plan is to demonstrate responsive management of assets (and services provided from assets),
compliance with regulatory requirements, and to communicate funding needed to provide the required levels of
service over a 20 year planning period.
The asset management plan follows the format for AM Plans recommended in Section 4.2.6 of the International
Infrastructure Management Manual1.
The asset management plan is to be read with the organisation’s Asset Management Policy, Asset Management
Strategy and the following associated planning documents:
• NSW DLG Integrated Planning Guidelines and Manual 2013
• Cobar Shire Council, ‘Community Strategic Plan 2025’
• Cobar Shire Council, ‘Delivery Program 2012/2013 – 2015/2016’
• Cobar Shire Council, ‘Annual Operational Plan 2012/2013’,
• Cobar Shire Council, ‘Resource Strategy 2012/2013’ - Incorporating Long Term Financial Plan, Workforce
Strategy, Asset Management Strategy and Policy,
• Cobar Shire Council, 2009, ‘Valuation of Water Supply and Sewerage Assets as at 30 June 2009’.
This infrastructure assets covered by this asset management plan are shown in Table 2.1. These assets are used to
support a broad range of services to the community.
1 IPWEA, 2011, Sec 4.2.6, Example of an Asset Management Plan Structure, pp 4|24 – 27.

5
Cobar Shire Council – Sewerage Network Asset Management Plan
Table 2.1: Assets covered by this Plan
Asset (Sub)Category Dimension Replacement Value
Reticulation network Total Length 42.6 km of various
sizes ranging from 150mm to
380mm in diameter
$10,780,500
Pump Stations and Rising Main Belagoy Street
Ward Oval
Nullamut Street
Cowper Street
1 Effluent Reuse pump
$2,513,250
Treatment Works 1 Tertiary Treatment Plant
Design capacity of 140L/sec –
Currently operates at 105L/sec
$3,952,750
TOTAL $17,246,500
Key stakeholders in the preparation and implementation of this asset management plan are: Shown in Table 2.1.1.
Table 2.1.1: Key Stakeholders in the AM Plan
Key Stakeholder Role in Asset Management Plan
Elected Members and PAG members Endorsement of the asset management policy, strategy and plans. Set
high level direction through the development of asset management
principles in the Community Strategic Plan.
Senior Management Endorse the development of asset management plans and provide the
resources required to complete this task. Set high level priorities for
asset management development in Council and raise the awareness of
this function among Council staff and contractors. Support the
implementation of actions resulting from this plan and prepared to make
changes to a better way of managing assets and delivering services.
Support for an asset management driven budget and LTFP.
Corporate Services Consolidating the asset register and ensuring the asset valuations are
accurate. Development of supporting policies such as capitalisation and
depreciation. Preparation of asset sustainability and financial reports
incorporating asset depreciation in compliance with current Australian
accounting standards. AM and GIS support and admin.
Field Services Staff Provide local knowledge level detail on all road assets. They verify the
size, location and condition of assets. They can describe the maintenance
standards deployed and Council’s ability to meet technical and customer
levels of service.
Asset Management Consultants Provide support for the development of asset management plans and the
implementation of effective asset management principles within Council.
Also independently endorse asset revaluation methodology.
External Parties Community residents & businesses;
Tourist and Visitors (as occasional users);
Emergency services;
Developers & Utility companies;
Local Businesses and;
Federal and State Government authorities & agencies such as regulators,
local law enforcement and land use/development planning.
6
Cobar Shire Council – Sewerage Network Asset Management Plan
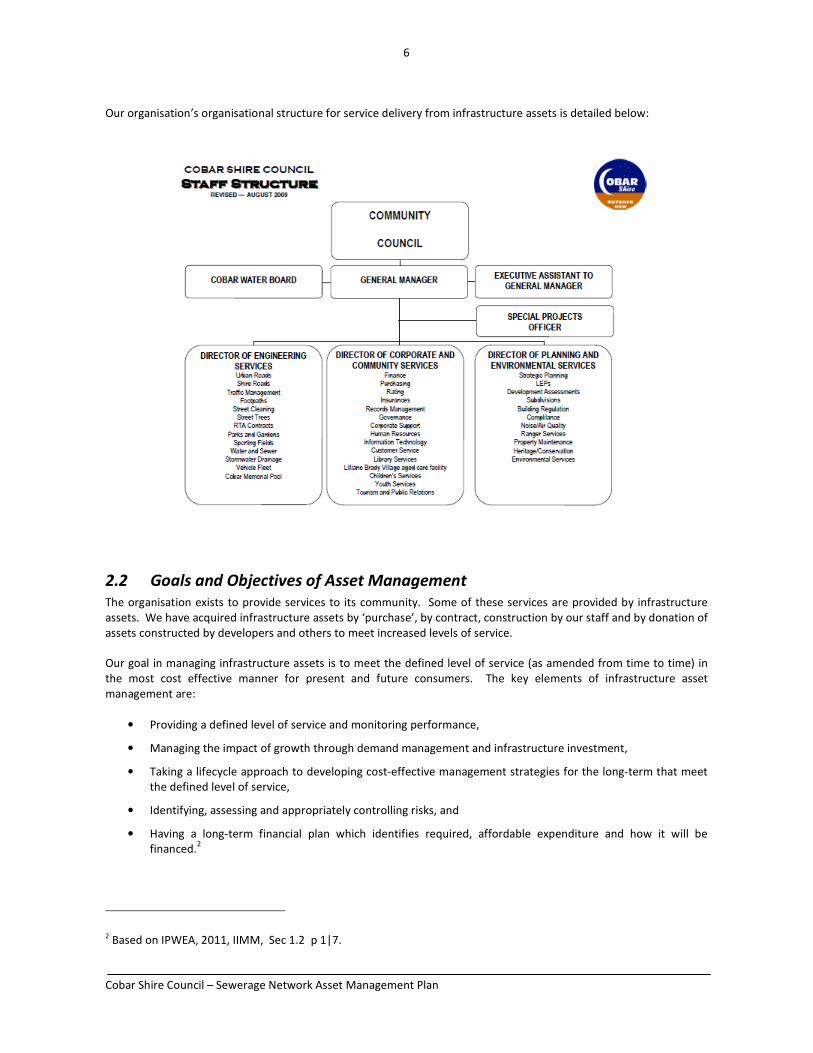
Our organisation’s organisational structure for service delivery from infrastructure assets is detailed below:
2.2 Goals and Objectives of Asset Management
The organisation exists to provide services to its community. Some of these services are provided by infrastructure
assets. We have acquired infrastructure assets by ‘purchase’, by contract, construction by our staff and by donation of
assets constructed by developers and others to meet increased levels of service.
Our goal in managing infrastructure assets is to meet the defined level of service (as amended from time to time) in
the most cost effective manner for present and future consumers. The key elements of infrastructure asset
management are:
• Providing a defined level of service and monitoring performance,
• Managing the impact of growth through demand management and infrastructure investment,
• Taking a lifecycle approach to developing cost-effective management strategies for the long-term that meet
the defined level of service,
• Identifying, assessing and appropriately controlling risks, and
• Having a long-term financial plan which identifies required, affordable expenditure and how it will be
financed.2
2 Based on IPWEA, 2011, IIMM, Sec 1.2 p 1|7.

7
Cobar Shire Council – Sewerage Network Asset Management Plan
2.3 Plan Framework
Key elements of the plan are
• Levels of service – specifies the services and levels of service to be provided by Council,
• Future demand – how this will impact on future service delivery and how this is to be met,
• Life cycle management – how we will manage our existing and future assets to provide defined levels of
service,
• Financial summary – what funds are required to provide the defined services,
• Asset management practices,
• Monitoring – how the plan will be monitored to ensure it is meeting the organisation’s objectives,
• Asset management improvement plan.
A road map for preparing an asset management plan is shown below.

8
Cobar Shire Council – Sewerage Network Asset Management Plan
Road Map for preparing an Asset Management Plan
Source: IPWEA, 2006, IIMM, Fig 1.5.1, p 1.11.
IS THE PLAN
AFFORDABLE?
CORPORATE PLANNING
Confirm strategic objectives and establish AM
policies, strategies & goals.
Define responsibilities & ownership.
Decide core or advanced AM Pan.
Gain organisation commitment.
REVIEW/COLLATE ASSET INFORMATION
Existing information sources
Identify & describe assets.
Data collection
Condition assessments
Performance monitoring
Valuation Data
ESTABLISH LEVELS OF SERVICE
Establish strategic linkages
Define & adopt statements
Establish measures & targets
Consultation
LIFECYCLE MANAGEMENT STRATEGIES
Develop lifecycle strategies
Describe service delivery strategy
Risk management strategies
Demand forecasting and management
Optimised decision making (renewals, new works,
disposals)
Optimise maintenance strategies
FINANCIAL FORECASTS
Lifecycle analysis
Financial forecast summary
Valuation Depreciation
Funding
IMPROVEMENT PLAN
Assess current/desired practices
Develop improvement plan
ITERATION
Reconsider service statements
Options for funding
Consult with Council
Consult with Community
DEFINE SCOPE &
STRUCTURE OF PLAN
AM PLAN
REVIEW AND
AUDIT
IMPLEMENT
IMPROVEMENT
STRATEGY
ANNUAL PLAN /
BUSINESS PLAN

9
Cobar Shire Council – Sewerage Network Asset Management Plan
2.4 Core and Advanced Asset Management
This asset management plan is prepared as a ‘core’ asset management plan over a 20 year planning period in
accordance with the International Infrastructure Management Manual3. It is prepared to meet minimum legislative
and organisational requirements for sustainable service delivery and long term financial planning and reporting. Core
asset management is a ‘top down’ approach where analysis is applied at the ‘system’ or ‘network’ level.
Future revisions of this asset management plan will move towards ‘advanced’ asset management using a ‘bottom up’
approach for gathering asset information for individual assets to support the optimisation of activities and programs
to meet agreed service levels.
2.5 Community Consultation
This ‘core’ asset management plan is prepared to facilitate community consultation initially through feedback on
public display of draft asset management plans prior to adoption by the Council. Future revisions of the asset
management plan will incorporate community consultation on service levels and costs of providing the service. This
will assist the Council and the community in matching the level of service needed by the community, service risks and
consequences with the community’s ability and willingness to pay for the service.
3 IPWEA, 2011, IIMM.

10
Cobar Shire Council – Sewerage Network Asset Management Plan
3. LEVELS OF SERVICE
3.1 Customer Research and Expectations
Council has not carried out any research on customer expectations. This will be investigated for future updates of the
asset management plan.
3.2 Strategic and Corporate Goals
This asset management plan is prepared under the direction of the organisation’s vision, mission, goals and objectives.
Our vision:
“Our Vision is for Cobar Shire to be an attractive, healthy and caring environment in which to live, work and play,
achieved in partnership with the community through initiative, foresight and leadership.”
Our mission:
“Our Mission is to provide sound and sensible government and ensure that works and services are delivered
effectively and equitably to the community of Cobar Shire.”
Our Values:
Council has adopted the following Values that should be reflected in how the whole organisation operates and
interacts with others:
o Continually strive for improvement in every aspect of Council’s activities and recognise initiative.
o All activities are to be customer focused and provide equity for all.
o Involve the community in decision making through open government and consultative processes.
o Foster and promote sustainable ecological and economic development, rural pursuits and industries
that contribute to the wealth of the region and in keeping with the environment and residents
lifestyle.
o Conserve and protect the natural beauty of the area.
o Promote a spirit of regional cooperation particularly in regard to planning, infrastructure, economic
development, tourism and employment.
Relevant organisation goals and objectives and how these are addressed in this asset management plan are:

11
Cobar Shire Council – Sewerage Network Asset Management Plan
Table 3.2: Organisation Goals and how these are addressed in this Plan
Principles and Goals Objective How Goal and Objectives are addressed in
the AMP
To establish agreed Levels of
Service and ensure compliance
Level of Service statements updated by
March 2014
Maintain an up to date Strategic Business
Plan
To provide services to existing
areas at current levels and to all
remaining un-serviced urban and
village areas where economically
feasible
Council to be appraised of opportunities
Economic feasibility of East Cobar
Industrial Area scheme finalised by March
2014.
A pricing system for sewerage and
trade waste that is equitable and
reflects the actual cost of service
provision and use, between
classes of existing customers over
time
Equitable pricing structure for residential
and non-residential customers by June
2013.
Revenue sufficient to cover requirements
in line with Financial Plan
Minimise hydraulic load and need
for capital works
Manage industrial / commercial
biological load
Quantify and reduce discharge from storm
water
Prepare Trade Waste Register by
December 2013.
To keep the Community informed
of sewerage services and be
responsive to its needs
Customer complaints management system
developed and implemented by June 2014.
Customer Service
To consult communities and
consider their views in all major
expenditure decisions
To raise community interest in
sewerage service decisions
Community consultation undertaken prior
to implementation of best practice pricing
structure.
Community consulted for extending the
effluent reuse reticulation
Environment To achieve minimal impact from
operations on local environment
to ensure ongoing sustainable
development.
No contravention of EPA requirements
Reuse of effluent / sludge to agreed
program.
To develop an operations plan
including procedures and
guidelines to ensure a reliable safe
and cost effective service
Document System Operating Rules and
Performance by March 2014.
Develop SCADA system by June 2014.
Number of system breakdowns due to
operations deficiencies reduced.
Asset Management
To maintain and rehabilitate the
existing system to meet agreed
levels of service at least cost
Develop maintenance strategy /
procedures and timetables by June 2013
Prepare Contingency Plan by June 2013
Annual maintenance program completed
on time and within budget

12
Cobar Shire Council – Sewerage Network Asset Management Plan
Develop a capital works program
that supplies system needs at
minimum long-term cost.
Develop gradual asset
replacement program
Establish an up to date 10 year capital
renewal and upgrade/new works program
(at a program level) by March 2014.
Complete capital works as outlined in
program within time and budget
Human Resources To provide appropriate level of
skilled staff to meet the service
delivery objectives
To ensure staff have relevant
skills and training and receive
the appropriate level of support
Training in line with skills audit/ training
plan
Implementation of succession training
program
Finance To prepare and implement long
term financial plans to provide
required services at an affordable
level
Update Financial Plan by March 2014.
Annual budget prepared based on
Financial Plan
The Council will exercise its duty of care to ensure public safety in accordance with the infrastructure risk
management plan prepared in conjunction with this AM Plan. Management of infrastructure risks is covered in
Section 5.2

13
Cobar Shire Council – Sewerage Network Asset Management Plan
3.3 Legislative Requirements
We have to meet many legislative requirements including Australian and State legislation and State regulations.
These include:
Table 3.3: Legislative Requirements
Legislation Requirement
Local Government Act 1993
Sets out role, purpose, responsibilities and powers of local governments.
The purposes of this Act are as follows:
(a) to provide the legal framework for an effective, efficient,
environmentally responsible and open system of local government in New
South Wales,
(b) to regulate the relationships between the people and bodies comprising
the system of local government in New South Wales,
(c) to encourage and assist the effective participation of local communities
in the affairs of local government,
(d) to give councils:
• the ability to provide goods, services and facilities, and to carry out
activities, appropriate to the current and future needs of local communities
and of the wider public
• the responsibility for administering some regulatory systems under this
Act
• a role in the management, improvement and development of the
resources of their areas,
(e) to require councils, councillors and council employees to have regard to
the principles of ecologically sustainable development in carrying out their
responsibilities.
The land management provisions of the Act require that Council prepare
plans of management for all community land. The plan of management
identifies the management objectives for the land category, performance
indicators and performance measures to meet the objectives identified.
Local Government Amendment
(Planning and Reporting) Act 2009
Local Government Amendment (Planning and Reporting) Act 2009 includes
the preparation of a long term financial plan supported by asset
management plans for sustainable service delivery.
Work Health & Safety Act 2011 Sets out roles and responsibilities to secure the health, safety and welfare
of persons at work and covering injury management, emphasising
rehabilitation of workers particularly for return to work. Council is to
provide a safe working environment and supply equipment to ensure
safety.
Environmental Planning and
Assessment Act 1979
An Act to institute a system of environmental planning and assessment for
the State of New South Wales. Among other requirements the Act outlines
the requirement for the preparation of Local Environmental Plans (LEP),
Development Control Plans (DCP), Environmental Impact Assessments (EIA)
and Environmental Impact Statements.
Environmental Protection Act 1994 This act sets out requirements in respect to environmental protection

14
Cobar Shire Council – Sewerage Network Asset Management Plan
Legislation Requirement
Public Health Act 1991 Prevention of the spread of disease.
Effluent disposal methods.
Delivery of quality water.
Catchment Management Act 1989 Promotes the coordination of activities within catchment areas. Council
believes this Act has implications for the management of river quality and
quantity.
Requirement for ongoing management plan.
Water Management Act 2000 The act provides for sustainable and integrated management of NSW’s
water sources.
Water rights, licences, allocations.
Environmental Planning and
Assessment Act 1979
An Act to institute a system of environmental planning and assessment for
the State of New South Wales. Among other requirements the Act outlines
the requirement for the preparation of Local Environmental Plans (LEP),
Development Control Plans (DCP), Environmental Impact Assessments (EIA)
and Environmental Impact Statements.
Protection of the Environment
Operations Act 1997
Brings together:
- Clean Air Act 1961
- Clean Waters Act 1970
- Pollution Control Act 1970
- Noise Control Act 1975
- Environmental Offences and
Penalties (EOP) Act 1989
Regulating pollution activities and issue of licenses as well as the
monitoring of and reporting on waste output.
Council is required to be “duly diligent” in
undertaking the scheme operations
Soil Conservation Act 1938 Conserves soil resources and farm water resources and the mitigation of
erosion and land degradation.
Preservation of watercourse environments.
Plant Protection Act 1989 This act sets out requirements in respect to Flora Protection
Environmental Protection Act 1994 This act sets out requirements in respect to environmental protection
Threatened Species Conservation
Act, 1995
An Act to conserve threatened species, populations and ecological
communities of animals and plants.
Under the terms of this Act Council is required to ensure the long term
survival of the species identified.
Rivers and Foreshores
Improvements Act, 1948
An Act to provide for the carrying out of works for the removal of
obstructions from and the improvement of rivers and foreshores and the
prevention of erosion of lands by tidal and non-tidal waters
Protection of the Environment
Operations Act 1997
Council is required to exercise due diligence to avoid environmental impact
and among others are required to develop operations emergency plans and
due diligence plans to ensure that procedures are in place to prevent or
minimise pollution.
National Parks and Wildlife Act
(1974)
An Act relating to the establishment, preservation and management of
national parks, historic sites and certain other areas and the protection of
certain fauna, native plants and Aboriginal objects
Native Vegetation Act 2003 This Act regulates the clearing of native vegetation on all land in NSW,
except for excluded land listed in Schedule 1 of the Act. The Act outlines
what landowners can and cannot do in clearing native vegetation.
Public Works Act 1912 Sets out the role of Council in the planning and construction of new assets.
Electrical Safety Act 2002 This act sets out the installation, reporting and safe use with electricity
Building Regulation 2003 This act sets out requirements in respect to Building Requirements

15
Cobar Shire Council – Sewerage Network Asset Management Plan
Legislation Requirement
Plumbing and Drainage Act 2002 This act sets out requirements in respect to Plumbing Requirements
Dangerous Goods Safety
Management Act 2001
This act sets out the safe use, storage and disposal of dangerous goods
Public Records Act 2002 This act sets out requirements in respect maintaining Public Records
Civil Liability Act, 2002 An Act to make provision in relation to the recovery of damages for death
or personal injury caused by the fault of a person
3.4 Current Levels of Service
We have defined service levels in two terms.
Community Levels of Service measure how the community receives the service and whether the organisation is
providing community value.
Community levels of service measures used in the asset management plan are:
Quality How good is the service?
Function Does it meet users’ needs?
Capacity/Utilisation Is the service over or under used?
Technical Levels of Service - Supporting the community service levels are operational or technical measures of
performance. These technical measures relate to the allocation of resources to service activities that the organisation
undertakes to best achieve the desired community outcomes and demonstrate effective organisational performance.
Technical service measures are linked to annual budgets covering:
• Operations – the regular and/or intangible activities or costs to provide services (e.g. energy costs,
compliance testing, etc.),
• Maintenance – the activities necessary to retain an asset as near as practicable to an appropriate service
condition (e.g. pump servicing and sewer main repairs),
• Renewal – the activities that return the service capability of an asset up to that which it had originally (e.g.
pipeline replacement of same size or capacity and/or reline existing sewer mains),
• Upgrade/New – the activities to provide a higher level of service (e.g. replacing a pipeline with a larger size)
or a new service that did not exist previously (e.g. a new sewer main or sewerage scheme).
Asset managers plan, implement and control technical service levels to influence the customer service levels.4
Our current service levels are detailed in Table 3.4.
4 IPWEA, 2011, IIMM, p 2.22

16
Cobar Shire Council – Sewerage Network Asset Management Plan
Table 3.4: Current and Desired Service Levels
COMMUNITY LEVELS OF SERVICE
Theme Community
Expectation Measure
Current Service
Level Response
Acceptable Level of
Service Response
Disposal has no
impact on natural
Watercourses
Customer surveys
and Customer
requests
Community Planning
Number of
surcharges or
overflows
% of network that is
poor or very poor
To be provided
from the Resident
Survey and
Community Plan
research
Frequent wet
weather
surcharges
Has not been fully
assessed at this
time
Requests received
should not increase
annually
No dry weather
discharges and
minimise wet weather
discharges
Quality
No smells Customer requests 0 per annum 0 per annum
Function Connections are
available
Customer surveys
and Customer
requests and
Community Planning
% of network that is
poor or very poor
To be provided
from the Resident
Survey and
Community Plan
research
Has not been fully
assessed at this
time
Requests received
should not increase
annually
Further assessment
required to inform
future revisions of the
Wastewater Services
Asset Management
Plan
Capacity/Utilisation Meets health
standards
Monitoring and
reporting program
% of network that is
poor or very poor
Meets all health
requirements
Has not been fully
assessed at this
time
Meets health
standards
Further assessment
required to inform
future revisions of the
Wastewater Systems
Asset Management
Plan

17
Cobar Shire Council – Sewerage Network Asset Management Plan
TECHNICAL LEVELS OF SERVICE
Budget Area Activities Measure Current Funded
Level of Service
(Scenario 3
Optimal Level of
Service (Scenario 2)
Operations Comply with
environmental
requirements
Monitoring and
reporting program
Comply with
environmental
requirements
Monitoring and
reporting program
Operational Cost $274,000 pa Can remain at
$274,000 pa over the
next 10 years to
maintain current
funding level % due to
some asset growth.
Maintenance Remove hazards
Provide
Maintenance
Respond to complaints
Repairs undertaken
Reactive
maintenance to
limit of budget
allocation.
Repairs identified
from inspections
are scheduled and
carried out
Planned Maintenance
Repairs identified from
inspections are
scheduled and carried
out
Maintenance Cost $250,000pa Can remain at
$250,000 pa over the
next 10 years to
maintain current
funding level % due to
some asset growth
18
Cobar Shire Council – Sewerage Network Asset Management Plan
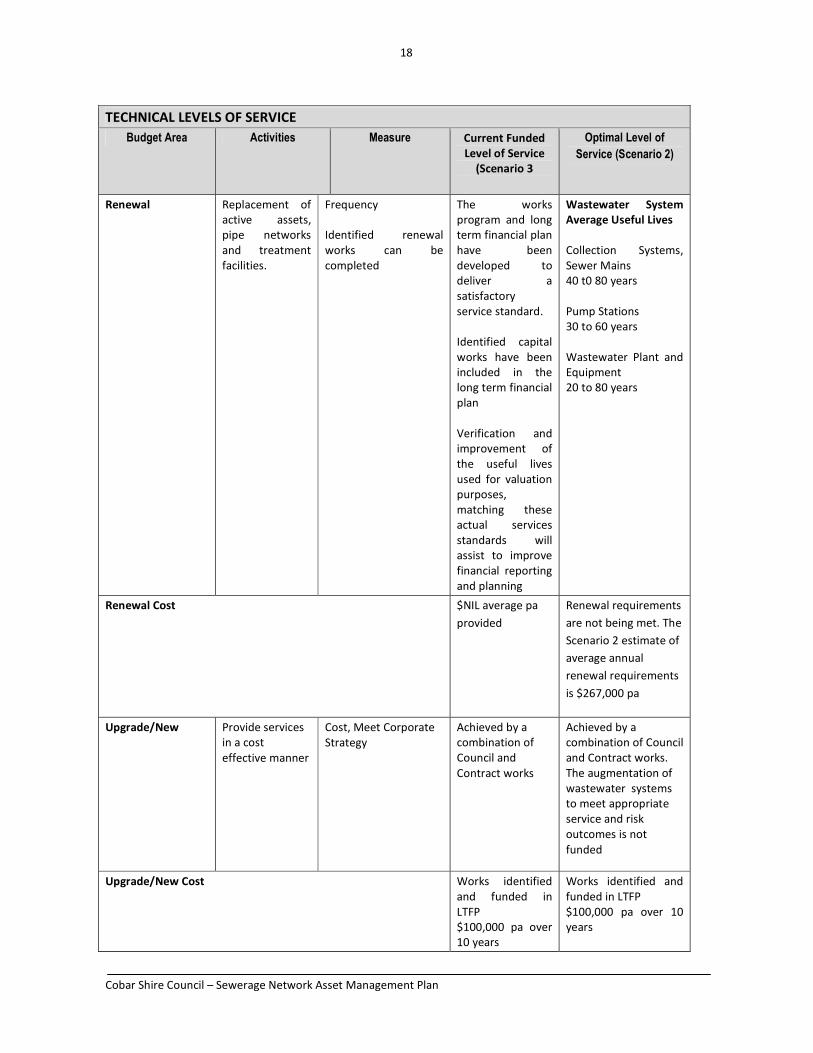
TECHNICAL LEVELS OF SERVICE
Budget Area Activities Measure Current Funded
Level of Service
(Scenario 3
Optimal Level of
Service (Scenario 2)
Renewal Replacement of
active assets,
pipe networks
and treatment
facilities.
Frequency
Identified renewal
works can be
completed
The works
program and long
term financial plan
have been
developed to
deliver a
satisfactory
service standard.
Identified capital
works have been
included in the
long term financial
plan
Verification and
improvement of
the useful lives
used for valuation
purposes,
matching these
actual services
standards will
assist to improve
financial reporting
and planning
Wastewater System
Average Useful Lives
Collection Systems,
Sewer Mains
40 t0 80 years
Pump Stations
30 to 60 years
Wastewater Plant and
Equipment
20 to 80 years
Renewal Cost $NIL average pa
provided
Renewal requirements
are not being met. The
Scenario 2 estimate of
average annual
renewal requirements
is $267,000 pa
Upgrade/New Provide services
in a cost
effective manner
Cost, Meet Corporate
Strategy
Achieved by a
combination of
Council and
Contract works
Achieved by a
combination of Council
and Contract works.
The augmentation of
wastewater systems
to meet appropriate
service and risk
outcomes is not
funded
Upgrade/New Cost Works identified
and funded in
LTFP
$100,000 pa over
10 years
Works identified and
funded in LTFP
$100,000 pa over 10
years

19
Cobar Shire Council – Sewerage Network Asset Management Plan
3.5 Desired Levels of Service
Indications of desired levels of service are obtained from community consultation/engagement. The asset
management planning process includes the development of 3 scenarios to develop levels of service that are financially
sustainable.
4. FUTURE DEMAND
4.1 Demand Drivers
Drivers affecting demand include population change, changes in demographics, seasonal factors, vehicle ownership
rates, consumer preferences and expectations, technological changes, economic factors, agricultural practices,
environmental awareness, etc.
4.2 Demand Forecast
The present position and projections for demand drivers that may impact future service delivery and utilisation of
assets were identified and are documented in Table 4.3.
4.3 Demand Impact on Assets
The impact of demand drivers that may affect future service delivery and utilisation of assets are shown in Table 4.3.
Table 4.3: Demand Drivers, Projections and Impact on Services
Demand drivers Present position Projection Impact on services
Development Population increase and
higher density
development is not
significant
No significant change
anticipated
Minimal increase in demand due
to development
Population Population increase from
5,000
Anticipated increase to
7,000 by 2035
Need for water treatment plant
argumentation.
Increasing Costs The cost to construct,
maintain and renew
infrastructure is increasing
at a rate greater than
council’s revenue
Anticipated to continue
Cost of renewing
wastewater systems is
increasing
The need to carefully target and
plan infrastructure is increasing
in importance as maximising the
service that can be delivered
within the funding limitations
will be under pressure.
Treatment Standards Standards for treatment of
sewer are high
Requirements are only
likely to ever increase
Increased treatment cost.
Redundancy of existing plant
High cost of replacement plant
Climate Change Higher frequency of
extreme weather events
Unknown, but changes
likely.
Potential damage to wastewater
systems infrastructure. Cannot
be anticipated or planned for.
Availability of disaster relief
funding to assist council will be
important.
Addition costs may be imposed
to fund environmental initiatives
e.g. carbon tax

20
Cobar Shire Council – Sewerage Network Asset Management Plan
4.4 Demand Management Plan
Demand for new services will be managed through a combination of managing existing assets, upgrading of existing
assets and providing new assets to meet demand and demand management. Demand management practices include
non-asset solutions, insuring against risks and managing failures.
Non-asset solutions focus on providing the required service without the need for the organisation to own the assets
and management actions including reducing demand for the service, reducing the level of service (allowing some
assets to deteriorate beyond current service levels) or educating customers to accept appropriate asset failures5.
Examples of non-asset solutions include providing services from existing infrastructure such as aquatic centres and
libraries that may be in another community area or public toilets provided in commercial premises.
Opportunities identified to date for demand management are shown in Table 4.4. Further opportunities will be
developed in future revisions of this asset management plan.
Table 4.4: Demand Management Plan Summary
Demand Driver Impact on Services Demand Management Plan
Community expectations Pressure to expand councils sewer
networks
Monitor community expectations and communicate
service levels and financial capacity with the
community to balance priorities for infrastructure
with what the community is prepared to pay for
Funding availability Pressure to expand councils sewer
networks without a full
prioritisation or knowledge of
ongoing costs
Continue to seek grant funding for projects
identified as priorities in the Cobar Community Plan
and Asset Management Plans
Expanding network Full costs not known Continue to maintain inventory data, analyse the
cost of providing service and the capacity to fund at
the current level of service
5 IPWEA, 2011, IIMM, Table 3.4.1, p 3|58.

21
Cobar Shire Council – Sewerage Network Asset Management Plan
4.5 Asset Programs to meet Demand
Initial population growth is likely to result in infill housing being constructed rather than development of new
residential estates.
Increased industrial activity resulting from increased mine capacity and number may necessitate the required
extension of the reticulation network in the Cobar industrial area.
The new assets required to meet growth will be acquired free of cost from land developments and
constructed/acquired by the organisation. New assets constructed/acquired by the organisation are discussed in
Section 5.5. The cumulative value of new contributed and constructed asset values are summarised in Figure 1.
Figure 1: Upgrade and New Assets to meet Demand (Cumulative)
If the current budget of $100,000 for additional assets continues at this rate the result will be the creation of $2M of
additional assets.
Acquiring these new assets will commit the organisation to fund ongoing operations, maintenance and renewal costs
for the period that the service provided from the assets is required. These future costs are identified and considered
in developing forecasts of future operations, maintenance and renewal costs in Section 5.

22
Cobar Shire Council – Sewerage Network Asset Management Plan
5. LIFECYCLE MANAGEMENT PLAN The lifecycle management plan details how the organisation plans to manage and operate the assets at the agreed
levels of service (defined in Section 3) while optimising life cycle costs.
5.1 Background Data
5.1.1 Physical parameters
The assets covered by this asset management plan are shown in Table 2.1.
The age profile of the assets include in this AM Plan is shown in Figure 2.
Figure 2: Asset Age Profile
The age profile information in Figure 2 is based on the data in council’s asset register.
5.1.2 Asset capacity and performance
The organisation’s services are generally provided to meet design standards where these are available.
Locations where deficiencies in service performance are known are detailed in Table 5.1.2.

23
Cobar Shire Council – Sewerage Network Asset Management Plan
Table 5.1.2: Known Service Performance Deficiencies
Location Service Deficiency
General Not yet determined. For inclusion in future updates of this Asset
Management Plan
5.1.3 Asset condition
Condition is monitored and managed at an operational level, and the information used to prepare the condition
profile is from the asset register.
The condition profile of our assets is shown in Figure 3.
Fig 3: Asset Condition Profile (not available)
Asset Condition is not included in Council’s asset register. Ongoing development of systems and this information will
be important to verify future planning decisions.
Condition is measured using a 1 – 5 grading system6 as detailed in Table 5.1.3. (A rating of 0 was used for assets where
condition data was not held in the asset register.)
Frequency of Assessment: Every 3-4 years.
Table 5.1.3: Simple Condition Grading Model
Condition
Grading
Description of Condition
1 Very Good: only planned maintenance required
2 Good: minor maintenance required plus planned maintenance
3 Fair: significant maintenance required
4 Poor: significant renewal/rehabilitation required
5 Very Poor: physically unsound and/or beyond rehabilitation
6 IPWEA, 2011, IIMM, Sec 2.5.4, p 2|79.
24
Cobar Shire Council – Sewerage Network Asset Management Plan
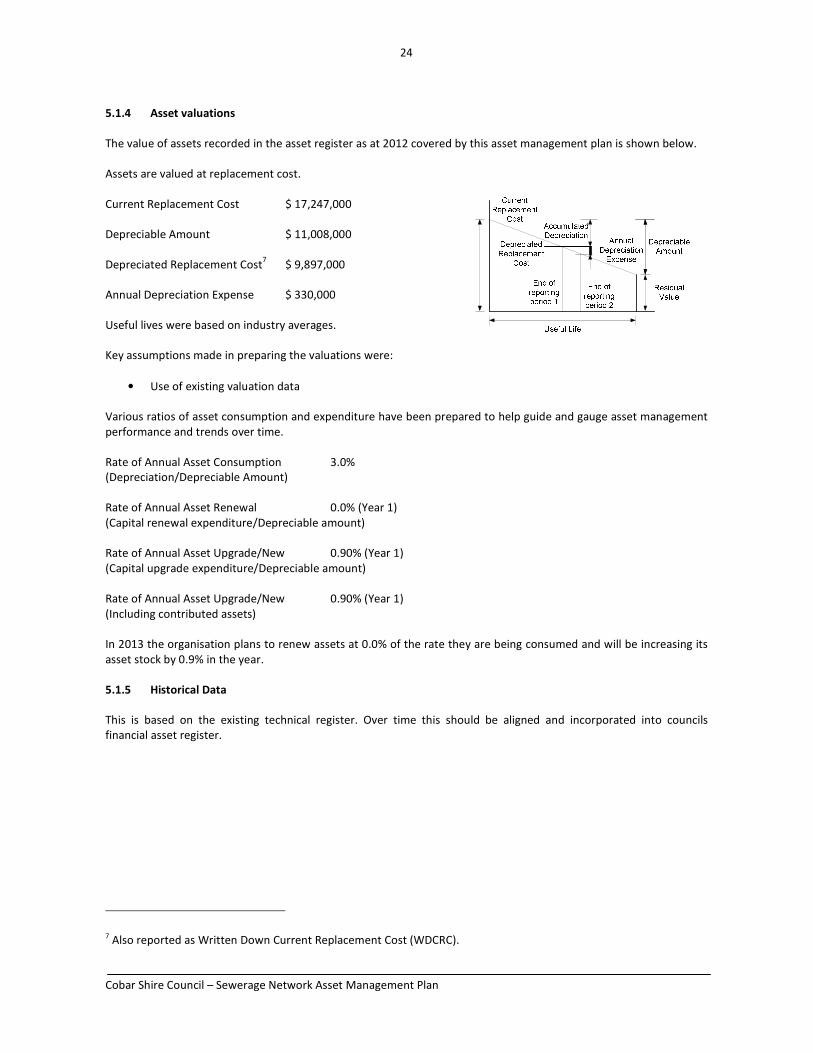
5.1.4 Asset valuations
The value of assets recorded in the asset register as at 2012 covered by this asset management plan is shown below.
Assets are valued at replacement cost.
Current Replacement Cost $ 17,247,000
Depreciable Amount $ 11,008,000
Depreciated Replacement Cost7 $ 9,897,000
Annual Depreciation Expense $ 330,000
Useful lives were based on industry averages.
Key assumptions made in preparing the valuations were:
• Use of existing valuation data
Various ratios of asset consumption and expenditure have been prepared to help guide and gauge asset management
performance and trends over time.
Rate of Annual Asset Consumption 3.0%
(Depreciation/Depreciable Amount)
Rate of Annual Asset Renewal 0.0% (Year 1)
(Capital renewal expenditure/Depreciable amount)
Rate of Annual Asset Upgrade/New 0.90% (Year 1)
(Capital upgrade expenditure/Depreciable amount)
Rate of Annual Asset Upgrade/New 0.90% (Year 1)
(Including contributed assets)
In 2013 the organisation plans to renew assets at 0.0% of the rate they are being consumed and will be increasing its
asset stock by 0.9% in the year.
5.1.5 Historical Data
This is based on the existing technical register. Over time this should be aligned and incorporated into councils
financial asset register.
7 Also reported as Written Down Current Replacement Cost (WDCRC).

25
Cobar Shire Council – Sewerage Network Asset Management Plan
5.2 Infrastructure Risk Management Plan
An assessment of risks8 associated with service delivery from infrastructure assets has identified critical risks that will
result in loss or reduction in service from infrastructure assets or a ‘financial shock’ to the organisation. The risk
assessment process identifies credible risks, the likelihood of the risk event occurring, the consequences should the
event occur, develops a risk rating, evaluates the risk and develops a risk treatment plan for non-acceptable risks.
Critical risks, being those assessed as ‘Very High’ - requiring immediate corrective action and ‘High’ – requiring
prioritised corrective action identified in the Infrastructure Risk Management Plan, together with the estimated
residual risk after the selected treatment plan is operational are summarised in Table 5.2. These risks are reported to
management and Council.
Table 5.2: Critical Risks and Treatment Plans
Service or Asset
at Risk
What can Happen Risk
Rating
(VH,
H)
Risk Treatment Plan Residual Risk
*
Treatment
Costs
Deterioration of
wastewater
systems
Blockages High Continue to improve data by
carrying out sample inspections
on a regular basis
Required renewal of sewer
system components is being
achieved in the short to medium
term
Future planning improvements
can be made by further
documented service level risks
and utilisation of these in
establishing future renewal
priorities
Within
existing
Deterioration of
wastewater
systems
Structural failures,
increased
maintenance
High Additional analysis of data
inventory, assessment of useful
lives will be critical to ensure the
long term financial planning for
wastewater systems is reliable
Within
existing
Deterioration of
wastewater
system asset
components
Structural failures,
increased
maintenance
High Continue to develop the detail of
the costs to manage the sewer
system so that a strong case can
be made for adequate funding
Within
existing
Effluent Quality Reduction in
quality of treated
effluent
High Effluent quality monitoring
program and action plan
Within
existing
Note * The residual risk is the risk remaining after the selected risk treatment plan is operational.
8 LCC Infrastructure Risk Management Plan

26
Cobar Shire Council – Sewerage Network Asset Management Plan
5.3 Routine Operations and Maintenance Plan
Operations include regular activities to provide services such as public health, safety and amenity, e.g. Energy,
inspection and compliance testing costs.
Routine maintenance is the regular on-going work that is necessary to keep assets operating, including instances
where portions of the asset fail and need immediate repair to make the asset operational again, e.g. pump servicing,
sewer main repairs.
5.3.1 Operations and Maintenance Plan
Operations activities affect service levels including quality and function through street sweeping and grass mowing
frequency, intensity and spacing of street lights and cleaning frequency and opening hours of building and other
facilities.
Maintenance includes all actions necessary for retaining an asset as near as practicable to an appropriate service
condition including regular ongoing day-to-day work necessary to keep assets operating, e.g. road patching but
excluding rehabilitation or renewal. Maintenance may be classifies into reactive, planned and specific maintenance
work activities.
Reactive maintenance is unplanned repair work carried out in response to service requests and
management/supervisory directions.
Planned maintenance is repair work that is identified and managed through a maintenance management system
(MMS). MMS activities include inspection, assessing the condition against failure/breakdown experience, prioritising,
scheduling, actioning the work and reporting what was done to develop a maintenance history and improve
maintenance and service delivery performance.
Specific maintenance is replacement of higher value components/sub-components of assets that is undertaken on a
regular cycle including repainting, replacing air conditioning units, etc. This work falls below the capital/maintenance
threshold but may require a specific budget allocation.
Current maintenance expenditure is shown in Table 5.3.1.
Table 5.3.1: Maintenance Expenditure
Maintenance Expenditure Year
Planned and Specific Unplanned
2007/2008 $20,000 $264,000
2008/2009 $18,000 $218,000
2009/2010 $48,000 $175,000
2010/2011 $56,000 $223,000
2011/2012 $81,000 $324,000
Planned maintenance work is currently 20% of total maintenance expenditure, higher proportions of planned
maintenance expenditure to reactive/unplanned maintenance will provide better value.
Maintenance expenditure levels are considered to be adequate to meet projected service levels, which may be less
than or equal to current service levels. Where maintenance expenditure levels are such that will result in a lesser level
of service, the service consequences and service risks have been identified and service consequences highlighted in
this AM Plan and service risks considered in the Infrastructure Risk Management Plan.
Assessment and prioritisation of reactive maintenance is undertaken by Council staff using experience and judgement.

27
Cobar Shire Council – Sewerage Network Asset Management Plan
5.3.2 Operations and Maintenance Strategies
The organisation will operate and maintain assets to provide the defined level of service to approved budgets in the
most cost-efficient manner. The operation and maintenance activities include:
• Scheduling operations activities to deliver the defined level of service in the most efficient manner,
• Undertaking maintenance activities through a planned maintenance system to reduce maintenance costs and
improve maintenance outcomes. Undertake cost-benefit analysis to determine the most cost-effective split
between planned and unplanned maintenance activities (50 – 70% planned desirable as measured by cost),
• Maintain a current infrastructure risk register for assets and present service risks associated with providing
services from infrastructure assets and reporting Very High and High risks and residual risks after treatment
to management and Council,
• Review current and required skills base and implement workforce training and development to meet
required operations and maintenance needs,
• Review asset utilisation to identify underutilised assets and appropriate remedies, and over utilised assets
and customer demand management options,
• Maintain a current hierarchy of critical assets and required operations and maintenance activities,
• Develop and regularly review appropriate emergency response capability,
• Review management of operations and maintenance activities to ensure Council is obtaining best value for
resources used.
Asset hierarchy
An asset hierarchy provides a framework for structuring data in an information system to assist in collection of data,
reporting information and making decisions. The hierarchy includes the asset class and component used for asset
planning and financial reporting and service level hierarchy used for service planning and delivery.
The organisation’s service hierarchy is shown is Table 5.3.2.
Table 5.3.2: Asset Service Hierarchy
Service Hierarchy Service Level Objective
Treatment works Treatment of effluent to a standard suitable for disposal in
compliance with regulatory health standards.
Sewer pipelines Conveyance of effluent from source to treatment and disposal
locations.
Sewer service equipment assets e.g. pumping
stations
Conveyance of effluent from source to treatment and disposal
locations.
Critical Assets
Critical assets are those assets which have a high consequence of failure but not necessarily a high likelihood of
failure. By identifying critical assets and critical failure modes, organisations can target and refines investigative
activities, maintenance plans and capital expenditure plans at the appropriate time.
Operations and maintenances activities may be targeted to mitigate critical assets failure and maintain service levels.
These activities may include increased inspection frequency, higher maintenance intervention levels, etc. Critical
assets failure modes and required operations and maintenance activities are detailed in Table 5.3.2.1.
Table 5.3.2.1: Critical Assets and Service Level Objectives

28
Cobar Shire Council – Sewerage Network Asset Management Plan
Critical Assets Critical Failure Mode Operations & Maintenance Activities
Not yet identified within the Wastewater
Systems Asset Management Plan
Condition degradation,
regular blockages and
surcharges, uncontrolled
overflows
Intervention maintenance (reactive
and planned)
Standards and specifications
Maintenance work is carried out in accordance with the following Standards and Specifications.
• Relevant technical standards
• Relevant Australian Standards
5.3.3 Summary of future operations and maintenance expenditures
Future operations and maintenance expenditure is forecast to trend in line with the value of the asset stock as shown
in Figure 4. Note that all costs are shown in current 2012 dollar values (i.e. real values).
Figure 4: Projected Operations and Maintenance Expenditure
The small increase is indicative of the need to fund operations and maintenance associated with the new assets
created during the planning period.
Deferred maintenance, i.e. works that are identified for maintenance and unable to be funded. These are to be
included in the risk assessment and analysis in the infrastructure risk management plan.

29
Cobar Shire Council – Sewerage Network Asset Management Plan
Maintenance is funded from the operating budget where available. This is further discussed in Section 6.2.
5.4 Renewal/Replacement Plan
Renewal and replacement expenditure is major work which does not increase the asset’s design capacity but restores,
rehabilitates, replaces or renews an existing asset to its original or lesser required service potential. Work over and
above restoring an asset to original service potential is upgrade/expansion or new works expenditure.
5.4.1 Renewal plan
Assets requiring renewal/replacement are identified from one of three methods provided in the ‘Expenditure
Template’.
• Method 1 uses Asset Register data to project the renewal costs using acquisition year and useful life to
determine the renewal year, or
• Method 2 uses capital renewal expenditure projections from external condition modelling systems (such as
Pavement Management Systems), or
• Method 3 uses a combination of average network renewals plus defect repairs in the Renewal Plan and
Defect Repair Plan worksheets on the ‘Expenditure template’.
A combination of these methods was used to prepare the 3 renewal scenarios included in this asset management
plan.
Assets requiring renewal are identified comparing 3 Scenarios.
• Scenario 1 uses the Asset Register valuation data to project the renewal costs for renewal years using the
acquisition year and useful life, or
• Scenario 2 uses capital renewal expenditure projections from external condition modelling systems (such as
Pavement Management Systems), or a combination of average network renewals plus defect repairs.
• Scenario 3 balances capital renewal expenditure with the Long Term Financial Plan.
It is common that the valuation registers used in Scenario 1 are not developed to a level of maturity where they are
reliable for producing a realistic renewal forecast. Ideally when this asset register is sorted by remaining life from 1 to
10 years this should be consistent with the capital renewal program. For Cobar Shire Council the refinement of the
asset register to achieve this situation should become an important part of the asset management improvement plan.
Scenario 2 is prepared using the technical estimates of what renewal is required to sustain the current levels of
service, and it is common that that this estimate will be beyond the current funding capacity of council. Scenario 3 is a
reflection of the actual funding available. The difference between Scenario 2 and Scenario 3 represents “what we
can’t do”. The discussion about this “gap” will lead us into a much better informed community discussion about what
are achievable and acceptable service levels, as well as giving a focus on managing risk.
The useful lives of assets used to develop projected asset renewal expenditures are shown in Table 5.4.1. Asset useful
lives were last reviewed on June 2012.
Table 5.4.1: Useful Lives of Assets
Asset (Sub)Category Useful life
Gravity Mains 70 years
Manholes 80 years
Rising Mains 70 years
Pump Stations 15 to 50 years
Treatment Works 20 to 70 Years
5.4.2 Renewal and Replacement Strategies

30
Cobar Shire Council – Sewerage Network Asset Management Plan
The organisation will plan capital renewal and replacement projects to meet level of service objectives and minimise
infrastructure service risks by:
• Planning and scheduling renewal projects to deliver the defined level of service in the most efficient manner,
• Undertaking project scoping for all capital renewal and replacement projects to identify:
o the service delivery ‘deficiency’, present risk and optimum time for renewal/replacement,
o the project objectives to rectify the deficiency,
o the range of options, estimated capital and life cycle costs for each options that could address the
service deficiency,
o and evaluate the options against evaluation criteria adopted by Council, and
o select the best option to be included in capital renewal programs,
• Using ‘low cost’ renewal methods (cost of renewal is less than replacement) wherever possible,
• Maintain a current infrastructure risk register for assets and service risks associated with providing services
from infrastructure assets and reporting Very High and High risks and residual risks after treatment to
management and Council,
• Review current and required skills base and implement workforce training and development to meet
required construction and renewal needs,
• Maintain a current hierarchy of critical assets and capital renewal treatments and timings required ,
• Review management of capital renewal and replacement activities to ensure Council is obtaining best value
for resources used.
Renewal ranking criteria
Asset renewal and replacement is typically undertaken to either:
• Ensure the reliability of the existing infrastructure to deliver the service it was constructed to facilitate (e.g.
replacing a sewer pump that has a high breakdown history), or
• To ensure the infrastructure is of sufficient quality to meet the service requirements (eg treatment works
capacity).9
It is possible to get some indication of capital renewal and replacement priorities by identifying assets or asset groups
that:
• Have a high consequence of failure,
• Have a high utilisation and subsequent impact on users would be greatest,
• The total value represents the greatest net value to the organisation,
• Have the highest average age relative to their expected lives,
• Are identified in the AM Plan as key cost factors,
• Have high operational or maintenance costs, and
• Where replacement with modern equivalent assets would yield material savings.10
9 IPWEA, 2011, IIMM, Sec 3.4.4, p 3|60.
10 Based on IPWEA, 2011, IIMM, Sec 3.4.5, p 3|66.

31
Cobar Shire Council – Sewerage Network Asset Management Plan
The ranking criteria used to determine priority of identified renewal and replacement proposals is detailed in Table
5.4.2.
Table 5.4.2: Renewal and Replacement Priority Ranking Criteria
Criteria Weighting
Available budget No weighting criteria adopted
Condition No weighting criteria adopted
Risk No weighting criteria adopted
Regulatory Standards No weighting criteria adopted
Total 100%
Renewal and replacement standards
Renewal work is carried out in accordance with the following Standards and Specifications.
• Relevant technical standards and specifications for sewer construction works
• Relevant Australian Standards
5.4.3 Summary of future renewal and replacement expenditure
Projected future renewal and replacement expenditures are forecast to increase over time as the asset stock increases
from growth. The expenditure is summarised in Fig 5. Note that all amounts are shown in real values.
The projected capital renewal and replacement program is shown in Appendix B.
Figure 5.1: Projected Capital Renewal Expenditure (Scenario 1 - from Asset Register)
The renewal projection (forecast) in Scenario 1 (Using the asset/valuation register) generates a highly variable renewal
profile. Whilst the long term averages and total values from this register are sound, the shorter term renewal forecast
are not, and are inconsistent with the known capital renewal plans. This indicates that further refinement of the asset

32
Cobar Shire Council – Sewerage Network Asset Management Plan
register is required before it is valuable as a capital renewal planning tool. This should be given a high priority in the
asset management improvement plan.
Figure 5.2: Projected Capital Renewal Expenditure (Scenario 2 - from Average Network Renewal Estimates)
The current renewal expenditure is anticipated to be insufficient for the short term and there is likely to be reduction
in service levels and increasing risks.
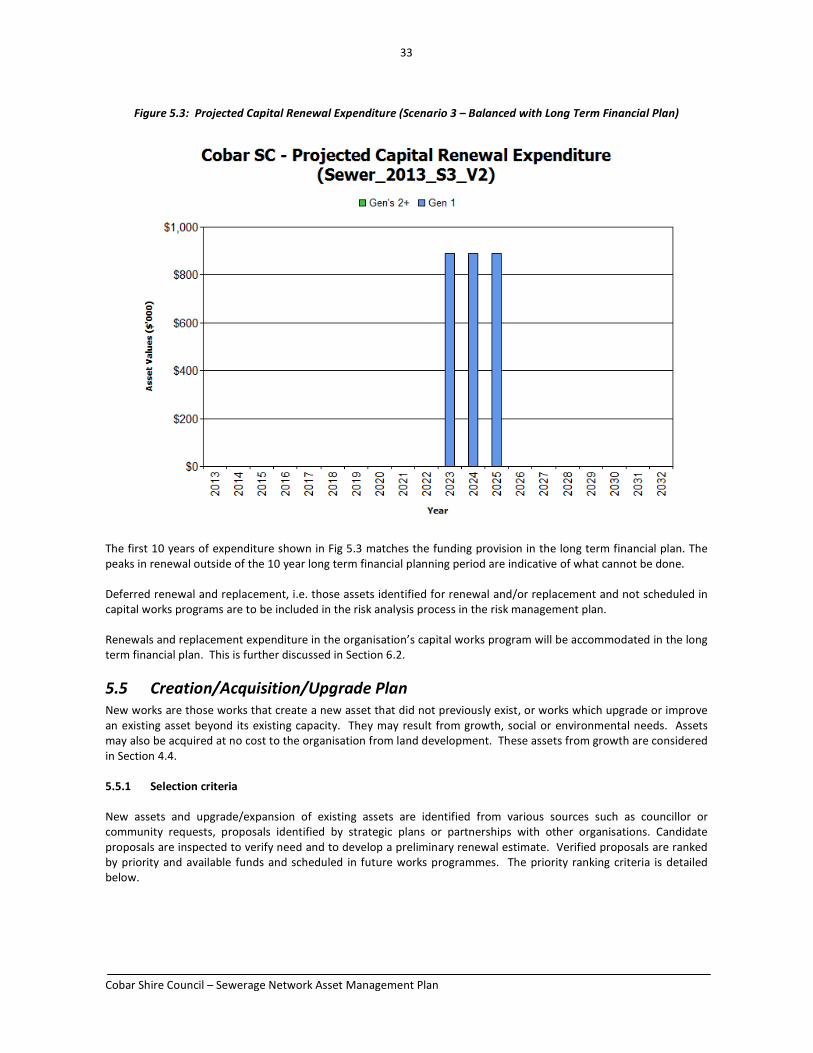
33
Cobar Shire Council – Sewerage Network Asset Management Plan
Figure 5.3: Projected Capital Renewal Expenditure (Scenario 3 – Balanced with Long Term Financial Plan)
The first 10 years of expenditure shown in Fig 5.3 matches the funding provision in the long term financial plan. The
peaks in renewal outside of the 10 year long term financial planning period are indicative of what cannot be done.
Deferred renewal and replacement, i.e. those assets identified for renewal and/or replacement and not scheduled in
capital works programs are to be included in the risk analysis process in the risk management plan.
Renewals and replacement expenditure in the organisation’s capital works program will be accommodated in the long
term financial plan. This is further discussed in Section 6.2.
5.5 Creation/Acquisition/Upgrade Plan
New works are those works that create a new asset that did not previously exist, or works which upgrade or improve
an existing asset beyond its existing capacity. They may result from growth, social or environmental needs. Assets
may also be acquired at no cost to the organisation from land development. These assets from growth are considered
in Section 4.4.
5.5.1 Selection criteria
New assets and upgrade/expansion of existing assets are identified from various sources such as councillor or
community requests, proposals identified by strategic plans or partnerships with other organisations. Candidate
proposals are inspected to verify need and to develop a preliminary renewal estimate. Verified proposals are ranked
by priority and available funds and scheduled in future works programmes. The priority ranking criteria is detailed
below.

34
Cobar Shire Council – Sewerage Network Asset Management Plan
Table 5.5.1: New Assets Priority Ranking Criteria
Criteria Weighting
Available budget No weighting criteria adopted
Land use planning priorities No weighting criteria adopted
Public health needs No weighting criteria adopted
Regulatory standards No weighting criteria adopted
Total 100%
5.5.2 Capital Investment Strategies
The organisation will plan capital upgrade and new projects to meet level of service objectives by:
• Planning and scheduling capital upgrade and new projects to deliver the defined level of service in the most
efficient manner,
• Undertake project scoping for all capital upgrade/new projects to identify:
o the service delivery ‘deficiency’, present risk and required timeline for delivery of the upgrade/new
asset,
o the project objectives to rectify the deficiency including value management for major projects,
o the range of options, estimated capital and life cycle costs for each options that could address the
service deficiency,
o management of risks associated with alternative options,
o and evaluate the options against evaluation criteria adopted by Council, and
o select the best option to be included in capital upgrade/new programs,
• Review current and required skills base and implement training and development to meet required
construction and project management needs,
• Review management of capital project management activities to ensure Council is obtaining best value for
resources used.
Standards and specifications for new assets and for upgrade/expansion of existing assets are the same as those for
renewal shown in Section 5.4.2.
5.5.3 Summary of future upgrade/new assets expenditure
Projected upgrade/new asset expenditures are summarised in Fig 6. The projected upgrade/new capital works
program is shown in Appendix C. All amounts are shown in real values.

35
Cobar Shire Council – Sewerage Network Asset Management Plan
Fig 6: Projected Capital Upgrade/New Asset Expenditure
Expenditure on new assets and services in the organisation’s capital works program will be accommodated in the long
term financial plan. This is further discussed in Section 6.2.
5.6 Disposal Plan
Disposal includes any activity associated with disposal of a decommissioned asset including sale, demolition or
relocation. Assets identified for possible decommissioning and disposal are shown in Table 5.6, together with
estimated annual savings from not having to fund operations and maintenance of the assets. These assets will be
further reinvestigated to determine the required levels of service and see what options are available for alternate
service delivery, if any. Any revenue gained from asset disposals is accommodated in the organisation’s long term
financial plan.
Where cashflow projections from asset disposals are not available, these will be developed in future revisions of this
asset management plan.
Table 5.6: Assets Identified for Disposal
Asset Reason for Disposal Timing Disposal
Expenditure
Operations &
Maintenance Annual
Savings
No assets identified for
disposal in this asset
management plan

36
Cobar Shire Council – Sewerage Network Asset Management Plan
5.7 Service Consequences and Risks
The organisation has prioritised decisions made in adopting this AM Plan to obtain the optimum benefits from its
available resources. Decisions were made based on the development of 3 scenarios of AM Plans.
Scenario 1 - What we would like to do based on asset register data
Scenario 2 – What we should do with existing budgets and identifying level of service and risk consequences (ie what
are the operations and maintenance and capital projects we are unable to do, what is the service and risk
consequences associated with this position). This may require several versions of the AM Plan.
Scenario 3 – What we can do and be financially sustainable with AM Plans matching long-term financial plans.
The development of scenario 1 and scenario 2 AM Plans provides the tools for discussion with the Council/Board and
community on trade-offs between what we would like to do (scenario 1) and what we should be doing with existing
budgets (scenario 2) by balancing changes in services and service levels with affordability and acceptance of the
service and risk consequences of the trade-off position (scenario 3).
5.7.1 What we cannot do
There are some operations and maintenance activities and capital projects that are unable to be undertaken within
the next 10 years. These include:
• Sewer mains are unable to be relined and/or replaced when due;
• Remaining Pump Stations are unable to be replaced when due;
• Treatment Plant is unable to be replaced when due; and
• The connection of the remaining 20% of the East Cobar Industrial Area
5.7.2 Service consequences
Operations and maintenance activities and capital projects that cannot be undertaken will maintain or create service
consequences for users. These include:
• Increased blockages.
• Increased odour complaints.
5.7.3 Risk consequences
The operations and maintenance activities and capital projects that cannot be undertaken may maintain or create risk
consequences for the organisation. These include:
• Reduction in effluent quality;
• Environmental license requirements may be compromised; and
• Increased user dis-satisfaction.
These risks have been included with the Infrastructure Risk Management Plan summarised in Section 5.2 and risk
management plans actions and expenditures included within projected expenditures.
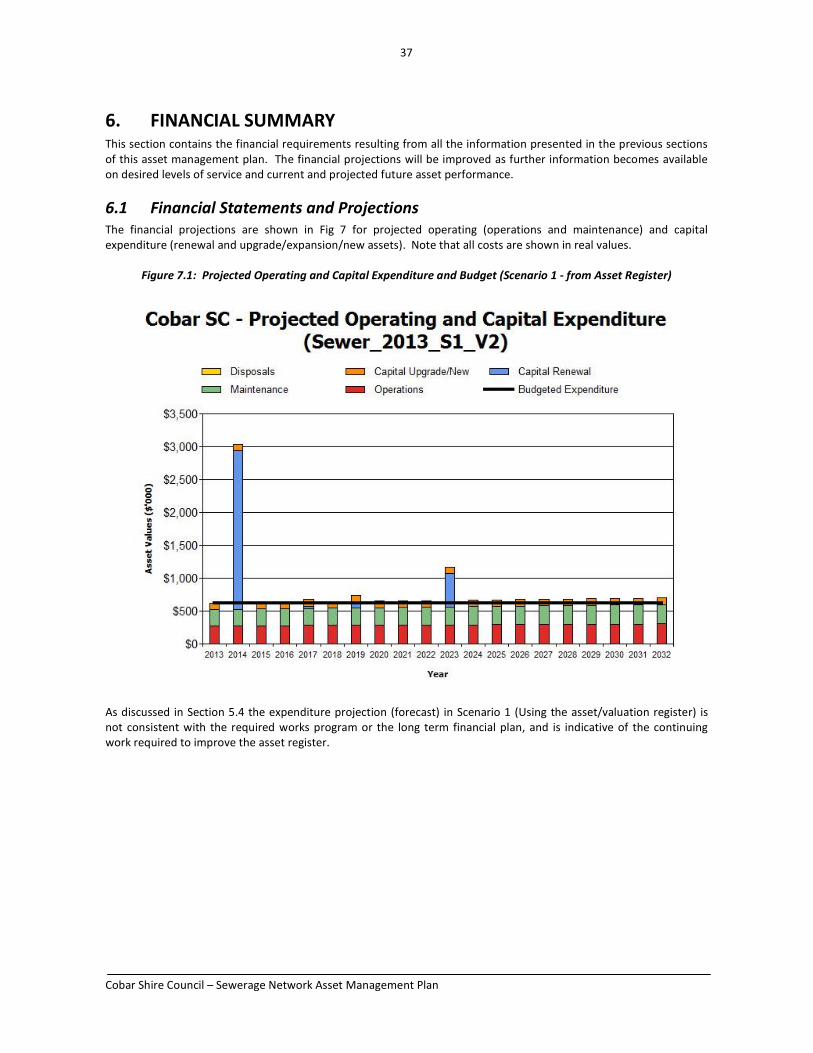
37
Cobar Shire Council – Sewerage Network Asset Management Plan
6. FINANCIAL SUMMARY This section contains the financial requirements resulting from all the information presented in the previous sections
of this asset management plan. The financial projections will be improved as further information becomes available
on desired levels of service and current and projected future asset performance.
6.1 Financial Statements and Projections
The financial projections are shown in Fig 7 for projected operating (operations and maintenance) and capital
expenditure (renewal and upgrade/expansion/new assets). Note that all costs are shown in real values.
Figure 7.1: Projected Operating and Capital Expenditure and Budget (Scenario 1 - from Asset Register)
As discussed in Section 5.4 the expenditure projection (forecast) in Scenario 1 (Using the asset/valuation register) is
not consistent with the required works program or the long term financial plan, and is indicative of the continuing
work required to improve the asset register.

38
Cobar Shire Council – Sewerage Network Asset Management Plan
Figure 7.2: Projected Operating and Capital Expenditure and Budget (Scenario 2 - from Average Network Renewal
Estimates)
The Scenario 2 renewal requirements are based on the technical judgement made by Cobar Shire technical staff. This
level of funding is not currently being achieved, and indicates a future reduction in services levels and increased risk.
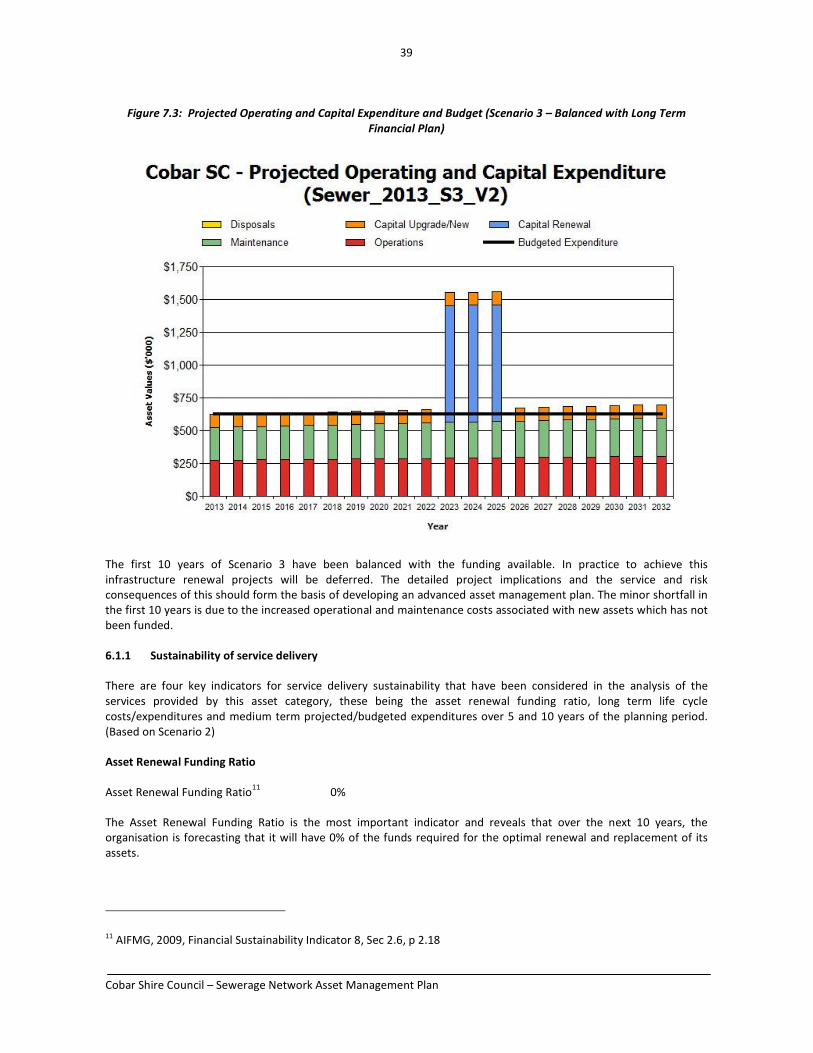
39
Cobar Shire Council – Sewerage Network Asset Management Plan
Figure 7.3: Projected Operating and Capital Expenditure and Budget (Scenario 3 – Balanced with Long Term
Financial Plan)
The first 10 years of Scenario 3 have been balanced with the funding available. In practice to achieve this
infrastructure renewal projects will be deferred. The detailed project implications and the service and risk
consequences of this should form the basis of developing an advanced asset management plan. The minor shortfall in
the first 10 years is due to the increased operational and maintenance costs associated with new assets which has not
been funded.
6.1.1 Sustainability of service delivery
There are four key indicators for service delivery sustainability that have been considered in the analysis of the
services provided by this asset category, these being the asset renewal funding ratio, long term life cycle
costs/expenditures and medium term projected/budgeted expenditures over 5 and 10 years of the planning period.
(Based on Scenario 2)
Asset Renewal Funding Ratio
Asset Renewal Funding Ratio11
0%
The Asset Renewal Funding Ratio is the most important indicator and reveals that over the next 10 years, the
organisation is forecasting that it will have 0% of the funds required for the optimal renewal and replacement of its
assets.
11 AIFMG, 2009, Financial Sustainability Indicator 8, Sec 2.6, p 2.18
40
Cobar Shire Council – Sewerage Network Asset Management Plan
Long term - Life Cycle Cost
Life cycle costs (or whole of life costs) are the average costs that are required to sustain the service levels over the
asset life cycle. Life cycle costs include operations and maintenance expenditure and asset consumption (depreciation
expense). The life cycle cost for the services covered in this asset management plan is $871,000 per year (average
operations and maintenance expenditure plus depreciation expense projected over 10 years).
Life cycle costs can be compared to life cycle expenditure to give an initial indicator of affordability of projected
service levels when considered with age profiles. Life cycle expenditure includes operations, maintenance and capital
renewal expenditure. Life cycle expenditure will vary depending on the timing of asset renewals. The life cycle
expenditure over the 10 year planning period is $524,000 per year (average operations and maintenance plus capital
renewal budgeted expenditure in LTFP over 10 years).
A shortfall between life cycle cost and life cycle expenditure is the life cycle gap. The life cycle gap for services covered
by this asset management plan is -$347,000 per year (-ve = gap, +ve = surplus).
Life cycle expenditure is 60% of life cycle costs.
The life cycle costs and life cycle expenditure comparison highlights any difference between present outlays and the
average cost of providing the service over the long term. If the life cycle expenditure is less than that life cycle cost, it
is most likely that outlays will need to be increased or cuts in services made in the future.
Knowing the extent and timing of any required increase in outlays and the service consequences if funding is not
available will assist organisations in providing services to their communities in a financially sustainable manner. This is
the purpose of the asset management plans and long term financial plan.
Medium term – 10 year financial planning period
This asset management plan identifies the projected operations, maintenance and capital renewal expenditures
required to provide an agreed level of service to the community over a 10 year period. This provides input into 10 year
financial and funding plans aimed at providing the required services in a sustainable manner.
These projected expenditures may be compared to budgeted expenditures in the 10 year period to identify any
funding shortfall. In a core asset management plan, a gap is generally due to increasing asset renewals for ageing
assets.
The projected operations, maintenance and capital renewal expenditure required over the 10 year planning period is
$808,000 on average per year.
Estimated (budget) operations, maintenance and capital renewal funding is $524,000 on average per year giving a 10
year funding shortfall of -$284,000 per year. This indicates that Council expects to have 65% of the projected
expenditures needed to provide the services documented in the asset management plan.
Medium Term – 5 year financial planning period
The projected operations, maintenance and capital renewal expenditure required over the first 5 years of the planning
period is $799,000 on average per year.
Estimated (budget) operations, maintenance and capital renewal funding is $524,000 on average per year giving a 5
year funding shortfall of -$275,000. This indicates that Council expects to have 66% of projected expenditures
required to provide the services shown in this asset management plan.

41
Cobar Shire Council – Sewerage Network Asset Management Plan
Table 6 – Summary of Service Sustainability Ratios
Scenario 1
($000’s)
Scenario 2
($000’s)
Scenario 3
($000’s)
Asset Renewal Funding Ratio
Asset Renewal Funding Ratio 0 % 0 % 0 %
Life Cycle Cost (long term)'($000)
Life Cycle Cost (depreciation + ops. and maintenance.
eexpenditures – 10 year average)
$871,000 $871,000 $871,000
Life Cycle Exp. (Capital renewal. + operations + maintenance
expenditure 10 year average)
$524,000 $524,000 $524,000
Life Cycle Gap [life cycle expenditure - life cycle cost [-ve = gap] -$347,000 -$347,000 -$347,000
Life Cycle Sustainability Indicator [life cycle expenditure / LCC] 60% 60% 60%
Medium Term (10 yrs) Sustainability
10 year Operations, Maintenance & Renewal Projected
Expenditure
$795,000 $808,000 $541,000
10 year Operations, Maintenance & Renewal Planned (Budget)
Expenditures
$524,000 $524,000 $524,000
10 year Funding Shortfall (10 year projected. expenditures. -
Planned (Budget) Expenditures)
-$271,000 -$284,000 -$17,000
10 year Sustainability Indicator (10 year planned exp. / projected.
Expenditure) 66% 65% 100%
Short Term (5 years) Sustainability
5 year Operations, Maintenance & Renewal Projected Expenditure $1,021,000 $799,000 $532,000
5 year Operations, Maintenance & Renewal Planned (Budget)
Expenditure
$524,000 $524,000 $524,000
5 year Funding Shortfall (5 year projected expenditures. - planned
(budget) expenditures)
-$497,000 -$275,000 -$8,000
5 year Sustainability Indicator (5 year planned expenditures. /
projected expenditures)
51% 66% 99%
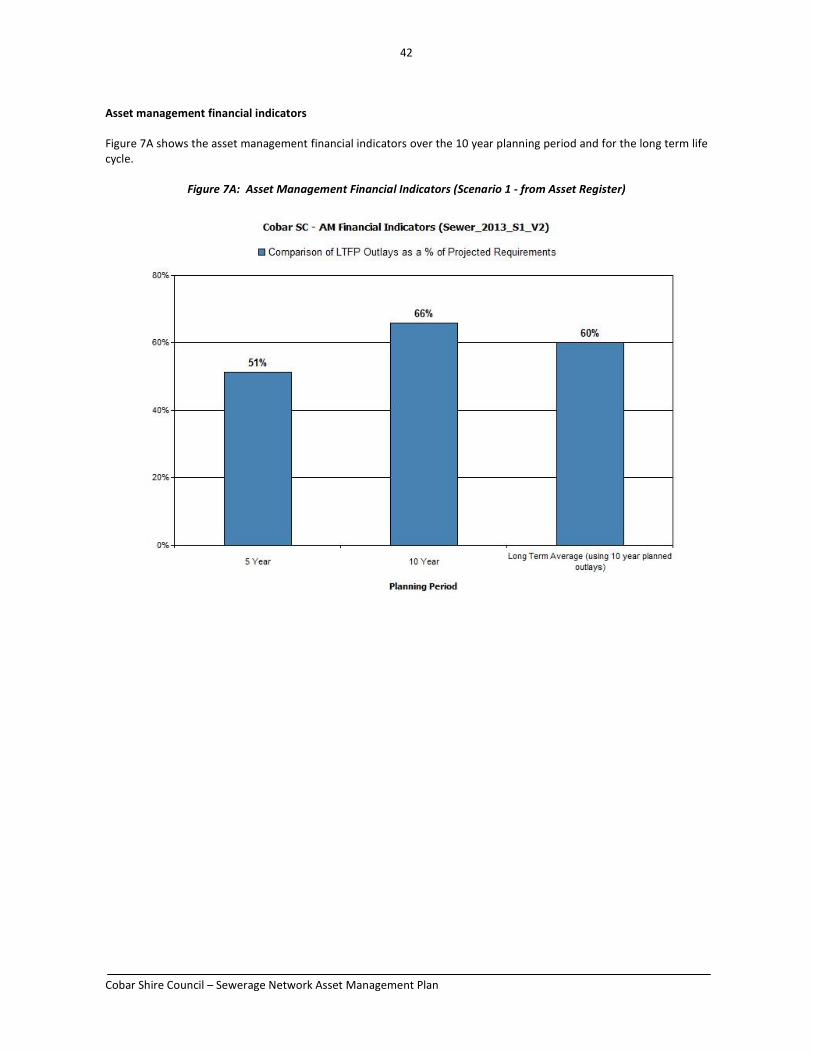
42
Cobar Shire Council – Sewerage Network Asset Management Plan
Asset management financial indicators
Figure 7A shows the asset management financial indicators over the 10 year planning period and for the long term life
cycle.
Figure 7A: Asset Management Financial Indicators (Scenario 1 - from Asset Register)

43
Cobar Shire Council – Sewerage Network Asset Management Plan
Figure 7B: Asset Management Financial Indicators (Scenario 2 - from Average Network Renewal Estimates)
Figure 7C: Asset Management Financial Indicators (Scenario 3 – Balanced with Long Term Financial Plan)

44
Cobar Shire Council – Sewerage Network Asset Management Plan
Providing services from infrastructure in a sustainable manner requires the matching and managing of service levels,
risks, projected expenditures and financing to achieve a financial indicator of approximately 1.0 for the first years of
the asset management plan and ideally over the 10 year life of the Long Term Financial Plan.
Figures 8.1 to 8.3 show the projected asset renewal and replacement expenditure over the 20 years of the AM Plan
for the 3 scenarios being considered. The projected asset renewal and replacement expenditure is compared to
renewal and replacement expenditure in the capital works program, which is accommodated in the long term financial
plan
Figure 8.1: Projected and LTFP Budgeted Renewal Expenditure (Scenario 1 - from Asset Register)
Table 6.1.1.S1 shows the shortfall between projected renewal and replacement expenditures and expenditure
accommodated in long term financial plan. Budget expenditures accommodated in the long term financial plan or
extrapolated from current budgets are shown in Appendix D.
Table 6.1.1.S1: Projected and LTFP Budgeted Renewals and Financing Shortfall (Scenario 1 - from Asset Register)
Year Projected
Renewals
($000)
LTFP Renewal
Budget
($000)
Renewal Financing
Shortfall ($000)
(-ve Gap, +ve Surplus)
Cumulative Shortfall
($000)
(-ve Gap, +ve Surplus)
2013 $0 $0 $0 $0
2014 $2,408 $0 -$2,408 -$2,408
2015 $0 $0 $0 -$2,408
2016 $0 $0 $0 -$2,408
2017 $38 $0 -$38 -$2,446
2018 $0 $0 $0 -$2,446
2013 $92 $0 -$92 -$2,538

45
Cobar Shire Council – Sewerage Network Asset Management Plan
Year Projected
Renewals
($000)
LTFP Renewal
Budget
($000)
Renewal Financing
Shortfall ($000)
(-ve Gap, +ve Surplus)
Cumulative Shortfall
($000)
(-ve Gap, +ve Surplus)
2014 $0 $0 $0 -$2,538
2015 $0 $0 $0 -$2,538
2016 $0 $0 $0 -$2,538
2017 $504 $0 -$504 -$3,042
2018 $0 $0 $0 -$3,042
2019 $0 $0 $0 -$3,042
2020 $0 $0 $0 -$3,042
2021 $0 $0 $0 -$3,042
2022 $0 $0 $0 -$3,042
2023 $0 $0 $0 -$3,042
2024 $0 $0 $0 -$3,042
2025 $0 $0 $0 -$3,042
2026 $0 $0 $0 -$3,042
Note: A negative shortfall indicates a financing gap; a positive shortfall indicates a surplus for that year.
Figure 8.2: Projected and LTFP Budgeted Renewal Expenditure (Scenario 2 - from Average Network Renewal
Estimates)
Table 6.1.1.S2 shows the shortfall between projected renewal and replacement expenditures and expenditure
accommodated in long term financial plan. Budget expenditures accommodated in the long term financial plan or
extrapolated from current budgets are shown in Appendix D.

46
Cobar Shire Council – Sewerage Network Asset Management Plan
Table 6.1.1.S2: Projected and LTFP Budgeted Renewals and Financing Shortfall (Scenario 2 - from Average Network
Renewal Estimates)
Year Projected
Renewals
($000)
LTFP Renewal
Budget
($000)
Renewal Financing
Shortfall ($000)
(-ve Gap, +ve Surplus)
Cumulative Shortfall
($000)
(-ve Gap, +ve Surplus)
2013 $267 $0 -$267 -$267
2014 $267 $0 -$267 -$534
2015 $267 $0 -$267 -$801
2016 $267 $0 -$267 -$1,068
2017 $267 $0 -$267 -$1,335
2018 $267 $0 -$267 -$1,602
2019 $267 $0 -$267 -$1,869
2020 $267 $0 -$267 -$2,136
2021 $267 $0 -$267 -$2,403
2022 $267 $0 -$267 -$2,670
2023 $267 $0 -$267 -$2,937
2024 $267 $0 -$267 -$3,204
2025 $267 $0 -$267 -$3,471
2026 $267 $0 -$267 -$3,738
2027 $267 $0 -$267 -$4,005
2028 $267 $0 -$267 -$4,272
2029 $267 $0 -$267 -$4,539
2030 $267 $0 -$267 -$4,806
2031 $267 $0 -$267 -$5,073
2032 $267 $0 -$267 -$5,340
Note: A negative shortfall indicates a financing gap; a positive shortfall indicates a surplus for that year.

47
Cobar Shire Council – Sewerage Network Asset Management Plan
Figure 8.3: Projected and LTFP Budgeted Renewal Expenditure (Scenario 3 – Balanced with Long Term Financial
Plan)
Table 6.1.1.S3 shows the shortfall between projected renewal and replacement expenditures and expenditure
accommodated in long term financial plan. Budget expenditures accommodated in the long term financial plan or
extrapolated from current budgets are shown in Appendix D.
Table 6.1.1.S3: Projected and LTFP Budgeted Renewals and Financing Shortfall (Scenario 3 – Balanced with Long
Term Financial Plan)
Year Projected
Renewals
($000)
LTFP Renewal
Budget
($000)
Renewal Financing
Shortfall ($000)
(-ve Gap, +ve Surplus)
Cumulative Shortfall
($000)
(-ve Gap, +ve Surplus)
2013 $0 $0 $0 $0
2014 $0 $0 $0 $0
2015 $0 $0 $0 $0
2016 $0 $0 $0 $0
2017 $0 $0 $0 $0
2018 $0 $0 $0 $0
2019 $0 $0 $0 $0
2020 $0 $0 $0 $0
2021 $0 $0 $0 $0
2022 $0 $0 $0 $0
2023 $890 $0 -$890 -$890
2024 $890 $0 -$890 -$1,780
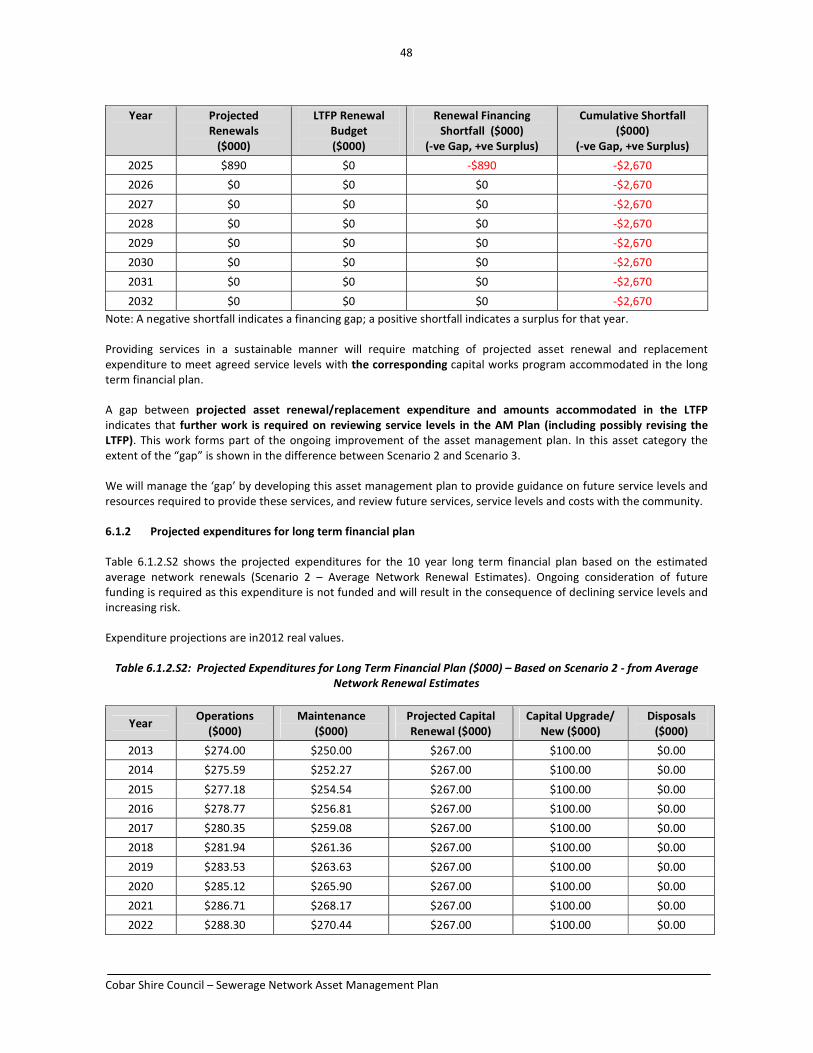
48
Cobar Shire Council – Sewerage Network Asset Management Plan
Year Projected
Renewals
($000)
LTFP Renewal
Budget
($000)
Renewal Financing
Shortfall ($000)
(-ve Gap, +ve Surplus)
Cumulative Shortfall
($000)
(-ve Gap, +ve Surplus)
2025 $890 $0 -$890 -$2,670
2026 $0 $0 $0 -$2,670
2027 $0 $0 $0 -$2,670
2028 $0 $0 $0 -$2,670
2029 $0 $0 $0 -$2,670
2030 $0 $0 $0 -$2,670
2031 $0 $0 $0 -$2,670
2032 $0 $0 $0 -$2,670
Note: A negative shortfall indicates a financing gap; a positive shortfall indicates a surplus for that year.
Providing services in a sustainable manner will require matching of projected asset renewal and replacement
expenditure to meet agreed service levels with the corresponding capital works program accommodated in the long
term financial plan.
A gap between projected asset renewal/replacement expenditure and amounts accommodated in the LTFP
indicates that further work is required on reviewing service levels in the AM Plan (including possibly revising the
LTFP). This work forms part of the ongoing improvement of the asset management plan. In this asset category the
extent of the “gap” is shown in the difference between Scenario 2 and Scenario 3.
We will manage the ‘gap’ by developing this asset management plan to provide guidance on future service levels and
resources required to provide these services, and review future services, service levels and costs with the community.
6.1.2 Projected expenditures for long term financial plan
Table 6.1.2.S2 shows the projected expenditures for the 10 year long term financial plan based on the estimated
average network renewals (Scenario 2 – Average Network Renewal Estimates). Ongoing consideration of future
funding is required as this expenditure is not funded and will result in the consequence of declining service levels and
increasing risk.
Expenditure projections are in2012 real values.
Table 6.1.2.S2: Projected Expenditures for Long Term Financial Plan ($000) – Based on Scenario 2 - from Average
Network Renewal Estimates
Year Operations
($000)
Maintenance
($000)
Projected Capital
Renewal ($000)
Capital Upgrade/
New ($000)
Disposals
($000)
2013 $274.00 $250.00 $267.00 $100.00 $0.00
2014 $275.59 $252.27 $267.00 $100.00 $0.00
2015 $277.18 $254.54 $267.00 $100.00 $0.00
2016 $278.77 $256.81 $267.00 $100.00 $0.00
2017 $280.35 $259.08 $267.00 $100.00 $0.00
2018 $281.94 $261.36 $267.00 $100.00 $0.00
2019 $283.53 $263.63 $267.00 $100.00 $0.00
2020 $285.12 $265.90 $267.00 $100.00 $0.00
2021 $286.71 $268.17 $267.00 $100.00 $0.00
2022 $288.30 $270.44 $267.00 $100.00 $0.00

49
Cobar Shire Council – Sewerage Network Asset Management Plan
Table 6.1.2.S3 shows the projected expenditures which are matching the 10 year long term financial plan (Scenario 3 –
Balanced with Long Term Financial Plan). Ongoing consideration of future funding is required as this expenditure will
result in the consequence of declining service levels and increasing risk.
Expenditure projections are in2012 real values.
Table 6.1.2.S3: Projected Expenditures for Long Term Financial Plan ($000) – Based on Scenario 3 – Balanced with
available funding
Year Operations
($000)
Maintenance
($000)
Projected Capital
Renewal ($000)
Capital Upgrade/
New ($000)
Disposals
($000)
2013 $274.00 $250.00 $0.00 $100.00 $0.00
2014 $275.59 $252.27 $0.00 $100.00 $0.00
2015 $277.18 $254.54 $0.00 $100.00 $0.00
2016 $278.77 $256.81 $0.00 $100.00 $0.00
2017 $280.35 $259.08 $0.00 $100.00 $0.00
2018 $281.94 $261.36 $0.00 $100.00 $0.00
2019 $283.53 $263.63 $0.00 $100.00 $0.00
2020 $285.12 $265.90 $0.00 $100.00 $0.00
2021 $286.71 $268.17 $0.00 $100.00 $0.00
2022 $288.30 $270.44 $0.00 $100.00 $0.00
6.2 Funding Strategy
After reviewing service levels, as appropriate to ensure ongoing financial sustainability projected expenditures
identified in Section 6.1.2 will be accommodated in the organisation’s 10 year long term financial plan.
6.3 Valuation Forecasts
Asset values are forecast to increase as additional assets are added to the asset stock from construction and
acquisition by the organisation and from assets constructed by land developers and others and donated to the
organisation. Figure 9 shows the projected replacement cost asset values over the planning period in real values.

50
Cobar Shire Council – Sewerage Network Asset Management Plan
Figure 9: Projected Asset Values
Depreciation expense values are forecast in line with asset values as shown in Figure 10.
Figure 10: Projected Depreciation Expense
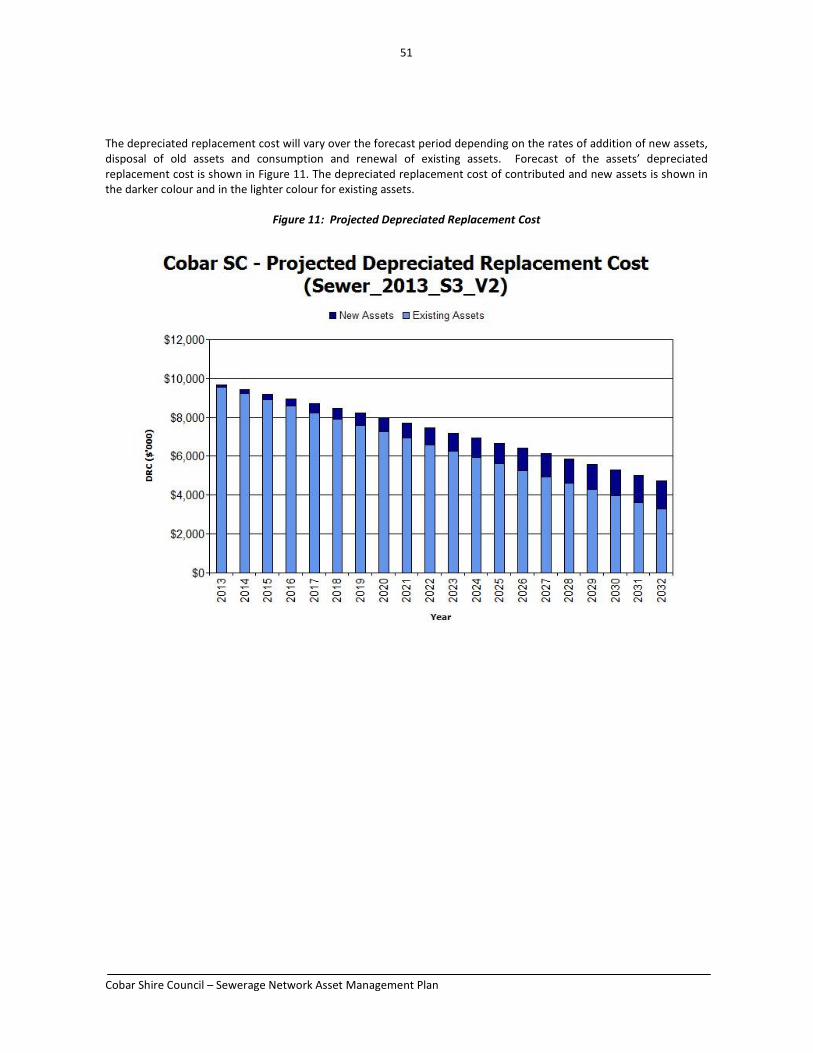
51
Cobar Shire Council – Sewerage Network Asset Management Plan
The depreciated replacement cost will vary over the forecast period depending on the rates of addition of new assets,
disposal of old assets and consumption and renewal of existing assets. Forecast of the assets’ depreciated
replacement cost is shown in Figure 11. The depreciated replacement cost of contributed and new assets is shown in
the darker colour and in the lighter colour for existing assets.
Figure 11: Projected Depreciated Replacement Cost
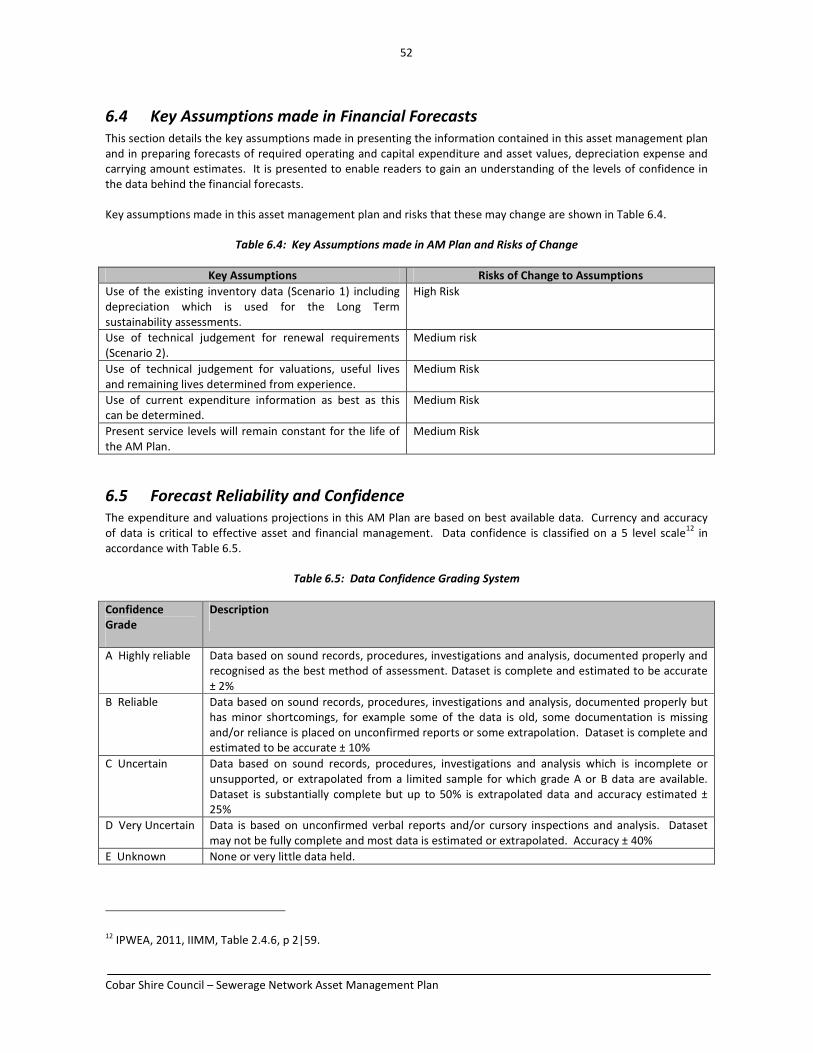
52
Cobar Shire Council – Sewerage Network Asset Management Plan
6.4 Key Assumptions made in Financial Forecasts
This section details the key assumptions made in presenting the information contained in this asset management plan
and in preparing forecasts of required operating and capital expenditure and asset values, depreciation expense and
carrying amount estimates. It is presented to enable readers to gain an understanding of the levels of confidence in
the data behind the financial forecasts.
Key assumptions made in this asset management plan and risks that these may change are shown in Table 6.4.
Table 6.4: Key Assumptions made in AM Plan and Risks of Change
Key Assumptions Risks of Change to Assumptions
Use of the existing inventory data (Scenario 1) including
depreciation which is used for the Long Term
sustainability assessments.
High Risk
Use of technical judgement for renewal requirements
(Scenario 2).
Medium risk
Use of technical judgement for valuations, useful lives
and remaining lives determined from experience.
Medium Risk
Use of current expenditure information as best as this
can be determined.
Medium Risk
Present service levels will remain constant for the life of
the AM Plan.
Medium Risk
6.5 Forecast Reliability and Confidence
The expenditure and valuations projections in this AM Plan are based on best available data. Currency and accuracy
of data is critical to effective asset and financial management. Data confidence is classified on a 5 level scale12
in
accordance with Table 6.5.
Table 6.5: Data Confidence Grading System
Confidence
Grade
Description
A Highly reliable Data based on sound records, procedures, investigations and analysis, documented properly and
recognised as the best method of assessment. Dataset is complete and estimated to be accurate
± 2%
B Reliable Data based on sound records, procedures, investigations and analysis, documented properly but
has minor shortcomings, for example some of the data is old, some documentation is missing
and/or reliance is placed on unconfirmed reports or some extrapolation. Dataset is complete and
estimated to be accurate ± 10%
C Uncertain Data based on sound records, procedures, investigations and analysis which is incomplete or
unsupported, or extrapolated from a limited sample for which grade A or B data are available.
Dataset is substantially complete but up to 50% is extrapolated data and accuracy estimated ±
25%
D Very Uncertain Data is based on unconfirmed verbal reports and/or cursory inspections and analysis. Dataset
may not be fully complete and most data is estimated or extrapolated. Accuracy ± 40%
E Unknown None or very little data held.
12 IPWEA, 2011, IIMM, Table 2.4.6, p 2|59.

53
Cobar Shire Council – Sewerage Network Asset Management Plan
The estimated confidence level for and reliability of data used in this AM Plan is shown in Table 6.5.1.
Table 6.5.1: Data Confidence Assessment for Data used in AM Plan
Data Confidence Assessment Comment
Demand drivers C Uncertain Estimated, further substantiation required for next
revision of the AMP.
Growth projections C Uncertain Estimated, further substantiation required for next
revision of the AMP.
Operations expenditures B Reliable Direct from budget, but breakdown into operations and
maintenance and renewal is estimated and requires
development.
Maintenance
expenditures
B Reliable Direct from budget, but breakdown into operations and
maintenance and renewal is estimated and requires
development.
Projected Renewal
expenditures.
- Asset values
B Reliable Estimated from industry accepted unit rates.
- Asset residual values C Uncertain Estimated at valuation. Further assessment required.
- Asset useful lives C Uncertain Estimated using typical industry accepted values.
Further substantiation required for next revision of the
AMP.
- Condition modelling C Uncertain Estimated, further substantiation required for next
revision of the AMP
- Network renewals B Reliable Estimated from first principle costing, further
substantiation required for next revision of the AMP.
- Defect repairs B Reliable Estimated, further substantiation required for next
revision of the AMP.
Upgrade/New
expenditures
C Uncertain Estimated from first principle costing, further
substantiation required for next revision of the AMP.
Disposal expenditures B Reliable Estimated, but not considered to be significant.
Over all data sources, the data confidence is assessed as low/medium confidence level for data used in the
preparation of this AM Plan.
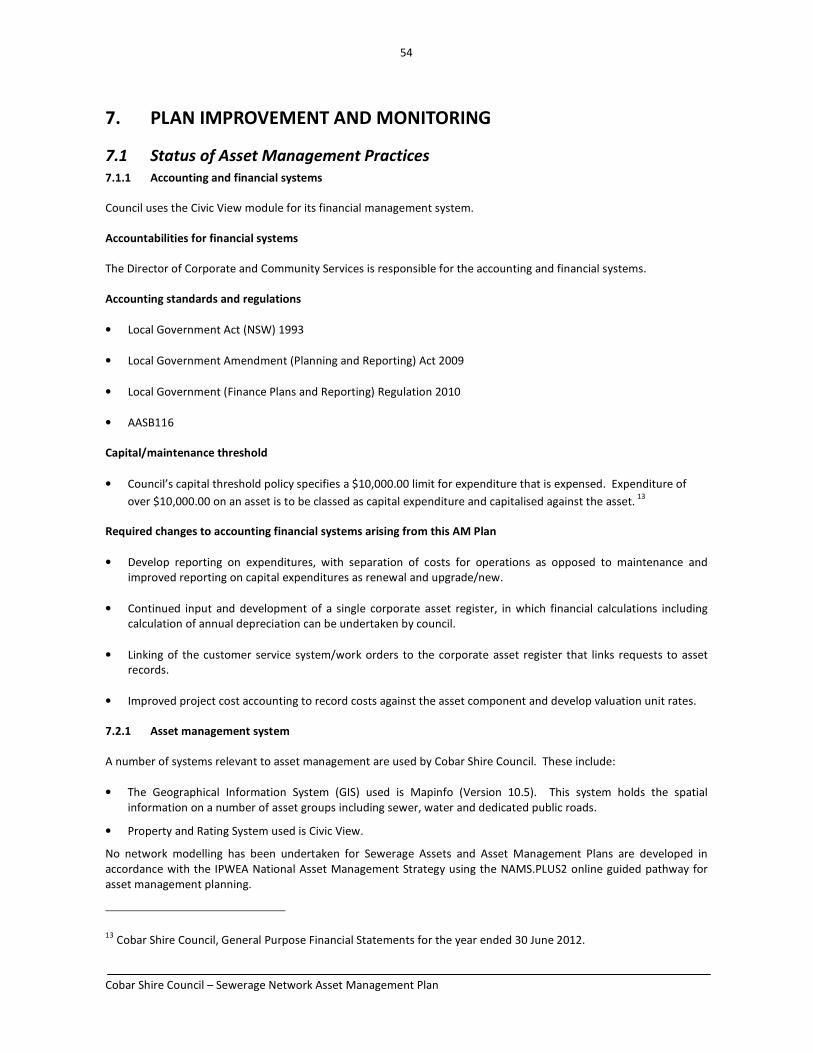
54
Cobar Shire Council – Sewerage Network Asset Management Plan
7. PLAN IMPROVEMENT AND MONITORING
7.1 Status of Asset Management Practices
7.1.1 Accounting and financial systems
Council uses the Civic View module for its financial management system.
Accountabilities for financial systems
The Director of Corporate and Community Services is responsible for the accounting and financial systems.
Accounting standards and regulations
• Local Government Act (NSW) 1993
• Local Government Amendment (Planning and Reporting) Act 2009
• Local Government (Finance Plans and Reporting) Regulation 2010
• AASB116
Capital/maintenance threshold
• Council’s capital threshold policy specifies a $10,000.00 limit for expenditure that is expensed. Expenditure of
over $10,000.00 on an asset is to be classed as capital expenditure and capitalised against the asset. 13
Required changes to accounting financial systems arising from this AM Plan
• Develop reporting on expenditures, with separation of costs for operations as opposed to maintenance and
improved reporting on capital expenditures as renewal and upgrade/new.
• Continued input and development of a single corporate asset register, in which financial calculations including
calculation of annual depreciation can be undertaken by council.
• Linking of the customer service system/work orders to the corporate asset register that links requests to asset
records.
• Improved project cost accounting to record costs against the asset component and develop valuation unit rates.
7.2.1 Asset management system
A number of systems relevant to asset management are used by Cobar Shire Council. These include:
• The Geographical Information System (GIS) used is Mapinfo (Version 10.5). This system holds the spatial
information on a number of asset groups including sewer, water and dedicated public roads.
• Property and Rating System used is Civic View.
No network modelling has been undertaken for Sewerage Assets and Asset Management Plans are developed in
accordance with the IPWEA National Asset Management Strategy using the NAMS.PLUS2 online guided pathway for
asset management planning.
13 Cobar Shire Council, General Purpose Financial Statements for the year ended 30 June 2012.

55
Cobar Shire Council – Sewerage Network Asset Management Plan
Accountabilities for asset management system and data maintenance
The responsibility for operating and maintaining the Asset Management System and processes for Sewerage Assets is
with Engineering Services Department of Council.
Due to the additional requirements to meet financial reporting standards for Fair Value and the likely requirements
for a higher standard of reporting on infrastructure assets, it is likely that there will be need to consolidate asset
management information into one core corporate system. The ongoing maintenance of this system should then
become a core function within Council’s operations.
Required changes to asset management system arising from this AM Plan
• Review of accuracy and currency of asset data,
• Continued development of a single technical asset register as the corporate asset register, in which financial
calculations including calculation of annual depreciation can be undertaken by council at an individual asset
component level.
• Development of a works costing and maintenance management system to improve works planning and cost
recording, in particular to identify expenditure type (operations, maintenance, capital renewal and capital
new/upgrade)
• Improved project cost accounting to record costs against the asset component and develop valuation unit rates.

56
Cobar Shire Council – Sewerage Network Asset Management Plan
7.2 Improvement Program
The asset management improvement plan generated from this asset management plan is shown in Table 7.2.
Table 7.2: Improvement Plan
Task
No
Task Responsibility Resources
Required
Timeline
1 Improve record and reporting on expenditures, with
separate costs for operations, maintenance and capture
capital expenditures as renewal or upgrade/new
Corporate
(Technical &
Financial)
Staff Time July 2013
2 Continue the development of the corporate asset
register, in which financial calculations including
calculation of annual depreciation are undertaken by
council.
Corporate
(Technical &
Financial)
Staff Time July 2013
3 Linking of the customer service system to the corporate
asset register to link requests to asset records
Corporate Staff Time December
2013
4 Continue to improve project cost accounting to record
costs against the asset component and develop
valuation unit rates
Corporate
(Technical &
Financial)
Staff Time July 2013
5 Review the accuracy and currency of asset data Technical Staff Time July 2013
6 Review methodology for determining remaining life,
with detail assessment for assets requiring renewal in
the medium term (next 10-20 years)
An outcome should be that the remaining lives from the
asset register will generate a renewal scenario aligning
with the Works Program and Long Term Financial Plan.
(Scenario 1 described in this asset management plan
will match Scenario 3)
Corporate
(Technical &
Financial)
Staff Time December
2013
8 Develop procedures for maintaining the Asset and
Financial Registers
Corporate
(Technical &
Financial)
Staff Time Ongoing
9 Maintenance response levels should be documented
and adopted.
Technical
Services
Staff Time December
2013
7.3 Monitoring and Review Procedures
This asset management plan will be reviewed during annual budget planning processes and amended to recognise any
material changes in service levels and/or resources available to provide those services as a result of budget decisions.
The AM Plan will be updated annually to ensure it represents the current service level, asset values, projected
operations, maintenance, capital renewal and replacement, capital upgrade/new and asset disposal expenditures and
projected expenditure values incorporated into the Council’s long term financial plan.
The AM Plan has a life of 4 years (Council election cycle) and is due for complete revision and updating within 1 year of
each Council election.

57
Cobar Shire Council – Sewerage Network Asset Management Plan
7.4 Performance Measures
The effectiveness of the asset management plan can be measured in the following ways:
• The degree to which the required projected expenditures identified in this asset management plan are
incorporated into the organisation’s long term financial plan,
• The degree to which 1-5 year detailed works programs, budgets, business plans and organisational structures
take into account the ‘global’ works program trends provided by the asset management plan,
• The degree to which the existing and projected service levels and service consequences (what we cannot do),
risks and residual risks are incorporated into the organisation’s Strategic Plan and associated plans,
• The Asset Renewal Funding Ratio achieving the target of 1.0.
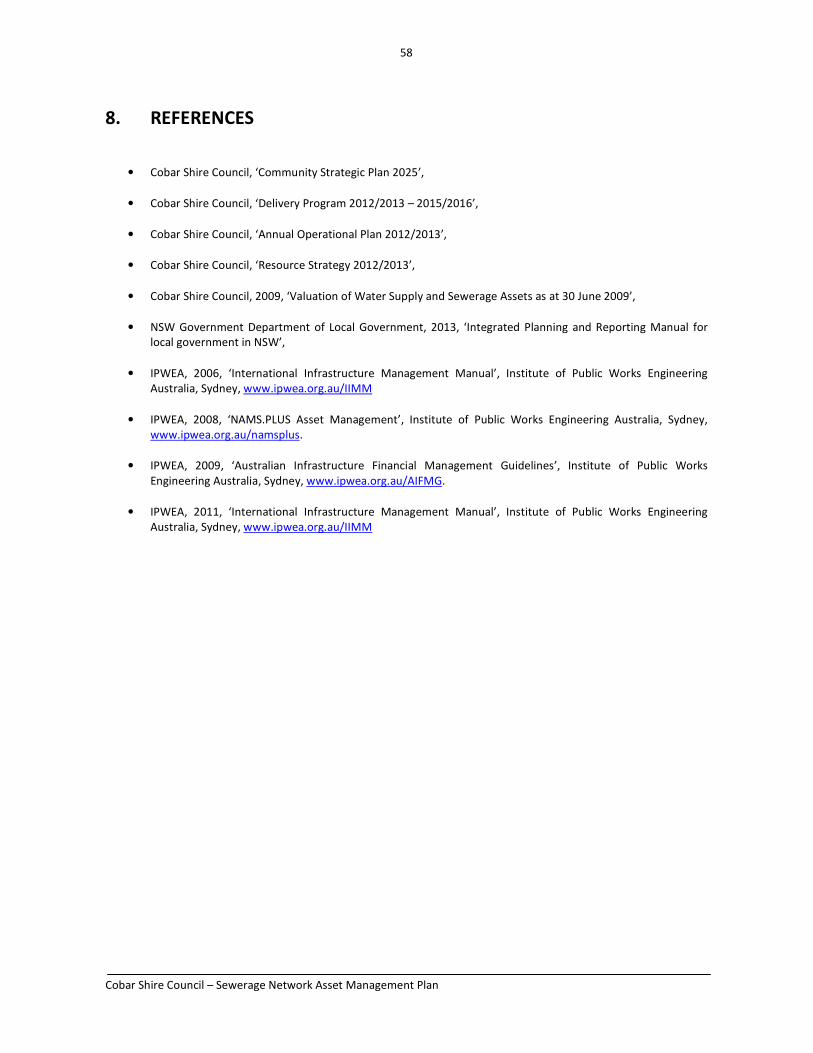
58
Cobar Shire Council – Sewerage Network Asset Management Plan
8. REFERENCES
• Cobar Shire Council, ‘Community Strategic Plan 2025’,
• Cobar Shire Council, ‘Delivery Program 2012/2013 – 2015/2016’,
• Cobar Shire Council, ‘Annual Operational Plan 2012/2013’,
• Cobar Shire Council, ‘Resource Strategy 2012/2013’,
• Cobar Shire Council, 2009, ‘Valuation of Water Supply and Sewerage Assets as at 30 June 2009’,
• NSW Government Department of Local Government, 2013, ‘Integrated Planning and Reporting Manual for
local government in NSW’,
• IPWEA, 2006, ‘International Infrastructure Management Manual’, Institute of Public Works Engineering
Australia, Sydney, www.ipwea.org.au/IIMM
• IPWEA, 2008, ‘NAMS.PLUS Asset Management’, Institute of Public Works Engineering Australia, Sydney,
www.ipwea.org.au/namsplus.
• IPWEA, 2009, ‘Australian Infrastructure Financial Management Guidelines’, Institute of Public Works
Engineering Australia, Sydney, www.ipwea.org.au/AIFMG.
• IPWEA, 2011, ‘International Infrastructure Management Manual’, Institute of Public Works Engineering
Australia, Sydney, www.ipwea.org.au/IIMM

59
Cobar Shire Council – Sewerage Network Asset Management Plan
9. APPENDICES
Appendix A Maintenance and Renewal Requirements to Sustain Levels of Service
Appendix B Projected 10 year Capital Renewal and Replacement Works Program
Appendix C Projected 10 year Capital Upgrade/New Works Program
Appendix D Budgeted Expenditures Accommodated in LTFP
Appendix E Abbreviations
Appendix F Glossary

60
Cobar Shire Council – Sewerage Network Asset Management Plan
Appendix A Maintenance and Renewal Requirements to Sustain Levels of Service
Maintenance Response
Maintenance response is based on site judgement using the condition and risk associated with the defect and to the
extent of the current budget.
Renewal Requirements
The renewal requirements included in this Asset Management Plan have been developed from 2 sources:
• The first source was from the current asset inventory held by council, and has been referred to as Scenario 1.
• The second source is based on the assessment by council’s technical staff of the average network renewals
required to keep service levels at the current level. E.g. Average renewal of sewer mains.
It is common that the valuation registers used in Scenario 1 are not developed to a level of maturity where they are
reliable for producing a realistic renewal forecast. For Cobar Shire Council the refinement of the asset register to
achieve this situation should become an important part of the asset management improvement plan.
Scenario 2 is prepared using the technical estimates of what renewal is required to sustain the current levels of
service. The scenario 2 assessments are summarised below:
Average Annual Network Renewal Requirements
Network Renewals Estimate
$000’s
Sewer Reline / Replacements
(42.7km / 70 yr life x $262,000 / km)
$160
Sewage Pump Stations
(5 Pump Stations / 50 yr life x $504,000 / pump station)
$50
Sewage Treatment
(1 Treatment Plant / 70 yr life x $3,970,000 to replace/renew)
$57
Total $267

61
Cobar Shire Council – Sewerage Network Asset Management Plan
Appendix B Projected 10 year Capital Renewal and Replacement Works Program
Year Item Description Estimate ($000)
2013 Network Renewals
1 Sewer Reline / Replacements (42.7km / 70 yr life x $262,000 / km) $160
2 Sewage Pump Stations (5 Pump Stations / 50 yr life x $504,000 / pump station) $50
3 Sewage Treatment (1 Treatment Plant / 70 yr life x $3,970,000 to replace/renew) $57
2013 Total $267
2014 Network Renewals
1 Sewer Reline / Replacements (42.7km / 70 yr life x $262,000 / km) $160
2 Sewage Pump Stations (5 Pump Stations / 50 yr life x $504,000 / pump station) $50
3 Sewage Treatment (1 Treatment Plant / 70 yr life x $3,970,000 to replace/renew) $57
2014 Total $267
2015 Network Renewals
1 Sewer Reline / Replacements (42.7km / 70 yr life x $262,000 / km) $160
2 Sewage Pump Stations (5 Pump Stations / 50 yr life x $504,000 / pump station) $50
3 Sewage Treatment (1 Treatment Plant / 70 yr life x $3,970,000 to replace/renew) $57
2015 Total $267
2016 Network Renewals Estimate
1 Sewer Reline / Replacements (42.7km / 70 yr life x $262,000 / km) $160
2 Sewage Pump Stations (5 Pump Stations / 50 yr life x $504,000 / pump station) $50
3 Sewage Treatment (1 Treatment Plant / 70 yr life x $3,970,000 to replace/renew) $57
2016 Total $267
2017 Network Renewals
1 Sewer Reline / Replacements (42.7km / 70 yr life x $262,000 / km) $160
2 Sewage Pump Stations (5 Pump Stations / 50 yr life x $504,000 / pump station) $50
3 Sewage Treatment (1 Treatment Plant / 70 yr life x $3,970,000 to replace/renew) $57
2017 Total $267
2018 Network Renewals
1 Sewer Reline / Replacements (42.7km / 70 yr life x $262,000 / km) $160
2 Sewage Pump Stations (5 Pump Stations / 50 yr life x $504,000 / pump station) $50
3 Sewage Treatment (1 Treatment Plant / 70 yr life x $3,970,000 to replace/renew) $57
2018 Total $267
2019 Network Renewals
1 Sewer Reline / Replacements (42.7km / 70 yr life x $262,000 / km) $160
2 Sewage Pump Stations (5 Pump Stations / 50 yr life x $504,000 / pump station) $50
3 Sewage Treatment (1 Treatment Plant / 70 yr life x $3,970,000 to replace/renew) $57
2019 Total $267
2020 Network Renewals
1 Sewer Reline / Replacements (42.7km / 70 yr life x $262,000 / km) $160
2 Sewage Pump Stations (5 Pump Stations / 50 yr life x $504,000 / pump station) $50
3 Sewage Treatment (1 Treatment Plant / 70 yr life x $3,970,000 to replace/renew) $57
2020 Total $267
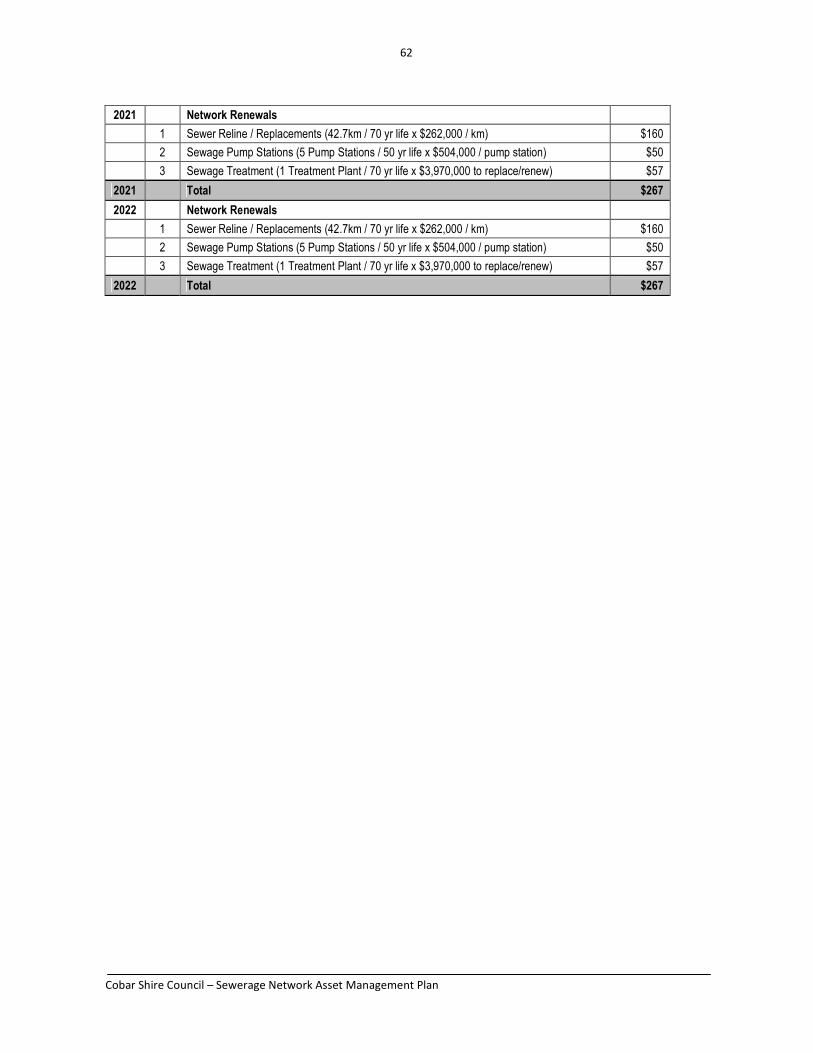
62
Cobar Shire Council – Sewerage Network Asset Management Plan
2021 Network Renewals
1 Sewer Reline / Replacements (42.7km / 70 yr life x $262,000 / km) $160
2 Sewage Pump Stations (5 Pump Stations / 50 yr life x $504,000 / pump station) $50
3 Sewage Treatment (1 Treatment Plant / 70 yr life x $3,970,000 to replace/renew) $57
2021 Total $267
2022 Network Renewals
1 Sewer Reline / Replacements (42.7km / 70 yr life x $262,000 / km) $160
2 Sewage Pump Stations (5 Pump Stations / 50 yr life x $504,000 / pump station) $50
3 Sewage Treatment (1 Treatment Plant / 70 yr life x $3,970,000 to replace/renew) $57
2022 Total $267

63
Cobar Shire Council – Sewerage Network Asset Management Plan
Appendix C Projected Upgrade/Exp/New 10 year Capital Works Program
Year Item Description Estimate
2013 1 Planned/Required Sewerage Network Upgrade and/or New Works $100
2013 Total $100
2014 1 Planned/Required Sewerage Network Upgrade and/or New Works $100
2014 Total $100
2015 1 Planned/Required Sewerage Network Upgrade and/or New Works $100
2015 Total $100
2016 1 Planned/Required Sewerage Network Upgrade and/or New Works $100
2016 Total $100
2017 1 Planned/Required Sewerage Network Upgrade and/or New Works $100
2017 Total $100
2018 1 Planned/Required Sewerage Network Upgrade and/or New Works $100
2018 Total $100
2019 1 Planned/Required Sewerage Network Upgrade and/or New Works $100
2019 Total $100
2020 1 Planned/Required Sewerage Network Upgrade and/or New Works $100
2020 Total $100
2021 1 Planned/Required Sewerage Network Upgrade and/or New Works $100
2021 Total $100
2022 1 Planned/Required Sewerage Network Upgrade and/or New Works $100
2022 Total $100

64
Cobar Shire Council – Sewerage Network Asset Management Plan
Appendix D Budgeted Expenditures Accommodated in LTFP
2013
Sewer_2013
Asset values as at 30 June 2012 Calc CRC from Asset Register
$17,247 (000) $0 (000) % of asset value
$11,008 (000) This is a check for you. 1.59%
$9,897 (000) 2.27%
$330 (000) 3.00%
Planned renewal budget (information only)
Planned Expenditures from LTFP You may use these values
calculated from your data
2013 values or overwrite the links.
Year ending June 2013 2014 2015 2016 2017 2018 2019 2020 2021 2022
$000 $000 $000 $000 $000 $000 $000 $000 $000 $000
Expenditure Outlays included in Long Term Financial Plan (in current $ values)
Operations budget $274 $274 $274 $274 $274 $274 $274 $274 $274 $274
Management budget $0 $0 $0 $0 $0 $0 $0 $0 $0 $0
AM systems budget $0 $0 $0 $0 $0 $0 $0 $0 $0 $0
Total operations $274 $274 $274 $274 $274 $274 $274 $274 $274 $274
Reactive maintenance budget $250 $250 $250 $250 $250 $250 $250 $250 $250 $250
Planned maintenance budget $0 $0 $0 $0 $0 $0 $0 $0 $0 $0
Specific maintenance items budget $0 $0 $0 $0 $0 $0 $0 $0 $0 $0
Total maintenance $250 $250 $250 $250 $250 $250 $250 $250 $250 $250
Planned renewal budget $0 $0 $0 $0 $0 $0 $0 $0 $0 $0
Planned upgrade/new budget $100 $100 $100 $100 $100 $100 $100 $100 $100 $100
Non-growth contributed asset value $0 $0 $0 $0 $0 $0 $0 $0 $0 $0
Asset Disposals
Est Cost to dispose of assets $0 $0 $0 $0 $0 $0 $0 $0 $0 $0
Carrying value (DRC) of disposed assets $0 $0 $0 $0 $0 $0 $0 $0 $0 $0
Additional Expenditure Outlays Requirements (e.g from Infrastructure Risk Management Plan)
Additional Expenditure Outlays required 2013 2014 2015 2016 2017 2018 2019 2020 2021 2022
and not included above $000 $000 $000 $000 $000 $000 $000 $000 $000 $000
Operations $0 $0 $0 $0 $0 $0 $0 $0 $0 $0
Maintenance $0 $0 $0 $0 $0 $0 $0 $0 $0 $0
Capital Renewal to be incorporated into Forms 2 & 2.1 (where Method 1 is used) OR Form 2B Defect Repairs (where Method 2 or 3 is used)
Capital Upgrade $0 $0 $0 $0 $0 $0 $0 $0 $0 $0
User Comments #2
Forecasts for Capital Renewal using Methods 2 & 3 (Form 2A & 2B) & Capital Upgrade (Form 2C)
2013 2014 2015 2016 2017 2018 2019 2020 2021 2022
Forecast Capital Renewal $000 $000 $000 $000 $000 $000 $000 $000 $000 $000
from Forms 2A & 2B $0 $0 $0 $0 $0 $0 $0 $0 $0 $0
Forecast Capital Upgrade
from Form 2C $100 $100 $100 $100 $100 $100 $100 $100 $100 $100
Annual depreciation expense
Operations
Maintenance
Capital
20 Year Expenditure Projections Note: Enter all values in current
Sewer_2013_S3_V2 Asset Management Plan
Depreciable amount
Depreciated replacement cost
Current replacement cost
Cobar SCNAMS.PLUS2 Asset Management
Additional operations costs
Additional maintenance
Additional depreciation
First year of expenditure projections
© Copyright. All rights reserved. The Institute of Public Works Engineering Australia.
(yr ending 30 June)
from New Assets
Operations and Maintenance Costs

65
Cobar Shire Council – Sewerage Network Asset Management Plan
Appendix E Abbreviations
AAAC Average annual asset consumption
AM Asset management
AMP Asset management plan
ARI Average recurrence interval
ASC Annual service cost
CRC Current replacement cost
CWMS Community wastewater management systems
DA Depreciable amount
DRC Depreciated replacement cost
IRMP Infrastructure risk management plan
LCC Life Cycle cost
LCE Life cycle expenditure
LTFP Long term financial plan
MMS Maintenance management system
RV Residual value
SoA State of the Assets
WDCRD Written down current replacement cost

66
Cobar Shire Council – Sewerage Network Asset Management Plan
Appendix F Glossary

67
Cobar Shire Council – Sewerage Network Asset Management Plan
Annual service cost (ASC)
1) Reporting actual cost
The annual (accrual) cost of providing a service
including operations, maintenance, depreciation,
finance/opportunity and disposal costs less revenue.
2) For investment analysis and budgeting
An estimate of the cost that would be tendered,
per annum, if tenders were called for the supply of a
service to a performance specification for a fixed term.
The Annual Service Cost includes operations,
maintenance, depreciation, finance/ opportunity and
disposal costs, less revenue.
Asset
A resource controlled by an entity as a result of past
events and from which future economic benefits are
expected to flow to the entity. Infrastructure assets
are a sub-class of property, plant and equipment
which are non-current assets with a life greater than
12 months and enable services to be provided.
Asset category
Sub-group of assets within a class hierarchy for
financial reporting and management purposes.
Asset class
A group of assets having a similar nature or function in
the operations of an entity, and which, for purposes of
disclosure, is shown as a single item without
supplementary disclosure.
Asset condition assessment
The process of continuous or periodic inspection,
assessment, measurement and interpretation of the
resultant data to indicate the condition of a specific
asset so as to determine the need for some
preventative or remedial action.
Asset hierarchy
A framework for segmenting an asset base into
appropriate classifications. The asset hierarchy can be
based on asset function or asset type or a combination
of the two.
Asset management (AM)
The combination of management, financial, economic,
engineering and other practices applied to physical
assets with the objective of providing the required
level of service in the most cost effective manner.
Asset renewal funding ratio
The ratio of the net present value of asset renewal
funding accommodated over a 10 year period in a long
term financial plan relative to the net present value of
projected capital renewal expenditures identified in an
asset management plan for the same period [AIFMG
Financial Sustainability Indicator No 8].
Average annual asset consumption (AAAC)*
The amount of an organisation’s asset base consumed
during a reporting period (generally a year). This may
be calculated by dividing the depreciable amount by
the useful life (or total future economic
benefits/service potential) and totalled for each and
every asset OR by dividing the carrying amount
(depreciated replacement cost) by the remaining
useful life (or remaining future economic
benefits/service potential) and totalled for each and
every asset in an asset category or class.
Borrowings
A borrowing or loan is a contractual obligation of the
borrowing entity to deliver cash or another financial
asset to the lending entity over a specified period of
time or at a specified point in time, to cover both the
initial capital provided and the cost of the interest
incurred for providing this capital. A borrowing or loan
provides the means for the borrowing entity to
finance outlays (typically physical assets) when it has
insufficient funds of its own to do so, and for the
lending entity to make a financial return, normally in
the form of interest revenue, on the funding provided.
Capital expenditure
Relatively large (material) expenditure, which has
benefits, expected to last for more than 12 months.
Capital expenditure includes renewal, expansion and
upgrade. Where capital projects involve a combination
of renewal, expansion and/or upgrade expenditures,
the total project cost needs to be allocated
accordingly.
Capital expenditure - expansion
Expenditure that extends the capacity of an existing
asset to provide benefits, at the same standard as is
currently enjoyed by existing beneficiaries, to a new

68
Cobar Shire Council – Sewerage Network Asset Management Plan
group of users. It is discretionary expenditure, which
increases future operations and maintenance costs,
because it increases the organisation’s asset base, but
may be associated with additional revenue from the
new user group, eg. extending a drainage or road
network, the provision of an oval or park in a new
suburb for new residents.
Capital expenditure - new
Expenditure which creates a new asset providing a
new service/output that did not exist beforehand. As it
increases service potential it may impact revenue and
will increase future operations and maintenance
expenditure.
Capital expenditure - renewal
Expenditure on an existing asset or on replacing an
existing asset, which returns the service capability of
the asset up to that which it had originally. It is
periodically required expenditure, relatively large
(material) in value compared with the value of the
components or sub-components of the asset being
renewed. As it reinstates existing service potential, it
generally has no impact on revenue, but may reduce
future operations and maintenance expenditure if
completed at the optimum time, eg. resurfacing or
resheeting a material part of a road network, replacing
a material section of a drainage network with pipes of
the same capacity, resurfacing an oval.
Capital expenditure - upgrade
Expenditure, which enhances an existing asset to
provide a higher level of service or expenditure that
will increase the life of the asset beyond that which it
had originally. Upgrade expenditure is discretionary
and often does not result in additional revenue unless
direct user charges apply. It will increase operations
and maintenance expenditure in the future because of
the increase in the organisation’s asset base, eg.
widening the sealed area of an existing road, replacing
drainage pipes with pipes of a greater capacity,
enlarging a grandstand at a sporting facility.
Capital funding
Funding to pay for capital expenditure.
Capital grants
Monies received generally tied to the specific projects
for which they are granted, which are often upgrade
and/or expansion or new investment proposals.
Capital investment expenditure
See capital expenditure definition
Capitalisation threshold
The value of expenditure on non-current assets above
which the expenditure is recognised as capital
expenditure and below which the expenditure is
charged as an expense in the year of acquisition.
Carrying amount
The amount at which an asset is recognised after
deducting any accumulated depreciation /
amortisation and accumulated impairment losses
thereon.
Class of assets
See asset class definition
Component
Specific parts of an asset having independent physical
or functional identity and having specific attributes
such as different life expectancy, maintenance
regimes, risk or criticality.
Core asset management
Asset management which relies primarily on the use of
an asset register, maintenance management systems,
job resource management, inventory control,
condition assessment, simple risk assessment and
defined levels of service, in order to establish
alternative treatment options and long-term cashflow
predictions. Priorities are usually established on the
basis of financial return gained by carrying out the
work (rather than detailed risk analysis and optimised
decision- making).
Cost of an asset
The amount of cash or cash equivalents paid or the
fair value of the consideration given to acquire an
asset at the time of its acquisition or construction,
including any costs necessary to place the asset into
service. This includes one-off design and project
management costs.
Critical assets

69
Cobar Shire Council – Sewerage Network Asset Management Plan
Assets for which the financial, business or service level
consequences of failure are sufficiently severe to
justify proactive inspection and rehabilitation. Critical
assets have a lower threshold for action than non-
critical assets.
Current replacement cost (CRC)
The cost the entity would incur to acquire the asset on
the reporting date. The cost is measured by reference
to the lowest cost at which the gross future economic
benefits could be obtained in the normal course of
business or the minimum it would cost, to replace the
existing asset with a technologically modern
equivalent new asset (not a second hand one) with the
same economic benefits (gross service potential)
allowing for any differences in the quantity and quality
of output and in operating costs.
Deferred maintenance
The shortfall in rehabilitation work undertaken relative
to that required to maintain the service potential of an
asset.
Depreciable amount
The cost of an asset, or other amount substituted for
its cost, less its residual value.
Depreciated replacement cost (DRC)
The current replacement cost (CRC) of an asset less,
where applicable, accumulated depreciation
calculated on the basis of such cost to reflect the
already consumed or expired future economic benefits
of the asset.
Depreciation / amortisation
The systematic allocation of the depreciable amount
(service potential) of an asset over its useful life.
Economic life
See useful life definition.
Expenditure
The spending of money on goods and services.
Expenditure includes recurrent and capital outlays.
Fair value
The amount for which an asset could be exchanged, or
a liability settled, between knowledgeable, willing
parties, in an arms length transaction.
Financing gap
A financing gap exists whenever an entity has
insufficient capacity to finance asset renewal and
other expenditure necessary to be able to
appropriately maintain the range and level of services
its existing asset stock was originally designed and
intended to deliver. The service capability of the
existing asset stock should be determined assuming no
additional operating revenue, productivity
improvements, or net financial liabilities above levels
currently planned or projected. A current financing
gap means service levels have already or are currently
falling. A projected financing gap if not addressed will
result in a future diminution of existing service levels.
Heritage asset
An asset with historic, artistic, scientific, technological,
geographical or environmental qualities that is held
and maintained principally for its contribution to
knowledge and culture and this purpose is central to
the objectives of the entity holding it.
Impairment Loss
The amount by which the carrying amount of an asset
exceeds its recoverable amount.
Infrastructure assets
Physical assets that contribute to meeting the needs
of organisations or the need for access to major
economic and social facilities and services, eg. roads,
drainage, footpaths and cycleways. These are typically
large, interconnected networks or portfolios of
composite assets. The components of these assets
may be separately maintained, renewed or replaced
individually so that the required level and standard of
service from the network of assets is continuously
sustained. Generally the components and hence the
assets have long lives. They are fixed in place and are
often have no separate market value.
Investment property

70
Cobar Shire Council – Sewerage Network Asset Management Plan
Property held to earn rentals or for capital
appreciation or both, rather than for:
(a) use in the production or supply of goods or services
or for administrative purposes; or
(b) sale in the ordinary course of business.
Key performance indicator
A qualitative or quantitative measure of a service or
activity used to compare actual performance against a
standard or other target. Performance indicators
commonly relate to statutory limits, safety,
responsiveness, cost, comfort, asset performance,
reliability, efficiency, environmental protection and
customer satisfaction.
Level of service
The defined service quality for a particular
service/activity against which service performance
may be measured. Service levels usually relate to
quality, quantity, reliability, responsiveness,
environmental impact, acceptability and cost.
Life Cycle Cost *
1. Total LCC The total cost of an asset throughout its
life including planning, design, construction,
acquisition, operation, maintenance,
rehabilitation and disposal costs.
2. Average LCC The life cycle cost (LCC) is average
cost to provide the service over the longest asset
life cycle. It comprises average operations,
maintenance expenditure plus asset consumption
expense, represented by depreciation expense
projected over 10 years. The Life Cycle Cost does
not indicate the funds required to provide the
service in a particular year.
Life Cycle Expenditure
The Life Cycle Expenditure (LCE) is the average
operations, maintenance and capital renewal
expenditure accommodated in the long term financial
plan over 10 years. Life Cycle Expenditure may be
compared to average Life Cycle Cost to give an initial
indicator of affordability of projected service levels
when considered with asset age profiles.
Loans / borrowings
See borrowings.
Maintenance
All actions necessary for retaining an asset as near as
practicable to an appropriate service condition,
including regular ongoing day-to-day work necessary
to keep assets operating, eg road patching but
excluding rehabilitation or renewal. It is operating
expenditure required to ensure that the asset reaches
its expected useful life.
• Planned maintenance
Repair work that is identified and managed through a
maintenance management system (MMS). MMS
activities include inspection, assessing the condition
against failure/breakdown criteria/experience,
prioritising scheduling, actioning the work and
reporting what was done to develop a maintenance
history and improve maintenance and service delivery
performance.
• Reactive maintenance
Unplanned repair work that is carried out in response
to service requests and management/ supervisory
directions.
• Specific maintenance
Maintenance work to repair components or replace
sub-components that needs to be identified as a
specific maintenance item in the maintenance budget.
• Unplanned maintenance
Corrective work required in the short-term to restore
an asset to working condition so it can continue to
deliver the required service or to maintain its level of
security and integrity.
Maintenance expenditure *
Recurrent expenditure, which is periodically or
regularly required as part of the anticipated schedule
of works required to ensure that the asset achieves its
useful life and provides the required level of service. It
is expenditure, which was anticipated in determining
the asset’s useful life.
Materiality
The notion of materiality guides the margin of error
acceptable, the degree of precision required and the
extent of the disclosure required when preparing
general purpose financial reports. Information is
material if its omission, misstatement or non-

71
Cobar Shire Council – Sewerage Network Asset Management Plan
disclosure has the potential, individually or
collectively, to influence the economic decisions of
users taken on the basis of the financial report or
affect the discharge of accountability by the
management or governing body of the entity.
Modern equivalent asset
Assets that replicate what is in existence with the
most cost-effective asset performing the same level of
service. It is the most cost efficient, currently available
asset which will provide the same stream of services
as the existing asset is capable of producing. It allows
for technology changes and, improvements and
efficiencies in production and installation techniques
Net present value (NPV)
The value to the organisation of the cash flows
associated with an asset, liability, activity or event
calculated using a discount rate to reflect the time
value of money. It is the net amount of discounted
total cash inflows after deducting the value of the
discounted total cash outflows arising from eg the
continued use and subsequent disposal of the asset
after deducting the value of the discounted total cash
outflows.
Non-revenue generating investments
Investments for the provision of goods and services to
sustain or improve services to the community that are
not expected to generate any savings or revenue to
the Council, eg. parks and playgrounds, footpaths,
roads and bridges, libraries, etc.
Operations
Regular activities to provide services such as public
health, safety and amenity, eg street sweeping, grass
mowing and street lighting.
Operating expenditure
Recurrent expenditure, which is continuously required
to provide a service. In common use the term typically
includes, eg power, fuel, staff, plant equipment, on-
costs and overheads but excludes maintenance and
depreciation. Maintenance and depreciation is on the
other hand included in operating expenses.
Operating expense
The gross outflow of economic benefits, being cash
and non cash items, during the period arising in the
course of ordinary activities of an entity when those
outflows result in decreases in equity, other than
decreases relating to distributions to equity
participants.
Operating expenses
Recurrent expenses continuously required to provide a
service, including power, fuel, staff, plant equipment,
maintenance, depreciation, on-costs and overheads.
Operations, maintenance and renewal financing ratio
Ratio of estimated budget to projected expenditure
for operations, maintenance and renewal of assets
over a defined time (eg 5, 10 and 15 years).
Operations, maintenance and renewal gap
Difference between budgeted expenditures in a long
term financial plan (or estimated future budgets in
absence of a long term financial plan) and projected
expenditures for operations, maintenance and
renewal of assets to achieve/maintain specified
service levels, totalled over a defined time (e.g. 5, 10
and 15 years).
Pavement management system (PMS)
A systematic process for measuring and predicting the
condition of road pavements and wearing surfaces
over time and recommending corrective actions.
PMS Score
A measure of condition of a road segment determined
from a Pavement Management System.
Rate of annual asset consumption *
The ratio of annual asset consumption relative to the
depreciable amount of the assets. It measures the
amount of the consumable parts of assets that are
consumed in a period (depreciation) expressed as a
percentage of the depreciable amount.
Rate of annual asset renewal *
The ratio of asset renewal and replacement
expenditure relative to depreciable amount for a
period. It measures whether assets are being replaced
at the rate they are wearing out with capital renewal
expenditure expressed as a percentage of depreciable
amount (capital renewal expenditure/DA).
Rate of annual asset upgrade/new *
72
Cobar Shire Council – Sewerage Network Asset Management Plan
A measure of the rate at which assets are being
upgraded and expanded per annum with capital
upgrade/new expenditure expressed as a percentage
of depreciable amount (capital upgrade/expansion
expenditure/DA).
Recoverable amount
The higher of an asset's fair value, less costs to sell and
its value in use.
Recurrent expenditure
Relatively small (immaterial) expenditure or that
which has benefits expected to last less than 12
months. Recurrent expenditure includes operations
and maintenance expenditure.
Recurrent funding
Funding to pay for recurrent expenditure.
Rehabilitation
See capital renewal expenditure definition above.
Remaining useful life
The time remaining until an asset ceases to provide
the required service level or economic usefulness. Age
plus remaining useful life is useful life.
Renewal
See capital renewal expenditure definition above.
Residual value
The estimated amount that an entity would currently
obtain from disposal of the asset, after deducting the
estimated costs of disposal, if the asset were already
of the age and in the condition expected at the end of
its useful life.
Revenue generating investments
Investments for the provision of goods and services to
sustain or improve services to the community that are
expected to generate some savings or revenue to
offset operating costs, eg public halls and theatres,
childcare centres, sporting and recreation facilities,
tourist information centres, etc.
Risk management
The application of a formal process to the range of
possible values relating to key factors associated with
a risk in order to determine the resultant ranges of
outcomes and their probability of occurrence.
Section or segment
A self-contained part or piece of an infrastructure
asset.
Service potential
The total future service capacity of an asset. It is
normally determined by reference to the operating
capacity and economic life of an asset. A measure of
service potential is used in the not-for-profit
sector/public sector to value assets, particularly those
not producing a cash flow.
Service potential remaining
A measure of the future economic benefits remaining
in assets. It may be expressed in dollar values (Fair
Value) or as a percentage of total anticipated future
economic benefits. It is also a measure of the
percentage of the asset’s potential to provide services
that is still available for use in providing services
(Depreciated Replacement Cost/Depreciable Amount).
Specific Maintenance
Replacement of higher value components/sub-
components of assets that is undertaken on a regular
cycle including repainting, replacement of air
conditioning equipment, etc. This work generally falls
below the capital/ maintenance threshold and needs
to be identified in a specific maintenance budget
allocation.
Strategic Longer-Term Plan
A plan covering the term of office of councillors (4
years minimum) reflecting the needs of the
community for the foreseeable future. It brings
together the detailed requirements in the Council’s
longer-term plans such as the asset management plan
and the long-term financial plan. The plan is prepared
in consultation with the community and details where
the Council is at that point in time, where it wants to
go, how it is going to get there, mechanisms for
monitoring the achievement of the outcomes and how
the plan will be resourced.
Sub-component

73
Cobar Shire Council – Sewerage Network Asset Management Plan
Smaller individual parts that make up a component
part.
Useful life
Either:
(a) the period over which an asset is expected to be
available for use by an entity, or
(b) the number of production or similar units expected
to be obtained from the asset by the entity.
It is estimated or expected time between placing the
asset into service and removing it from service, or the
estimated period of time over which the future
economic benefits embodied in a depreciable asset,
are expected to be consumed by the Council.
Value in Use
The present value of future cash flows expected to be
derived from an asset or cash generating unit. It is
deemed to be depreciated replacement cost (DRC) for
those assets whose future economic benefits are not
primarily dependent on the asset's ability to generate
net cash inflows, where the entity would, if deprived
of the asset, replace its remaining future economic
benefits.
Source: IPWEA, 2009, Glossary
Additional and modified glossary items shown *

74
Cobar Shire Council – Sewerage Network Asset Management Plan
Version Control
No.
Date
Adopted
Minute
No.
Date Commenced
Date notified in
Local Paper
1 24 February 2011 25.2.2011 25/02/2011 No
2 24 April 2013 72.04.2013 25.04.2013 No


