49

����������� � � �
Vision
Mission and Core Values
Fund’s Information
Report of the Directors of the Management Company
Fund Manager’s Report
Performance Table
Trustee Report to the Unit Holders
Review report to the Unit Holders on the Statement of Compliancewith the best practices of the Code of Corporate Governance
Statement of Compliance with the Code of Corporate Governance
Independent Auditor’s Report to the Unit Holder
Statement of Assest and Liabilities
Income Statement
Distribution Statement
Statement of Movement in Unit Holder’s Fund
Cash Flow Statement
Notes to and forming part of the Financial Statements
01
02
03
04
10
13
14
080815
16
19
20
21
22
23
24
25
CONTENTS

1

2

3
FUND’S INFORMATION
Management Company: ABL Asset Management Company Limited 11 – B, Lalazar M. T. Khan Road, Karachi.
Board of Directors Sheikh Mukhtar Ahmed Chairman Mr. Khalid A. Sherwani Mr. Muhammad Waseem Mukhtar Mr. Kamran Nishat Mr. M. Shakeb Murad Mr. M. Jawaid Iqbal Mr. Zia Ijaz Mr. Farid Ahmed Khan CEO
Audit Committee: Mr. Kamran Nishat Chairman Mr. Muhammad Waseem Mukhtar Member Mr. Zia Ijaz Member
Human Resource Committee: Mr. Jawaid Iqbal Chairman Mr. Kamran Nishat Member Mr. Farid Ahmed Khan Member
Chief Executive Officer of Mr. Farid Ahmed KhanThe Management Company:
Chief Financial Officer Mr. Saqib Matin& Company Secretary:
Chief Internal Auditor: Mr. Mubeen Ashraf Bhimani (w.e.f. July 16, 2012)
Trustee: Central Depository Company of Pakistan Ltd. CDC House, 99-B, Block ‘B’, S.M.C.H.S., Main Shahra-e-Faisal, Karachi - 74400
Bankers to the Fund: Allied Bank Limited Bank Al- Falah Limited United Bank Limited Faysal Bank Limited Distributor: Allied Bank Limited BMA Financial Services Limited Vector Consulting (Pvt.) Limited IGI Investment Bank Elixir Securities Pakistan (Pvt.) Limited FundShop Investment Solutions Auditor: A.F. Ferguson & Co Chartered Accountants State Life Building No. 1-C I.I. Chundrigar Road, Karachi.
Legal Advisor: Bawany & Partners Room No. 404, 4th Floor Beaumont Plaza, 6 – C1 – 10, Beaumont Road, Civil Lines, Karachi.
Registrar: ABL Asset Management Company Limited. 11 – B, Lalazar, M. T. Khan Road, Karachi.
Askari Bank LimitedNIB Bank LimitedMCB Bank Limited

REPORT OF THE DIRECTORS OF THEMANAGEMENT COMPANY
The Board of Directors of ABL Asset Management Company Limited, the management company of ABL Stock Fund (ABL-SF), is pleased to present the Audited Financial Statements of ABL Stock Fund for the year ended June 30, 2012.
ECONOMIC PERFORMANCE REVIEWPakistan’s economic landscape remained frail throughout FY12 as deterioration in diplomatic ties with the west, high international oil prices and acute energy shortages severely dampened economic indicators. As a result, economic growth clocked in at a mediocre 3.7% - animprovement over FY12 - but still below the target of 4.2%. Agriculture sector showed some recovery by registering a growth of 3.1% but the services sector underperformed and posted growth of just 4.0% (4.5% in FY11). With the Government deciding to pull out from the IMF program, major fiscal indiscipline was on display. Fiscal deficit was recorded at an alarming 7.4% triggered by heavy government spending, below target tax collection (PKR32bn shortfall), poor privatization proceeds and non-receipt of committed foreign aid.
On the external account front, there was further disappointment as the current account posted a deficit of US$4.5bn in FY12 compared to a surplus of USD214mn in FY11. The high deficit was inflicted by movements in cotton (-43% YoY) and oil prices (+19% YoY), though the impact was somewhat mitigated by record remittances of USD13.2bn. Financial account witnessed a drop of 36% YoY to USD1.35bn in FY12 due to drying up of foreign aid and significant decline of 50% YoY in Foreign Direct Investment. Start of the IMF repayments exerted further downward pressure on FX reserves, which declined to USD 15.2bn compared to USD18.2bn at start of the fiscal year. The rupee consequently followed suit and depreciated by 9.9% to close the year at PKR94.52(Source: SBP) vs. the dollar.
In an effort to spur economic growth, the central bank cut the key policy rate by 200bps to 12% in 1HFY12. However, ineffectiveness of the policy to drive growth, growing inflationary pressures and continuous fiscal indiscipline restricted the central bank’s ability to create more room during FY12. Cumulative CPI for FY12 was recorded at 11.01% against initial target of 12%. Government borrowing swelled as the burgeoning fiscal deficit took its toll. Overall the Govt. borrowed PKR1,198bn for budgetary support during FY12 of which PKR505bn was from the central bank while the rest was from commercial banks. In wake of heavy Government borrowings andstructural problems in the economy (gas and electricity shortage), private sector credit offtake remained subdued at PKR235bn for FY12.
4
82
84
86
88
90
92
94
96
10111213141516171819
FX Reserves
FX Reserves (USD bn) Exchange Rate (RHS)3.0%
4.0%
5.0%
6.0%
7.0%
8.0%
FY08 FY09 FY10 FY11 FY12
Fiscal De cit as % of GDP
Jul-1
1
Aug
-11
Sep-
11
Oct
-11
Nov
-11
Dec
-11
Jan-
12
Feb-
12
Mar
-12
Apr
-12
May
-12
Jun-
12

Looking ahead to FY13, recent improvement in diplomatic ties with the west (resumption of NATO supplies) as well as steep fall in international oil prices (18% drop May- June 2012) augurs well for the balance of payments situation and exchange rate stability. However, given the optimistic budgetary targets set for FY13 and with 2013 general elections just around the corner, there remains a distinct possibility that heavy government borrowings will continue.Consequently, we anticipate interest rates to remain in double digits while growing political noise ahead of elections and lack of solutions to the current energy crisis is expected to keep GDP growth subdued.
SECTOR OVERVIEWBanking deposits depicted growth of 14% during FY12, which were primarily channeled into low risk government securities (+24% YoY). Compared to deposits, advances only increased by 7% YoY during FY12, resulting in the ADR declining to 52% from 56% while the IDR further increased to 50% from 45% last year. The outgoing year also saw a 200bps cut in the discount rate to 12% which shrank spreads by 72bps to 7.1% in June 2012. Furthermore, SBP increased theminimum deposit rate by 1% to 6% effective from May-12 to encourage savings in the economy, which is expected to further squeeze spreads going forward. NPLs increased by 6% during 9MFY12 to PKR577bn as at March 2012 and provisioning coverage increased to 69% as compared to 67% in March 2011. Overall, the sector performed quite well with large banks reporting ROEs of over 20%.
Uncertainty regarding global economic health kept international oil prices volatile during last fiscal year. Benchmark Arab Light crude averaged US$112 per barrel in FY12, up 20% from last year, which had a positive bearing on the profitability of domestic E&P companies. However oil ended FY12 on a sour note (USD98.5/barrel) as the European debt crisis and global economic slowdown weakened sentiments. Overall, gas production rose by decent 5% while oil production increased by 2% during the year. However, all was not well for the sector with the circular debt continuing to adversely affect corporate liquidity and dividend payout capacity. On thedownstream side, circular debt continued to strangulate the sector (particularly PSO) that restricted sales (particularly Furnace oil), down approx. 2% as compared to last year. On the positive front, sector’s motor gasoline sales benefited from gas curtailment (up 16%), while govt. also raised OMCs margins on the regulated products.
FY12 remained a challenging year for smaller size IPPs as non-payment of dues from thegovernment resulted in default on sovereign guarantees in May-12, which forced these IPPs to knock the door of the Supreme Court. Although the government paid a hefty subsidy of PKR 464bn to the power sector in FY12, power tariff hike of 16% in May-12 amid resumption of Fuel Surcharge Adjustments (suspended from Aug-11 to Mar-12) is expected to ease the pile up of circular debt in FY13.
5
5.0%6.0%7.0%
8.0%9.0%
10.0%11.0%
12.0%13.0%
9.0%
10.0%
11.0%
12.0%
13.0%
14.0%
15.0%
29-Jun-12 30-Jun-11
Jul-1
1
Aug
-11
Sep-
11
Oct
-11
Nov
-11
Dec
-11
Jan-
12
Feb-
12
Mar
-12
Apr
-12
May
-12
Jun-
12
1 W
eek
1 M
onth
3 M
onth
6 M
onth
1 Ye
ar
3 Ye
ar
5 Ye
ar
7 Ye
ar
9 Ye
ar
15 Y
ear
30 Y
ear
YoY In a on Yield Curve
CPI NFNE

Cement industry was in the limelight during FY12 as price consensus amongst manufacturers and decline in international coal prices significantly enhanced profitability. Domestic cement prices increased 19% YoY while export prices to Afghanistan witnessed considerable mprovement (20%-30%) in 2HFY12. Domestic dispatches registered a significant recovery in FY12, reaching a record high level of 24mn tons (up 9% YoY). Overall export dispatches fell to 8.5mn tons (down 9.1% YoY) in FY12, due to weak demand and surplus capacity in the GCC region. Exports to Afghanistan, constituting 55% of total exports, remained flat in FY12 with higher prices and severe winter affecting sales in 2HFY12.
FY12 was a year of two halves for the fertilizer sector. Gas load shedding on the SNGPL plants was much higher (in excess of 50%) whereas MARI based plants witnessed a 12% curtailment. Consequently, plants connected to the Mari network (FFC, Fatima and Old Engro Plant) witnessed robust profitability during 1HFY12 as Engro passed along higher prices to mitigate the impact of gas unavailability on its new plant, Enven. Towards the end of 1HFY12, GoP imposed GIDC on fertilizer players, which resulted in another price hike. In an effort to bring downfertilizer prices, GoP started to dump imported urea at subsidized rates, which restricted the off-take of local urea. Stuck with huge pile of inventory, manufacturers reduced urea prices in May-12 to kick start sales, an unprecedented event in recent history of the sector.
Textile exports of the country decreased by 10.4% YoY to USD12.4bn compared to an impressive USD13.8bn realized during last year. The sluggish trend in exports is attributable to lower cotton prices, weak demand from Euro region, worsening energy crisis and cut throat competition from regional countries. Cotton prices in FY12 declined by 35% compared to the average price last year. Cotton output during crop season 2011-12 stood at record level of 15.4mn bales as high prices last year induced growers to prefer cotton sowing over other crops.
MUTUAL FUND INDUSTRY REVIEW Total assets under management (AUMs) of Pakistan’s mutual funds industry grew by 52% in FY12, taking the overall industry size to Rs.381.3 billion as at June 30, 2012 compared to Rs.250.5 billion at the end of June 2011 (an increase of Rs.131 billion in absolute term). Equity funds’ AUMs increased by 0.13% during FY12 to close at Rs.52.1 bn. Equity funds witnessed lackluster growth (adjusting for increase from market appreciation) during the period under review despite stellar performance by the index. The trend is reflective of investors’ aversion to risky asset classes amidst deteriorating macro and political conditions. FUND PERFORMANCE During the year under review, ABL Stock Fund’s AUM decreased by 60.2% to Rs. 255.75 million. The fund delivered absolute return of 26.34% during the year ended June 30, 2011, which positioned it in the top quartile within the equity funds category. ABL Stock Fund earned total income of Rs.74.13 million for the year ended June 30, 2012 out of which Rs.37.25 million was net capital gain on sale of investments, Rs.27.40 million was dividend income and Rs.3.53 million was unrealized appreciation on re-measurement of financial assets at fair value through profit or loss – ‘held for trading’. After accounting for expenses of Rs.21.56 million (comprising mainly of the management fee of Rs.11.81 million) net income from operating activities for the year endedJune 30, 2012 stood at Rs.52.58 million. With the net element of income and capital gains of Rs.2.83 million included in the prices of units issued less those in units redeemed and Rs.1.11 million as provision for workers welfare fund, the net income for the year ended June 30, 2012 stood at Rs.54.30 million.
During FY12, ABL-SF significantly outperformed its benchmark KSE-30 index, once againranking among the best performing funds in the sector. Since its inception in June 2009, ABL-SF has been the best performing fund in the equity markets of Pakistan. The fund continues to enjoy MFR 5-star ranking from JCR-VIS across all tenors. A fundamental-based management style with focus on value investments have been the key reason for our superior performance over past few years and we strive to maintain our standards as we move ahead.
6

DIVIDENDThe Board of Directors of ABL Asset Management Company Limited (ABL AMCL), on June 25, 2012 approved the final distribution of Rs.2.4077 per unit (24.08% of the par value of Rs.10) for the year ended June 30, 2012.
In the better interest of unit holders, especially Corporate(s) and Financial Institutions (FIs), ABL AMCL on behalf of ABL-SF distributed all dividends before quarter closing so that dividend income could be booked by the Corporate(s) and FIs during their respective quarters.
Since the above distribution is more than 90% of the income for the year ended June 30, 2012, the income of ABL-SF will not be subject to tax under the Clause 99 of the Part I of the SecondSchedule of the Income Tax Ordinance, 2001.
CORPORATE GOVERNANCE The Board of Directors states that:
1. Financial Statements present fairly the statement of affairs, the results of operations, cash flows and the changes in unit holder’s fund;
2. Proper books of accounts have been maintained by the Fund.
3. Appropriate accounting policies have been consistently applied in the preparation of the financial statements and accounting estimates are based on reasonable and prudent judgments;
4. Relevant International Accounting Standards, as applicable in Pakistan, provision of the Non Banking Finance Companies (Establishment and Regulation) Rules, 2003, Non Baning Finance Companies and Notified Entities Regulations, 2008, requirements of the Trust Deed and directives issued by the Securities and Exchange Commission of Pakistan have been followed in the preparation of the financial statements;
5. The system of internal control is sound in design and has been effectively implemented and monitored;
7

6. There have been no significant doubts upon the Funds’ ability to continue as going concern;
7. There has been no material departure from the best practices of corporate governance, as detailed in the listed regulations;
8. Performance table of the Fund is given on page # 13 of the Annual Report;
9. There is no any statutory payment on account of taxes, duties, levies and charges outstanding; 10. The statement as to the value of investments of Staff Provident Fund is not applicable in the case of the Fund as such expenses are borne by the Management Company;
11. There have been no trades in the units of the Fund’s carried out by the Directors, CEO, CFO and the Company Secretary and their spouse excepts as disclosed below and in notes to the financial statements;
12. Meeting of the Board of Directors of the Management Company are held at least once in every quarter. During the period under review five meetings were held. Attendance of directors in these meetings are given below and in notes to the financial statements;
*Retired in the 4th Annual General Meeting (AGM) of ABL AMCL held on March 19, 2012
**Appointed as new Directors of the ABL AMCL in the 4th Annual General Meeting (AGM) held on March 19, 2012
8
S. No Name of Directors
Number of
meetings held
Attended Leave
granted Meetings not
attended
1 Sheikh Mukhtar Ahmed 05 01 04 22nd, 23rd, 24th
and 26th
2 Mr. Muhammad Waseem Mukhtar
05 05 - -
3 Mr. Khalid A. Sherwani 05 05 - -
4 Mr. Kamran Nishat 05 05 - -
5 Mr. M. Shakeb Murad 05 01 04 22nd, 23rd, 24th
and 25th
6 Mr. M. Jawaid Iqbal 05 05 - -
7 Mr. Muhammad Yaseen* 04 03 01 25th
8 - - 10 10 **zajI aiZ .rM

13. The details as required by the Code of Corporate Governance regarding the pattern of holding in ABL Stock Fund, is given hereunder:
AUDITORSM/s. A.F. Fergusons & Co. (Chartered Accountants), on the recommendation of the AuditCommittee of the Board of Directors being eligible for re-appointment have been appointed as auditors for the year ending June 30, 2013 for ABL Stock Fund (ABL-SF).
FUND STABILITY RATINGJCR-VIS Credit Rating Company Ltd. (JCR-VIS) on September 29, 2011: has assigned MFR 5-Star to ABL-SF (based on two years average), which denotes ‘very good performance’.
MANAGEMENT QUALITY RATINGOn September 16, 2011: JCR-VIS Credit Rating Company Limited has upgraded the Management Quality Rating of ABL Asset Management Limited (ABL AMC) from ‘AM3+’ (AM Three Plus) to ‘AM Two Minus’ (AM2-). Outlook on the assigned rating is ‘Stable’
OUTLOOK & STATEGYLooking ahead, we expect activity in the market to pick up as investors gear up for June end results season. Companies with good payout histories and triple-digit growth numbers are likely to stay in limelight and we have adjusted our exposure accordingly. A broad based rally appears to be on cards as resumption of NATO supplies and resulting likelihood of funds disbursements from US bodes well for macro situation.
The market trades at an attractive 2012E P/E of 6.7x and offers dividend yield of 7.1%. Results for equity investors since 2008 crash have been very impressive on YoY basis owing to attractive valuations. Given strong earnings growth and high dividend yield structure of Pakistani equities, we believe equity investors should expect decent returns for FY12-13.
ACKNOWLEDGEMENTWe thank our valued investors who have placed their confidence in us. The Board is also thankful to Securities & Exchange Commission of Pakistan, the Trustee (Central Depository Company of Pakistan Limited) and the management of Karachi Stock Exchange (Guarantee) Limited for their continued guidance and support. The Directors also appreciate the efforts put in by themanagement team.
9
For and on behalf of the Board
FARID AHMED KHANKarachi, August 10, 2012 Chief Executive Officer
S. No. Particulars Units Held on June 30, 2012
1 seitrap detaler dna sgnikatrednu ,seinapmoC detaicossA
• ABL Asset Management Company Limited 3,135,682 • Allied Bank Limited 10,000,000 2 Mutual Funds Nil 3 Directors and their spouse(s) and minor children Nil 4 Executives 66,650.96 5 Public Sector Companies and corporations Nil 6 Bank, DFIs, NBFCs, Insurance Companies, Takaful,
Modaraba and Pension Fund 3,661,392
7 Shareholders holding five percent or more voting rights in the listed company
Not Applicable

OBJECTIVETo provide higher risk-adjusted returns over the long term by investing in a diversified portfolio of equity instruments offering capital gains and dividends.
MARKET OVERVIEWThe KSE-100 closed FY12 with a gain of 10.45% as against 10-year average gains of 28.27% despiteattractive valuations and strong corporate earnings growth during the year. Relaxation offered in Capital Gain Tax rules and higher participation from\individuals resulted in average daily volumes recovering to 130 million shares compared to last year’s 95 million shares, while the aver-age daily turnover improved from 9-year low of Rs.3.8 billion to Rs.4.0 bn. Bull run in global equity markets towards beginning of 2HFY12 brought in fresh foreign flows, resulting in net foreign buying of US$58 million (excluding strategic sale out of Hubco) in FY12.
The much awaited relaxation in matters relating to CGT paved way for enhanced investor participation in the market. As a result, an extended rally was witnessed with the benchmark KSE-100 index soaring over the 14,000 mark (hitting a high of 14,617.97 points) during the year.
Apart from relaxation in CGT, robust corporate earnings growth witnessed in index heavy sectors like oil & gas, banking and cement, kept investors’ interest alive. Politics remained in the news throughout the year but only seldom affected market sentiments as investors had built an element of politicaluncertainty in their base case. On the economic front, high oil prices and falling cotton prices continued to exert pressure on current account. Nevertheless, short-term improvement in inflation figures provided SBP the comfort to cut discount rate from 14% to 12% during 1HFY12. Fiscal account slippages however continued to remain a concern for investors and state institutions alike with key government initiatives such as 3G license auction, floatation of OGDC euro bonds and reduction in power sector subsidies failing to take off the ground.
FUND PERFORMANCEABL-SF returned 26.34% to its investors during FY12, outperforming its benchmark KSE-30 index by 2,345 basis points. ABL-SF continued its rich performance history by remaining in the top quartile during FY12 as well. Since its inception on June 28th, 2009 ABL-SF has been the best performing fund in the equity markets of Pakistan. The fund continues to enjoy MFR 5-star ranking from JCR-VIS based on Two Year Weighted Average Ranking of Equity Funds. This strong performance can be attributed to better stock selection and timely trading tactics.
ABL-SF, as at June 30, 2012, was nearly 90.1% invested in equities and the rest in cash and cashequivalents. Equity investments were mainly concentrated in Oil & Gas, Chemicals and Banking sectors with exposures of 22.2%, 18.6%, and 24.3% respectively. We find risk-reward structure
10
FUND MANAGER’S REPORT

in these sectors to be an ideal match for enterprising investors who seek protection against a stagnant economic environment while pursuing higher dividend yields, superior business dynamics and strong growth prospects.
ABL-SF also announced a full year dividend @ Rs.2.4077/unit for the period ended June 30, 2012. Fiscal Year 2012, overall, was a rewarding year for ABL Stock Fund investors and we will strive to better our performance in times to come.
FUTURE OUTLOOK AND STRATEGY Looking ahead, we expect activity in the market to pick up as investors gear up for June end results season. Companies with good payout histories and triple-digit growth numbers are likely to stay in limelight and we have adjusted our exposure accordingly. A broad based rally appears to be on cards as resumption of NATO supplies and resulting likelihood of funds disbursements from US bodes well for macro situation.
Foreign investment flows (excluding strategic sale outs) have once again turned positive and we expect large flows to come in as foreign fund managers set on value hunting in frontier markets. We are cautiously optimistic on mid to long term performance of KSE, which is still trading at asignificant discount to regional markets as well as to its own historic multiples. The market trades at an attractive 2012E P/E of 6.7x and offers dividend yield of 7.1%. Results for equity investors since 2008 crash have been very impressive on YoY basis owing to attractive valuations. Given strong earnings growth and high dividend yield structure of Pakistani equities, we believe equity investors should expect decent returns for FY12-13.
11
-20.00%-10.00%
0.00%10.00%20.00%30.00%40.00%
1-Ju
l-11
1-A
ug-1
1
1-Se
p-11
1-O
ct-1
1
1-N
ov-1
1
1-D
ec-1
1
1-Ja
n-12
1-Fe
b-12
1-M
ar-1
2
1-A
pr-1
2
1-M
ay-1
2
1-Ju
n-12
FY 12 : ABL-SF vs KSE-30KSE-30

12
-
50
100
150
200
250
0200400600800
A
00000
1-Ju
l-11
1-A
ug-1
1
Automobile &1.8%
Electricit9.1%
Contruc o
13.0%
IndustriM
Volum
1-Se
p-11
1-O
ct-1
1
Parts
ty
on &
iMining1.1%
Sector A
me (LHS)
1-N
ov-1
1
1-D
ec-1
1
Volume (LH
Oil & G22.2%
Bank BalanOthe9.9%
Alloca on ( %
Index (
1-Ja
n-12
1-Fe
b-12
HS) In
B2
as
nce and rs
%
% of Total A
(RHS)
1-M
ar-1
2
1-A
pr-1
2
ndex (RHS)
Banks24.3%
Che18
Assets)
800
900
100
110
120
130
140
1-M
ay-1
2
1-Ju
n-12
micals8.6%
00
00
000
000
000
000
000
80009000100001100012000130001400015000
al Metals and
1-Ju
l-11
1-A
ug-1
1
1-Se
p-11
1-O
ct-1
1
1-N
ov-1
1
1-D
ec-1
1
1-Ja
n-12
1-Fe
b-12
1-M
ar-1
2
1-A
pr-1
2
1-M
ay-1
2
1-Ju
n-12
Materials

13
ABL STOCK FUNDPERFORMANCE TABLE
June 2012 June 2011 June 2010
Net Assets 255,749 642,032 376,158
Net Income 54,303 139,931 112,455
Net Assets value 10.2491 10.0408 10.0134
Final distribution 2.4077 2.9280 3.2813
Distribution date final June 25,2012 June 29,2011 June 28,2010
Closing offer price 10.5566 10.3420 10.3138
Closing repurchase price 10.2491 10.0408 10.0134
Highest offer price 13.8094 13.6462 15.3833
Lowest offer price 9.6120 10.2011 10.3082
Highest repurchase price per unit 13.4072 13.2487 14.9352
Lowest repurchase price per unit 9.3320 9.9040 10.0080
Total return of the fund- capital growth 2.27% -0.12% 0.134%
- income distribution 24.08% 29.28% 32.8130%Average Annual return of the fund
One Year 26.34% 29.16% 32.72%
Two Year 63.19% 71.06% -
Three Year 116.49% - -
Since Inception 116.02% - -
Weighted average Portfolio duration in days 30 30 30
Disclaimer
(Rupees in '000)
Percentage
(Rupees per unit)
Past performance is not necessarily indicative of future performance and unit prices and investmentreturns may go down, as well as up.
14

15

16
STATEMENT OF COMPLIANCEBY ABL STOCK FUND WITH THE CODE OFCORPORATE GOVERNANCEFOR THE YEAR ENDED JUNE 30, 2012
This statement is being presented to comply with the Code of Corporate Governance (“the Code”) contained in Regulation No.35 of the Listing Regulations of the Karachi Stock Exchange (Guarantee) Limited for the purpose of establishing a framework of good governance, whereby a listed company is managed in compliance with the best practices of Corporate Governance. The board of directors (“the Board”) of ABL Asset Management Company Limited (“the Management Company”), an un-listed public company, manages the affairs of ABL Stock Fund (“the Fund”). The Fund being a unit trust open ended scheme does not have its own board of directors. The Management Company has applied the principles contained in the Code to the Fund, whose units are listed as a security on the Exchange, in the following manner:
1. The Management Company encourages representation of independent non-executive directors. At present, the Board includes seven non-executive directors of whom two are independent directors.
2. The directors have confirmed that none of them is serving as a director in more than seven listed companies, including this company.
3. All the resident directors of the company are registered as taxpayers and none of them has defaulted in payment of any loan to a banking company, a DFI or an NBFI or, being a member of a stock exchange, has been declared as a defaulter by that stock exchange.
4. During the year under review no casual vacancies occurred on the Board, however, the new Board was elected on March 19, 2012 in the 04th Annual General Meeting of the Company after completion of term of the previous Board.
5. The management company has prepared a “Code of Conduct” and has ensured that appropriate steps have been taken to disseminate it throughout the company along with its supporting policies and procedures.
6. The Board has developed a vision/mission statement, an overall corporate strategy and significant policies for the Fund. A complete record of particulars of significant policies along with the dates on which these were approved or amended has been maintained.
7. All the powers of the Board have been duly exercised and decisions on material transactions, including appointment and determination of remuneration and terms and conditions of employment of the CEO and non-executive (independent) directos have been taken by the Board. There is no executive director of the Management Company other than the CEO who was appointed during the year ended June 30, 2012.
8. The meetings of the Board were presided over by the Chairman and, in his absence, by a director elected by the Board for this purpose and the Board met at least once in every quarter. Written notices of the Board meetings, along with agenda and working papers, were circulated at least seven days before such meetings. The minutes of the meetings were appropriately recorded andcirculated.

17
9. One director has attended training programs up to the year ended June 30, 2011. However, the Management Company is arranging training programs for its directors in future also.
10. The Board has approved the appointment of Chief Financial Officer (CFO), Company Secretary and Head of Internal Audit, including their remuneration and terms and conditions of employment.
11. The Directors’ Report of the Fund for the year ended June 30, 2012 has been prepared in compliance with the requirements of the Code and fully describes the salient matters required to be disclosed.
12. The financial statements of the Fund were duly endorsed by the CEO and CFO of the Management Company before approval of the Board.
13. The directors, CEO and executives do not hold any interest in the units of the Fund other than those disclosed in the Directors Report.
14. The Management Company has complied with all the applicable corporate and financial reporting requirements of the Code.
15. The Board has formed an Audit Committee. It comprises of three members, all of whom are non-executive directors of the Management Company, including the Chairman of the Committee who is an independent director.
16. The meetings of the Audit Committee were held once in every quarter and prior to the approval of interim and final results of the Fund as required by the Code. The terms of reference of the Audit Committee have been approved in the meeting of the Board and the Committee has been advised to ensure compliance with those terms of reference.
17. The board has formed an HR and Remuneration Committee. It comprises three members, of whom two are non-executive directors including the chairman of the Committee.
18. There exists an effective internal audit function within the Management Company.
19. The statutory auditors of the Fund have confirmed that they have been give a satisfactory rating under the quality control review program of the Institute of Chartered Accountants of Pakistan (ICAP), that they or any of the partner of the firm, their spouse and minor children do not hold units of the Fund and that the firm and all its partners are in compliance with the Inter national Federation of Accountants (IFAC) guidelines on code of ethics as adopted by ICAP.
20. The statutory auditors or the persons associated with them have not been appointed to provide other services except in accordance with the listing regulations and the auditors have confirmed that they have observed IFAC guidelines in this regard.

18
21. The ‘closed period’, prior to the announcement of interim/final results, and business decisions, which may materially affect the market price of Fund’s units, was determined and intimated to directors, employees and stock exchange(s).
22. Material/price sensitive information has been disseminated among all market participants at once through stock exchange(s).
23. We confirm that all other material principles contained in the Code have been complied with.
For and on behalf of the Board
FARID AHMED KHANKarachi, August 10, 2012 Chief Executive Officer

19

20
ABL STOCK FUNDSTATEMENT OF ASSETS AND LIABILITIES
AS AT JUNE 30, 2012
Note June 30, 2012
June 30, 2011
---------------- Rupees --------------- ASSETS
Balances with banks 4 20,845,250 172,492,798 Investments 5 238,031,019 527,623,600 Dividend and profit receivable 6 451,726 1,951,916 Security deposits 7 2,600,000 2,600,000 Receivable against sale of investments 756,518 2,559,137 Receivable against sale of units - 412,996 Preliminary expenses and floatation costs 8 1,431,656 2,150,114 Total assets 264,116,169 709,790,561
LIABILITIES
Payable to ABL Asset Management Company Limited - Management Company 9 2,887,511 4,483,198 Payable to Central Depository Company of Pakistan Limited - Trustee 10 58,070 105,395 Payable to Securities and Exchange Commission of Pakistan 11 373,976 431,867 Dividend payable - 58,564,623 Accrued expenses and other liabilities 12 5,047,425 4,173,083 Total liabilities 8,366,982 67,758,166
NET ASSETS 255,749,187 642,032,395
UNIT HOLDERS' FUND (AS PER STATEMENT ATTACHED) 255,749,187 642,032,395
CONTINGENCIES AND COMMITMENTS 13
NUMBER OF UNITS IN ISSUE 14 24,953,264 63,942,237
NET ASSETS VALUE PER UNIT 10.2491 10.0408
FACE VALUE PER UNIT 10.0000 10.0000
The annexed notes 1 to 30 form an integral part of these financial statements.
---------- Number of units ----------
----------------- Rupees ---------------
For ABL Asset Management Company Limited(Management Company)
FARID AHMED KHANCEO
KAMRAN NISHATDIRECTOR

21
ABL STOCK FUNDINCOME STATEMENT
---------------- Rupees --------------- INCOME
Dividend income 27,403,813 28,148,673 Capital gain on sale of investments - net 37,248,220 89,668,488 Income from government securities 2,452,986 4,326,307 Profit on bank deposits 3,498,604 3,106,580
70,603,623 125,250,048 Unrealised appreciation on re-measurement of investments classified as financial assets at fair value through profit or loss - 'held for trading' - net 5.3 3,530,730 8,983,826 Total income 74,134,353 134,233,874
EXPENSES
Remuneration of ABL Asset Management Company Limited - Management Company 11,809,870 13,637,772 Sindh sales tax on remuneration of Management Company 1,889,579 - Remuneration of Central Depository Company of Pakistan - Trustee 872,388 909,181 Annual fee - Securities and Exchange Commission of Pakistan 373,976 431,867 Brokerage expense and other transaction costs 4,817,498 3,357,190 Auditors' remuneration 15 405,000 375,000 Amortisation of preliminary expenses and floatation costs 718,458 716,495 Printing charges 81,344 200,000 Annual rating fee 110,000 90,000 Listing fee 30,000 30,000 Legal and professional charges 34,871 - Settlement and bank charges 334,316 326,848 Other expenses 79,777 27,598 Total operating expenses 21,557,077 20,101,951
Net income from operating activities 52,577,276 114,131,923
Element of income and capital gains included in prices of units issued less those in units redeemed 2,834,093 28,657,335
Provision for Workers' Welfare Fund 16 (1,108,227) (2,858,364)
Net income before taxation 54,303,142 139,930,894
Taxation 17 - -
Net income after taxation 54,303,142 139,930,894
Other comprehensive income - -
Total comprehensive income 54,303,142 139,930,894
Earnings per unit 18
The annexed notes 1 to 30 form an integral part of these financial statements.
June 30, 2012 June 30, 2011Note
For ABL Asset Management Company Limited(Management Company)
FARID AHMED KHANCEO
KAMRAN NISHATDIRECTOR

22
ABL STOCK FUNDDISTRIBUTION STATEMENT
FOR THE YEAR ENDED JUNE 30, 2012
Undistributed income brought forward - Realised (loss) / income (6,372,928) 6,040,511 - Unrealised income / (loss) 8,983,826 (5,534,477)
2,610,898 506,034
Net income for the year 54,303,142 139,930,894
Element of income / (loss) and capital gains / (losses) included in pricesof units issued less those in units redeemed (1,590,750) 127,972
Final distribution- Rs 2.4077 per unit on June 25, 2012 (2011: Rs 2.928 per unit on June 29, 2011)
- Cash distribution (24,080,801) (58,564,623) - Issue of bonus units (25,025,071) (79,389,379)
Undistributed income carried forward 6,217,418 2,610,898
Undistributed income comprising:Realised income / (loss) 2,686,688 (6,372,928) Unrealised income 3,530,730 8,983,826
6,217,418 2,610,898
The annexed notes 1 to 30 form an integral part of these financial statements.
---------------- Rupees ---------------
June 30, 2012 June 30, 2011
For ABL Asset Management Company Limited(Management Company)
FARID AHMED KHANCEO
KAMRAN NISHATDIRECTOR

23
ABL STOCK FUNDSTATEMENT OF MOVEMENT IN UNIT HOLDERS' FUND
FOR THE YEAR ENDED JUNE 30, 2012June 30, 2012 June 30, 2011
Net assets at the beginning of the year 642,032,395 376,158,199
Issue of 14,593,772 units (2011: 37,475,969 units) 163,425,275 439,411,995 Redemption of 56,053,942 units (2011: 18,917,492 units) (577,096,731) (226,246,735)
(413,671,456) 213,165,260
Issue of 2,471,197 bonus units (2011: 7,818,455 units) 25,025,071 79,389,379
Element of (income) / loss and capital (gains) / losses included in prices of units issued less those in units redeemed
- amount representing income and capital gains - transferred to Income Statement (2,834,093) (28,657,335)
- amount representing (income) / loss and capital (gains) / losses - transferred to Distribution Statement 1,590,750 (127,972)
(1,243,343) (28,785,307)
Other net income for the year 13,524,192 41,278,580
Net capital gain on sale of investments 37,248,220 89,668,488
Unrealised appreciation on re-measurement of investments classified as financial assets at fair value through profit or loss - 'held for trading' - net 3,530,730 8,983,826 Total income for the year 54,303,142 139,930,894
Final distribution- Rs 2.4077 per unit on June 25, 2012 (2011: Rs 2.928 per unit on June 29, 2011)
- Cash distribution (24,080,801) (58,564,623) - Issue of bonus units (25,025,071) (79,389,379)
5,197,270 1,976,892
Element of income / (loss) and capital gains / (losses) included in prices of units issued less those in units redeemed - transferred to Distribution Statement (1,590,750) 127,972
Net assets at the end of the year 255,749,187 642,032,395
The annexed notes 1 to 30 form an integral part of these financial statements.
----------------- Rupees -----------------
For ABL Asset Management Company Limited(Management Company)
FARID AHMED KHANCEO
KAMRAN NISHATDIRECTOR

24
ABL STOCK FUNDCASH FLOW STATEMENT
FOR THE YEAR ENDED JUNE 30, 2012
CASH FLOWS FROM OPERATING ACTIVITIES
Net income for the year 54,303,142 139,930,894
Adjustments:
Unrealised appreciation on re-measurement of investments classified as financial assets at fair value through profit or loss- 'held for trading' - net (3,530,730) (8,983,826)
Dividend income (27,403,813) (28,148,673) Element of income and capital gains included in prices of units issued less those in units redeemed (2,834,093) (28,657,335) Amortisation of preliminary expenses and floatation costs 718,458 716,495
21,252,964 74,857,555 (Increase) / decrease in assets
Investments - net 293,123,311 (122,908,259) Profit receivable 118,872 (292,784) Receivable against sale of investments 1,802,619 49,401,159 Receivable against sale of units 412,996 (412,996)
295,457,798 (74,212,880) Increase / (decrease) in liabilities
Payable to ABL Asset Management Company Limited - Management Company (1,595,687) (113,065) Payable to Central Depository Company of Pakistan Limited - Trustee (47,325) 38,299 Payable to Securities and Exchange Commission of Pakistan (57,891) 71,346 Accrued expenses and other liabilities 874,342 3,240,103
(826,561) 3,236,683
Dividend received 28,785,131 26,972,337
Net cash generated from operating activities 344,669,332 30,853,695
CASH FLOWS FROM FINANCING ACTIVITIES
Receipts from issue of units 163,425,275 439,411,995 Payments on redemption of units (577,096,731) (226,246,735) Dividend paid (82,645,424) (78,463,823) Net cash (used in) / generated from financing activities (496,316,880) 134,701,437 Net (decrease) / increase in cash and cash equivalents during the year (151,647,548) 165,555,132
Cash and cash equivalents at the beginning of the year 172,492,798 6,937,666
Cash and cash equivalents at the end of the year 4 20,845,250 172,492,798
The annexed notes 1 to 30 form an integral part of these financial statements.
----------------- Rupees ----------------
NoteFor the year
ended June 30, 2012
For the year ended June 30,
2011
For ABL Asset Management Company Limited(Management Company)
FARID AHMED KHANCEO
KAMRAN NISHATDIRECTOR
25
ABL STOCK FUNDNOTES TO AND FORMING PARTOF THE FINANCIAL STATEMENTS
1 LEGAL STATUS AND NATURE OF BUSINESS ABL Stock Fund (the Fund) was established under a trust deed executed between ABL Asset Management Company Limited as the Management Company and Central Depository Company of Pakistan Limited (CDC) as the Trustee. The Securities and Exchange Commission of Pakistan (SECP) authorised constitution of the Trust Deed on April 10, 2009 and it was executed on April 23, 2009. The Fund has been classified as an equity scheme by the Management Company. The Fund is an open ended fund and is listed on the Karachi Stock Exchange (Guarantee) Limited. Units of the Fund are offered for public subscription on a continuous basis. The units are transferable and redeemable by surrendering them to the Fund. The Management Company of the Fund has been classified as a Non-Banking Finance Company (NBFC) under the NBFC Rules, 2003 and has obtained the requisite license from the Securities and Exchange Commis sion of Pakistan (SECP) to undertake Asset Management Services. The registered office of the Management Company is situated at 11 - B, Lalazar, M.T. Khan Road, Karachi. The JCR-VIS Credit Rating Company Limited has assigned Management Quality Rating of 'AM2- (stable outlook)' to the Management Company and Fund Performance Rating of 'MFR 5-Star' to the Fund. The objective of the Fund is to provide higher risk adjusted returns to investors by investing in diversified portfolio of equity instruments offering capital gains and dividends. The investment objectives and policies are more fully explained in the Fund's Offering documents. 2 BASIS OF PREPARATION 2.1 Statement of compliance These financial statements have been prepared in accordance with the approved accounting standards as applicable in Pakistan. Approved accounting standards comprise of such International Financial Reporting Standards (IFRS) issued by the International Accounting Standards Board as are notified under the Companies Ordinance, 1984, the requirements of the Trust Deed, the Non-Banking Finance Companies (Establishment and Regulations) Rules, 2003 (the NBFC Rules), the Non-Banking Finance and Notified Entities Regulations, 2008 (the NBFC Regulations) and the directives issued by the Securities and Exchange Commission of Pakistan (SECP). Wherever the requirements of the Trust Deed, the NBFC Rules, the NBFC Regulations or the directives issued by the SECP differ with the requirements of IFRS, the requirements of the Trust Deed, the NBFC Rules, the NBFC Regulations or the directives issued by the SECP prevail. 2.2 Standards, interpretations and amendments to published approved accounting standards that are effective in the current year The following standards, amendments and interpretation to approved accounting standards have been published and are mandatory for the Fund's accounting period beginning on or after July 1, 2011: a) IFRS 7, 'Financial Instruments: Disclosures' (effective January 1, 2011). The amendment emphasizes the interaction between quantitative and qualitative disclosures about the nature and extent of risks associated with financial instruments. The amendment does not have any significant impact on the Fund's financial statements.
FOR THE YEAR ENDED JUNE 30, 2012

26
b) IFRS 7, 'Financial instruments: Disclosures' (effective July 1, 2011). This amendment aims to promote transparency in the reporting of transfer transactions and improve users' understanding of the risk exposures relating to transfers of financial assets and the effect of those risks on an entity's financial position, particularly those involving securitisation of financial assets. The amendment does not have any impact on the Fund's financial statements during the current year. c) IAS 1, 'Presentation of financial statements' (effective January 1, 2011). The amendment clarifies that an entity will present an analysis of other comprehensive income for each component of equity, either in the statement of changes in equity or in the notes to the financial statements. The amendment does not have any impact on the Fund's financial statements as currently no items are being reported in other comprehensive income. d) IAS 24 (revised), 'Related party disclosures', issued in November 2009. It superseded IAS 24, 'Related Party Disclosures', issued in 2003. IAS 24 (revised) is mandatory for periods beginning on or after January 1, 2011. The revised standard clarifies and simplifies the definition of a related party and removes the requirement for government-related entities to disclose details of all transactions with the government and other government-related entities. The revised standard does not have any impact on the Fund's financial statements. e) IAS 34, 'Interim financial reporting' (effective January 1, 2011). The amendment provides guidance to illustrate how to apply disclosure principles in IAS 34 and adds disclosure requirements around: - The circumstances likely to affect fair values of financial instruments and their classification; - Transfers of financial instruments between different levels of the fair value hierarchy; - Changes in classification of financial assets; and - Changes in contingent liabilities and assets. There are other new and amended standards and interpretations that are mandatory for accounting periods beginning on or after July 1, 2011 but are considered not to be relevant or do not have any significant effect on the Fund's operations and are therefore not detailed in these financial statements. 2.3 Standards, interpretations and amendments to published approved accounting standards that are not yet effective: The following standards and amendments to standards have been published and are mandatory for accounting periods beginning on or after July 1, 2012: a) IAS 1, 'Financial statement presentation' (effective July 1, 2012). The main change resulting from these amendments is a requirement for entities to group items presented in 'other comprehensive income' (OCI) on the basis of whether they are potentially reclassifiable to profit or loss subsequently (reclassification adjustments). The amendments do not address which items are presented in OCI. The amendment will not have any effect on the Fund's financial statement as presently no items are reported in other comprehensive income. b) IAS 32, 'Financial instruments: Presentation', (effective January 1, 2014. This amendment clarifies some of the requirements for offsetting financial assets and financial liabilities on the balance sheet. The management of the Fund is in the process of assessing the impact of this amendment on the Fund's financial statements. There are other new and amended standards and interpretations that are mandatory for accounting periods beginning on or after July 1, 2012 but are considered not to be relevant or do not have any significant effect on the Fund's operations and are therefore not detailed in these financial statements.

27
2.4 Critical accounting estimates and judgments The preparation of financial statements in conformity with the approved accounting standards requires the management to make estimates, judgments and assumptions that affect the reported amounts of assets and liabilities, income and expenses. It also requires the management to exercise the judgment in application of its accounting policies. The estimates, judgments and associated assumptions are based on the management's experience and various other factors that are believed to be reasonable under the circumstances. These estimates and assumptions are reviewed on an ongoing basis. Revisions to accounting estimates are recognised in the period in which the estimate is revised if the revision affects only that period, or in the period of revision and future periods if the revision affects both current and future periods. The areas involving a higher degree of judgment or complexity, or areas where estimates and assumptions are significant to the financial statements are as follows: i) Classification and valuation of investments (notes 3.2 and 5)
ii) Amortisation of preliminary expenses and floatation cost (notes 3.12 and 8) 2.5 Accounting convention These financial statements have been prepared under the historical cost convention except for certain investments which have been marked to market and carried at fair value in accordance with the requirements of International Accounting Standard (IAS) 39: 'Financial Instruments: Recognition and Measurement'. 2.6 Functional and presentation currency These financial statements have been prepared in Pak Rupees, which is the Fund's functional and presentation currency. 3 SUMMARY OF SIGNIFICANT ACCOUNTING POLICIES The principal accounting policies adopted in the preparation of these financial statements are set out below: 3.1 Cash and cash equivalents Cash and cash equivalents comprise balances with banks and short-term highly liquid investments with original maturities of three months or less. Cash and cash equivalents are carried in the statement of Assets and Liabilities at cost. 3.2 Financial assets 3.2.1 Classification The Fund classifies its financial assets in the following categories: financial assets 'at fair value through profit or loss', loans and receivables and available for sale. The classification depends on the purpose for which the financial assets were acquired. Management determines the classification of its financial assets at initial recognition and re-evaluates this classification on a regular basis. Investments are classified as follows: b) Financial assets 'at fair value through profit or loss' Financial assets that are acquired principally for the purpose of generating profit from short-term fluctuations in prices are classified as held for trading in the financial assets 'at fair value through profit or loss' category. b) Loans and receivables These are non-derivatives financial assets with fixed or determinable payments that are not quoted in an active market.

28
c) Available for sale Available for sale financial assets are those non-derivative financial assets that are designated as available for sale or are not classified as (a) loans and receivables, (b) held to maturity investments or (c) financial assets 'at fair value through profit or loss'. 3.2.2 Regular way contracts Regular purchases and sales of financial assets are recognised on the trade date - the date on which the Fund commits to purchase or sell the asset. 3.2.3 Initial recognition and measurement Financial assets are initially recognised at fair value plus transaction costs except for financial assets carried 'at fair value through profit or loss'. Financial assets carried 'at fair value through profit or loss' are initially recognised at fair value while the related transaction costs are expensed in the income statement. 3.2.4 Subsequent measurement a) Financial assets 'at fair value through profit or loss' and 'available for sale' Subsequent to initial recognition, financial assets designated by the management as 'at fair value through profit or loss' and 'available for sale' are valued as follows: - Basis of valuation of equity securities The investment of the Fund in equity securities is valued on the basis of closing quoted market prices available at the stock exchange. A security listed on the stock exchange for which no sale is reported on the reporting date is valued at its last sale price on the next preceding date on which such exchange is open and if no sale is reported for such date the security is valued at an amount neither higher than the closing asked price nor lower than the closing bid price. Net gains and losses arising on changes in the fair value of financial assets carried at fair value through profit or loss are taken to the income statement. Net gains and losses arising on changes in fair value of available for sale financial assets are taken to other comprehensive income until these are derecognised. At this time, the cumulative gain or loss, previously shown under other comprehensive income, is transferred to the income statement as capital gain / (loss). - Basis of valuation of government securities The investment of the Fund in Government Securities is valued on the basis of rates announced by the Financial Markets Association of Pakistan in accordance with the requirements of the NBFC Regulations. Net gains and losses arising from changes in the fair value of financial assets carried 'at fair value through profit or loss' are taken to the 'income statement'. Net gains and losses arising from changes in fair value of 'available for sale' financial assets are taken to other comprehensive income until these are derecognised or impaired. At this time, the cumulative gain or loss previously recognised directly in other comprehensive income is transferred to income before taxation. b) Loans and receivables Subsequent to initial recognition financial assets classified as 'loans and receivables' are carried at amortised cost using the effective interest method.

29
Gain or loss is also recognised in the 'income statement' when financial assets carried at amortised cost are derecognised or impaired. 3.2.5 Impairment The Fund assesses at each reporting date, whether there is objective evidence that a financial asset or a group of financial assets is impaired. An impairment loss is recognised whenever the carrying amount of an asset exceeds its recoverable amount. Financial assets classified as ‘available for sale’ Equity securities In the case of AFS equity securities, a significant or prolonged decline in the fair value of the security below its cost is considered in determining whether the securities are impaired. If evidence of impairment exists, the cumulative loss previously recognised in other comprehensive income is removed from other comprehensive income and recognised in income before taxation. Impairment losses recognised in the income statement on equity instruments are not reversed through the income statement. Financial assets classified as ‘loans and receivable’ For financial assets classified as 'loans and receivables', a provision for impairment is established when there is objective evidence that the Fund will not be able to collect all amounts due according to the original terms. Provision is made in accordance with the criteria specified in circular No. 1 dated January 6, 2009 and circular No. 13 dated May 4, 2009 issued by the SECP. 3.2.6 Derecognition Financial assets are derecognised when the rights to receive cash flows from the investments have expired or the Fund has transferred substantially all risks and rewards of ownership. 3.2.7 Offsetting of financial assets and liabilities Financial assets and financial liabilities are offset and the net amount is reported in the Statement of Assets and Liabilities when there is a legally enforceable right to set off the recognised amounts and there is an intention to settle on a net basis, or realise the assets and settle the liabilities simultaneously. 3.3 Financial liabilities All financial liabilities are recognised at the time when the Fund becomes a party to the contractual provisions of the instrument. They are initially recognised at fair value and subsequently stated at amortised cost. A financial liability is derecognised when the obligation under the liability is discharged, cancelled or expired. 3.4 Derivatives Derivative financial instruments are initially recognised at fair value and subsequent to initial measurement each derivative financial instrument is remeasured to its fair value and the resultant gain or loss is recognised in the income statement. 3.5 Provisions Provisions are recognised when the Fund has a present, legal or constructive, obligation as a result of past events, it is probable that an outflow of resources embodying economic benefits will be required to settle the

30
obligation and a reliable estimate of the amount of the obligation can be made. Provisions, if any, are regularly reviewed and adjusted to reflect the current best estimate. 3.6 Collateral Cash collateral provided by the Fund is identified in the statement of assets and liabilities as margin cash and is not included as a component of cash and cash equivalents. For collateral other than cash, if the party to whom the collateral is provided has the right by contract or custom to sell or re-pledge the collateral, the Fund classifies that asset in its statement of assets and liabilities separately from other assets and identifies the asset as pledged collateral. Where the party to whom the collateral is provided does not have the right to sell or re-pledge, a disclosure of the collateral provided is made in the notes to the financial statements. 3.7 Taxation The income of the Fund is exempt from income tax under clause 99 of Part I of the Second Schedule to the Income Tax Ordinance, 2001 subject to the condition that not less than ninety percent of its accounting income for the year, as reduced by capital gains, whether realised or unrealised, is distributed among the unit holders. The Fund intends to distribute such income at the year end in order to avail this tax exemption. Accordingly, no tax liability has been recorded for the current year. The Fund is also exempt from the provisions of section 113 (minimum tax) under clause 11A of Part IV of the Second Schedule to the Income Tax Ordinance, 2001. The Fund provides for deferred taxation using the balance sheet liability method on all major temporary differences between the amounts used for financial reporting purposes and amounts used for taxation purposes. In addition, the Fund also records deferred tax asset on unutilised tax losses to the extent that it is no longer probable that the related tax benefit will be realised. However, the Fund has not recognised any amount in respect of deferred tax in these financial statements as the Fund intends to continue availing the tax exemption in future years by distributing at least ninety percent of its accounting income for the year as reduced by capital gains, whether realised or unrealised, to its unit holders. 3.8 Proposed distributions Distributions declared subsequent to the reporting date are considered as non-adjusting events and are recog nised in the financial statements in the period in which such distributions are declared. 3.9 Issue and redemption of units Units issued are recorded at the offer price, determined by the Management Company based on the applications received by the distributors before cut off timings on that date. The offer price represents the net asset value per unit as of the close of the business day plus the allowable sales load, provision for transaction costs and any provision for duties and charges, if applicable. Units redeemed are recorded at the redemption price, applicable to units for which the distributors receive redemption requests before cut off timings of that day. The redemption price represents the net asset value per unit as of the close of the business day less any back-end load, any duties, taxes, charges on redemption and any provision for transaction costs, if applicable. Back end loads are recorded as income of the Fund. 3.10 Element of income / (loss) and capital gains / (losses) included in prices of units issued less those in units redeemed An equalisation account called the 'element of income / (loss) and capital gains / (losses) included in prices of units issued less those in units redeemed' is created, in order to prevent the dilution of income per unit and distribution of income already paid out on redemption. The Fund records that portion of the net element of income / (loss) and capital gains / (losses) relating to units issued and redeemed during an accounting period which pertains to unrealised gains / (losses) held in

31
the Unit Holder's Funds in a separate reserve account and any amount remaining in this reserve account at the end of an accounting period (whether gain or loss) is included in the amount available for distribution to the unit holders. The remaining portion of the element of income / (loss) and capital gains / (losses) relating to units issued and redeemed during an accounting period is recognised in the income statement.
3.11 Net assets value per unit
The Net Asset Value (NAV) per unit, as disclosed in the Statement of Assets and Liabilities, is calculated by dividing the net assets of the Fund by the number of units in circulation at the year end.
3.12 Preliminary expenses and floatation costs
Preliminary expenses and floatation costs represent expenditure incurred prior to the commencement of operations of the Fund. These costs are being amortised over a period of five years in accordance with the requirements set out in the Trust Deed of the Fund and the Non- Banking Finance Companies and Notified Entities Regulations.
3.13 Revenue recognition
- Dividend income on equity securities is recognised in the income statement when the right to receive dividend is established.
- Realised capital gains / (losses) arising on sale of investments are included in the income statement on the date at which the transaction takes place.
- Profit on bank deposits and income from government securities is recognised on an accrual basis.
- Unrealised gains / (losses) arising on re-measurement of investments classified as 'financial assets at fair value through profit or loss' category are included in the income statement in the period in which they arise.
4
4.1
5
BALANCES WITH BANKS
Saving accounts
These accounts carry mark-up at rates ranging from 6.00% to 12.28% (2011: 5.00% to 13.90%) per annum.
INVESTMENTS
At fair value through profit or loss - held for trading
Listed equity securities
Government securities
Note 2012 2011 ---------------- Rupees ----------------
4.1 20,845,250 172,492,798
Note 2012 2011 ---------------- Rupees ----------------
5.1 238,031,019 512,845,355
5.2 - 14,778,245
238,031,019 527,623,600

32
5.1 Listed equity securities
Shares of listed companies - fully paid ordinary shares with a face value of Rs 10 each unless stated otherwise.
Balance as at June 30, 2012
Oil and gasAttock Petroleum Limited 55,415 132,087 - 169,605 17,897 7,376,097 8,489,800 1,113,703 3.32% 3.57% 1.23%National Refinery Limited - 25,830 - 25,830 - - - - - - - Oil & Gas Development Company Limited 163,744 688,971 - 810,367 42,348 6,933,585 6,794,313 (139,272) 2.66% 2.85% 0.02%Pakistan Oilfields Limited 150,520 186,241 - 281,800 54,961 19,904,470 20,167,389 262,919 7.89% 8.47% 0.85%Pakistan Petroleum Limited 231,843 266,101 25,224 400,333 122,835 22,351,272 23,128,602 777,330 9.04% 9.72% 0.18%Pakistan State Oil Company Limited 140,655 413,991 - 554,646 - - - - - - -
742,177 1,713,221 25,224 2,242,581 238,041 56,565,424 58,580,104 2,014,680 22.91% 24.61%
ChemicalsEngro Corporation Limited 212,217 1,365,006 27,996 1,605,219 - - - - - - - Engro Polymer Limited - 200,000 - 200,000 - - - - - - - Fatima Fertilizer Company Limited 1,060,900 5,090,155 - 5,659,587 491,468 12,113,250 12,124,516 11,266 4.74% 5.09% 0.06%Fauji Fertilizer Bin Qasim Limited 225,592 893,518 - 1,119,110 - - - - - - - Fauji Fertilizer Company Limited 338,252 818,212 104,723 1,035,998 225,189 25,013,480 25,007,238 (6,242) 9.78% 10.51% 0.20%ICI Pakistan Limited 33,395 91,704 - 33,395 91,704 12,785,600 12,019,643 (765,957) 4.70% 5.05% 0.87%
1,870,356 8,458,595 132,719 9,653,309 808,361 49,912,330 49,151,397 (760,933) 19.22% 20.65%
Construction and materialsCherat Cement Liimited - 675,000 - 675,000 - - - - - - - D.G. Khan Cement Company Limited 297,836 2,296,476 - 2,181,836 412,476 17,372,801 16,243,305 (1,129,496) 6.35% 6.82% 0.37%Lucky Cement Limited 292,396 1,155,874 - 1,291,274 156,996 19,269,039 18,115,768 (1,153,271) 7.08% 7.61% 0.56%
590,232 4,127,350 - 4,148,110 569,472 36,641,840 34,359,073 (2,282,767) 13.43% 14.43%
General industriesThal Limited (Face value of Rs 5 each) 71,741 - - 71,741 - - - - - - -
71,741 - - 71,741 - - - - 0.00% 0.00%
Automobile and partsAgriauto Industries Limited 177,412 1,500 - 178,912 - - - - - - - Pak Suzuki Motor Company Limited - 50,000 - - 50,000 4,737,987 4,786,500 48,513 1.87% 2.01% 0.58%
177,412 51,500 - 178,912 50,000 4,737,987 4,786,500 48,513 1.87% 2.01%
Personal goodsNishat Mills Limited 187,024 1,280,640 - 1,467,664 - - - - - - -
187,024 1,280,640 - 1,467,664 - - - - 0.00% 0.00%
Food ProducersEngro Foods Limited - 750,000 - 750,000 - - - - - - -
- 750,000 - 750,000 - - - - 0.00% 0.00%
Fixed line TelecommunicationsPakistan Telecommunication
Company Limited - 2,515,000 - 2,515,000 - - - - - - - - 2,515,000 - 2,515,000 - - - - - -
Industrial Metals and MiningAisha Steel Mills Limited - 300,000 - - 300,000 3,000,000 3,000,000 - 1.17% 1.26% -
- 300,000 - - 300,000 3,000,000 3,000,000 - 1.17% 1.26%
ElectricityKot Addu Power Company Limited - 75,500 - 75,500 - - - - - - - Nishat Chunian Power Limited 633,641 1,424,977 - 2,058,618 - - - - - - - Nishat Power Limited - 1,918,763 - 1,918,763 - - - - - - - The Hub Power Company Limited 1,278,727 2,233,651 - 2,940,003 572,375 21,344,760 23,976,789 2,632,029 9.38% 10.07% 0.21%
1,912,368 5,652,891 - 6,992,884 572,375 21,344,760 23,976,789 2,632,029 9.38% 10.07%
BanksBank Al Habib Limited 660,990 500,000 - 660,990 500,000 14,500,000 14,235,000 (265,000) 5.57% 5.98% 0.14%MCB Bank Limited 159,988 468,465 4,760 572,853 60,360 10,235,382 10,034,246 (201,136) 3.92% 4.22% 0.11%Meezan Bank Limited 665,533 48,305 - 713,838 - - - - - - - National Bank of Pakistan 216,250 1,504,500 26,580 1,747,330 - - - - - - - United Bank Limited 370,936 894,462 - 1,020,200 245,198 18,210,030 19,218,620 1,008,590 7.51% 8.07% 0.16%Bank Alfalah Limited - 1,445,000 - 235,100 1,209,900 19,352,536 20,689,290 1,336,754 8.09% 8.69% 0.15%Habib Bank Limited - 25,000 - 25,000 - - - - - - -
2,073,697 4,885,732 31,340 4,975,311 2,015,458 62,297,948 64,177,156 1,879,208 25.09% 26.96%
Total - June 30, 2012 7,625,007 29,734,929 189,283 32,995,512 4,553,707 234,500,289 238,031,019 3,530,730 93.07% 100.00%
Total - June 30, 2011 4,464,879 21,698,852 322,928 18,861,652 7,625,007 503,855,005 512,845,355 8,990,350 79.88% 100.00%
As at June 30, 2012
Name of investee company
---------------------------Rupees-----------------------------
Market value
Market value as a percentage
of net assets
Market value as a percentage
of investmen
t
Market value as a
percentage of paid-up capital
of investee
Carrying valueAppreciation
/ (diminution)
Number of Shares
As at July 01, 2011
Purchases during the
year
Bonus / right issue during the
year
Sales during the year

33
5.1.1 The above investment includes shares pledged with National Clearing Company of Pakistan Limited having a market value (in aggregate) amounting to Rs 42,029,020 (2011: Rs 62,153,370) which have been pledged with National Clearing Company of Pakistan Limited for guaranteeing settlement of the Fund's trades in accordance with Circular no. 11 dated October 23, 2007 issued by the Securities & Exchange Commis sion of Pakistan, which are as follows: - Attock Petroleum Limited: 15,000 (2011: 20,000) - Fauji Fertilizer Company Limited: 8,000 (2011: 8,000) - Lucky Cement Limited: 5,000 (2011: 5,000) - Oil & Gas Development Company Limited: 15,000 (2011: Nil) - Pakistan Oilfields Limited: 33,000 (2011: 23,000) - Pakistan Petroleum Limited: 60,000 (2011: 20,000) - The Hub Power Company Limited: 70,000 (2011: 300,000) - United Bank Limited: 60,000 (2011: 160,000) - Engro Corporation Limited: Nil (2011: 50,000) - MCB Bank Limited: Nil (2011: 20,000) - Pakistan State Oil Company Limited: Nil (2011: 28,000) 5.2 Government securities
April 21, 2011 3 Months - 100,000,000 100,000,000 - - - - - - May 19, 2011 3 Months 15,000,000 - 15,000,000 - - - - - - July 14, 2011 3 Months - 100,000,000 100,000,000 - - - - - - July 28, 2011 3 Months - 10,000,000 10,000,000 - - - - - -
August 11, 2011 3 Months - 20,000,000 20,000,000 - - - - - - October 20, 2011 3 Months - 30,000,000 30,000,000 - - - - - -
November 3, 2011 3 Months - 10,000,000 10,000,000 - - - - - - November 17, 2011 3 Months - 20,000,000 20,000,000 - - - - - -
March 8, 2012 3 Months - 10,000,000 10,000,000 - - - - - - 15,000,000 300,000,000 315,000,000 - - - -
Disposed / matured
during the year
Balance as at June 30,
2012
Market value as a
percentage of total
Investment
-------------------------------------------------------------------Rupees----------------------------------------------------------------------
Balance as at June 30, 2012
Appreciation / (diminution)
Issue date Tenor As at July 01, 2011
Purchases during the year
Market value as a
percentage of net assets
CostMarket value
Face value
5.3
6
7
Unrealised appreciation on re-measurement of investments classified as fair value through profit or loss - 'held for trading' - net
Market value of securities Less: Carrying value of securities
DIVIDEND AND PROFIT RECEIVABLE
Dividend receivableProfit receivable on saving accounts
SECURITY DEPOSITS
National Clearing Company of Pakistan Limited Central Depository Company of Pakistan Limited
2,500,000 100,000
2,600,000
451,726 1,951,916
------------------Rupees------------------
527,623,600 518,639,774
3,530,730
183,518 268,208
1,564,836 387,080
8,983,826
20112012
238,031,019 234,500,289
2,500,000 100,000
2,600,000

34
Preliminary expenses and floatation costs represent expenditure incurred prior to the commencement of operations of the Fund. As per the requirement of the Trust Deed, these costs are being amortised over a period not exceeding five years.
9.1 Under the provisions of the Non-Banking Finance Companies and Notified Entities Regulations, 2008, the Management Company of the Fund is entitled to a remuneration during the first five years of the Fund, of an amount not exceeding three percent of the average annual net assets of the Fund and thereafter of an amount equal to two percent of such assets of the Fund. In the current year, the Management Company has charged remuneration at the rate of three percent of the average annual net assets of the Fund. The amount of remuneration is being paid monthly in arrears.
10.1 Under the provisions of the Trust Deed, the Trustee is entitled to a remuneration, to be paid monthly in arrears, as per the following tariff structure:
9 PAYABLE TO ABL ASSET MANAGEMENT COMPANY LIMITED - MANAGEMENT COMPANY
Management feeSales loadPreliminary expenses and floatation costSindh Sales Tax payable
8 PRELIMINARY EXPENSES AND FLOATATION COSTS
As at July 1, 2011Less: amortised during the yearBalance as at June 30, 2012
(718,458) 2,866,609 (716,495)
2,150,114 1,431,656
2,150,114
Note
9.1 1,440,008 176,491
2,866,699 -
4,483,198
2011------------------Rupees------------------
2,150,137
2,887,511 99,496
621,856 16,022
2012
10
11
PAYABLE TO CENTRAL DEPOSITORY COMPANY OF PAKISTAN LIMITED - TRUSTEE
Trustee feeSettlement charges
Net Assets Value (NAV) Tariff per annum
Upto Rs 1,000 million
Exceeding Rs 1,000 million
PAYABLE TO SECURITIES AND EXCHANGE COMMISSION OF PAKISTAN
Annual fee
Rs 0.7 million (2011: Rs 0.7 million) or 0.20% (2011: 0.20%) per annum of NAV whichever is higher.Rs 2 million ( 2011: Rs 2 million) plus 0.10% (2011: 0.10%) per annum of NAV exceeding Rs. 1,000 million.
Note 2012 2011
10.1 57,377 96,001 693 9,394
58,070 105,395
Note 2012 2011
11.1 373,976 431,867
-----------------Rupees-----------------
-----------------Rupees-----------------
35
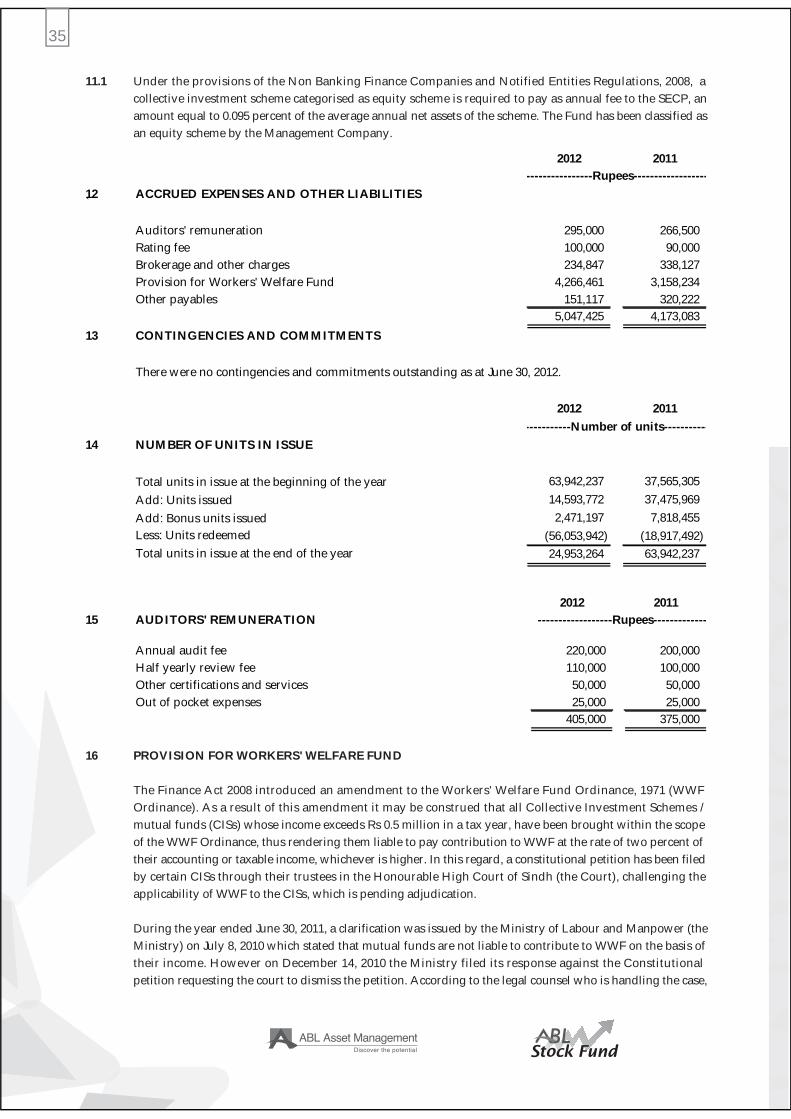
11.1 Under the provisions of the Non Banking Finance Companies and Notified Entities Regulations, 2008, a collective investment scheme categorised as equity scheme is required to pay as annual fee to the SECP, an amount equal to 0.095 percent of the average annual net assets of the scheme. The Fund has been classified as an equity scheme by the Management Company. `
16 PROVISION FOR WORKERS' WELFARE FUND The Finance Act 2008 introduced an amendment to the Workers' Welfare Fund Ordinance, 1971 (WWF Ordinance). As a result of this amendment it may be construed that all Collective Investment Schemes / mutual funds (CISs) whose income exceeds Rs 0.5 million in a tax year, have been brought within the scope of the WWF Ordinance, thus rendering them liable to pay contribution to WWF at the rate of two percent of their accounting or taxable income, whichever is higher. In this regard, a constitutional petition has been filed by certain CISs through their trustees in the Honourable High Court of Sindh (the Court), challenging the applicability of WWF to the CISs, which is pending adjudication. During the year ended June 30, 2011, a clarification was issued by the Ministry of Labour and Manpower (the Ministry) on July 8, 2010 which stated that mutual funds are not liable to contribute to WWF on the basis of their income. However on December 14, 2010 the Ministry filed its response against the Constitutional petition requesting the court to dismiss the petition. According to the legal counsel who is handling the case,
12
13
14
ACCRUED EXPENSES AND OTHER LIABILITIES
Auditors' remuneration Rating feeBrokerage and other chargesProvision for Workers' Welfare FundOther payables
CONTINGENCIES AND COMMITMENTS
There were no contingencies and commitments outstanding as at June 30, 2012.
NUMBER OF UNITS IN ISSUE
Total units in issue at the beginning of the yearAdd: Units issuedAdd: Bonus units issuedLess: Units redeemedTotal units in issue at the end of the year
2012 2011
295,000 266,500 100,000 90,000 234,847 338,127
4,266,461 3,158,234 151,117 320,222
5,047,425 4,173,083
2012 2011
63,942,237 37,565,305 14,593,772 37,475,969 2,471,197 7,818,455
(56,053,942) (18,917,492) 24,953,264 63,942,237
-----------Number of units-----------
----------------Rupees------------------
15 AUDITORS' REMUNERATION
Annual audit fee Half yearly review feeOther certifications and servicesOut of pocket expenses
2012 2011
220,000 200,000 110,000 100,000 50,000 50,000 25,000 25,000
405,000 375,000
------------------Rupees-------------

36
there is a contradiction between the aforementioned clarification issued by the Ministry and the response filed by the Ministry in Court. Subsequent to June 30, 2011, the Honourable Lahore High Court (LHC) in a constitutional petition relating to the amendments brought in the WWF Ordinance, 1971 through the Finance Act, 2006, and the Finance Act 2008, has declared the said amendments as unlawful and unconstitutional and struck them down. The Management Company is hopeful that the decision of the LHC will lend further support to the constitutional petition which is pending in the Sindh High Court (SHC). However, without prejudice to the above, the Management Company, as a matter of abundant caution, has decided to retain the provision for WWF amounting to Rs 4.266 million (including Rs 1.108 million for the current year) in these financial statements. 17 TAXATION The income of the Fund is exempt from income tax under Clause 99 of Part I of the Second Schedule to the Income Tax Ordinance, 2001 subject to the condition that not less than ninety percent of its accounting income for the year, as reduced by capital gains, whether realised or unrealised, is distributed amongst the unit holders. The Fund has not recorded provision for taxation as the Management Company has distributed more than ninety percent of the Fund's accounting income for the current year to its unit holders. 18 EARNINGS PER UNIT Earnings per unit (EPU) has not been disclosed as in the opinion of the management determination of cumulative weighted average number of outstanding units for calculation EPU is not practicable. 19 FINANCIAL INSTRUMENTS BY CATEGORY As at June 30, 2012, all the financial assets carried on the Statement of Assets and Liabilities are categorised either as 'loans and receivables' or financial assets 'at fair value through profit or loss'. All the financial liabilities carried on the Statement of Assets and Liabilities are categorised as other financial liabilities i.e. liabilities other than 'at fair value through profit or loss'.
Financial assets
Balances with banksInvestmentsDividend and profit receivableSecurity depositsReceivable against sale of investments
20,845,250 - 20,845,250 - 238,031,019 238,031,019
451,726 - 451,726 2,600,000 - 2,600,000
756,518 - 756,518 24,653,494 238,031,019 262,684,513
--------------------------------Rupees--------------------------------
Loans and receivables
At fair value through profit
or loss Total
------------------------As at June 30, 2012------------------------

37
20 TRANSACTIONS WITH CONNECTED PERSONS 20.1 Connected persons / related parties include ABL Asset Management Company Limited being the Management Company, Allied Bank Limited, entities under common management and / or directorship, Central Depository Company being the trustee of the Fund and the directors and officers of the Management Company. 20.2 Transactions with connected persons are in the normal course of business, at contracted rates and terms determined in accordance with market norms. 20.3 Remuneration of the Management Company is determined in accordance with the provisions of the NBFC Regulations and the Trust Deed. 20.4 Remuneration of the Trustee is determined in accordance with the provisions of the Trust Deed.
Financial liabilities Payable to ABL Asset Management Company LimitedPayable to Central Depository Company of Pakistan
Limited - TrusteeAccrued expenses and other liabilities
Financial assets
Balances with banksInvestmentsDividend and profit receivableSecurity depositsReceivable against sale of investmentsReceivable against sale of units
Financial liabilities
Payable to ABL Asset Management Company LimitedPayable to Central Depository Company of Pakistan
Limited - TrusteeDividend payableAccrued expenses and other liabilities
- 2,887,511 2,887,511
- 58,070 58,070 - 780,964 780,964 - 3,726,545 3,726,545
172,492,798 - 172,492,798 - 527,623,600 527,623,600
1,951,916 - 1,951,916 2,600,000 - 2,600,000 2,559,137 - 2,559,137
412,996 - 412,996 180,016,847 527,623,600 707,640,447
- 4,483,198 4,483,198
- 105,395 105,395 - 58,564,623 58,564,623 - 1,041,849 1,041,849 - 64,195,065 64,195,065
-------------------------As at June 30, 2011-------------------------
Loans and receivables
At fair value through profit or
loss Total
At fair value through profit
or loss
Other financial liabilities
Total
---------------------------------Rupees---------------------------------
-------------------------As at June 30, 2011-------------------------
---------------------------------Rupees---------------------------------
---------------------------------Rupees---------------------------------
-------------------------As at June 30, 2012-------------------------
At fair value through profit
or loss
Other financial liabilities Total

38
20.5 Detail of transactions are as follows:
ABL Asset Management Company Limited - Management Company
Issue of Nil units (2011: 934,076 units)Bonus of 602,325 units (2011: 567,009 units)Redemption of Nil units (2011: 7,849,068 units)Remuneration of the Management CompanySindh Sales Tax on Management company's remuneration
Allied Bank Limited
Profit on bank depositsCash DividendBank charges
Allied Bank Limited - Employees Superannuation (Pension) Fund
Redemption of 10,000,000 units (June 30,2011:Nil)Cash Dividend
Ibrahim Agencies (Private) Limited
Bonus of Nil units (2011: 3,931,921 units)Redemption of 26,530,977 units (June 30, 2011: Nil)
Central Depository Company of Pakistan Limited - Trustee
Remuneration for the yearSettlement charges and connection fee
Key Management Personnel
Executives
Issue of 40,185 units (2011: 23,101 units)Bonus of 9,554 units (2011: 13,058 units)Redemption of 58,343 units (2011: 16,724 units)
Issue of Nil units (2011: 22,599,056 units)
- 11,482,952 6,099,564 5,757,467
- 90,000,000 11,809,870 13,637,772
1,889,579 -
1,611,600 971,428 24,077,000 29,280,000
38,147 23,065
97,021,000 - - 29,280,000
- 255,000,000 - 39,925,119
258,894,581
872,388 909,181 274,725 134,614
504,922 300,000 96,752 132,593
647,409 179,495
-----------------Rupees-----------------
For the year ended June 30,
2012
For the year ended June
30, 2011
20.6 Detail of balances outstanding are as follows:
ABL Asset Management Company Limited - Management Company
Management fee payablePreliminary expenses and floatation costSales load payable3,135,682 units held (2011: 2,533,357)Sindh Sales Tax on Management company's remuneration
621,856 1,440,008 2,150,137 2,866,699
16,022 176,491 32,137,918 25,436,930
99,496 -
2012 2011-----------------Rupees-----------------

39
Allied Bank Limited
Profit receivable on saving accountsBank balance10,000,000 units held (2011: 10,000,000)
Allied Bank Limited - Employees Superannuation (Pension) Fund
Nil units held (2011: 10,000,000)
Ibrahim Agencies (Private) Limited
Nil Units held (2011: 26,530,977)
Central Depository Company of Pakistan Limited - Trustee
Trustee fee payableSettlement charges payableSecurity deposit
Key Management Personnel
Executives
49,738 units held (2011: 58,342 units)
91,584 59,098 10,836,148 97,122,982
102,491,000 100,408,000
- 100,408,000
- 266,392,234
57,377 96,001 693 9,394
100,000 100,000
509,770 585,800
2012 2011-----------------Rupees-----------------
21 PARTICULARS OF INVESTMENT COMMITTEE AND FUND MANAGER
Details of members of investment committee of the Fund are as follows:
1 Mr. Farid Ahmed Khan Chief Executive Officer 18 CFA2 Mr. Muhammad Imran Chief Investment Officer 13 MBA3 Mr. Abid Jamal Head of Research 9 BS4 Mr. Hammad Ali Abbas Fund Manager 8 MSc.5 Mr. Kamran Aziz Fund Manager 5 CFA6 Mr. Faizan Saleem Fund Manager 5 MBA
21.1 Mr. Kamran Aziz is the Fund Manager of the Fund. He is not managing any other fund.
S. No. Experience in years
QualificationName Designation

40
22 TRANSACTIONS WITH BROKERS / DEALERS
List of brokers by percentage of commission paid during the year ended June 30, 2012
S. No. Percentage1 Optimus Capital Management (Pvt) Limited 11.31%2 Taurus Securities (Pvt) Limited 10.32%3 Fortune Securities (Private) Limited 9.73%4 Invest & Finance Securities Limited 6.11%5 Invisor Securities (Private) Limited 5.90%6 BMA Capital Management Limited 5.66%7 Arif Habib Limited 5.22%8 Topline Securities (Private) Limited 4.98%9 KASB Securities Limited 4.83%10 Foundation Securities Limited 4.82%
List of brokers by percentage of commission paid during the year ended June 30, 2011
S. No. Percentage1 JS Global Capital Limited 19.59%2 Adam Securities (Private) Limited 13.94%3 Invisor Securities (Private) Limited 9.04%4 Elixir Securities Pakistan (Private) Limited 6.10%5 Fortune Securities (Private) Limited 5.91%6 Arif Habib Limited 5.67%7 Foundation Securities (Private) Limited 5.58%8 Crossby Securities Pakistan (Private) Limited 4.87%9 BMA Capital Management Limited 4.72%10 IGI Finex Securities Limited 4.49%
Particulars
Particulars
PATTERN OF UNIT HOLDING23
(Rupees)
Individuals 154 5,085,120 52,118,592 20.38%Associated Companies / Directors 2 13,135,682 134,628,918 52.64%Retirement funds 5 3,661,392 37,525,973 14.67%Others 2 3,071,070 31,475,704 12.31%
163 24,953,264 255,749,187 100%
(Rupees)
Individuals 121 3,597,484 36,122,748 5.63%Associated Companies/ Directors 4 49,064,334 492,645,164 76.73%Retirement funds 3 8,268,574 83,023,098 12.93%Others 1 3,011,844 30,241,385 4.71%
129 63,942,237 642,032,395 100%
-------------------------------------As at June 30, 2012---------------------------------
-------------------------------------As at June 30, 2011---------------------------------
Net assets value of the amount
invested
Percentage of total investment
Number of unit holders
Number of units held
Net assets value of the amount
invested
Percentage of total investment
Number of unit holders
Number of units held
Category
Category
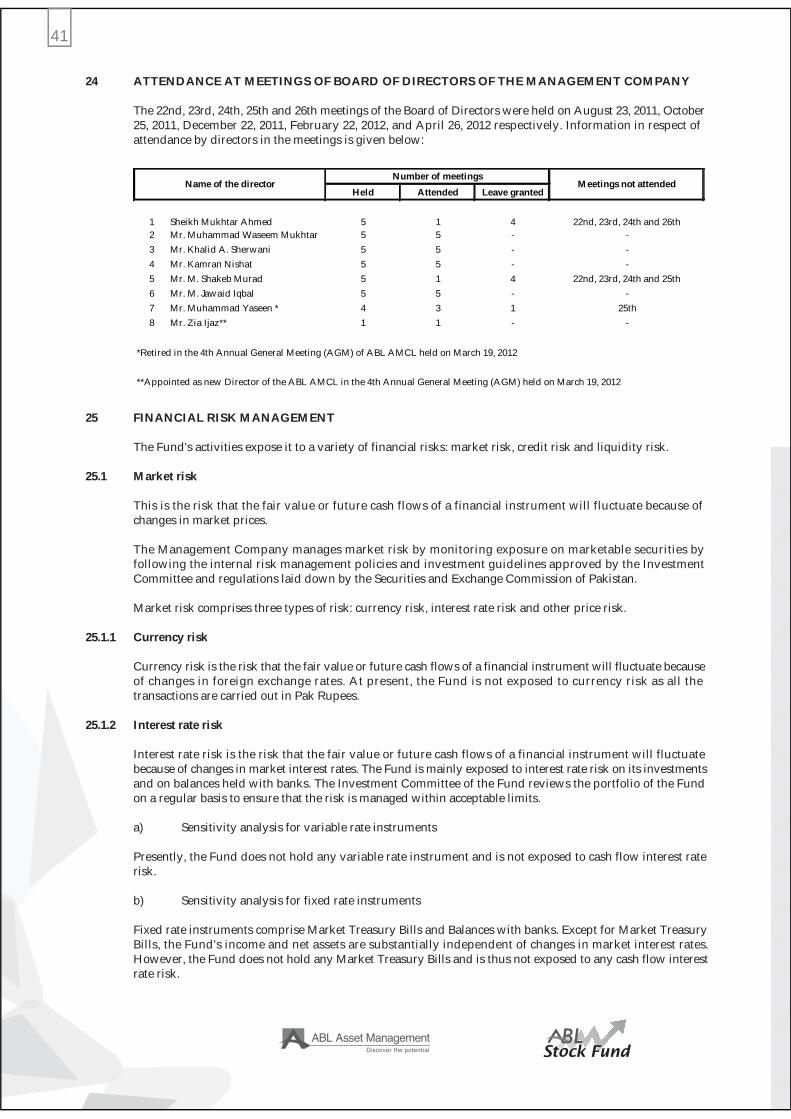
41
24 ATTENDANCE AT MEETINGS OF BOARD OF DIRECTORS OF THE MANAGEMENT COMPANY The 22nd, 23rd, 24th, 25th and 26th meetings of the Board of Directors were held on August 23, 2011, October 25, 2011, December 22, 2011, February 22, 2012, and April 26, 2012 respectively. Information in respect of attendance by directors in the meetings is given below:
25 FINANCIAL RISK MANAGEMENT The Fund's activities expose it to a variety of financial risks: market risk, credit risk and liquidity risk. 25.1 Market risk This is the risk that the fair value or future cash flows of a financial instrument will fluctuate because of changes in market prices. The Management Company manages market risk by monitoring exposure on marketable securities by following the internal risk management policies and investment guidelines approved by the Investment Committee and regulations laid down by the Securities and Exchange Commission of Pakistan. Market risk comprises three types of risk: currency risk, interest rate risk and other price risk.
25.1.1 Currency risk Currency risk is the risk that the fair value or future cash flows of a financial instrument will fluctuate because of changes in foreign exchange rates. At present, the Fund is not exposed to currency risk as all the transactions are carried out in Pak Rupees. 25.1.2 Interest rate risk Interest rate risk is the risk that the fair value or future cash flows of a financial instrument will fluctuate because of changes in market interest rates. The Fund is mainly exposed to interest rate risk on its investments and on balances held with banks. The Investment Committee of the Fund reviews the portfolio of the Fund on a regular basis to ensure that the risk is managed within acceptable limits. a) Sensitivity analysis for variable rate instruments Presently, the Fund does not hold any variable rate instrument and is not exposed to cash flow interest rate risk. b) Sensitivity analysis for fixed rate instruments Fixed rate instruments comprise Market Treasury Bills and Balances with banks. Except for Market Treasury Bills, the Fund's income and net assets are substantially independent of changes in market interest rates. However, the Fund does not hold any Market Treasury Bills and is thus not exposed to any cash flow interest rate risk.
Held Attended Leave granted
1 Sheikh Mukhtar Ahmed 5 1 42 Mr. Muhammad Waseem Mukhtar 5 5 -3 Mr. Khalid A. Sherwani 5 5 -4 Mr. Kamran Nishat 5 5 -5 Mr. M. Shakeb Murad 5 1 46 Mr. M. Jawaid Iqbal 5 5 -7 Mr. Muhammad Yaseen * 4 3 18 Mr. Zia Ijaz** 1 1 -
*Retired in the 4th Annual General Meeting (AGM) of ABL AMCL held on March 19, 2012
**Appointed as new Director of the ABL AMCL in the 4th Annual General Meeting (AGM) held on March 19, 2012
-
-25th
-
-22nd, 23rd, 24th and 25th
Name of the directorNumber of meetings
Meetings not attended
22nd, 23rd, 24th and 26th -

42
Yield / interest rate sensitivity position for on-balance sheet financial instruments is based on the earlier of contractual repricing or maturity date and for off-balance sheet instruments is based on settlement date.
On-balance sheet financial instruments
Financial assetsBalances with banksInvestmentsDividend and profit receivableSecurity depositsReceivable against sale of investmentsSub total
Financial liabilities Payable to ABL Asset Management Company Limited
- Management Company Pakistan Limited-TrusteeAccrued expenses and other liabilitiesSub total
On-balance sheet gap
Off-balance sheet financial instruments
Off-balance sheet gap
Total interest rate sensitivity gap
Cumulative interest rate sensitivity gap
On-balance sheet financial instruments
Financial assetsBalances with banksInvestmentsDividend and profit receivableSecurity depositsReceivable against sale of unitsReceivable against sale of investmentsSub total
Financial liabilities Payable to ABL Asset Management Company Limited
- Management CompanyPayable to Central Depository Company of Pakistan Limited-TrusteeDividend payableAccrued expenses and other liabilitiesSub Total
On-balance sheet gap
Off-balance sheet financial instruments
Off-balance sheet gap
Total interest rate sensitivity gap
Cumulative interest rate sensitivity gap
%
6.00 - 12.28 20,845,250 - - - 20,845,250 - - - 238,031,019 238,031,019 - - - 451,726 451,726 - - - 2,600,000 2,600,000 - - - 756,518 756,518
20,845,250 - - 241,839,263 262,684,513
- - - 2,887,511 2,887,511 - - - 58,070 58,070 - - - 780,964 780,964 - - - 3,726,545 3,726,545
20,845,250 - - 238,112,718 258,957,968
- - - - -
- - - - -
20,845,250 - - 238,112,718 258,957,968
20,845,250 20,845,250 20,845,250
%
5.0 - 13.3 172,492,798 - - - 172,492,798 14,778,245 - - 512,845,355 527,623,600
- - - 1,951,916 1,951,916 - - - 2,600,000 2,600,000 - - - 412,996 412,996 - - - 2,559,137 2,559,137
187,271,043 - - 520,369,404 707,640,447
- - - 4,483,198 4,483,198
- - - 105,395 105,395 - - - 58,564,623 58,564,623 - - - 1,014,849 1,014,849 - - - 64,168,065 64,168,065
187,271,043 - - 456,201,339 643,472,382
- - - - -
- - - - -
187,271,043 - - 456,201,339 643,472,382
187,271,043 187,271,043 187,271,043
------------------------------------------------As at June 30, 2011-------------------------------------------------
------------------------------------------------As at June 30, 2012-------------------------------------------------
Effective yield /
interest rate
Exposed to yield / interest risk
-----------------------------------------------Rupees----------------------------------------------
Not exposed to yield /
interest rate risk
Total More than one year
Upto three months
More than three months and up to one
year
More than three months and up to one
year
Total Upto three months
More than one year
-----------------------------------------------Rupees----------------------------------------------
Exposed to yield / interest risk
Not exposed to yield /
interest rate risk
Effective yield /
interest rate
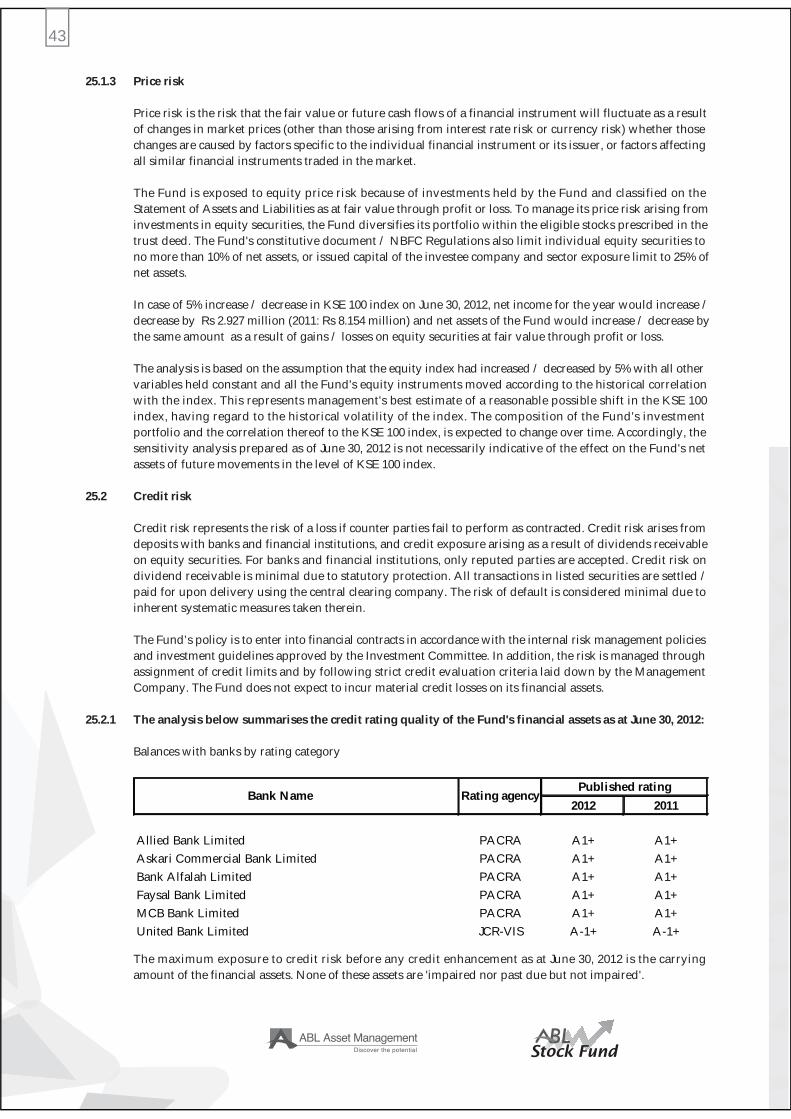
43
25.1.3 Price risk Price risk is the risk that the fair value or future cash flows of a financial instrument will fluctuate as a result of changes in market prices (other than those arising from interest rate risk or currency risk) whether those changes are caused by factors specific to the individual financial instrument or its issuer, or factors affecting all similar financial instruments traded in the market. The Fund is exposed to equity price risk because of investments held by the Fund and classified on the Statement of Assets and Liabilities as at fair value through profit or loss. To manage its price risk arising from investments in equity securities, the Fund diversifies its portfolio within the eligible stocks prescribed in the trust deed. The Fund's constitutive document / NBFC Regulations also limit individual equity securities to no more than 10% of net assets, or issued capital of the investee company and sector exposure limit to 25% of net assets. In case of 5% increase / decrease in KSE 100 index on June 30, 2012, net income for the year would increase / decrease by Rs 2.927 million (2011: Rs 8.154 million) and net assets of the Fund would increase / decrease by the same amount as a result of gains / losses on equity securities at fair value through profit or loss. The analysis is based on the assumption that the equity index had increased / decreased by 5% with all other variables held constant and all the Fund's equity instruments moved according to the historical correlation with the index. This represents management's best estimate of a reasonable possible shift in the KSE 100 index, having regard to the historical volatility of the index. The composition of the Fund's investment portfolio and the correlation thereof to the KSE 100 index, is expected to change over time. Accordingly, the sensitivity analysis prepared as of June 30, 2012 is not necessarily indicative of the effect on the Fund's net assets of future movements in the level of KSE 100 index. 25.2 Credit risk Credit risk represents the risk of a loss if counter parties fail to perform as contracted. Credit risk arises from deposits with banks and financial institutions, and credit exposure arising as a result of dividends receivable on equity securities. For banks and financial institutions, only reputed parties are accepted. Credit risk on dividend receivable is minimal due to statutory protection. All transactions in listed securities are settled / paid for upon delivery using the central clearing company. The risk of default is considered minimal due to inherent systematic measures taken therein.
The Fund’s policy is to enter into financial contracts in accordance with the internal risk management policies and investment guidelines approved by the Investment Committee. In addition, the risk is managed through assignment of credit limits and by following strict credit evaluation criteria laid down by the Management Company. The Fund does not expect to incur material credit losses on its financial assets. 25.2.1 The analysis below summarises the credit rating quality of the Fund's financial assets as at June 30, 2012: Balances with banks by rating category
The maximum exposure to credit risk before any credit enhancement as at June 30, 2012 is the carrying amount of the financial assets. None of these assets are 'impaired nor past due but not impaired'.
2012 2011
Allied Bank Limited PACRA A1+ A1+Askari Commercial Bank Limited PACRA A1+ A1+Bank Alfalah Limited PACRA A1+ A1+Faysal Bank Limited PACRA A1+ A1+MCB Bank Limited PACRA A1+ A1+United Bank Limited JCR-VIS A-1+ A-1+
Bank Name Rating agencyPublished rating

44
25.2.2 Concentration of credit risk Concentration of credit risk exists when changes in economic or industry factors similarly affect groups of counterparties whose aggregate credit exposure is significant in relation to the Fund’s total credit exposure. The Fund’s portfolio of financial instruments is broadly diversified and transactions are entered into with diverse credit-worthy counterparties thereby mitigating any significant concentrations of credit risk. 25.3 Liquidity risk Liquidity risk is the risk that the Fund may not be able to generate sufficient cash resources to settle its obligations in full as they fall due or can only do so on terms that are materially disadvantageous. The Fund is exposed to the daily settlement of equity securities and to daily cash redemptions, if any. The Fund's approach to managing liquidity is to ensure, as far as possible, that the Fund will always have sufficient liquidity to meet its liabilities when due under both normal and stressed conditions, without incurring unacceptable losses or risking damage to the Fund's reputation. Its policy is therefore to invest the majority of its assets in investments that are traded in an active market and can be readily disposed of. The Fund’s listed securities are considered readily realisable, as they are listed on the Karachi Stock Exchange. In order to manage the Fund's overall liquidity, the Fund may also withhold daily redemption requests in excess of ten percent of the units in issue and such requests would be treated as redemption requests qualify ing for being processed on the next business day. Such procedure would continue until the outstanding redemption requests come down to a level below ten percent of the units then in issue. The fund did not withhold any redemptions during the year. The table below analyses the Fund's financial liabilities into relevant maturity groupings based on the remaining period at the reporting date to the contractual maturity date. The amounts in the table are the contractual undiscounted cash flows.
Liabilities
Payable to ABL Asset Management Company Limited- Management Company
Payable to Central Depository Company of Pakistan Limited - TrusteeAccrued expenses and other liabilities
Liabilities
Payable to ABL Asset Management Company Limited- Management Company
Payable to Central Depository Company of Pakistan Limited - TrusteeDividend payableAccrued expenses and other liabilities
1,454,086 - 1,433,425 2,887,511
58,070 - - 58,070 780,964 - - 780,964
2,293,120 - 1,433,425 3,726,545
2,333,174 - 2,150,024 4,483,198
105,395 - - 105,395 58,564,623 - - 58,564,623
1,014,849 - - 1,014,849 62,018,041 - 2,150,024 64,168,065
----------------------------As at June 30, 2011----------------------------
------------------------------As at June 30, 2012------------------------------
Upto three months
---------------------------------- Rupees -----------------------------------
More than three months and up to one
year
More than one year
Total
---------------------------------- Rupees -----------------------------------
Total
Upto three months
More than three months and up to one
year
More than one year
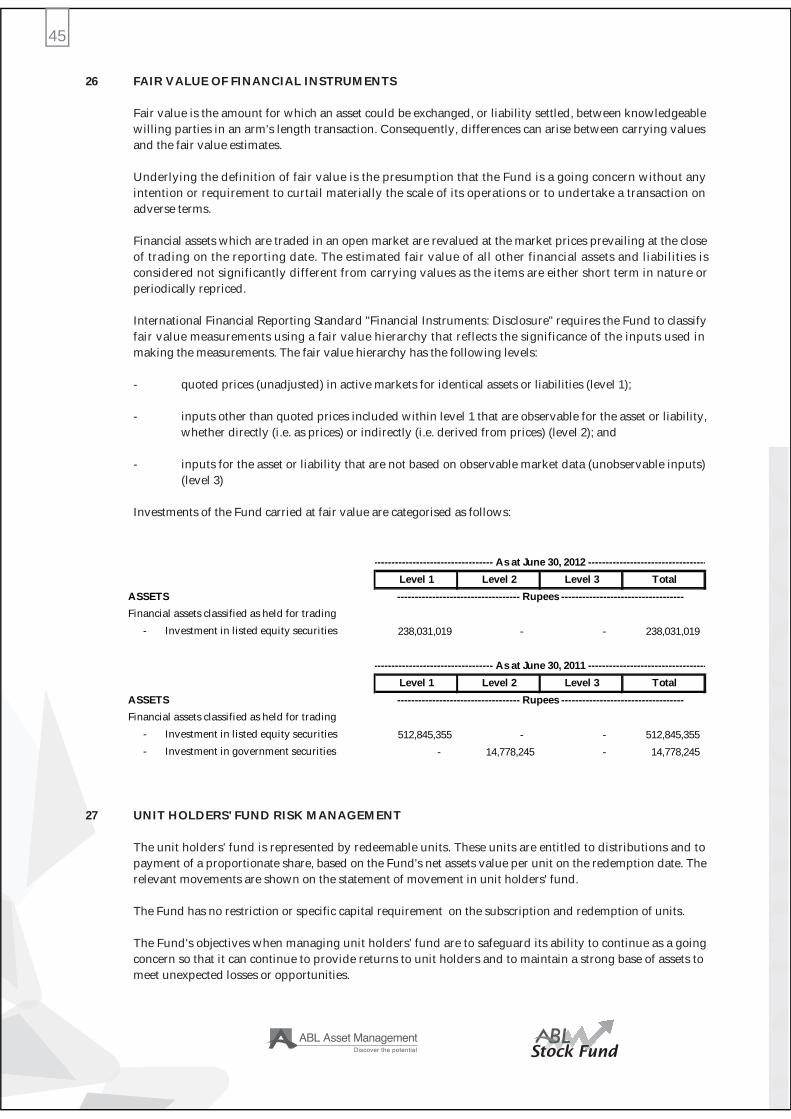
45
26 FAIR VALUE OF FINANCIAL INSTRUMENTS Fair value is the amount for which an asset could be exchanged, or liability settled, between knowledgeable willing parties in an arm's length transaction. Consequently, differences can arise between carrying values and the fair value estimates. Underlying the definition of fair value is the presumption that the Fund is a going concern without any intention or requirement to curtail materially the scale of its operations or to undertake a transaction on adverse terms. Financial assets which are traded in an open market are revalued at the market prices prevailing at the close of trading on the reporting date. The estimated fair value of all other financial assets and liabilities is considered not significantly different from carrying values as the items are either short term in nature or periodically repriced. International Financial Reporting Standard "Financial Instruments: Disclosure" requires the Fund to classify fair value measurements using a fair value hierarchy that reflects the significance of the inputs used in making the measurements. The fair value hierarchy has the following levels: - quoted prices (unadjusted) in active markets for identical assets or liabilities (level 1); - inputs other than quoted prices included within level 1 that are observable for the asset or liability, whether directly (i.e. as prices) or indirectly (i.e. derived from prices) (level 2); and - inputs for the asset or liability that are not based on observable market data (unobservable inputs) (level 3) Investments of the Fund carried at fair value are categorised as follows:
27 UNIT HOLDERS' FUND RISK MANAGEMENT The unit holders' fund is represented by redeemable units. These units are entitled to distributions and to payment of a proportionate share, based on the Fund's net assets value per unit on the redemption date. The relevant movements are shown on the statement of movement in unit holders' fund. The Fund has no restriction or specific capital requirement on the subscription and redemption of units. The Fund's objectives when managing unit holders' fund are to safeguard its ability to continue as a going concern so that it can continue to provide returns to unit holders and to maintain a strong base of assets to meet unexpected losses or opportunities.
ASSETSFinancial assets classified as held for trading
- Investment in listed equity securities
ASSETSFinancial assets classified as held for trading
- Investment in listed equity securities- Investment in government securities
Level 1 Level 2 Level 3 Total
238,031,019 - - 238,031,019
Level 1 Level 2 Level 3 Total
512,845,355 - - 512,845,355 - 14,778,245 - 14,778,245
----------------------------------- Rupees -----------------------------------
---------------------------------- As at June 30, 2011 ----------------------------------
---------------------------------- As at June 30, 2012 ----------------------------------
----------------------------------- Rupees -----------------------------------

46
In accordance with the risk management policies, the Fund endeavours to invest the subscriptions received in appropriate investment avenues while maintaining sufficient liquidity to meet redemption requests, such liquidity being augmented by short-term borrowings or disposal of investments where necessary. 28 CORRESPONDING FIGURES Corresponding figures have been rearranged or reclassified, where necessary, for the purpose of better presentation. No significant rearrangement or reclassification were made in these financial statements. 29 DATE OF AUTHORISATION FOR ISSUE These financial statements were authorised for issue on August 10, 2012 by the Board of Directors of the Management Company. 30 GENERAL Figures have been rounded off to the nearest rupee.
For ABL Asset Management Company Limited(Management Company)
FARID AHMED KHANCEO
KAMRAN NISHATDIRECTOR


![Class 3 Ab + L AbL Review d/ dt [ AbL ] = k on [ Ab ][L] – k off [ AbL ]](https://static.documents.pub/doc/80x56/56815b21550346895dc8dddd/class-3-ab-l-abl-review-d-dt-abl-k-on-ab-l-k-off-abl-.jpg)


