SFD Report Buffalo City Metropolitan Municipality Eastern Cape, South Africa This SFD Intermediate Report was prepared by Emanti Management. Date of production: 21 November 2018 Last update: 9 July 2021
Transcript
SFD Report
Buffalo City Metropolitan Municipality Eastern Cape, South Africa
Buffalo City Metropolitan Municipality South Africa
Produced by: Emanti Executive Summary
1. The SFD Graphic
2. Diagram information
SFD Level:
This is an Intermediate SFD.
Produced by:
Emanti Management (Pty) Ltd, Stellenbosch, South Africa
Collaborating partners:
Centre for Science and Environment (CSE, India)
Status:
Reviewed
Date of production: 20/11/2018
Date of last update: 9/7/2021
3. General municipal information
This SFD Intermediate Report was developed for Buffalo City Metropolitan Municipality (BCCM). The BCCM is categorised as a Category A Metropolitan Municipality. Initially established as a local municipality in 2000 after
South Africa's reorganisation of municipal areas, it was separated from the Amathole District Municipality and converted into a Category A metropolitan municipality. The main cities/towns in the BCMM are Bisho, Dimbaza, East London, Kidd's Beach, King William's Town, Mdantsane. The reorganisation of the municipal areas has led to other areas that were previously not part of East London and King William’s Town included into BCMM jurisdiction. The estimated population size is 843,997 and 253,477 households (i.e., population density of ~317 persons per square kilometres (km2)). Buffalo City normally receives about 850 mm of rain per year, with most rainfall occurring mainly during summer. Due to the large geographical area (2,515 km²) consisting of coastline and mountainous regions, the temperature and rainfall patterns varies according to location.
4. Service outcomes
The following sanitation technologies were noted:
o Toilet discharges directly to a centralised foul / separate sewer – these are flush toilets that are
Last Update: 9/07/2021 II
Buffalo City Metropolitan Municipality South Africa
Produced by: Emanti Executive Summary
connected directly to the wastewater treatment works.
o Fully lined tank (sealed, no outlet or overflow) – these are buried concrete tanks, both from individual households (flush toilet connected to a conservancy tank) and community ablution blocks (flush toilets connected to a conservancy tank; replaced previous use of chemical toilets in specific areas). Some of these tanks are in poor condition.
o Lined pit with semi-permeable walls and open bottom – these are cement block lined Ventilated Improved Pit latrines (VIPs) with an open bottom. Although some VIPs are emptied, an emptying backlog exists.
o Unlined pits – these are VIPs that are unlined and were mostly installed before 2012. There is limited groundwater potential within BCMM, but some rural areas are, however, currently still using groundwater resources. Although some VIPs are emptied, an emptying backlog exists.
o Pit (all types) never emptied, but abandoned when full and covered with soil, no overflow or outlet where there is significant/low risk of ground water pollution – these are old pit latrines that are not lined and never emptied. As they are full, BCMM currently categorise these households as not serviced. When full, the top structure is removed and taken to a new pit. It is believed that these pits are covered with soil when abandoned. There is limited groundwater potential within BCMM but some rural areas are, however, currently still using groundwater resources.
o No toilet, open defecation – these are rural and informal households that have not been serviced, and do not have a toilet. Their sanitation status is unknown, and it is assumed that open defecation is occurring.
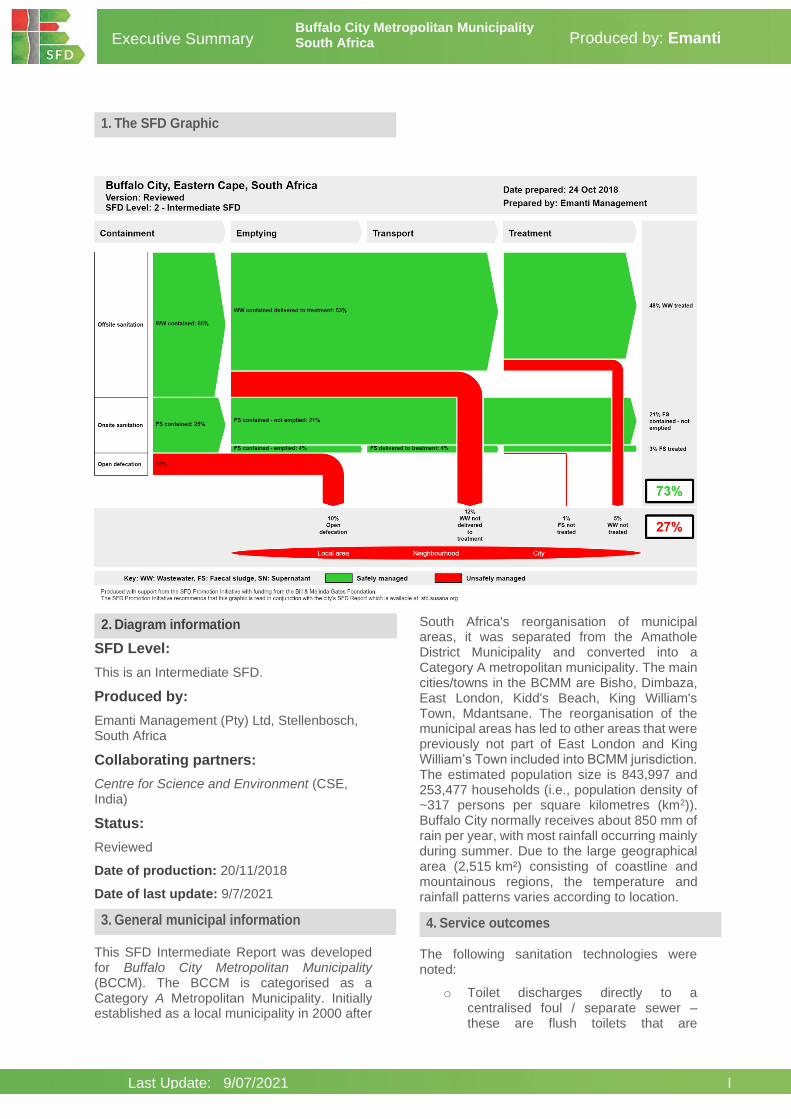
Based on the above available data, estimates and assumptions, the SFD graphic illustrates that 73% of excreta is safely managed in BCMM.
The majority of the BCMM population utilise off-site sanitation systems (65%), a quarter of the population use on-site sanitation and 10% practice open defecation.
Two-thirds of the safely managed sanitation is wastewater delivered to and treated at the treatment plants (48% WW treated on the SFD graphic). The majority of the safely managed onsite sanitation is from the 21% of the total population using VIPs and unlined pits which, when full, are not emptied but closed, covered and replaced with a new facility. Only 3% of safely managed excreta is faecal sludge that has been emptied from tanks and transported for treatment at the WWTW.
An estimated 27% of the excreta from the total population is not safely managed. Roughly a third of this (10%) is from open defecation, while just over two-fifths (12% on the SFD graphic) is wastewater which is not delivered to treatment due to leakage from the sewer system. Wastewater and faecal delivered to treatment but not treated accounts for the balance (1% FS not treated, and 5% WW not treated on SFD graphic).
5. Service delivery context
The Constitution of South Africa classifies municipalities into three (3) categories (A, B and C). Category A municipalities are metropolitan municipalities which consist of a major urbanised core. BCMM has been reclassified as a metropolitan municipality in 2011. BCMM is responsible for the delivery of basic services including sanitation.
The sanitation sector in the country has been guided and regulated by the following policy documents:
o the White Paper on Water Supply and Sanitation (1994);
o the White Paper on a National Sanitation Policy (1997);
o the Water Services Act (1997)
o White Paper on Basic Household Sanitation (2001)
o Strategic Framework for Water Services (2003)
o Free Basic Sanitation Implementation Strategy (2009)
o National Sanitation Policy (2006 and 2016)
The policy documents make provision for procedures, rules and allocation mechanisms for sanitation which are implemented through the policy instrument of laws and regulations; economic measures; information and education programmes; and assignment of rights and responsibilities for providing services.
Last Update: 9/07/2021 III
Buffalo City Metropolitan Municipality South Africa
Produced by: Emanti Executive Summary
Implementation of the South African sanitation policy is guided by 2003 Strategic Framework for Water Services. This document guides the sanitation policy with respect to the provision of water services from rural to urban and people and industry.
Due to the legacy of Apartheid planning, the targeted area has a history of significant water and service backlogs and lack of infrastructure. Further, expansion of its municipal boundaries has led to the inheritance of a large number of VIPs (~30,000) which had not been routinely serviced (emptied). Backlogs have / are being addressed through various programmes. Details of planned water and sanitation projects can be viewed in the Integrated Development Plan (IDP) of the BCMM. The IDP is a plan for an area that provides for an overall framework for development and has a budget approved by the municipal council. Four levels of sanitation service are described in municipal strategy and includes a mix of off-site and on-site implementation and upgrades.
6. Overview of stakeholders
An overview of stakeholders involved:
o BCMM which is Water Services Authority (WSA) and Water Services Provider (WSP)
7. Process of SFD development
This SFD Intermediate Report was developed with the assistance of BCMM. Various sources of information were used for the compilation of this report. This includes Stats SA data, IDPs, Eastern Cape Socio Economic Consultative Council (ECSECC).
10. Credibility of data
There is no reason to suggest that data from BCMM are not credible. The data presented in the IDP are similar to those provided during stakeholder engagement.
11. List of data sources
Below is the list of data sources used:
o Published reports: Census 2011, Community Survey 2016
o Unpublished documents: IDP, WSDP
o Key informant interviews: BCMM
Last Update: 9/07/2021 IV
Buffalo City Metropolitan Municipality South Africa
Produced by: Emanti SFD Report
Table of Contents
Table of Contents ................................................................................................................. IV
List of Tables ........................................................................................................................ VI
List of Figures ...................................................................................................................... VII
Abbreviations ..................................................................................................................... VIII
1 Municipal context............................................................................................................ 1
2 Service Outcomes .......................................................................................................... 5
Buffalo City Metropolitan Municipality South Africa
Produced by: Emanti SFD Report
Abbreviations ADM Amathole District Municipality BCMM Buffalo City Metropolitan Municipality DM District Municipality DPLG Department of Provincial and Local Government DWA Department of Water Affairs (now DWS) DWAF Department of Water Affairs and Forestry (now DWS) DWS Department of Water and Sanitation FS Faecal sludge IDP Integrated Development Plan LM Local Municipality RDP Reconstruction and Development Programme SALGA South African Local Government Association SFD Shit Flow Diagram Stats SA Statistics South Africa VIP Ventilated Improved Pit Latrine WRC Water Research Commission WSA Water Services Authority WSDP Water Services Development Plan WSP Water Service Provider WW Wastewater WWTW Wastewater Treatment Works
Last Update: 9/07/2021 1
Buffalo City Metropolitan Municipality South Africa
Produced by: Emanti SFD Report
1 Municipal context The Constitution of South Africa classifies municipalities into three (3) categories (A, B and C). Category A municipalities are metropolitan municipalities which consist of a major urbanised core. Category C municipalities are District Municipalities (DM) that consist of 1 or more Local Municipalities (LMs) (Category B municipalities). In line with the government municipal classification in South Africa, the Buffalo City Metropolitan Municipality (BCCM) is categorised as a Category A Municipality. The municipality was established as a local municipality in 2000 after South Africa's reorganization of municipal areas. The name is derived after the Buffalo River. In 2011, Buffalo City LM was separated from the Amathole DM and converted into a metropolitan municipality. The BCCM consists of a significant portion of two (2) Magisterial Districts:
o East London, including the previous Ciskei Magisterial District(s) of Mdantsane. o King Williams Town, including the previous Ciskei Magisterial District of Zwelitsha
(Buffalo City Metropolitan Municipality, 2018). The reorganisation of the municipal areas has led to other areas that were previously not part of East London and King William’s Town included into BCMM jurisdication. The main cities/towns in the BCMM are: Bisho, Dimbaza, East London, Kidd's Beach, King William's Town, Mdantsane, Phakamisa, Zwelitsha. The BCMM’s land area is approximately 2,515 km² with 68 km of coastline. Buffalo City is the key urban center of the eastern part of the Eastern Cape Province, South Africa. In the east of BCCM is the city of East London. The area is well-known for its auto industry manufacturing base with Daimler AG and its wholly owned subsidiary Mercedes-Benz South Africa having an assembly plant in close proximity to the port of East London (Buffalo City Metropolitan Municipality, 2018). From East London, there is an urban corridor to Mdantsane and Dimbaza to the west. There is a spatial fragmentation of urban areas within BCCM with 3 main identifiable land use and land need patterns identified:
o An urban corridor formed through the East London – Mdantsane – King Williams Town – Dimbaza urban development axis. This corridor is the source of population influx due to its industrial and service sectors and improved access to services and facilities (Figure 1). East London serves as the primary urban node. King William’s Town functions as a Regional Service Centre and with Bhisho, serves as the Provincial Administrative Hub and the seat of the Provincial Government of the Eastern Cape Province.
o Rural and peri-urban settlements are mainly located in former homelands, Ciskei, and on the outskirts of East London in the form of Newlands. These areas are home to around 20% of the BCCM population.
o Commercial farming areas in the north-eastern and south-western (coastal) sectors (Buffalo City Metropolitan Municipality, 2018).
Last Update: 9/07/2021 2
Buffalo City Metropolitan Municipality South Africa
Produced by: Emanti SFD Report
Figure 1. Map of Buffalo City Metropolitan Municipality showing the urban corridor from east to west (Buffalo City
Metropolitan Municipality, 2018)
The main economic sectors in BCMM are community services, finance, manufacturing, trade, and transport. The topography of BCMM area is sea level at the coastal belt to a plateau of 450 m and 850 m above sea level in the north-west. This plateau extends from northern town of Maclean and the centrally located town of Berlin through to Dimbaza in the western portion of BCCM. The most north-westerly region of the BCMM has the Amatole Mountains which reaches 2,100 m above sea level. The BCMM has a topography characterized by a number of incised river valleys that results in hilly tracts of flat land which impacts significantly on settlement patterns and the cost of provision of services within the region (Buffalo City Metropolitan Municipality, 2018). The geological strata of BCMM is typical of the Karoo system. It consists mainly of mudstones and sandstones intruded by dolerite dykes and sills. Dolerite dykes trend from east to west. As the geology is generally of marine origin, the groundwater can have a high salinity. Soils are moderate to deep clayey loams. Erosion risk is recorded as being medium to low (Buffalo City Metropolitan Municipality, 2018). The BCMM climate is moderate for most of the year. Hot summer spells occur from December to February especially in the inland areas. Due to the large geographical area (from coastline to mountainous), the temperature varies according to location with the coastline experiencing subtropical climate. The region primarily records summer rainfall region with the winter months of June and July generally being the driest in the year (Buffalo City Metropolitan Municipality, 2018). BCMM normally receives about 850 mm of rain per year (Eastern Cape Socio Economc Consultative Council, 2017). The rainfall is not evenly distributed in the region with the coastal belt and the north western portion experiencing approximately 1,000 mm of rainfall per annum and rainfall gradually decreasing in a westerly direction to 500 mm per annum (Buffalo City Metropolitan Municipality, 2017) The drainage system of BCMM consists of 10 major river systems and a total of 2,064 wetlands areas. The potential for groundwater extraction in the region is generally not good with low borehole yields (generally below 2 L/s) and high salinity. Greater groundwater potential exists in the north western portion (i.e. Peelton villages) with decreasing potential in a south easterly direction towards the coast (Buffalo City Metropolitan Municipality, 2018).
Last Update: 9/07/2021 3
Buffalo City Metropolitan Municipality South Africa
Produced by: Emanti SFD Report
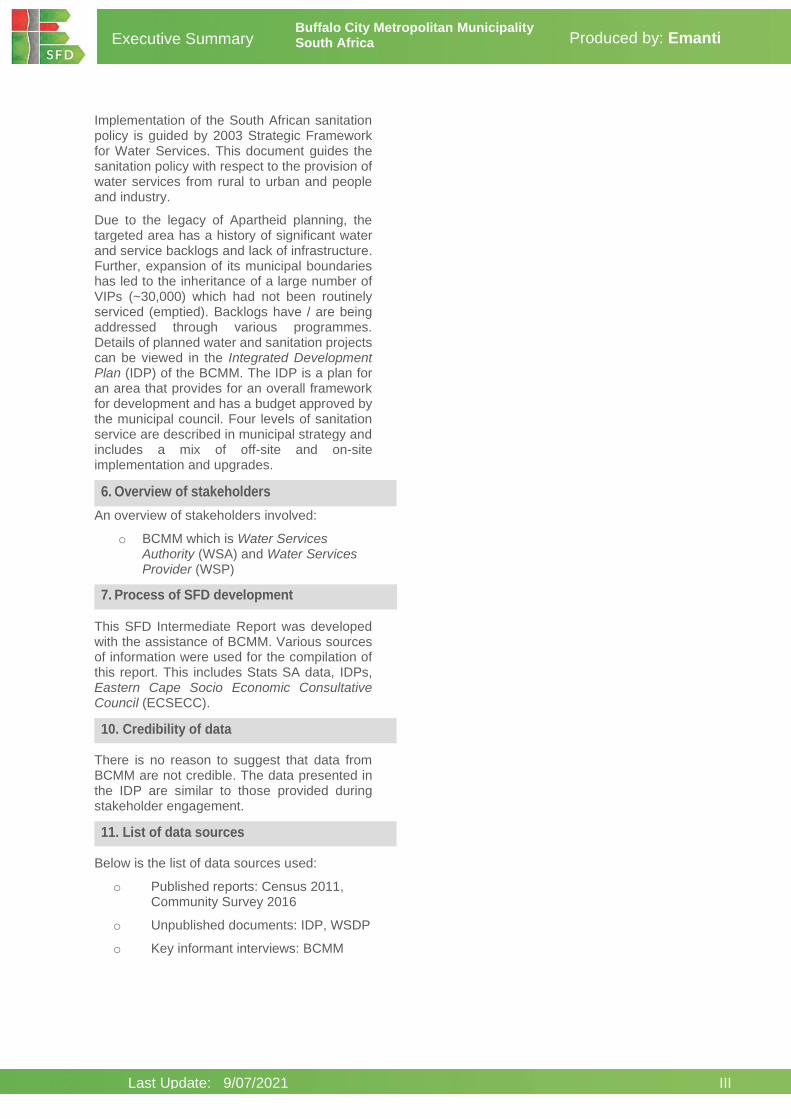
The population size estimated through the 2016 Stats SA Community Survey is 843,997. The increase in municipal boundaries has led to around 20,000 more people within its jurisdiction (Stats SA, 2016; Buffalo City Metropolitan Municipality, 2018). The major urban nodes - East London, Mdantsane and King William’sTown – have the highest population densities in the metropolitan (Figure 2).
Figure 2. Population density in Buffalo City Metropolitan Municipality (Buffalo City Metropolitan Municipality, 2018).
The population density mirrors the urban development corridor from east to west.
The number of households in BCMM were estimated to be 253,477 (Stats SA, 2016). This represents a substantial increase in households from the estimated 234,885 in 2013 (Eastern Cape Socio Economc Consultative Council, 2017). ). In 2015, Buffalo City accounted for 11.7% of the total Eastern Cape population (Buffalo City Metropolitan Municipality, 2017). A population growth rate of 2.1% is noted (Buffalo City Metropolitan Municipality, 2018). The population density is 317.8 people per km2. An estimated 71% of households are considered to be formal, 25% to be informal and 4% considered as traditional households (Stats SA, 2016; Buffalo City Metropolitan Municipality, 2018). There are approximately 30,000 informal settlement structures located in 156 informal settlements within the urban edge of the metropolitan municipality. Duncan Village has the highest density and number of informal settlement structures. In addition, there is an estimated 28,000 backyard shacks located in BCMM (Buffalo City Metropolitan Municipality, 2018). BCMM is a Water Services Authority (WSA) for its area of jurisdiction in terms of the Water Services Act (Act 108 of 1997, Water Services Act) (Republic of South Africa, 1997). It therefore has statutory responsibilities and accountability in terms of legislation and policy with respect to the provision of water services. BCCM provides 4 levels of sanitation service within its jurisdiction:
o Rural – this is mainly VIPs (or equivalent). Alternative sanitation technology options are being investigated to optimise the operation and maintenance implications for BCMM.
o Urban - the level of service for households within the urban edge is as per policy waterborne sanitation and at a minimum level, a VIP (or equivalent). BCMM has noted that bulk sewerage systems are being operated well beyond their design lives and capacity and are in poor condition. This has constrained the city expansion and the limited the housing programme. The environment is under threat from sewage spills and leakages.
Last Update: 9/07/2021 4
Buffalo City Metropolitan Municipality South Africa
Produced by: Emanti SFD Report
o Low Income Housing – Those residing in informal settlements will be moved to formal housing and will receive a Reconstruction and Development Plan (RDP) or higher level of sanitation service.
o Middle & High Income Housing – Bulk waterborne sanitation is preferred option but the municipality noted that there is an estimated funding shortfall ZAR 370 million (Buffalo City Metropolitan Municipality, 2018).
Considering access to basic water and sanitation services, the following is noted (Buffalo City Metropolitan Municipality, 2018):
o Water supply = 99% with the majority having access to piped water (inside dwelling, inside yard or public tap).
o Sanitation (flush toilet, septic tank, chemical toilet, VIP) = 91%. The majority of the BCMM population (159,000 households) relies on flush toilets connected to the sewer.
The table below presents household service levels from 2013 to 2017 (Buffalo City Metropolitan Municipality, 2018). The biggest increase in access to a specific technology type has been VIP latrines.
Table 1. Overview of sanitation service provision from 2013 to 2017 (Buffalo City Metropolitan Municipality, 2018)
Households with basic or above sanitation services
It is important to note that BCMM inherited between 20,000 and 30,000 rural VIPs from the Department of Water and Sanitation (DWS) and Amathole District Municipality (ADM). These systems were installed in the last 10-15 years, are becoming full and require emptying and subsequent Faecal Sludge (FS) disposal. The BCMM has noted that this exercise is not easy due to detritus dumping and the inability to effectively use honeysuckers (vacuum trucks) due to this dumping. The logistic costs have also been noted to high due to long hauls to treatment works to empty collected FS. The metropolitan is looking for suitable dumping sites and will have to be found within close proximity of villages if the clearing of household VIPs are going to be done on a regular basis. Pond systems are also being considered in farm areas away from settlements (Buffalo City Metropolitan Municipality, 2018). BCCM are responsible for the operation and maintenance of number of sanitation systems and related infrastructure (Buffalo City Metropolitan Municipality, 2018). This includes:
o 15 WWTWs o 2,100 km of sewers o 81 Sewer Pump Stations o 83,000 VIPs (note: this figure is higher than the household number as one household
may have more than 1 latrine system in the yard and could include institutional environments e.g. schools) .
Last Update: 9/07/2021 5
Buffalo City Metropolitan Municipality South Africa
Produced by: Emanti SFD Report
2 Service Outcomes Service outcome analysis is based on secondary sources. The following key sources of data are used:
o Stats SA Community Survey (2016) o Draft Integrated Development Plan Review for Buffalo City (2018/2019) o Integrated Development Plan Review for Buffalo City (2017/2018) o ECSECC Socio Economic Review and Outlook for Buffalo City (2017) o Overview of the BCMM Sanitation Division (2018) o IWA Water Balance for Buffalo City (2017/2018) o Buffalo City Tariff Book (2018/2019)
This SFD Intermediate Report has relied on data obtained from BCMM. Water and sanitation project budgets are approved by council based on backlogs and are included in Integrated Development Plans (IDPs) and Water Service Development Plans (WSDPs). Data on emptying and transport is not currently closely monitored and is mostly qualitative in nature.
2.1 Overview This section presents the range of sanitation technologies/infrastructure, methods and services designed to support the management of FS and/or wastewater (WW) through the sanitation services chain in BCMM. The details on the quantitative estimations are presented in the table below and sections that follow.
Table 2: Sanitation technologies and contribution of excreta in terms of percentage of population
No. Sanitation technologies and systems as defined by: SFD reference
variable
Percentage of
population
Buffalo City SFD promotion initiative
1 Toilet flushes directly to sewer
Toilet discharges directly to a centralised foul/separate sewer
T1A1C2 65%
2 Conservancy tanks (concrete all around)
Fully lined tank (sealed), no outlet or overflow
T1A3C10 2.1%
3 Community ablution blocks (replaced chemical toilets)
Fully lined tank (sealed), no outlet or overflow
T1A3C10 1.4%
5 VIPs – lined with cement blocks and open bottom
Lined pit with semi-permeable walls and open bottom
T1A5C10 (low risk GW)
8.9%
6 VIPs – unlined Unlined pit T1A6C10
(low risk GW) 6.7%
7 Not serviced (rural and informal)
No toilet, open defaecation T1B7C10 9.7%
6 Pit latrines – unlined (noted as “no service”)
Pit (all types), never emptied but abandoned when full and covered with soil, no outlet or overflow, where there is a ‘significant risk’ of groundwater pollution
T2B7C10 (high risk GW)
6.5%
Note: T1A3C9 Fully lined tank (sealed), no outlet or overflow connected to don’t know where represents
1,087 households (0.4% of total households), possibly leaking and forms part of T1A3C10 (both fully
sealed concrete tanks -2.1% - and community ablution blocks – 1.4%). As T1A3C9 percentage is less
than 1% it is ignored within the SFD calculations.
Last Update: 9/07/2021 6
Buffalo City Metropolitan Municipality South Africa
Produced by: Emanti SFD Report
2.1.1 Containment There is an extensive sewerage network of approximately 2,100 km, with the off-site formal waterborne sewer system linked to 15 BCMM Wastewater Treatment Works (WWTWs). The remaining areas are reliant on on-site sanitation systems. The following on-site containment systems are generally noted:
o Flush toilet connected to a conservancy tank (concrete); o Community ablution blocks (flush toilets connected to a conservancy tank; replaced
previous use of chemical toilets in specific areas); o VIPs – lined, but open bottom (semi-permeable); o VIPs – unlined (mostly installed before 2012); o Old pit latrines – unlined (noted as “no service”).
Conservancy tanks on individual properties appear to have a capacity of 10 m3. The size of communal conservancy tanks is unknown. It is noted that these conservancy tanks sometimes overflow thereby spilling wastewater into the environment. There are parts of BCMM urban and rural areas where communities use VIP toilets. To-date, few of these VIPs have been emptied and indications from BCMM are that the latrines are filling rapidly. In rural areas, communities are used to covering up and abandoning a full VIP and relocating the VIP to a new location. In the urban context, limited space could prohibit this practice. 2.1.2 Emptying and Transport Vacuum tankers are used to empty and transport wastewater from the conservancy tanks (individual and communal) to specified Buffalo City WWTWs. The BCMM is not aware of manual emptying from conservancy tanks occurring within Buffalo City. The municipality aims to empty all conservancy tanks every 3-6 weeks but sometimes tank (containment) overflows are experienced. There is no money exchanged between the emptier/vacuum truck and the household (part of annual charge or pay upfront at the municipal office and then the service is scheduled and performed). Emptiers are provided with a list of households that they need to service (pre-paid by the household to the municipality before the service is performed). BCMM currently has a fleet of 12 vacuum trucks with 10 vacuum trucks for East London (4 trucks are ~10 years old while 6 trucks are very new) and 2 vacuum trucks for King William’s Town (2 trucks are ~10 years old). All trucks appear to have a capacity of 6 m3. Considering this, the following is noted:
o Household conservancy tanks: o 5,437 households are serviced by conservancy tanks. o It could be therefore assumed that there are approximately 5,437 conservancy
tanks. o Community Ablution Block conservancy tanks
o An estimated 3,544 households are serviced by community ablution blocks. o Assuming 10 households are serviced by a community ablution block, it could
be assumed that there are approximately 355 conservancy tanks. o Combining the two figures above, we could therefore have approximately 5,800
conservancy tanks (5,437 + 355 = rounded to 5,800).
Last Update: 9/07/2021 7
Buffalo City Metropolitan Municipality South Africa
Produced by: Emanti SFD Report
o If each tank is emptied every 3-6 weeks, it means that all tanks are emptied every 15-30 days (assuming no service on the weekend). This equates to some 193-386 tanks that need to be emptied per day. This implies that for the fleet of 12 vehicles, each vehicle needs to empty approximately 16-32 households per day or 2-4 per hour for an 8-hour working day.
o BCMM have indicated that a vacuum truck routinely delivers 8-10 loads per day, this representing 4 – 5 households for the day.
o If all 12 trucks are in good working condition, this implies that approximately 48-60 tanks will be emptied in a day (i.e., 15-25% of the required amount). This implies that unless wastewater generation is significantly less than anticipated or if vacuum trucks of private operators are very active, regular overflows into the environment could be anticipated.
Vacuum trucks are mostly servicing the urban areas of Buffalo City. Some of the vacuum trucks are municipal owned/run while it is known that other private operators do exist and might be servicing the likes of Department of Public Works or Department of Education. Although the BCMM policy states that a municipal vacuum tanker must be used, BCMM do not currently have any control over private tankers who largely operate in the peri-urban/rural areas of BCMM. Although some private vacuum tanker operators are recorded on the municipal database, the actual number and sizes of vehicles are currently unknown. BCMM have an existing 3-year contract with 5 service providers who are able to assist with providing a service in an emergency (i.e., supply chain management can mobilise quickly). There is currently very little monitoring and management of vacuum truck emptying (i.e., don’t have a system in place to record arrival of trucks at WWTWs), and monitoring at point of discharge to the WWTWs does not appear to be occurring (i.e. do emptiers actually deliver collected sludge to the designated discharge points?). Despite this, it is noted that from a municipal perspective, as municipal officials operate the vacuum trucks, they assume they do deliver at WWTWs/specific discharge points (e.g., pump station, pond system, inlet works, into sewer at a specified manhole) as these officials will not be turned away at the WWTWs, and therefore have no reason to not discharge correctly at the WWTWs. Furthermore, the distance to travel from conservancy tanks to the discharge point is relatively short (~10 km). However, as emptiers are salaried staff, there does not seem to be an incentive to manage time efficiently. BCMM inherited between 20,000 and 30,000 VIPs from the DWS and Amathole District Municipality (ADM) spread throughout the rural areas. All these were installed in the last 10-15 years and are becoming full and need cleaning out. BCMM have appointed private contractors to assist with emptying of VIPs. BCMM vacuum trucks are not used for rural sanitation and private contractors need to supply their own vehicles as part of their contract of appointment with BCMM. Although necessary checks of vehicle safety (e.g. roadworthy test) are done, monitoring of service provider adherence to safety requirements (e.g. use of PPE) is not really performed. Regarding pit emptying, where sludge is fluid enough, this is sucked up via vacuum truck; where sludge is thicker, fluid is sometimes added but it is noted that there is always a large volume of solids (including detritus) in the pits and that vacuum pipes often block, and forks are need to manually unblock these. Unbiodegradable solids (detritus) collected from pit emptying are collected in a bag and taken to landfill for disposal. The experience gained in clearing out VIPs has shown that it is not an easy operation as all kind of foreign material is deposited into the pits. The content is normally quite solid and cannot
Last Update: 9/07/2021 8
Buffalo City Metropolitan Municipality South Africa
Produced by: Emanti SFD Report
be removed by vacuum tanker unless water is added and then mixed. Even then problems occur as detritus (plastic packets or bottles and lumps of newspaper) clog the hoses. Disposable nappies appear to be a significant problem in the municipality. They are both found in VIPs and from flushing; clogging smaller pipes with the sewer network. In addition to mechanical emptying of VIPs, some manual VIP emptying is necessary for < 5% of VIPs (i.e., difficult for a truck to reach certain areas). Although there are 11 municipal drivers (10 in East London and 1 for King William’s Town) with 2 assistants per driver (i.e., total of 33 people) that are able to perform manual emptying, there are only 2 utility vehicles (bakkies) for this purpose. BCMM have therefore appointed a service provider to assist with manual VIP emptying. VIP contents are emptied to a bin (25 L or 50 L containers with closed lids) with transportation via a utility vehicle (bakkie). The disposal of the VIP contents once in the vacuum truck remains a significant challenge. Currently, vacuum trucks have to drive long distances to WWTWs to empty. The BCMM is considering purchasing nearby farmland for disposal and treatment of faecal sludge in pond systems. Details of the proposed and estimated budget can be viewed in the municipal IDP and are summarised below (Buffalo City Metropolitan Municipality, 2018):
o ZAR 25 million would be required for the suggested 5 pond systems (R5 million per pond system), and
o ZAR 7.5 million would be required for an additional 10 VIP emptying vehicles such as vacuum tankers or tractor/trailer combinations (ZAR 0.75 million per vehicle).
It is noted that the VIPs appear to be filling up quickly and although BCMM are committed to emptying and maintaining VIPs on a 5-year cycle, they are currently behind. As no site inspection was performed to confirm the aforementioned aspects, it is difficult to further elaborate on the emptying/transport/discharge process. The typical skills/capacity/training of the team, use of safety equipment, etc. is therefore currently unknown. In addition to the above, the Sanitation Department is responsible for the operation and maintenance of 2,100 km of sewers and 81 Sewer Pump Stations. It was noted that the sewer systems in BCMM are being operated well beyond their design lives, are in need of repair and are operating at capacity. In particular, it is noted that the useful life remaining of the sewer pipe system is approximately 3 years (Westerberg, 2018). It is estimated that the deferred maintenance to sewer network / infrastructure is in the region of ZAR 15 million per annum (Westerberg, 2018). Full estimated costs for upgrade, refurbishment and budgets allocated can be viewed in section 3.3 and in the municipal IDP (Buffalo City Metropolitan Municipality, 2018). 2.1.3 Treatment and Disposal There are15 WWTWs in the BCMM jurisdiction (see figure below). The average combined wastewater flow into the 15 WWTWs is approximately 108 ML/day (rounded figure).
Last Update: 9/07/2021 9
Buffalo City Metropolitan Municipality South Africa
Produced by: Emanti SFD Report
Figure 3: Buffalo City Wastewater Treatment Works (WWTWs) and estimated flows (Buffalo City Metropolitan Municipality, 2018)
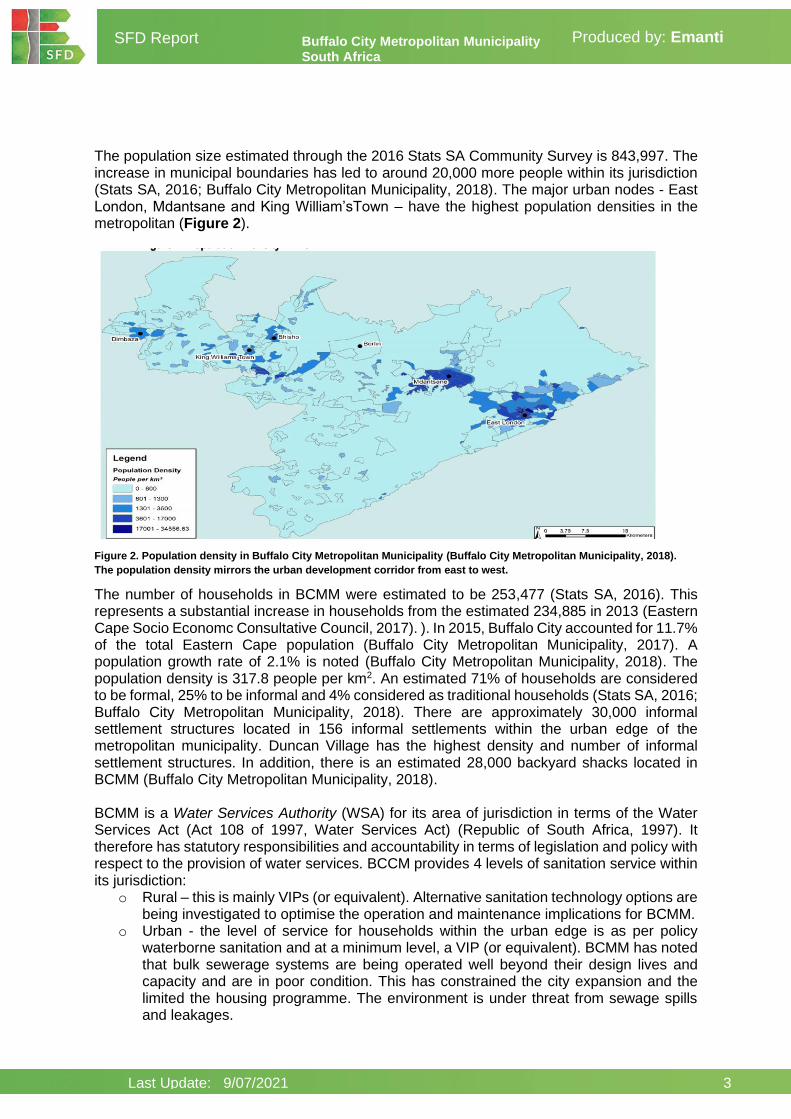
Currently, there is no beneficial use of sludge and most sludge is either stockpiled on-site at WWTWs or discharged to sea. Landfill sites are, however, filling up and reuse is becoming necessary. For beneficial re-use, BCMM needs an appropriate viable market for sludge related products. Although farming occurs within BCMM, there is insufficient intensive agriculture for this to be viable. In addition, although incineration is practiced at De Gama, the sludge has a low calorific value and is therefore not ideal for these purposes. As part of their sludge management strategy, BCMM are investigating various options for advancing sludge management including a coastal regional site for sludge management, use of sludge drying beds, windrow, etc. the ability to implement proposed actions are dependent on the sludge quality (and associated compliance), the acceptability of the sludge for its intended use (marine outfall, agricultural use, etc), and the sustainability of such operations (e.g. market exists and financially viable) (Figure 4). Proposed sludge disposal and / or beneficiation practices can be viewed in Figure 5.
Last Update: 9/07/2021 10
Buffalo City Metropolitan Municipality South Africa
Produced by: Emanti SFD Report
Figure 4: Overview of BCMM sludge management strategy
Figure 5: BCMM sludge management - current practices vs. versus proposed practices
As no site inspection was performed to confirm the aforementioned aspects, it is difficult to
further elaborate on the status of treatment and disposal.
Buffalo City Metropolitan Municipality South Africa
Produced by: Emanti SFD Report
2.1.4 Human resources It is noted that within Water and Sanitation services in BCMM, 611 posts are filled while 258 posts are vacant and/or unfunded (Westerberg, 2018). This could indicate potential gaps with fulfilling all required sanitation services functions/tasks.
2.2 SFD Matrix Error! Reference source not found. presents the SFD Matrix for data collected from ADM in 2018. A description of the assumption used in the SFD Matrix are presented in the following sections. 2.2.1 Off-site sanitation According to municipal records, 65% (rounded figure) of the population are serviced via off-site sanitation (T1A1C2 = 65% on Table 3) and connected to the 15 BCMM WWTWs. This percentage is similar to that reported in the municipal IDP 2018/2019 [(159,000 households served by flush toilets connected to sewers ÷ 253,477 total number of households) x 100 = 63% ] (Buffalo City Metropolitan Municipality, 2018).
Table 3: SFD Matrix for BCMM (2018).
Last Update: 9/07/2021 12
Buffalo City Metropolitan Municipality South Africa
Produced by: Emanti SFD Report
Transport In order to determine the proportion of wastewater in sewer system that is actually delivered to centralised WWTWs, it needs to be noted that the existing sewer systems in BCMM are well beyond their design lives and in poor condition with a weighted average life remaining of approximately 3 years. It is therefore anticipated that leakage will occur. The BCMM has indicated that it would be around ZAR 1 billion to undertake the necessary steps to ensure functionality and efficiency of the sewer system and associated infrastructure (Buffalo City Metropolitan Municipality, 2018). More details on this can be seen in section 3.3. To estimate the leakage in the sewer network, this SFD Intermediate Report has used the following assumptions:
o Considering the IWA Water Balance for BCMM, the System Input Volume (SIV) is approximately 66 million kl/annum (or ~180 ML/day).
o If we assume that 70% of the water supply will enter the sewerage system (i.e. ~126 ML/day), and if there was no leakage, we would expect the same quantity at the WWTWs (i.e. ~126 ML/day).
o Currently, the BCMM 15 WWTWs are receiving and treating ~107 ML/day. o The calculated leakage within the sewer network is therefore approximately 18% ((126
– 107) / 107 = 18%), and this proportion of wastewater is therefore not delivered to the WWTWs. It is therefore estimated that 82% of wastewater is delivered to the centralised WWTWs for treatment (W4a = 82% on Table 3).
Treatment Once the wastewater reaches the WWTWs, it is treated to meet specified requirements. Considering the various flows per WWTW and associated overall effluent compliance per WWTW, an overall flow weighted compliance of 90% is noted (see table below), as shown on Table 3.
Last Update: 9/07/2021 13
Buffalo City Metropolitan Municipality South Africa
Produced by: Emanti SFD Report
Table 4: Effluent compliance for BCMM WWTWs
No. Wastewater Treatment Works (WWTW)
Flow (ML/day)
Overall Effluent
compliance (%)
1 East Bank Sea Discharge 40.0 99%
2 Gonubie 18.0 84%
3 West Bank 40.0 95%
4 Central 5.0 77%
5 Reeston 12.5 93%
6 Mdantsane 24.0 79%
7 Potsdam 9.0 82%
8 Berlin 1.0 84%
9 Zwelitsha 9.3 80%
10 Dimbaza 7.0 90%
11 Scornville 6.0 86%
12 Breidbach 0.8 73%
13 Bhisho 0.8 76%
Total 173.4 90%
NOTE: Information to be still verified
o Results only obtained for 13 WWTWs o Keyzers Beach – do the ponds have no discharge/not monitored? o Kidds Beach – do the ponds have no discharge/not monitored?
o Capacities for some differ from that previously provided?
o Gonubie – has been upgraded from 6 to 18 ML/day with flow from Central WWTW (decommissioned ) diverted to Reeston WWTW
o Reeston – in process of being upgraded from 2.5 vs 10 ML/day o Schornville WWTW and Breidbach and Bisho Ponds to be decommissioned and
all effluent diverted to a Regional WWTW situated at Zwelithsa WWTW. Construction of pipeline underway from Schornville (Buffalo City Metropolitan Municipality, 2018).
Sludge compliance still needs to be determined.
o Sludge compliance o Information for all 15 WWTWs
Last Update: 9/07/2021 14
Buffalo City Metropolitan Municipality South Africa
Produced by: Emanti SFD Report
o According to categorisation of sludge – due to lack of guidance on SFD manual regarding this, the project team suggested the following considerations:
▪ Acceptable for “intended use without further treatment/action” o Marine outfall – used as is, and can continue (what
proportion of total is categorised as such) o Agricultural use – need to treat before beneficial use of
sludge (what proportion of total is categorised as such) o The table as an example below would be compiled:
Table 5. Example of table that would be used for sludge categorisation
Plant Sludge quantity (kg/day)
Acceptable for “intended use without further
treatment/action”?
Sludge quantity that is acceptable
(kg/day)
“compliance” (%)
A 10 Yes 10 100%
B 5 Yes 5 100%
C 20 No 0 0%
Total 35 15 Sludge mass weighted
compliance = 15 / 35 = 43%
2.2.2 On-site sanitation Containment There an estimated 5,437 household conservancy tanks in BCMM (T1A3C10 - sealed, fully lined). An estimated 80% (4,350) are considered to be in good condition (i.e., sealed, not leaking). Around 20% (1,087) are considered to require attention (i.e., T1A3C9 - possibly leaking to environment but don’t know where). The latter figure represents a small number in terms of population [(1,087 ÷ 253477) x 100%) = 0.42% of the total population]. As this percentage is less than 1% it is ignored within the SFD calculations. This SFD Intermediate Report has nonetheless included this figure in the SFD Matrix presented in Error! Reference source not found. as it represents a sizeable number that needs further investigation as part of public health and environmental safety. The accumulated sludge from these systems also requires periodic emptying. Chemical toilets (3,544) as noted by 2018/2019 municipal IDP and the 2016 Stats SA Community Survey (estimated to be 4,000) have been replaced my communal ablution blocks connected to a conservancy tank (T1A3C10). As these structures are relatively new, it is assumed that 100% (3,544) are in good condition (i.e. sealed, not leaking). Noting the assumptions above, the following calculations were used:
o Total of number of conservancy tanks in good condition: 4,350 + 3,544 = 7,894 (T1A3C10 = 3.1% of total households)
Last Update: 9/07/2021 15
Buffalo City Metropolitan Municipality South Africa
Produced by: Emanti SFD Report
o Total of number of conservancy tanks that could be possibly leaking = 1,087 (T1A3C9 = 0.4% of total households).
o Total number of conservancy tanks = 8,981 (3.5% of total). It is assumed that 50% of the faecal sludge is emptied from conservancy tanks by vacuum trucks (i.e. 4,490). It is assumed that 100% of the faecal sludge emptied from these conservancy tanks is delivered to the WWTWs where it is treated to 90% compliance.
Of the total 39,536 VIPs, 17,000 are unlined and were constructed pre-2012 (T1A6C10 = 7% on Table 3), while 22,536 are lined with cement blocks and have an open bottom (T1B7C10 = 6% on Table 3). Emptying and transport BCMM have indicated that the intention is to empty VIPs every 5 years. BCMM note that they currently face an emptying backlog related to their VIPs. When VIPs are full, it is noted that households either find other means (e.g. open defaecation, sharing facilities) or reuse old pit latrines. It is also estimated that 50% of VIPs are full or close to full. Therefore, although BCMM acknowledge that they should be emptying approximately 4,000 VIPs/annum, they are currently only emptying around 500 VIPs/annum. It is therefore assumed that the proportion of this type of system from which faecal sludge is emptied is 12.5% (500/4,000 = 12.5% rounded to 13% = F3 for T1A5C10 and T1A6C10 on Table 3) It is assumed that 100% of the faecal sludge from these VIPs is delivered to the WWTWs (F4 = 100% for T1A5C10 and T1A6C10 on Table 3). In addition, there are 16,444 unlined pit latrines in rural communities. As these communities have been self-reliant for many years, and as there should be sufficient space in the rural environment for locating a new pit, it is assumed that 100% (16,444) of these unlined pit latrines are properly covered when the pit is full and moved (T1B7C10 = 6% on Table 3). As groundwater use is not feasible in large parts of BCMM and therefore not widely utilized, the risk of groundwater contamination is rated as ‘low risk’. It is, however, noted that some communities are reliant on groundwater, and this could be indicated as significant risk. As noted above, since alternative points for discharge of faecal sludge do not appear to be feasible, it is assumed that all of the faecal sludge emptied from the conservancy tanks is delivered to the WWTWs with no illegal dumping (F4 = 100% for T1A3C10 on Table 3). Treatment Since data on sludge compliance could not be obtained, the SFD calculations are based on effluent compliance. Therefore, for the purposes of the SFD Report, it is estimated that 90% of the sludge delivered to treatment is treated to specified requirements (F5 = 90% on Table 3). See section 2.3.1 for further details. 2.2.3 Open defecation Currently, 24,718 households are not serviced (i.e. ~10%). This is considered the sanitation backlog and needs to be addressed. As BCMM do not know the sanitation practices for these households, it is assumed that current sanitation practices are unsafe,
Last Update: 9/07/2021 16
Buffalo City Metropolitan Municipality South Africa
Produced by: Emanti SFD Report
and that open defaecation is occurring. The percentage used in this SFD is similar to that reported in the municipal IDP (9%) (Buffalo City Metropolitan Municipality, 2018). 2.2.4 Risk of groundwater contamination With respect to groundwater contamination, potable water for urban areas of Buffalo City is supplied from either the 2 BCMM owned drinking-water treatment plants or from the Amatola Water Board drinking-water treatment plants. Water is supplied via pipeline to households with the majority of households either receiving water via household taps or yard connections. As previously discussed, the groundwater potential in the region is generally not good. Although some rural areas that BCMM inherited from the Amathole DM are still using groundwater resources (with little/no treatment and protection), BCMM is phasing this out (i.e. move to piped water supply). Therefore, although groundwater is not presently being used in large parts of BCMM, climate change impacts and the increasing water scarcity facing many parts of South Africa and the Eastern Cape should be considered and use thereof in the future should not be discarded. As such groundwater should be protected as far as practically possible. Any sanitation systems that are overflowing (e.g. old, damaged tanks, blocked sewerage lines) and that could pollute the environment (and possibly contaminate drinking-water treatment plant raw water sources and compromise the drinking-water supply) should be rectified as soon as possible. There is a need to create awareness among BCMM citizens about the need to ensure that conservancy tanks are well maintained, disposal of detritus in toilets, pit latrines/VIPs are adequately sealed when closed/moved/new pit dug, and of the effects of using polluted water. 2.2.5 Data assumptions The SFD graphic was developed in 2018 for BCMM. Data for the SFD Matrix and subsequent SFD graphic was obtained from BCMM. The BCMM Sanitation Department was able to provide information regarding upgrades to chemical toilets that is not described in the statistics reported in the municipal IDP or Stats SA data sources.
2.3 SFD Graphic
Based on the above data, estimates and assumptions, the SFD graphic illustrates that 73% of
excreta is safely managed in BCMM (Error! Reference source not found.).
Last Update: 9/07/2021 17
Buffalo City Metropolitan Municipality South Africa
Produced by: Emanti SFD Report
Figure 6. SFD Graphic for Buffalo City Metropolitan Municipality (2018).
The majority of the BCMM population utilise off-site sanitation systems (65% off-site sanitation on Figure 6), a quarter of the population use on-site sanitation and 10% practice open defecation.
Two-thirds of the safely managed sanitation is wastewater delivered to and treated at the
treatment plants (48% WW treated on Figure 6). The majority of the safely managed onsite
sanitation is from the 21% of the total population using VIPs and unlined pits which, when full,
are not emptied but closed, covered and replaced with a new facility. Only 3% of safely
managed excreta is faecal sludge that has been emptied from tanks and transported for
treatment at the WWTW.
An estimated 27% of the excreta from the total population is not safely managed. Roughly a
third of this (10%) is from open defecation, while just over two-fifths (12% on Figure 6) is
wastewater which is not delivered to treatment due to leakage from the sewer system.
Wastewater and faecal delivered to treatment but not treated accounts for the balance (1%
FS not treated, and 5% WW not treated on Figure 6).
Last Update: 9/07/2021 18
Buffalo City Metropolitan Municipality South Africa
Produced by: Emanti SFD Report
3 Service delivery context This section provides the service delivery context.
3.1 Policy, legislation and regulation This section provides an overview of policy, legislation and regulation related to sanitation services. Constitution of the Republic of South Africa (1996) Section 24(a), Bill of Rights in the Constitution states that “everyone has a right to an environment that is not harmful to their health or well-being” and 24(b) “to have the environment protected, for the benefit of present and future generations, through reasonable legislative and other measures that (i) prevent pollution and ecological degradation, (ii) promote conservation; and (iii) secure ecologically sustainable development and use of natural resources while promoting justifiable economic and social development.” (Constitution of the Republic of South Africa, 1996) Section 27(1)(b) of the Bill of Rights in the Constitution states that “everyone has the right to have access to sufficient food and water”. Section 27(2) tasks the state to “take reasonable legislative and other measures, within its available resources, to achieve the progressive realisation” to ensure access to basic water supply (Constitution of the Republic of South Africa, 1996) These clauses have often been interpreted as implying a right to basic sanitation for all. Water and sanitation are intrinsically linked. All spheres of government are tasked with the responsibility to ensure that these basic water supply and sanitation services are provided. Water Supply and Sanitation Policy (1994) With democracy in 1994, the newly formed Department of Water Affairs and Forestry (DWAF) - subsequently renamed the Department of Water Affairs (DWA) and then more recently DWS – developed the White Paper on Water Supply and Sanitation Policy (1994). The White Paper provided the institutional framework for water and sanitation services which was subsequently legislated in the Water Services Act (1997) (Tissington, 2011). The White Paper noted that full waterborne sewerage was not technically feasible and that VIPs, if constructed to agreed standards and maintained properly, would provide an appropriate and adequate basic level of sanitation service. Thus, a well-constructed VIPs would be classified as an adequate basic provision (Department of Water Affairs and Forestry, 1994). Policy principles from this documented were mirrored in the later White Paper on Basic Household Sanitation (2001) (Tissington, 2011). National Sanitation Policy (1996) The National Sanitation Policy of 1996 defines sanitation as “the principles and practices relating to the collection, removal or disposal of human excreta, refuse and waste water, as they impact upon users, operators and the environment.” This White Paper was developed by the National Sanitation Task Team as a policy document that is complemented by an implementation strategy (National Sanitation Task Team, 1996). The 1996 National Sanitation
Last Update: 9/07/2021 19
Buffalo City Metropolitan Municipality South Africa
Produced by: Emanti SFD Report
Policy followed the 1994 White Paper on Water Supply and Sanitation Policy. The document noted that sanitation is more than building toilets and includes behavioural aspects including hygiene and community involvement. The document noted that the provision of household sanitation is the responsibility of the householders. Local government plays a role to help make this possible with support from provincial and national government spheres. The document listed the main types of sanitation systems used in South Africa and provided criteria for implementation. Bucket toilets and traditional pit toilets (without ventilation and fly screen) were not considered appropriate sanitation. The minimum acceptable level of basic sanitation stated by the then DWA (now DWS) is the VIP latrine (National Sanitation Task Team, 1996). Water Services Act (1997) The Water Services Act (Act 108 of 1997) is the primary law relating to the provision of water services including sanitation supply to households and other municipal users. Section 3 of the Water Services Act of 1997 states that: “(1) Everyone has a right of access to basic water supply and basic sanitation. (2) Every water services institution must take reasonable measures to realise these rights. (3) Every water services authority must, in its water services development plan, provide for measures to realise these rights. (4) The rights mentioned in this section are subject to the limitations contained in this Act”. Basic sanitation is defined in the Water Services Act of 1997 as: “the prescribed minimum standard of services necessary for the safe, hygienic and adequate collection, removal, disposal or purification of human excreta, domestic waste water and sewage from households, including informal households” The 1997 Water Services Act defined the role of WSAs and other water institutions such as WSPs and water boards. According to section 12, WSAs are obliged to prepare and adopt a WSDP for its areas of jurisdiction. The WSDP shall also prioritise and include how the WSA intends of improving access to basic water and sanitation services should it not be able to deliver on these obligations: “Every draft water services development plan must contain details: (a) of the physical attributes of the area to which it applies; (b) of the size and distribution of the population within that area; (c) of a time frame for the plan. including the implementation programme for the following
five years; (d) of existing water services; (e) of existing industrial water use within the area of jurisdiction of the relevant water services
authority: (f) of existing industrial effluent disposed of within the area of jurisdiction of the relevant
water services authority; (g) of the number and location of persons within the area who are not being provided with a
basic water supply and basic sanitation; (h) regarding the future provision of water services and water for industrial use and the future
disposal of industrial effluent. including— i. the water services providers which will provide those water services;
Last Update: 9/07/2021 20
Buffalo City Metropolitan Municipality South Africa
Produced by: Emanti SFD Report
ii. the contracts and proposed contracts with those water services providers; iii. the proposed infrastructure necessary; iv. the water sources to be used and the quantity of water to be obtained from and
discharged into each source; v. the estimated capital and operating costs of those water services and the financial
arrangements for funding those water services, including the tariff structures; vi. any water services institution that will assist the water services authority; vii. the operation, maintenance, repair and replacement of existing and future
infrastructure; (i) of the number and location of persons to whom water services cannot be provided within
the next five years setting out – i. the reasons therefor: and ii. the time frame within which it may reasonably be expected that a basic water supply
and basic sanitation will be provided to those persons; and (j) of existing and proposed water conservation, recycling and environmental protection
measures” Notice is expected to be given to municipal users of the drafting of the WSDP with the draft expected to undergo stakeholder consultation and therefore sent to the Minister, the Province and neighbouring WSAs. Municipalities also have to develop an IDP to organise and budget for its development plans for its area of jurisdiction. The IDP is done in conjunction with various stakeholders including the municipality, councillors, communities and national and provincial sector departments which be affected at any stage of the plan. The WSDP must form part of the municipality’s IDP and it is expected that WSAs report on its implementation during each financial year (Republic of South Africa, 1997). The National Water Act (1998) The National Water Act (Act 36 of 1998) (NWA) defines how water resources are protected, used and managed. Amendments to the Act have been undertaken in 1999 (Act 45) and 2014 (Act 27). The Act governs how wastewater may be returned to the environment and the requirement of a Water Use Authorisation (Section 40) for the disposal of sewage sludge and thus faecal matter. Furthermore, the Act might require a General Authorisation for the application of sludge if this is not part of the WWTW Water Use License (National Water Act 36, 1998). Municipal Systems Act (2000) The Municipal Systems Act 32 (2000) provides the framework to enable municipalities to: achieve development targets and ensure universal access to essential services that are affordable to all. The Act defines what is a municipality and defines it role. It further indicates how services may be undertaken through a local municipality or district municipality and the procedures required to do so (Act 33 of 2000). Municipalities are obliged to develop and adopt an IDP. Th IDP forms the policy framework and basis by which budgets are developed. Municipal planning has to be developmentally oriented. Section 26 of the Municipal Systems Act (2000) states:
Last Update: 9/07/2021 21
Buffalo City Metropolitan Municipality South Africa
Produced by: Emanti SFD Report
“An integrated development plan must reflect— (a) the municipal council’s vision for the long term development of the municipality with
special emphasis on the municipality’s most critical development and internal transformation needs;
(b) an assessment of the existing level of development in the municipality, which must include an identification of communities which do not have access to basic municipal services;
(c) the council’s development priorities and objectives for its elected term, including its local economic development aims and its internal transformation needs;
(d) the council’s development strategies which must be aligned with any national or provincial sectoral plans and planning requirements binding on the municipality in terms of legislation;
(e) a spatial development framework which must include the provision of basic guidelines for a land use management system for the municipality;
(f) the council’s operational strategies; (g) applicable disaster management plans; (h) a financial plan, which must include a budget projection for at least the next three years;
and (i) the key performance indicators and performance targets determined in terms of
section 41”.
Each district municipality, within a prescribed period after the start of its elected term and after
following a consultative process with the local municipalities within its area, must adopt the IDP.
The IDP will remain in effect until a new IDP is adopted by the next elected council (Republic
of South Africa, 2000).
White Paper on Basic Household Sanitation (2001) The White Paper on Basic Household Sanitation aimed to improve on National Sanitation Policy of 1996 and incorporated the knowledge gained in actual implementation of the sanitation programmes since then. The White Paper articulated the Government policies on sanitation, highlighted the impact sanitation of the public and provide a framework for the implementation and monitoring of sanitation programmes with greater coherence and co-ordination amounts different spheres of government (Department of Water Affairs and Forestry, 2001). The focus of the policy was on the provision of basic sanitation facilities to mostly rural and informal settlements. The principles to guide the policy and intervention strategies as stated in the White Paper: “
1. Sanitation improvement must be responsive to the demands of the people and supported by an intensive Health and Hygiene Programme. Household sanitation is first and foremost a household responsibility. For users to benefit maximally, they must also understand the link between their own health, good hygiene and toilet facilities.
2. Community participation Communities must be fully involved in projects that relate to their health and wellbeing, and also in decisions relating to community facilities such as schools and clinics. Communities must participate in decision making about what should be done and how;
Last Update: 9/07/2021 22
Buffalo City Metropolitan Municipality South Africa
Produced by: Emanti SFD Report
must contribute to the implementation of the decisions and must share in the benefits of the project or programme.
3. Integrated planning and development The health, social, and environmental benefits of improved sanitation are maximised when sanitation is planned for and provided in an integrated manner along with water supply and other municipal services.
4. Sanitation is about environment and health Sanitation improvement must be accompanied by activities promoting health, hygiene and the environment.
5. Basic sanitation is a human right Government has an obligation to create an enabling environment through which all South Africans can gain access to basic sanitation services.
6. To provide access to sanitation services. Local government has the constitutional responsibility to provide sanitation services.
7. Access to sanitation for all Those with the greatest health risk due to poor sanitation must be assisted first.
8. Equitable regional allocation of development resources The limited national resources available to support the incremental improvement of sanitation services should be equitably distributed throughout the country according to population, level of development, and the risk-to-health of not supporting sanitation improvement.
9. Water has an economic value The way in which sanitation services are provided must take cognisance of the growing scarcity of good quality water in South Africa.
10. Polluter pays principle Polluters must pay for the cost of remediation of the effects on the environment of the pollution they create.
11. Sanitation services must be financially sustainable. Sanitation services must be sustainable both in terms of capital (input) costs and recurrent (ongoing service) costs.
12. Environmental integrity The environment must be protected from the potentially negative impacts of badly designed sanitation systems” (Department of Water Affairs and Forestry, 2001).
The strategic interventions include many aspects including community participation, health and hygiene awareness education, adopting environmental management in approach, upgrading of facilities, utilising common approaches including technical options for implementation and undertaking specific programmes for eliminating backlogs (Department of Water Affairs and Forestry, 2001). The IDPs as seen as the mechanism for prioritisation and co-ordination of service delivery. The White Paper stated that the IDPs must contain at least the following:
o the existing service levels available to households; o proposed new service levels per household; o health and hygiene education to be provided; o the estimated capital and recurring costs of providing these services; o the cost to households for service payments; o the availability of grant funding; o the implications for the overall municipal budget; and o how the service impact of the investment will be measured and monitored.
Last Update: 9/07/2021 23
Buffalo City Metropolitan Municipality South Africa
Produced by: Emanti SFD Report
In 2001, the DWAF produced a summary of the 2001 White Paper on Basic Household Sanitation (Department of Water Affairs and Forestry, Sanitation for a Healthy Nation: Summary of the White Paper on Basic Household Sanitation). The document showed the linkage between the IDP, WSP and the Sanitation Plan for a municipality. The WSDP is a component of the IDP and the universal sanitation coverage of at least a minimum basic level of sanitation by the target date is a requirement of the policy and must be committed to in the IDP.
Figure 7. Interlinking of the IDP, WSDP and Sanitation Plan (Department of Water Affairs and Forestry, Sanitation for a
Healthy Nation: Summary of the White Paper on Basic Household Sanitation)
Strategic Framework for Water Services (2003) The 2003 Strategic Framework for Water Services was approved by Cabinet in September 2003 to address the challenges in water and sanitation sector since democracy in 1994 and the adoption of new legislation since. The framework was developed through a consultative process involving the Department of Provincial and Local Government (DPLG), the South African Local Government Association (SALGA) and the South Africa Association of Water Utilities (SAWU). The framework was devised to guide the water sector with policies, legislation and strategies aligned and the framing of 7 sector goals, including that all citizens in South Africa must have access to appropriate, acceptable, safe and affordable basic water and sanitation supply. Eliminating the backlog was a key theme and the target at the time of the framework was to exceed to Millennium Development Goals (Department of Water Affairs and Forestry, 2001). National Sanitation Strategy (2005) The National Sanitation Strategy of 2005 was prepared through the DWAF and the National Sanitation Task Team. The strategy incorporates the strategies of other stakeholders including SALGA and the Provincial Sanitation Task Teams. The vision of the strategy was to co-ordinate resources at all government spheres to achieve universal sanitation by 2010. The strategy builds upon the 2003 Strategic Framework for Water Services and sought to increase priority and resources in sanitation implementation programmes by local authorities. The strategy examines various aspects of the delivery of sanitation including current bottlenecks and makes proposals for accelerating the delivery in order to meet the 2010 national target. The sanitation strategy states that no sanitation systems lower than a VIP latrine should be implemented and
Last Update: 9/07/2021 24
Buffalo City Metropolitan Municipality South Africa
Produced by: Emanti SFD Report
that bucket toilets should be eradicated with the WSA having the key responsibility of sanitation delivery. The WSA is required to develop a Free Basic Sanitation programme (Department of Water Affairs and Forestry, 2005). Free Basic Sanitation Implementation Strategy (2008) The 2003 Free Basic Sanitation Implementation Strategy was developed to guide WSAs in the implementation of the National Free Basic Sanitation Policy. The DWAF acknowledged that the 2010 target of universal sanitation access would not be achieved given the challenges faced by WSAs in sanitation service delivery. A revised target of 2014 was set and in line with the Department of Housing target of all citizens having access in 2014. The definition of Basic Sanitation remained unchanged from the 2003 Strategic Framework for Water Services. The strategy adopts the principles that national guidelines should be implemented by local conditions and choice allowing flexibility in the implementation approach. Community participation is as seen as key aspect for long-term success. The primary intended beneficiaries of the strategy are poor households with the most practical indicator of poverty being household expenditure. The document provides guidance of the term free basic sanitation and noted that whole national policy is to provide free basic sanitation to the poor, many WSAs are financially constrained and in such cases, they may pace cap on the free basic sanitation grant and require beneficiaries to contribute in cash or kind. However, citizens should no receive sanitation facilities below the basic minimum level and should be included the WSAs Free Basic Sanitation Policy (Department of Water Affairs and Forestry, 2008). National Sanitation Policy (2016) The DWS (renamed in 2014) developed the 2016 National Sanitation Policy through a consultative process. The document provides policy positions to address the policy gaps and challenges as indicated through the stakeholder consultation process. It also includes country’s new national and international development imperatives. The document adopts many of the strategic policy positions outlined by the 2003 Strategic Framework for Water Services.
3.2 Planning The BCMM has backlog figures noted in its municipal IDP. The current percentage of the population that does not sanitation services below a minimum service level is 8.8% (Buffalo City Metropolitan Municipality, 2018). The BCMM plans to develop a WSDP starting in 2020/2021 through ZAR 700,000 of its own funds (Buffalo City Metropolitan Municipality, 2018). Budget allocations and total estimated funding requirements are presented in the next section.
3.3 Equity 3.3.1 Current choice of services for the urban poor VIP latrines are used as a minimum level of service outside the sewered boundaries. A mixed technological approach is used within the urban edge with VIPs being the minimum level of service. 3.3.2 Plans and measures to reduce inequity The plans are outlined in the municipal IDP. Around ZAR 335 million has been budgeted until 2021 for the WWTWs and associated infrastructure, including sewer upgrades, ablution facilities and laboratory upgrades. Around ZAR 100 million has been budgeted up until 2021 for the rural sanitation backlog. With informal areas, the budget is ZAR 220 million. The
Last Update: 9/07/2021 25
Buffalo City Metropolitan Municipality South Africa
Produced by: Emanti SFD Report
following wards have been identified for provision of basic sanitation services (Buffalo City Metropolitan Municipality, 2018):
o Ward 17 - Cuba, Msintsini and Ntabozuko o Ward 24 - Postdam o Ward 26 - Mpundu, Nkqonkqweni, Zikwaba and Msobomvu o Ward 31 - Ntenteni, Overton, Ncera 2 ext 1, Sunny South and Bongweni o Ward 32 - Ncera 7 and Tsholomnqa villages o Ward 33 - Qhuru villages, Ncera 8 and Ncera 9 o Ward 38 - Mamata, and Pirie Mission o Ward 40 - Qongqotha, Tshabo 2, Mlakalaka, Ndileka and Godidi o Ward 49 - Fort Murray & Cliff
The BCMM has estimated that it requires around ZAR 1.5 billion for the wastewater network and to collect and treat faecal sludge from VIP latrines. As this is not immediately available, the BCMM has budgeted around ZAR 200 million for the bulk sanitation provision from the 2014-2018 Medium Term Revenue and Expenditure Framework (MTREF) (Buffalo City Metropolitan Municipality, 2018).
3.4 Outputs 3.4.1 Capacity to meet service needs, demands and targets It is noted that within Water and Sanitation services in BCMM, 611 posts are filled, while 258 posts are vacant and/or unfunded (Westerberg, 2018). This could indicate potential gaps with fulfilling all required sanitation services functions/tasks. 3.4.2 Monitoring and reporting access to services This has been previously discussed in this SFD Intermediate Report and it includes data from Stats SA and the municipal IDP.
4 Stakeholder Engagement The relevant BCMM staff were contacted through e-mail, letter and telephone call prior to the visit to Buffalo City. The purpose of the SFD study and depth of data required was conveyed through an introductory letter to respective staff. Although a number of stakeholders of government departments were noted, this SFD study aimed to focus on interviews with staff from BCMM. Interviews were held with the General Manager: Water, Wastewater and Scientific Services and Acting Manager: Sanitation, who were assisted with inputs by other relevant technical staff. As this was a desk-based research process, a site inspection and associated interviews with field-based staff and relevant service providers were not conducted. Discussions were not held with members of the public (i.e., private citizens) or with focus groups. A site inspection and associated field-based interviews will assist with verifying data obtained from BCMM published reports (e.g., IDP, WSDP), and help in understanding the existing situation and upcoming developments in the sanitation sector for BCMM.
Last Update: 9/07/2021 26
Buffalo City Metropolitan Municipality South Africa
Produced by: Emanti SFD Report
5 Acknowledgements This report was compiled for a Water Research Commission (WRC) project Country-wide Shit-Flow Diagram: Establishing National Excreta Flows in South Africa and as part of the SFD Promotion Initiative. We would like to thank Mr. Mark Westerberg, General Manager: Water, Wastewater and Scientific Services and Mr. Mkhuseli Nongogo, Acting Manager: Sanitation and all participating BCMM staff for giving time and necessary information for the assessment. A special thanks to Shantanu Kumar Padhi and Amrita Bhatnagar of Centre for Science and Environment (CSE India) for their supervision and guidance during the assessment and report writing.
Last Update: 9/07/2021 27
Buffalo City Metropolitan Municipality South Africa
Produced by: Emanti SFD Report
6 References
Buffalo City Metropolitan Municipality. (2017). Intregated Development Plan Review for
Buffalo City 2017/2018. Buffalo City Metropolitan Municipality.
Buffalo City Metropolitan Municipality. (2018). Draft Integrated Development Plan Review.
Buffalo City Metropolitan Municipality.
Constitution of the Republic of South Africa. (1996). Constitution of the Republic of South
Africa, 1996 - Chapter 2: Bill of Rights. Retrieved from South African Government.
Dannhauser Local Municipality. (2014). Draft IDP Review 2014/2015. Dannhauser Local
Municipality.
Department of Water Affairs and Forestry. (1994). White Paper on Water Supply and
Sanitation Policy. Department of Water Affairs and Forestry, Cape Town. Retrieved
Water Services Authority (WSA): Buffalo City Metropolitan Municipality Water Services Provider (WSP): Buffalo City Metropolitan Municipality, Amatola Water
2 Ministry in charge of urban sanitation and sewerage
National: Department of Water and Sanitation Provincial: Department of Water and Sanitation (Eastern Cape)
3 Ministry in charge of urban solid waste
National: Department of Environmental Affairs Provincial: Department of Economic Development, Environmental Affairs & Tourism of the Eastern Cape (DEDEAT)
4 Ministry in charge of urban planning, finances and economic development
National: Department of Human Settlements Provincial: Eastern Cape Department of Human Settlements National: National Treasury Provincial: Eastern Cape Provincial Treasury
5 Ministry in charge of environmental protection
National: Department of Environmental Affairs Provincial: Department of Economic Development, Environmental Affairs & Tourism of the Eastern Cape (DEDEAT)
6 Ministry in charge of health National: Department of Health Provincial: Eastern Cape Department of Health
7 Service provider for construction of on-site sanitation technologies
Various, by tender appointment
8 Service provider for emptying and transport of faecal sludge
Various, by tender appointment
9 Service provider for operation and maintenance of treatment infrastructure
N/A Performed by Buffalo City Metropolitan Municipality
10 Market participants practicing end-use of faecal sludge end products
N/A
11 Service provider for disposal of faecal sludge (sanitary landfill management)
The publication of this report emanates from a project entitled: Country-wide Shit-Flow Diagram: Establishing National Excreta Flows in South Africa (WRC Project No. K5/2813/3) and as part of the SFD Promotion initiative.
This SFD Intermediate Report is available from:
Water Research Commission
Private Bag X03
Gezina, 0031
[email protected] or download from www.wrc.org.za or from SFD Promotion Initiative: sfd.susana.org