SFPP, L.P. Operating Partnership 1100 Town and Country Road, Orange, CA 92868 714-560-4400 714-560-4601 Fax ENERGY PARTNERS, L.P. February 12, 2016 California Regional Water Quality Control Board Los Angeles Region 320 W. 4th Street, Suite 200 Los Angeles, California 90013 Re: Effluent Monitoring Report October through December 2015 SFPP, L.P. Norwalk Pump Station 15306 Norwalk Boulevard, Norwalk, California (NPDES No. CA0063509, CI No. 7497) Attention: Information Technology Unit In reference to the subject National Pollutant Discharge Elimination System (NPDES) permit, please find enclosed the Fourth Quarter 2015 Effluent Monitoring Report for the subject discharge. I certify under penalty of law that this document and all attachments were prepared under my direction or supervision in accordance with a system designed to assure that qualified personnel properly gather and evaluate the information submitted. Based on my inquiry of the person or persons who manage the system or those persons directly responsible for gathering the information, the information submitted is, to the best of my knowledge and belief, true, accurate, and complete. I am aware that there are significant penalties for submitting false information, including the possibility of fine and imprisonment for knowing violations. Executed on the _ 12th __ day of _ February __ 2016. at __2:04 p.m.__________________________ ______________________ (signature) Stephen T. Defibaugh__ (printed name) Remediation Project Manager___ (title)
Transcript
SFPP, L.P. Operating Partnership
1100 Town and Country Road, Orange, CA 92868 714-560-4400 714-560-4601 Fax
ENERGY PARTNERS, L.P.
February 12, 2016
California Regional Water Quality Control Board Los Angeles Region 320 W. 4th Street, Suite 200 Los Angeles, California 90013
Re: Effluent Monitoring Report October through December 2015 SFPP, L.P. Norwalk Pump Station 15306 Norwalk Boulevard, Norwalk, California (NPDES No. CA0063509, CI No. 7497)
Attention: Information Technology Unit
In reference to the subject National Pollutant Discharge Elimination System (NPDES) permit, please find enclosed the Fourth Quarter 2015 Effluent Monitoring Report for the subject discharge.
I certify under penalty of law that this document and all attachments were prepared under my direction or supervision in accordance with a system designed to assure that qualified personnel properly gather and evaluate the information submitted. Based on my inquiry of the person or persons who manage the system or those persons directly responsible for gathering the information, the information submitted is, to the best of my knowledge and belief, true, accurate, and complete. I am aware that there are significant penalties for submitting false information, including the possibility of fine and imprisonment for knowing violations.
Executed on the _ 12th __ day of _ February __ 2016. at __2:04 p.m.__________________________
______________________ (signature)
Stephen T. Defibaugh__ (printed name)
Remediation Project Manager___ (title)
CH2M Santa Ana 6 Hutton Centre Drive Suite 700 Santa Ana, CA 92707 O +1 714 429 2000 F +1 714 429 2050 www.ch2m.com
Mr. Stephen Defibaugh Kinder Morgan Energy Partners, L.P. 1100 Town and Country Road Orange, California 92868
February 15, 2016
Subject: Effluent Monitoring Report, October 1 to December 31, 2015 (Fourth Quarter 2015) SFPP Norwalk Pump Station, 15306 Norwalk Boulevard, Norwalk, California (NPDES No. CA0063509, CI No. 7497)
Dear Mr. Defibaugh,
This report has been prepared by CH2M HILL Engineers, Inc. (CH2M), on behalf of SFPP, L.P. (SFPP), an operating partnership of Kinder Morgan Energy Partners, L.P. (Kinder Morgan), to summarize National Pollutant Discharge Elimination System (NPDES) monitoring related to the discharge of treated groundwater from SFPP’s product recovery and groundwater extraction (GWE) system. This system is installed at the SFPP Norwalk Pump Station located within the Defense Fuel Support Point Norwalk, at 15306 Norwalk Boulevard, Norwalk, California (the site).
SFPP performed certain operations, maintenance, and monitoring tasks on the product recovery and GWE systems. SFPP retained CH2M to prepare this report based on the NPDES monitoring performed by SFPP. This report describes NPDES monitoring activities during the period of October 1 to December 31, 2015.
Remediation System SFPP currently operates remediation systems consisting of soil vapor extraction (SVE), total fluids extraction (TFE) of free product, GWE for hydraulic control, and treatment of extracted soil vapors and groundwater to address two specific areas at and near the site: the south-central area and the southeastern area. Operation of the West Side Barrier (WSB) GWE system (WSB system) for remediation of the western offsite area was discontinued in August 2008 based on the reduced lateral extent and low concentrations of volatile organic compounds (VOCs) west of the site.
SVE is performed using a blower to remove soil vapors at a rate of up to 3,000 standard cubic feet per minute (scfm) from up to 33 SVE wells. The extracted vapors are conveyed to a knock-out tank that separates entrained moisture from the soil vapors. Accumulated moisture in the knock-out tank is treated by the main groundwater treatment system (GWTS) described below. The soil vapors are then treated in a thermal oxidizer where VOCs are converted to carbon dioxide and water prior to being discharged to the atmosphere. Operation of the GWTS and SVE is conducted in accordance with Permits to Construct (Application Nos. 569588 and 567723, respectively; ID 110835) issued by the South Coast Air Quality Management District (SCAQMD).
EN0209161151SCO
Mr. Stephen Defibaugh Page 2 February 15, 2016
The main GWTS handles free product and groundwater from up to 20 extraction wells located in the south-central area and up to 5 extraction wells located in the southeastern area of the site. During the fourth quarter 2015, the GWTS extracted from 12 wells equipped with pneumatically operated top-loading total fluids pumps, including 8 wells in the south-central area (GMW-24, GMW-25, GMW-O-20, GMW-O-23, MW-SF-2, MW-SF-12, MW-SF-14, and MW-SF-16) and 4 wells in the southeastern area (GMW-36, GMW-O-15, GMW-O-18, and GMW-SF-9). Free product and groundwater recovered by pneumatically operated top-loading total fluids pumps are piped to an oil-water separator (OWS). Free product from the OWS is collected in a storage tank and recycled at an offsite location. Water from the OWS is treated using liquid-phase granular activated carbon (LGAC). Treated water is routed through an onsite 3,000-gallon equalization tank. Two fluidized bed bioreactors (FBBRs) installed downstream of the equalization tank treat fuel oxygenates such as tertiary butyl alcohol (TBA) and methyl tertiary butyl ether (MTBE) that are not treated in the LGAC. The treated groundwater then passes through polishing LGAC units prior to discharge in accordance with the NPDES permit (No. CA0063509, CI No. 7497).
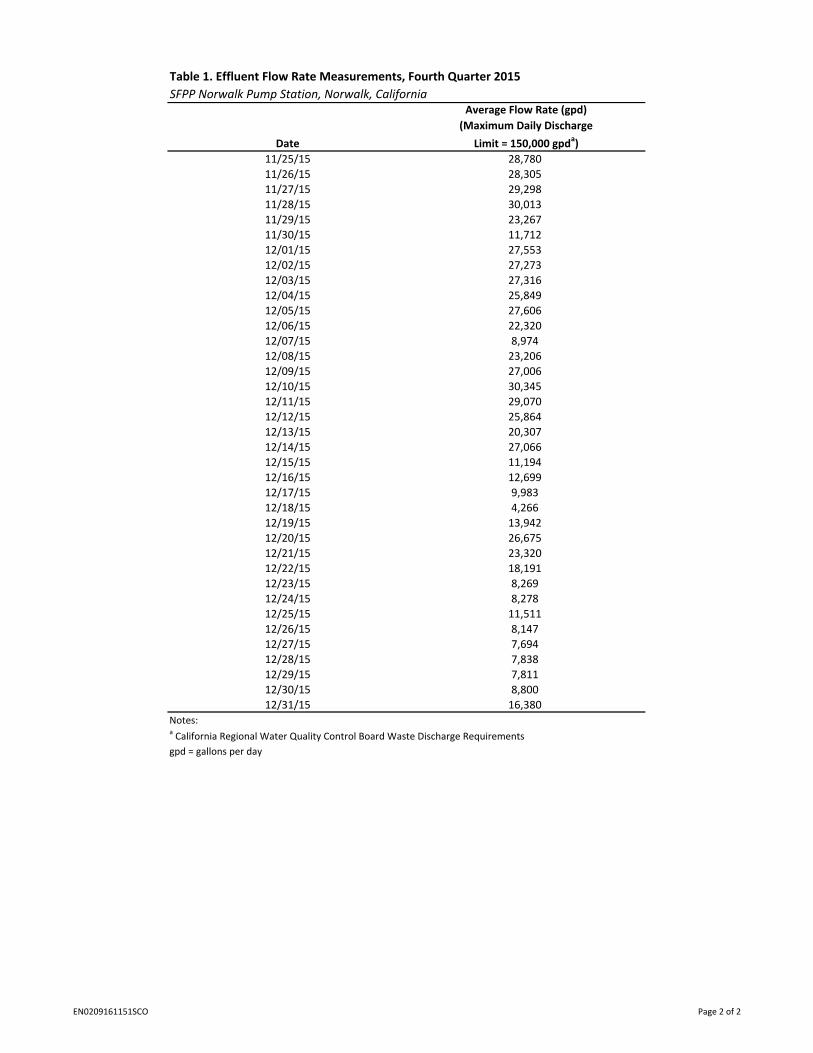
Summary of Quarterly Operations Approximately 1,482,816 gallons of groundwater were extracted from the south-central and southeastern areas during the fourth quarter 2015. No groundwater was extracted from the WSB area during this period. Table 1 summarizes the average daily flow rate during the reporting period. The GWTS operated throughout the quarter, with the following exceptions:
• The GWTS was off on arrival on October 10, 2015, due to an equalization tank alarm. A burned out relay was replaced prior to system restart later that day.
• The GWTS was shut down on October 12, 2015, to facilitate fourth quarter groundwater monitoring activities. The GWTS was restarted on October 26, 2015. During the GWTS downtime, a broken underdrain to an LGAC vessel was repaired. A clean-out of the equalization tank was also performed prior to restarting the system.
• The GWTS was turned off on November 11 and December 17, 2015, to clean out the OWS, sump, equalization tank, and transfer tank. In both cases, the system was restarted on the same day.
• The GWTS was turned off on November 13, 2015, and restarted on November 19, 2015, after maintenance on the acid delivery system was completed.
• The GWTS was off on arrival on December 18, 2015, due to a high transfer tank alarm. The level switch was cleaned out and the system was restarted later that day.
The amount of free product that accumulated in the product holding tank of the GWTS was estimated to be 772 gallons during the fourth quarter 2015. In addition, 34.5 gallons of product were manually bailed from a select group of wells that did not have TFE pumps (GMW-23, GMW-29, GMW-30, GMW-O-12, MW-SF-4, MW-SF-9, and MW-SF-15) during the fourth quarter 2015. Recovered free product was hauled away and disposed of at Kinder Morgan-approved disposal facilities as described in the Waste Hauling section of this report.
Routine Effluent Monitoring During the fourth quarter 2015, effluent water samples were collected pursuant to the Waste Discharge Requirements (WDRs) under Order No. R4-2011-0095. Samples were collected at the Order-designated monitoring point EFF-001 (Remediation System Effluent), RSW-001 (50 feet upstream of the discharge in Coyote Creek) and RSW-002 (50 feet downstream of the discharge in Coyote Creek). Samples were collected at EFF-001 on a monthly and quarterly basis. Samples were also collected at EFF-001, RSW-001,
EN0209161151SCO
Mr. Stephen Defibaugh Page 3 February 15, 2016
and RSW-002 as part of the accelerated toxicity sampling program and Toxicity Reduction Evaluation (TRE), which is further discussed below.
Toxicity samples were shipped to CH2M’s Applied Sciences Laboratory (ASL) in Corvallis, Oregon, for analysis; all remaining compliance samples were shipped to Advanced Technology Laboratories (ATL) in Las Vegas, Nevada, for analysis. ASL and ATL are certified by the National Environmental Laboratory Accreditation Program and the California Department of Public Health Environmental Laboratory Accreditation Program. The samples were analyzed in accordance with current U.S. Environmental Protection Agency (EPA) guidelines or as specified in the WDRs for the site.
Atherinops affinis (topsmelt) was used in lieu of the previously used toxicity test species under this permit due to the slightly brackish (saline) water conditions of the effluent and receiving water, and as allowed by the permit. The rationale for using this test species was documented in the report titled, Cause of Apparent Chronic Toxicity and Planned Corrective Action Plan, prepared by CH2M and submitted to the Regional Water Quality Control Board (RWQCB) on December 11, 2013.
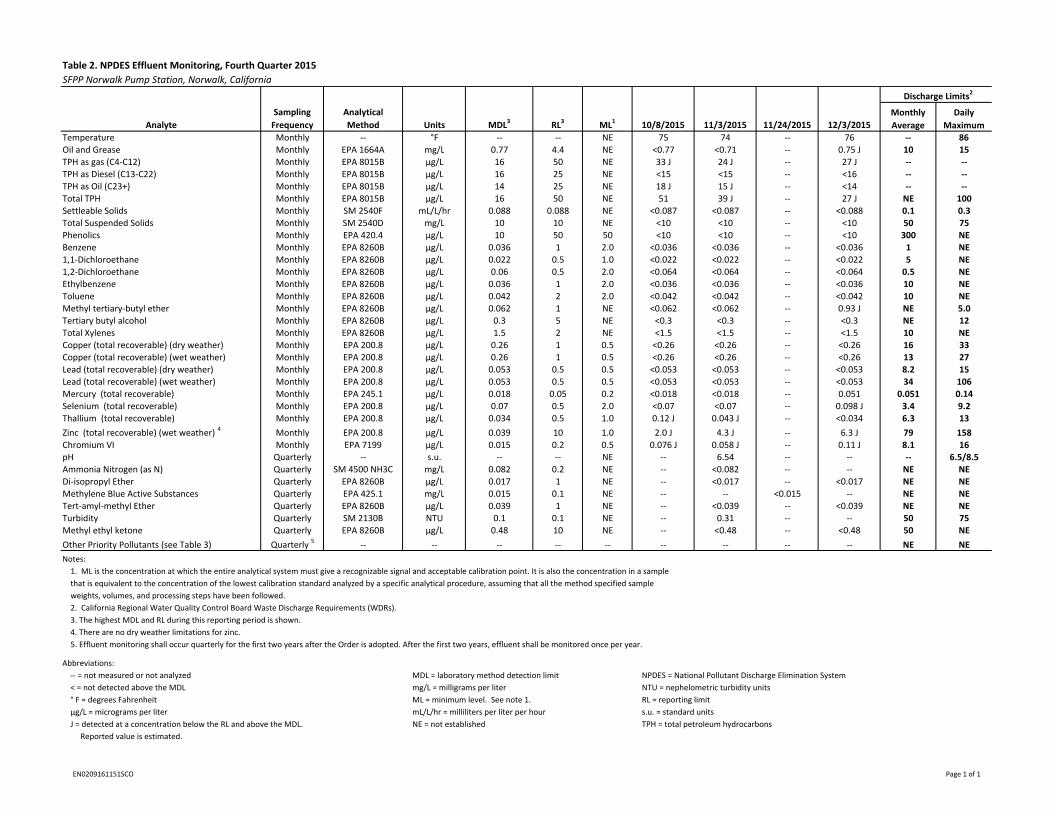
Summary of Compliance Results Monthly and Quarterly Sampling Analytical results for the monthly and quarterly monitoring at the effluent are summarized in Table 2. Analytical results for remaining priority pollutants at the effluent are summarized in Table 3. As shown in Table 2, all discharge limits for the treatment system effluent were met during the reporting period.
Toxicity Sampling Table 4 provides the results of the acute and chronic toxicity samples that were collected from EFF-001 (24-hour composite samples), RSW-001 (grab samples), and RSW-002 (grab samples) between September 14 and December 14, 2015. As stated in the Third Quarter 2015 Effluent Monitoring Report, accelerated testing for acute and chronic toxicity sampling would be initiated during the fourth quarter 2015 as a result of exceeded triggers for acute and chronic toxicity in the annual effluent sample collected between September 14 and 18, 2015. In accordance with the requirements of the WDRs, up to six accelerated tests were to be conducted with effluent composite samples collected over a 12-week period, at approximately 2-week intervals, and analyzed for acute and chronic toxicity.
Five accelerated toxicity tests were conducted with effluent collected between October 6 and December 7, 2015. Six tests were planned during this period but the schedule had to be revised due to treatment system downtime from October 12 to 26, 2015, and November 12 to 19, 2015, for routine groundwater monitoring activities and treatment system maintenance.
As shown in Table 4, accelerated tests 1 through 4 were within compliance limits and did not exceed triggers for either acute or chronic toxicity in the effluent. Accelerated test 5 exceeded the acute toxicity trigger, but the chronic test endpoint was invalid because control fish growth did not meet test acceptability criteria (TAC) (the topsmelt provided by the supplier did not meet the minimum growth of 0.85 milligrams (mg)/fish in the concurrent reference toxicant test).
As required by the Initial Investigation Toxicity Reduction Evaluation (TRE) Work Plan, prepared by CH2M, dated September 30, 2011, the TRE shall be implemented under the following conditions:
• Acute Toxicity: If the results of any two of the six accelerated tests are less than 90 percent survival, or if the initial test and any of the additional six acute toxicity bioassay tests results are less than 70 percent survival.
• Chronic Toxicity: If any three of the initial tests and six additional tests results exceeds 1.0 TUc (TUc = chronic toxicity unit).
EN1105151048SCO
Mr. Stephen Defibaugh Page 4 February 15, 2016
Since the acute toxicity for accelerated Sample 5 (44 percent) and the annual sample (68 percent) were below the threshold of 70 percent, the TRE was implemented for acute toxicity. The TRE was also implemented for chronic toxicity since the TAC was not met for accelerated Sample 5, and because the effluent used in the annual monitoring test exceeded the chronic toxicity trigger.
The first step of the TRE (“Step 3a”), due to toxicity exceedances in routine monitoring and accelerated testing, is to monitor the receiving water. A water sample (grab) is collected from location RSW-002, 50 feet downstream of the discharge point into Coyote Creek, and from location RSW-001, 50 feet upstream of the discharge point into Coyote Creek. If toxicity, as defined by the accelerated monitoring triggers, is not detected in the sample collected from RSW-002, then the effluent does not cause or contribute to downstream chronic toxicity and the Initial Investigation TRE will be considered to be complete. Alternatively, if there is toxicity exceeding the TRE triggers in both the upstream and downstream samples, then these samples will be compared in a two-step process to determine if there is a statistically significant increase in toxicity that could be due to the effluent discharge.
The initial round of TRE testing included samples collected at the effluent and receiving water between December 9 and 14, 2015. As shown in Table 4, acute and chronic toxicity were both in compliance at the effluent and the upstream and downstream receiving water. However, the chronic TAC for these samples was not met due to quality control issues with the topsmelt provided by the supplier (the concurrent laboratory control fish did not meet the minimum growth of 0.85 mg/fish). Consequently, one additional round of toxicity samples was collected from the effluent and receiving water between January 20 and 25, 2016. Results of this sampling event will be provided in the First Quarter 2016 Effluent Monitoring Report, due to the RWQCB on May 15, 2016.
Currently, there is only one known supplier of topsmelt for toxicity testing. Until these quality control issues can be resolved by the supplier (or a different supplier can be identified) additional toxicity sampling as part of the TRE is not recommended. Once it can be demonstrated that the supplier’s topsmelt are well within the acceptable reference toxicity range, one additional toxicity test will be conducted as part of the TRE with samples collected from the effluent and receiving water.
The laboratory reports and chain-of-custody documents for the effluent and receiving water samples collected during the fourth quarter 2015 are included in Appendix A.
Waste Hauling Following is a summary of liquid and solid waste removed from the site during the fourth quarter 2015.
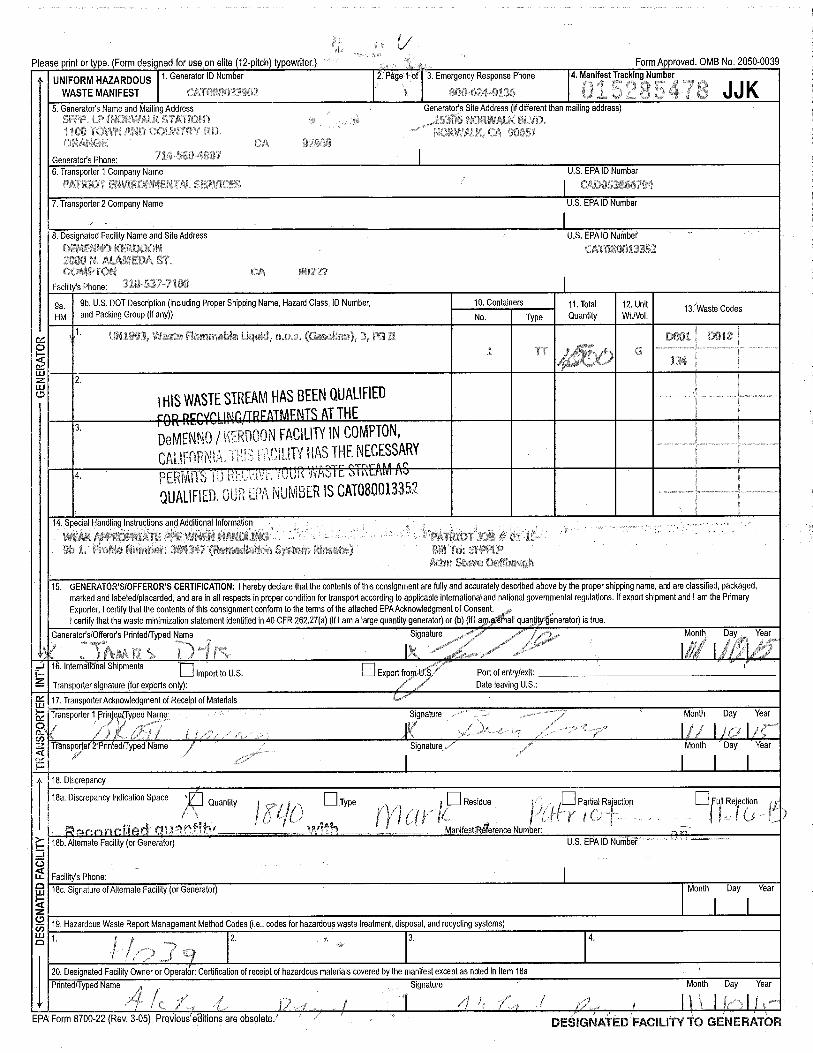
Liquids Approximately 4,425 gallons of flammable liquid waste was removed from the site during the fourth quarter 2015 by Patriot Environmental Services of 508 East E Street, Wilmington, California 90744. The waste included a mixture of recovered fuel product and water generated from cleaning out the OWS transfer tank, equalization tank, and sump. The waste was transported to Demenno/Kerdoon at 2000 North Alameda Street, Compton, California 90222. Provided below is a summary of quantities removed during each event:
• October 26, 2015 – 900 gallons • November 10, 2015 – 1,500 gallons • December 17, 2015 – 2,025 gallons
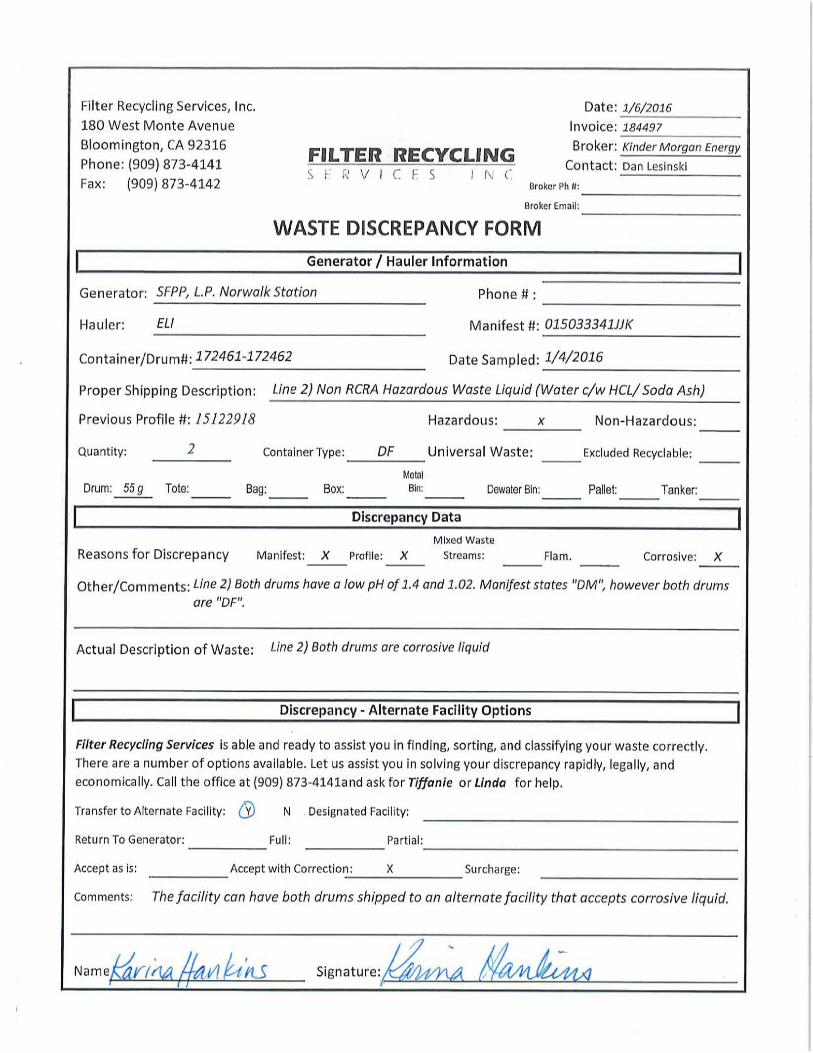
Approximately 110 gallons of non-Resource Conservation and Recovery Act (RCRA) hazardous waste solids (water with hydrochloric acid and soda ash) were removed from the site on December 30, 2015, by Environmental Logistics, Inc., of 140 West Monte Avenue, Bloomington,
EN0209161151SCO
Mr. Stephen Defibaugh Page 5 February 15, 2016
California 92316. The waste was transported to Filter Recycling Services, Inc., at 180 West Monte Avenue, Bloomington, California 92316.
Solids Approximately 600 pounds of non-RCRA hazardous waste solids (bag filters) were removed from the site on October 2, 2015, by Environmental Logistics, Inc. The waste was transported to Filter Recycling Services, Inc.
Approximately 400 pounds of nonhazardous waste solids (bag filters) were removed from the site on October 2, 2015, by Environmental Logistics, Inc. The waste was transported to Filter Recycling Services, Inc.
Approximately 150 pounds of nonhazardous waste solids (rags and gloves) were removed from the site on October 2, 2015, by Environmental Logistics, Inc. The waste was transported to Filter Recycling Services, Inc.
Approximately 200 pounds of nonhazardous waste solids (soil from site investigation borings) were removed from the site on October 2, 2015, by Environmental Logistics, Inc. The waste was transported to Filter Recycling Services, Inc.
Approximately 400 pounds of nonhazardous spent vapor-phase granular activated carbon (VGAC) (carbon) was removed from the site on October 6, 2015, by Prominent Systems, Inc., of 13095 E. Temple Avenue, City of Industry, California 91746. The waste was transported to California Carbon Co. at 2825 East Grant Street, Wilmington, California 90744.
Approximately 800 pounds of nonhazardous spent VGAC (carbon) was removed from the site on October 20, November 12, and December 15, 2015, by Prominent Systems, Inc. The waste was transported to California Carbon Co.
Approximately 4,000 pounds of nonhazardous spent LGAC (carbon) was removed from the site on December 15, 2015, by Prominent Systems, Inc. The waste was transported to California Carbon Co.
Approximately 2,000 pounds of nonhazardous spent LGAC (carbon) was removed from the site on December 23, 2015, by Prominent Systems, Inc. The waste was transported to California Carbon Co.
Approximately 500 pounds of nonhazardous waste solids (bag filters) were removed from the site on December 30, 2015, by Environmental Logistics, Inc. The waste was transported to Filter Recycling Services, Inc.
Copies of the waste manifests are included in Appendix B.
Annual Review of Stormwater Pollution Prevention Plan, Best Management Practices Plan, and Spill Contingency Plan As required in Section IX.B.2 of the Monitoring and Reporting Program, the project Stormwater Pollution Prevention Plan (SWPPP), Best Management Practices (BMP) Plan, and Spill Contingency Plan (SCP) are reviewed annually and updated as needed to ensure all actual and potential sources of pollutants in wastewater and stormwater discharged from the facility are addressed in the plans. A combined SWPPP/BMP Plan and SCP was provided to the RWQCB on September 29, 2011. An amendment to the SWPPP/BMP Plan was provided to the RWQCB on February 26, 2014, to address changes to the stormwater collection system at the site and the addition of an acid delivery system to the GWTS. These documents have been reviewed and should be updated to reflect the following changes:
• Methyl tertiary butyl ether (MTBE) and tertiary butyl alcohol (TBA) will be stored in small quantities at the site (no more than 1 liter of each). MTBE and TBA will be stored in a fire-resistant chemical
EN1105151048SCO
Mr. Stephen Defibaugh Page 6 February 15, 2016
storage cabinet. Within the cabinet, the MTBE and TBA will be placed in a secondary containment tray that will hold 1.5 liters of liquid. The Safety Data Sheets for each chemical will be stored onsite. The MTBE and TBA will be used to supplement the FBBRs during periods of downtime.
The above changes will be incorporated into the revised SWPPP/BMP Plan and SCP documents and kept at the site for reference.
Should you require any further information, please contact me at (714) 435-6255.
Ammonia Nitrogen (as N) Quarterly SM 4500 NH3C mg/L 0.082 0.2 NE ‐‐ <0.082 ‐‐ ‐‐ NE NE
Di‐isopropyl Ether Quarterly EPA 8260B µg/L 0.017 1 NE ‐‐ <0.017 ‐‐ <0.017 NE NE
Methylene Blue Active Substances Quarterly EPA 425.1 mg/L 0.015 0.1 NE ‐‐ ‐‐ <0.015 ‐‐ NE NE
Tert‐amyl‐methyl Ether Quarterly EPA 8260B µg/L 0.039 1 NE ‐‐ <0.039 ‐‐ <0.039 NE NE
Turbidity Quarterly SM 2130B NTU 0.1 0.1 NE ‐‐ 0.31 ‐‐ ‐‐ 50 75
Methyl ethyl ketone Quarterly EPA 8260B µg/L 0.48 10 NE ‐‐ <0.48 ‐‐ <0.48 50 NE
Other Priority Pollutants (see Table 3) Quarterly 5 ‐‐ ‐‐ ‐‐ ‐‐ ‐‐ ‐‐ ‐‐ ‐‐ ‐‐ NE NE
Notes:
1. ML is the concentration at which the entire analytical system must give a recognizable signal and acceptable calibration point. It is also the concentration in a sample
that is equivalent to the concentration of the lowest calibration standard analyzed by a specific analytical procedure, assuming that all the method specified sample
weights, volumes, and processing steps have been followed.
2. California Regional Water Quality Control Board Waste Discharge Requirements (WDRs).
3. The highest MDL and RL during this reporting period is shown.
4. There are no dry weather limitations for zinc.
5. Effluent monitoring shall occur quarterly for the first two years after the Order is adopted. After the first two years, effluent shall be monitored once per year.
Abbreviations:
‐‐ = not measured or not analyzed MDL = laboratory method detection limit NPDES = National Pollutant Discharge Elimination System
< = not detected above the MDL mg/L = milligrams per liter NTU = nephelometric turbidity units
° F = degrees Fahrenheit ML = minimum level. See note 1. RL = reporting limit
µg/L = micrograms per liter mL/L/hr = milliliters per liter per hour s.u. = standard units
J = detected at a concentration below the RL and above the MDL. NE = not established TPH = total petroleum hydrocarbons
1. ML is the concentration at which the entire analytical system must give a recognizable signal and acceptable calibration point. It is also the concentration in a sample that is
equivalent to the concentration of the lowest calibration standard analyzed by a specific analytical procedure, assuming that all the method specified sample weights, volumes, and
3 Concurrent reference toxicant control fish did not meet minimum growth of 0.85 mg/fish.4 Concurrent laboratory control fish did not meet minimum growth of 0.85 mg/fish.
Abbreviations:
mg = milligrams
NOEC = no observed effect concentration
NPDES = National Pollutant Discharge Elimination System
TRE = toxicity reduction evaluation
TUc = chronic toxicity unit, where TUc = 100/NOEC
2 Accelerated testing will be implemented if either the acute toxicity result is less than 90% survival as the average in any three consecutive tests,
or less than 70% survival in any single test, or if the chronic toxicity result is more than 1 TUc.