43

January 19, 2005 Page 2| |
Module Objectives
After completing the module, you will able to–Find caveats and hidden errors in application codes–Handle debuggers–Follow system calls and interrupts–Understand the relationship between correct code and
performance

January 19, 2005 Page 3| |
Correct Code
•Before performance tuning ensure that your code gives correct answers!
•Stick to standards first before you boost your code with non-standard features!
•Try to answer the following questions:–Same results with different levels of compiler optimizations?–Given that a code is parallel are the results independent from the
numbers of threads or processes?–Have you ever run your code with array bound and subroutine
argument checking?–Have you checked that your code is not causing floating point
exceptions?–Does your code work with a different link order of objects?–Have you made any assumptions regarding storage of data
objects in memory?

January 19, 2005 Page 4| |
Array Bound Checking
•ifort supports array bound checking and check for temporary argument creation:
– Compile with -check all -tracebackforrtl: severe (408): fort: (2): Subscript #1 of the array DIST has value 601 which is greater than the upper bound of 600
Image PC Routine Line Sourcemat_dist 0x0400000000004f9b0 Unknown Unknown Unknown
mat_dist 0x4000000000009f40 Unknown Unknown Unknown
mat_dist 0x4000000000009890 Unknown Unknown Unknown
mat_dist 0x4000000000006a20 dodist_ 40 dodist.F
mat_dist 0x4000000000004880 MAIN__ 86 main.F
mat_dist 0x40000000000036d0 Unknown Unknown Unknown
libc.so.6.1 0x20000000001fa890 Unknown Unknown Unknown

January 19, 2005 Page 5| |
Hidden Floating Point Exceptions• Check with dmesg for messages within the system log:a.out(28282): floating-point assist fault at ip 4000000000001d11, isr 0000020000000008
mat_dist(28703): floating-point assist fault at ip 4000000000003861, isr 0000020000000004
• Look into “Intel Itanium Architecture Software Developer's Manual” for a description of the ISR.
• Assist faults are managed by the kernel.–Can be a killer of performance and scalability if assist faults
ocure at high rates.• Reason for assist faults:
–Wrong precision chosen for the floating point operations• Code was run in single precision, should be double precision.
–Programming errors and/or bad algorithmic design–Speculative floating point operations due to high opt. levels
• Try to compile with -IPF_fp_speculation [save|off]
Single Step Trap
Divide by zero

January 19, 2005 Page 6| |
Hidden Floating Point Exceptions
•Make hidden floating point exceptions visible by compiling with -fpe0 -traceback
reiner@dcm24 107> ifort -fpe0 -traceback -g -O2 matmult.f
reiner@dcm24 108> ./a.out
forrtl: error (73): floating divide by zero
Image PC Routine Line Source
a.out 0x40000000000036e2 setup_ 79 matmult.f
a.out 0x4000000000003500 MAIN__ 17 matmult.f
a.out 0x4000000000003450 Unknown Unknown Unknown
libc.so.6.1 0x20000000001fe990 Unknown Unknown Unknown
Abort (core dumped)
reiner@dcm24 109>

January 19, 2005 Page 7| |
Unaligned address faults
• Example PARAMETER(MAXUNT=20)
CHARACTER*4 GCHARS
COMMON/SCRT2/GCHARS(2048)
C
CHARACTER*20 SI2IMP(3,MAXUNT)
DATA SI2IMP /
+ 'J ','BTU ','9.4787000E-04',
+ 'J/(kg K) ','BTU/lbm F ','2.3886000E-04',
...
...
...
...
DO I = 1,MAXUNT
DO K = 1,3
DO J = 1,17,4
N1 = N1+1
GCHARS(N1) = & SI2IMP(K,I)(J:J+3)
END DO
END DO
END DO

January 19, 2005 Page 8| |
Unaligned address faults (cont.)
• Example causes the following messages:
unaligned access to 0x2000000000a9b0b9, ip=0x4000000000067a81
• Such faults can be trapped by running under control of prctlprctl --unaligned=always-signal ./a.out
• Consult section “Memory Datum Alignment and Atomicity” in“Intel IA-64 Architecture Software Developer’s Manual: Volume 2”
• To turn off any loging create a new instance of a shell by prctl --fpemu=silent --unaligned=silent

January 19, 2005 Page 9| |
Detecting Memory Corruption
• Glibc malloc()/ free()• MALLOC_CHECK_ environment variable:
–Set to 0: silently ignore any heap corruption–Set to 1: print diagnostic message when heap
corruption detected–Set to 2: abort immediately upon heap corruption
– Only detects simple errors such as one-byte overruns and multiple free() calls

January 19, 2005 Page 10| |
Detecting Memory Corruption (cont.)
Electric Fence– Detects invalid reads as well as writes
– Pinpoints exact instruction causing problem
– Places invalid pages immediately after or before allocated blocks
– Controlled via environment variables
– To use:• Link with –lefence
• man efence for environment variable details

January 19, 2005 Page 11| |
Available debuggers
• idb: The Intel debugger -- available if you have licenses for the Intel compilers
–Fully symbolic debugger –Supports debugging of Fortran, C and C++ programs
•gdb: The GNU project debugger –Supports debugging of C, C++, and Modula-2 –Supports Fortran 95 debugging when gdbf95 patch is installed –The patch can be found at http://sourceforge.net/projects/gdbf95/
• ddd: A graphical interface to gdb and other debuggers –Simple command line option allows selecting debugger to use
• Totalview by Etnus–Your Rolls among the debuggers –Let you even debug multiple MPI tasks–Excellent F90 array browser

January 19, 2005 Page 12| |
Debugger Syntax
• The basic command-line syntax to start the various debuggers is as follows:
–gdb [exec_file [core_file|process_id]] –idb [-pid process_id] [-gdb] [exec_file [core_file]] –ddd [-debugger name] [exec_file [core_file|process_id]] • [-pid] process_id lets you debug a running process with the specified
process id (as long as there does not exist a file whose name is process_id, if gdb or ddd are used)
• exec_file specifies the executable file (optional)
• You can specify a core file (with its executable) to help determine and localize the cause of segmentation violations or other abnormal termination conditions; if an executable core file exists, it is used by default

January 19, 2005 Page 13| |
gdb
• Help is available –gdb's own help command – info gdb at the shell command prompt –http://sources.redhat.com/gdb/onlinedocs/gdb_toc.html
• Debugging gcc-optimized code (-g -O[1|2|3]) works fine • Some challenges with ifort at levels 2 and 3
–Can't print values of register variables • Assembly level debugging works
–gdb understands rotating registers: useful for stepping through software-pipelined loops.

January 19, 2005 Page 14| |
idb
• Intel debugger, part of Intel compiler installation • Supports C, C++, Fortran 77, Fortran 90 • dbx- (default) and gdb-like interfaces • Debugging of optimized code limited • Good for getting Fortran stack traces • Supports multithreaded applications (pthreads and OpenMP)

January 19, 2005 Page 15| |
Data Display Debugger -- ddd
•Front end GUI to gdb and other debuggers, written by Dorothea Lütkehaus and Andreas Zeller
•Home page at http://www.gnu.org/software/ddd/ •Features an interactive graphical data display, where data structures are displayed as graphs
•Works best with gdb, but can work with idb in dbx mode
–ddd -debugger idb -dbx ./a.out

January 19, 2005 Page 16| |
Main Window
• By default displays the Menu Bar, Tool Bar, Source Window, Debugger Console and Status Line .
• The Data Window, when invoked, appears above the Source Window, and an optional Machine Code Window appears below the Source Window.

January 19, 2005 Page 17| |
Command Tool/Program Menu
• A free-standing window displayed when ddd starts.
• Can be respositioned with Alt-8 or selecting ViewCommand Tool on the Main Window.
• Can be configured to appear as a command tool bar above the source window (Edit > Preferences > Source Tool Buttons Location).
• The tool provides easy access to many frequently-used debugger commands
• The same functions are accessible from the Program Menu and the keyboard shortcuts listed in i.t

January 19, 2005 Page 18| |
Execution Window
•By default the program being debugged will run in the Debugger Console.
•Selecting View Execution Window will open an xterm window and enable the Run in Execution Window item in the Program menu.
•Alternately, enabling Run in Execution Window in the Program menu will cause an Execution Window to be opened when you click on Run in the Command Tool.

January 19, 2005 Page 19| |
•The Tool Bar has two parts:– The argument field, labeled (), where any item may be entered. –The tool icons, which represent functions that can be applied to
the item in the argument field; only those functions that make sense for the argument will be enabled.
Tool Bar

January 19, 2005 Page 20| |
Debugger Console
• A command-line interface to the debugger is at the bottom of the main window.
–You can use the underlying debugger's commands here. • You can type in debugger commands instead of using the GUI.

January 19, 2005 Page 21| |
File Menu
• The File menu groups file-related operations

January 19, 2005 Page 22| |
Edit Menu
• The Edit menu allows setting preferences and debugger configuration parameters, besides the usual editing functions

January 19, 2005 Page 23| |
View and Command Menus
• The View menu allows displaying the optional standalone windows and showing or hiding the main view windows
• The Command menu helps perform operations related to ddd commands

January 19, 2005 Page 24| |
Status Menue
• The status menu has options for examining and modifying the program state; call stack, machine register contents, threads and signals, as well as moving up and down the call stack

January 19, 2005 Page 25| |
Setting/Clearing Breakpoints
• There are several ways to set breakpoints: –Left-click on the whitespace to the left of the source line where
you want to set a breakpoint so that it appears in the Argument Field, then use the Stop icon on the Tool Bar (which should be labeled ``Break'')
–Triple left-click on the whitespace to the left of the source line where you want to set a breakpoint.
–Right click-and-hold, choose from the resulting pop-up menu. –Type the appropriate break command in the Debugger Console
• To clear a breakpoint: –Left click on the stop sign next to the line with the breakpoint to
make it appear in the Argument Field, then use the Stop icon on the Tool Bar (which should now be labeled ``Clear'')
–Right click-and-hold, choose from the resulting pop-up menu –Type the appropriate delete command in the Debugger Console

January 19, 2005 Page 26| |
Examining Variables
•There are three ways of showing the value of a variable: –Point to it with the cursor: The answer will appear in the Status
Line at the bottom margin of the main window –Print it on the debugger console with the print() command –Display it graphically with the display() command
•Printing or displaying can be achieved by –Left-clicking on the data item, which places it on the Argument
Field, and then selecting the appropriate tool –Using the right mouse button to click-and-hold on the data item,
and selecting from the resulting pop-up menu

January 19, 2005 Page 27| |
Backtrace Window
•The call stack is shown in the Backtrace window, displayed from Status Backtrace

January 19, 2005 Page 28| |
Edit - Compile - Debug Loop • Editing, compiling, and debugging are tightly integrated in ddd:
–EDIT • Clicking on Edit in the Command Tool opens a window with
your favorite X-Windows editor if the environment variable XEDITOR is defined, or else an xterm with either the editor given by the environment variable EDITOR, or vi. The program being displayed in the Source Window will be loaded into the editor window.
–COMPILE • Clicking on Make in the Command Tool executes make. A
makefile should be present; you can choose a target from the File Make menu option. The new executable is attached automatically when you click on Run. Note that idb does not support the make command; however, a shell make target command may be typed in the Debugger Console.
–DEBUG • Continue debugging your code.

January 19, 2005 Page 29| |
Traps
• Traps are used to inspect data at points during execution of the program. There are two types of traps:
–Breakpoint • Halts the process so you can examine data manually • You can add conditions to control in detail whether the
program stops at the breakpoint –Watchpoint
• Stops the program when the value of an expression changes

January 19, 2005 Page 30| |
Setting and Clearing Breakpoints
•Triple click on a line with the left mouse button (to set) •Click and hold the right mouse button, select from the pop-up menu
•Use the Stop sign icon on the Control Panel •Use the Console panel commands (break/clear)

January 19, 2005 Page 31| |
Breakpoints - What Can You Examine?
•Variables (value, type, addresses) •Value of expressions •Call Stack •Data structures (graphically) •Arrays •Machine code •Memory/registers

January 19, 2005 Page 32| |
Breakpoint Properties
• Once a breakpoint is set, right click-and-hold on the Stop sign icon at the breakpoint and select Properties from the pop-up menu, or with the breakpoint in the Argument Field, use the Stop Tool menu to select Breakpoint Properties
• A pop-up window appears where you can set a condition for stopping, a count for the number of times to ignore the breakpoint before stopping, or debugger commands to execute when arriving at the breakpoint.
January 19, 2005 Page 33| |
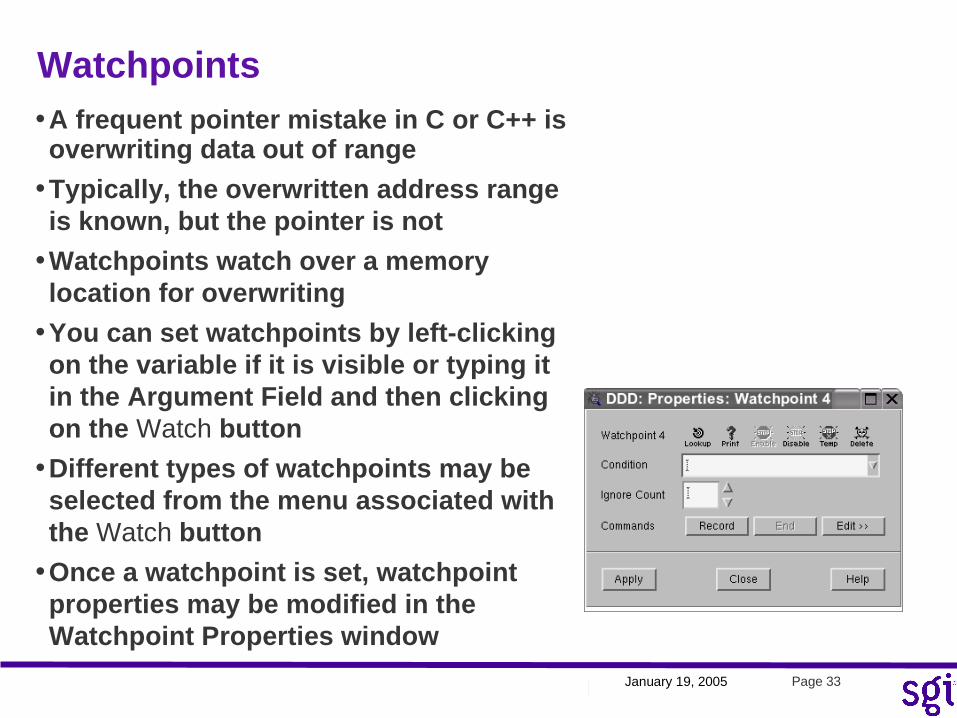
Watchpoints• A frequent pointer mistake in C or C++ is overwriting data out of range
• Typically, the overwritten address range is known, but the pointer is not
• Watchpoints watch over a memory location for overwriting
• You can set watchpoints by left-clicking on the variable if it is visible or typing it in the Argument Field and then clicking on the Watch button
• Different types of watchpoints may be selected from the menu associated with the Watch button
• Once a watchpoint is set, watchpoint properties may be modified in the Watchpoint Properties window

January 19, 2005 Page 34| |
Signals
• Status > Signals pops up a panel showing a list of all signals and how gdb has been told to handle each one.
• Stop: Stop the program when the signal happens. (Setting Stop also sets Print.)
• Print: Print a message when the signal happens. (Unsetting Print also unsets Stop.)
• Pass: If set, allow the program to see the signal and handle it, if it has installed a handler, or be killed, if no handler has been installed.
January 19, 2005 Page 35| |
Data Display
• The Data Display provides a graphical representation of variables, arrays, structures and linked lists
• The Data Display opens automatically when an item is selected for display
–Left click on the item, click on the Display button –Right click-and-hold, select Display from the popup menu –Double click on the variable
• There are many display and formatting options

January 19, 2005 Page 36| |
Machine Code Window
•Source Display Machine Code opens up an additional window, usually below the Source Window, that contains the machine code for the current function
•Breakpoints can also be set and cleared in this window •If source code is not available, only the machine code window is updated

January 19, 2005 Page 37| |
Register Window
•The Register View lets you view processor registers –The window pops up selecting Status Registers

January 19, 2005 Page 38| |
Debugging MPI with gdb
• In the first window set MPI_ATTACH_DEBUG equal to the rank to be debugged.
• Open a second window. • Start your MPI code in the first window.
reiner@dcm24 75> setenv MPI_SLAVE_DEBUG_ATTACH 0
reiner@dcm24 75> mpirun -np 4 mxm4.mpi.x
MPI rank 0 sleeping for 20 seconds while you attach the debugger.You can use this debugger command gdb /proc/30541/exe 30541or idb -pid 30541 /proc/30541/exe
• Mouse the the gdb or idb line into your second window.

January 19, 2005 Page 39| |
Debugging MPI with gdb
• In second window you receive something like:
(gdb) continue
Continuing.
Program received signal SIGFPE, Arithmetic exception.
[Switching to Thread 2305843009213887280 (LWP 30599)]
0x4000000000004a81 in setup_ ()
(gdb)

January 19, 2005 Page 40| |
Debugging MPI Applications with Totalview
•Start your session liketotalview mpirun -a -np 4 mxm4.mpi.x
•Start the application by clicking 'Go' in the tool bar ofmain window.

January 19, 2005 Page 41| |
Totalview
January 19, 2005 Page 42| |
Lab: Setting Break Points (C, C++, Fortran) Using Browsers and Views (C/C++/Fortran) •Objectives
–Start up a program in the ddd. –Use the Debugger to set a break point. –Step into and step over function calls.–Exercise the various ways to examine variables.–Use the Backtrace window. –Use the Display Window, Machine Code Window, and Register
Window.

January 19, 2005 Page 43| |


