Shadow Banking Activities in Non-financial firms: Evidence from China Julan Du 1 , Chang Li 2 , Yongqin Wang 3 Abstract This study examines a particular form of shadow banking activities performed by non-financial firms, in which firms borrow in order to lend, acting as financial intermediaries. We identify the existence of such re-lending business by investigating the relationship between financial assets and financial liabilities based on pecking order theory and also the correlation between liquidity assets and fixed business investments, and supplement the evidences by tracking the trace of re-lending cash flows in financial statements. We find that these particular shadow banking activities are prevalent across Chinese firms, especially in state-owned enterprises, maybe due to better access to financial markets. These results are consistent after inclusion of monetary policy indicators, which are exogenous to non-financial firms. Yet tight monetary policies appear to adversely affect the development of re-lending business since firms obtain less external funds for lending. Meanwhile, growth opportunities, large shareholders and external finance dependence all impede firms to deeply engage in the re-lending business. We shed some light on the economic consequence of the business and observe that the larger scale of re-lending business is accompanied by higher ROA after 2006, when related-party loans are cleaned. 1. Introduction The 2007-2009 financial crisis started at the market of asset-backed commercial paper in August 2007 4 , driven by maturity mismatch, but then swept across financial industries in both U.S and Europe and even adversely affected real economy. One distinguished feature of this crisis is that it took place in shadow banking sector, an ignored place by regulation. The scale of shadow banking shrinks hugely afterwards and the topic of shadow banking interests many researchers. A strand of literatures studies the mechanism of components in shadow banking: asset-backed securities, Repos, money market mutual funds (MMMFs), securities lending and agency mortgaged backed securities 5 . They examine the design and risk brought to the financial sector for each activity (e.g. Krishnamurthy, Arvind, Nagel, and Orlov, 2011; Arteta, Carey and Correa, 2012; Acharya, Schnabl, and Suarez, 2013; Kacperczyk, Marcin, and Schnabl, 2013), suggesting that securitization doesn’t realize the traditionally designed function, risk transfer. Another subset of literatures investigate the underlying causes of the financial crisis either empirically or theoretically, such as problems in credit ratings, agency problems in banks, 1 The Chinese University of Hong Kong 2 The Chinese University of Hong Kong 3 Fudan University 4 Brunnertmeier (2009) recount some events time points for the financial crisis. 5 The definition and inclusion vary in different agencies, and here we just list the common activities.
Transcript
Shadow Banking Activities in Non-financial firms: Evidence from China Julan Du1, Chang Li2, Yongqin Wang3 Abstract This study examines a particular form of shadow banking activities performed by non-financial firms, in which firms borrow in order to lend, acting as financial intermediaries. We identify the existence of such re-lending business by investigating the relationship between financial assets and financial liabilities based on pecking order theory and also the correlation between liquidity assets and fixed business investments, and supplement the evidences by tracking the trace of re-lending cash flows in financial statements. We find that these particular shadow banking activities are prevalent across Chinese firms, especially in state-owned enterprises, maybe due to better access to financial markets. These results are consistent after inclusion of monetary policy indicators, which are exogenous to non-financial firms. Yet tight monetary policies appear to adversely affect the development of re-lending business since firms obtain less external funds for lending. Meanwhile, growth opportunities, large shareholders and external finance dependence all impede firms to deeply engage in the re-lending business. We shed some light on the economic consequence of the business and observe that the larger scale of re-lending business is accompanied by higher ROA after 2006, when related-party loans are cleaned. 1. Introduction The 2007-2009 financial crisis started at the market of asset-backed commercial paper in August 20074, driven by maturity mismatch, but then swept across financial industries in both U.S and Europe and even adversely affected real economy. One distinguished feature of this crisis is that it took place in shadow banking sector, an ignored place by regulation. The scale of shadow banking shrinks hugely afterwards and the topic of shadow banking interests many researchers. A strand of literatures studies the mechanism of components in shadow banking: asset-backed securities, Repos, money market mutual funds (MMMFs), securities lending and agency mortgaged backed securities5. They examine the design and risk brought to the financial sector for each activity (e.g. Krishnamurthy, Arvind, Nagel, and Orlov, 2011; Arteta, Carey and Correa, 2012; Acharya, Schnabl, and Suarez, 2013; Kacperczyk, Marcin, and Schnabl, 2013), suggesting that securitization doesn’t realize the traditionally designed function, risk transfer. Another subset of literatures investigate the underlying causes of the financial crisis either empirically or theoretically, such as problems in credit ratings, agency problems in banks,
government induced distortions and increased systematic risk but decreased idiosyncratic risk induced by securitization (Adelino and Manuel, 2009; Ashcraft, Adam, Goldsmith-Pinkham, and Vickery, 2010; Fahlenbrach, Rudiger, and Stulz, 2011; Gennaioli, Shleifer, and Vishny, 2013). Also regulation in shadow banking sector has received certain attention in studies. Gorton and Metrick (2010) propose to use bankruptcy harbor on repos and establish strict controls by chartering new forms of narrow banks for MMMFs; Ricks (2010) examines the efficiency of potential approaches for policy intervention, and finds that insurance regime is most efficiency maximizing. These works provide empirical and theoretical support for the idea that shadow-banking sector is closely tied with development of financial industry from different sides and needs as much attention as traditional banking sector. But the findings are limited to financial industry, either for the financial instruments applied or participating entities (e.g. investment banks, mutual funds, SPV, ABCP conduits). They ignore shadow banking activities outside of financial industry and the connection between these financing activities and real economy investments. Besides, most shadow banking literatures focus on developed economy, after all financial markets in developing countries are not well developed and face strict constrains from regulators. It’s noticeable that shadow banking expands very fast these years in some Asian countries. Chinese shadow banking sector has become fifth largest according to FSB jurisdictions in 2012 and stepped to third place in 2014, in dollar terms6. Thus studies should extend work to gauge the forms and influence of shadow banking activities in developing countries. Either literatures or agency reports studying on Chinese shadow banking mostly focus on the behavior of commercial banks, which play the most important role in shadow banking sector in China. They try to answer why shadow banking grow so rapidly these years or whether these shadow banking activities would bring systematic risks or solvency pressures to banking sector. Among the few literatures on Chinese shadow banking, Hachem and Song (2015) explore the behavior of commercial banks likewise, but isolate the regulatory triggers for shadow banking by documenting the differences between small and medium-sized banks and Big Four banks; they show that the strict enforcement of bank loan-to-deposit ratio and reserve requirement is a key trigger for the involvement of small and medium-sized banks in shadow banking, but Big Four step into the market only in order to “defend the market share”. Li and Hsu (2013) mainly examine the financial risks produced by shadow banking institutions and run a rough bank stress test; they find that large financial institutions face certain solvency and credit risks, and suggest pushing forward the progress of interest rate marketization. This paper is different from these papers. Firstly, it introduces a particular type of participants in shadow banking, non-financial firms, which has rarely been studied in previous literatures. Secondly, many papers examine the shadow banking activities from the liability side: either the investment banks in developed countries or commercial banks in developing countries use the financial innovation instruments !!!!!!!!!!!!!!!!!!!!!!!!!!!!!!!!!!!!!!!!!!!!!!!!!!!!!!!!6! IMF!Global!Stability!Report.!
(ABCP, Repos, etc.) to finance long-term investments, and thus the shadow banking business are taken as the liability side on balance sheets; however, we study from an asset side, in which shadow banking business create extra income and staying as a form of asset on balance sheetss. Our paper investigates the shadow banking activities taken by non-financial firms in China. We define such kind of activities as “re-lending” business: non-financial firms borrow from banks or issue bonds to raise funds, and then re-lend to other non-financial firms rather than finance their own investments. Here the lending firms function as financial intermediaries, borrowing and lending simultaneously in order to earn interest margins. This is a complementary for present financial markets in China since many non-financial firms are highly credit-constrained and less likely to obtain bank loans or issue bonds to finance their projects. “Shadow banking usually comprises a diverse set of institutions and markets that, collectively, carry out traditional banking functions--but do so outside, or in ways only loosely linked to, the traditional system of regulated depository institutions” (Bernanke, 2012). The activities undertaken by non-financial firms are just this case, constituting a non-negligible but less regulated part of shadow banking sector in China. Re-lending business has two forms: entrusted loans and direct re-lending. The only difference is whether commercial banks stand out to grant loan (funds are provided by firms) instead. These two activities will be illustrated specifically in later sections. Our empirical analysis carries on along two lines: first, we try to identify the re-lending business, either from predictions of financing pattern or from the trace of fund flows based on the snapshot of financial statements; second, we analyze the potential factors to affect the extent of involvements in re-lending business for non-financial firms, including growth opportunities, shareholder information and credit constrains. The sample period covers 1990-2013, of which has two important time points. One is 2006, the deadline for solving related-party loans which has similar characteristics in balance sheets with re-lending loans; the other is 2010, after which regulation authorities gradually decontrol the lending activities between two non-financial firms. In the identification process, we first examine the relationship between financial assets and liabilities. Banks take deposits and make loans, leading to the same direction of movements in financial assets and liabilities. Re-lending firms function as banks and thus have a similar pattern, thus violating the pecking order theory. In contrast, non-financial firms raise funds externally through financial liabilities (either bank loans or securities) to finance investments, accompanied with usage of internal funds, leading to reverse directions of movements in financial assets and liabilities. Our results show that non-financial firms in China exhibit a significantly positive relation between financial assets and liabilities, implying participation of shadow banking activities. Meanwhile, the results over the subsamples of private firms, local SOE, central SOE, public enterprises and foreign firms show that the coefficients of state-owned enterprises and public enterprises are significantly positive but ones of private and foreign firms lose significance and even keep negative, indicating that shadow banking activities are more prominent in SOEs and public enterprises; the
results over the full sample adding ownership dummy variables support the prominence of SOEs. It also must be noticed that US firms conform to predictions of pecking order theory, financial assets and liabilities moving in opposite directions. Also we investigate the correlation between financial assets and business fixed investments, to dismiss the possibility that simultaneous increase in financial liabilities and assets is due to waiting for better timing of business fixed investments. In normal operation, firms match the timing of finance and investments carefully to avoid high opportunity costs of cash holdings at hand, so liquidity assets would be used and decrease when firms disburse the business fixed investments. In our empirical results, correlation between liquid financial assets and lagged business fixed investments changes from expectedly negative to positive after 2000, giving additional evidences about the existence of shadow banking activities. For better comparison, we run identical regressions using US firms over the same sample period, and find that US firms do not exhibit abnormal pattern like Chinese firms, the increase of fixed investment accompanied by decrease in liquidity assets. We also identify the re-lending business through the trace of fund flows in financial statements: loans flowing out and interests flowing in. Typically recorded in “other receivables”, re-lending loans are found pervasively in Chinese firms. The ratio of other receivables to total assets is about 3.9% in 2013, once reaching 20% before 20067. We explore the relationship between other receivables and financial liabilities, and find that they are significantly positively correlated even when we control free cash flow, trade receivables, ROA, leverage and size. 1 percent increase in financial debts is associated with 0.25 percent increase in scaled other receivables. The positive correlation is most prominent among central government owned enterprises and public enterprises. Interest income from re-lending business is partly recorded in “interest revenue”, but direct re-lending is often hidden in financial statements to evade law punishments. Usually these income flows into “non-operating income” or write down “financial expense”. We observe that other receivables keep a significantly positive correlation with other receivables throughout; meanwhile, the correlation between other receivables and financial expenses change from positive to significantly negative after 2009 even controlling on the amount of debts. These results indicate that some business allocated in other receivables decrease financial expense and increase non-operating income, confirming the existence of shadow banking activities indirectly. We add SOE dummy in all regressions and most results tell that SOEs are more active in re-lending business. For better identification, monetary policies are fetched into our analysis. Since policies are actually exogenous shocks to non-financial firms, the release of polices are not affected by non-financial firms but they do affect firms’ liquidity and financing patterns. Thus we run analogous regressions but introduce the state of financial market to identify the existence of re-lending business. We apply deposit reserve ratio, M2, and Shanghai interbank offered rate (SHIBOR) as monetary policy
!!!!!!!!!!!!!!!!!!!!!!!!!!!!!!!!!!!!!!!!!!!!!!!!!!!!!!!!7! Actually this figure underestimates the scale of re-lending business, as not all such business would be recorded in other receivables. But the underestimation just reinforces our conclusions, since the figures provide a lower bound.!
indicators, and use banks RMB loans and entrusted loans to measure the availability of funds for re-lending in financial markets. The inclusion of policy indicators does not change the sign and significance of coefficients of financial liabilities in previous analysis and thus reinforce our identification conclusions. Then we argue that tight monetary policies impede firms to engage in re-lending business and SOEs are hit more severely than non-SOEs. We also find that firms have more freedom to engage in shadow banking activities when bank loan capacity strengthens, but entrusted loans, a substitute of re-lending business for borrowing firms, play a negative impact on re-lending business. These all reveal that upstream available funds for lending firms from financial markets do affect the participation of non-financial firms in shadow banking. Furthermore, we extract the crisis period (2008 Q4 to 2010 Q4) to explore the impact of crisis and government stimulus plan. It’s concluded that 2008 financial crisis shrink the re-lending business but more proportion of funds that firm raised externally would flow into shadow banking activities. Further analysis is put on the potential factors affecting the extent of participation of non-financial firms: growth opportunity, ownership structure and external finance dependence. First, we show that other receivables are higher in low ROA firms before 2006 but keep a positive relation with profits afterwards, consistent with the findings that related loans occurred before 2006 are harmful to the operation of lending firms (Jiang, Lee, Yue, 2010) but re-lending loans generate considerable income; also we find that re-lending business are less likely to occur in growing firms, represented by high P/E ratio and rapid growth rate of total assets. Good investment opportunity would impede firms to engage in activities out of main business, and the adverse effect is more apparent in SOEs. Second, we examine the role of shareholders in shadow banking business. In China, large shareholders control a considerable proportion of enterprises; the mean of Block (the percentage of shares held by the largest shareholders) is about 39.5% over the sample period. Also institutional investors play important roles in recent years, taking a 25% proportion of shares around. The percentage of firm-year observations in sample for private firms, local government owned firms and central government owned firms are 41%, 34%, and 15% correspondingly. We show that Block and institutional investors do not support the participation of re-lending business in all sub-periods; the larger portion they control, the smaller other receivables are. Besides, state-owned enterprises are more active in engaging in re-lending business than private firms, consistent with the previous findings that the relationship between financial assets and liabilities is only significantly positive among central SOEs, local SOEs and public enterprises. Finally, we examine the impact of credit constrains. The results show that strong external finance dependence restricts the expand of re-lending business; trade credits provide more short-term liquidity, so firms in industries with high frequency of trade credits are more likely to engage in re-lending activities. But credit constrains are less binding for SOEs and thus the impact of industry external dependence on the amount of re-lending business is relatively trivial for SOEs. Overall, our findings describe a picture of shadow banking activities in non-financial
firms, identifying the existence and observing the influential factors. This paper has a close parallel with Shin and Zhao (2013), in which they also plan to examine the role of non-financial firms as surrogate intermediaries in emerging countries. It shows that firms in China and India have a same sign of changes in financial assets and liabilities, in contrast to U.S. firms, which conform to predictions of pecking order theory. But Shin and Zhao only focus on the correlation between financial assets and liabilities of all firms and observes the signs of coefficients, neither classify the firms participating shadow banking activity, nor investigate the determinants of re-lending behavior; moreover, one indicator is inadequate to confirm the existence of such activities, and we need more evidence to support the conclusions. Also our paper is closely tied to literatures on related-party loans. The lending behavior among non-financial firms is prevalent across emerging countries but always in terms of related-party loans. Actually, related loan is just one special form of re-lending business, maybe not in the purpose of earning interest income yet. The related lending mostly happens based on ownership structure or common managers; or even it’s an internal decision for cash flow across subsidiaries of a business group, in order to overcome market frictions (Khanna and Yafeh, 2005). A number of studies estimate the magnitude, economic consequence and determinants of related-party loans. Bertrand et al. (2002) find that Indian groups channel resources away from firms in which the controlling shareholders have relatively low cash flow rights to firms in which they have high cash flow rights. Buchuk et al. (2013) investigate “tunneling” using a dataset of intra-group lending in Chile, and find that firms that receive loans internally are small, capital-intensive firms with higher investment, leverage and return on equity than firms provide loans. Gopalan et al. (2007) argue that the intra-group loans are typically lent at zero interest rates. Also Lin et al. (2013) finds that related lending could avoid excessive reliance on outside lenders, especially banks. It’s an unsolved question whether receiver and providers of loans could benefit from this behavior. Therefore, it leaves large space for us to go deeply to examine the re-lending behavior, though not limited to related-lending. Besides, these literatures give directions on studying the features of involved firms, such as industry, ownership structure, etc. One paper that should be mentioned is Jiang, Lee and Yue (2010). It takes “other receivables” as measurement for tunneling related loans in China before 2006, which is also used in our paper to stand for a proportion of re-lending loans. Although many literatures focus on shadow banking, either empirically or theoretically, studies on Chinese shadow banking, especially on non-financial sector shadow banking activities, are very limited. Our paper has some contributions on present literatures. First, it adds to the studies of financial market developments in China, confirming that state-owned enterprises have easy access to financial markets and relatively high liquidity and thus have strong ability on engaging in shadow banking activities outside of main business. Second, it’s one of papers in the first wave to study shadow banking in emerging countries, and even focus on one type of shadow banking closely with real economy and beyond the financial industry. Third, it also adds to a strand of literatures studying the impact of monetary policies on shadow banking sector. Lastly, this paper gives some policy implications for shadow
banking; identification of prevalent existence of such activities should attract attention for regulators and re-lending business actually bring non-negligible risks to financial system though it helps credit constrained firms to raise funds to a certain extent; if parts of firms cannot repay the loans, a chain reaction will be set into motion in the whole economy. Looking ahead, we know that the motivation of re-lending business is the imperfection of financial system in China. As long as the underlying roots are not solved, more forms of shadow banking activities will emerge. We believe that these need more researchers’ work. The remainder of paper is organized as follows. Section 2 is the introduction of background information in Chinese shadow banking. Section 3 specifies the identification methodology and describes the data and summary statistics. Section 4 presents the empirical results. Section 5 concludes. 2. Background of shadow banking in China Shadow banking activities develop very fast and take various forms across countries. Although 2008 financial crisis interrupted the explosion progress of further securitization, a recent pickup in shadow banking activities in Euro area, United Kingdom has already emerged according to Financial Stability Board8. Emerging economies are also inevitably involved into the wave of developments of shadow banking, such as Southeast Asia countries and Mexico, but the growth in China stands out mostly. The rapid economic expansion, enormous wealth accumulation in private sector9 and less-developed financial markets co-exist in China. McCulley (2007) first defines this term from the aspect of participating entities: Levered-up financial intermediaries with liabilities perceived akin to bank deposits; FSB describes shadow banking as a system of credit intermediation that involves entities and activities outside the regular banking system, raising i) systematical risk concerns, in particular by maturity/liquidity transformation, leverage and flawed credit risk transfer, and/or ii) regulatory arbitrage concerns” (2011); but IMF introduces a new noncore liabilities approach from the aspect of “activity” itself rather than entities, and the funding resource could be banks or nonbank institutions.10 Using either FSB definition or IMF approach, the re-lending activities among non-financial corporations we’re interested are taken as part of shadow banking. In the advanced economies, the drivers of shadow banking referred often are demand for higher yields, regulatory arbitrage, and the role of complements with the existing financial system. Besides, capital stringency, term spreads, institutional investor growth, bank growth are all closely associated with the development of shadow banking. These factors are also applicable in emerging economies. The restrictions on interest rate of deposits and the implement of credit quota in Chinese banking system strongly motivate the growth of wealth management products and off-balance sheet
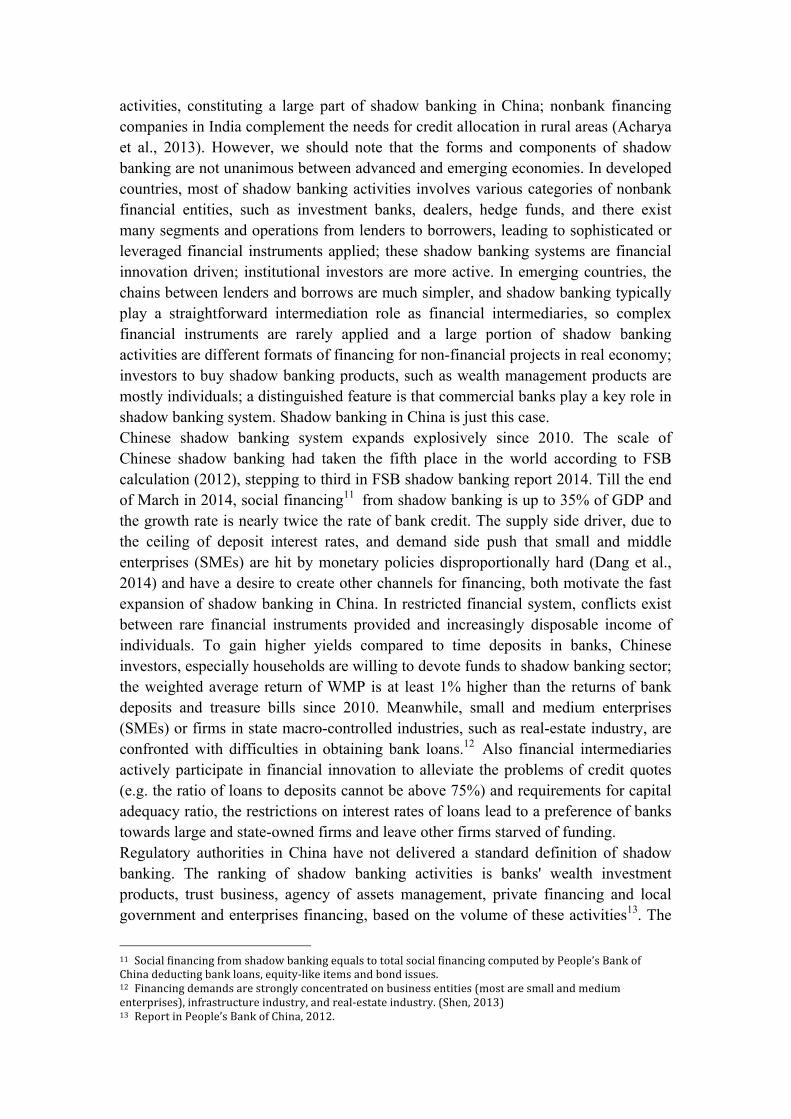
activities, constituting a large part of shadow banking in China; nonbank financing companies in India complement the needs for credit allocation in rural areas (Acharya et al., 2013). However, we should note that the forms and components of shadow banking are not unanimous between advanced and emerging economies. In developed countries, most of shadow banking activities involves various categories of nonbank financial entities, such as investment banks, dealers, hedge funds, and there exist many segments and operations from lenders to borrowers, leading to sophisticated or leveraged financial instruments applied; these shadow banking systems are financial innovation driven; institutional investors are more active. In emerging countries, the chains between lenders and borrows are much simpler, and shadow banking typically play a straightforward intermediation role as financial intermediaries, so complex financial instruments are rarely applied and a large portion of shadow banking activities are different formats of financing for non-financial projects in real economy; investors to buy shadow banking products, such as wealth management products are mostly individuals; a distinguished feature is that commercial banks play a key role in shadow banking system. Shadow banking in China is just this case. Chinese shadow banking system expands explosively since 2010. The scale of Chinese shadow banking had taken the fifth place in the world according to FSB calculation (2012), stepping to third in FSB shadow banking report 2014. Till the end of March in 2014, social financing11 from shadow banking is up to 35% of GDP and the growth rate is nearly twice the rate of bank credit. The supply side driver, due to the ceiling of deposit interest rates, and demand side push that small and middle enterprises (SMEs) are hit by monetary policies disproportionally hard (Dang et al., 2014) and have a desire to create other channels for financing, both motivate the fast expansion of shadow banking in China. In restricted financial system, conflicts exist between rare financial instruments provided and increasingly disposable income of individuals. To gain higher yields compared to time deposits in banks, Chinese investors, especially households are willing to devote funds to shadow banking sector; the weighted average return of WMP is at least 1% higher than the returns of bank deposits and treasure bills since 2010. Meanwhile, small and medium enterprises (SMEs) or firms in state macro-controlled industries, such as real-estate industry, are confronted with difficulties in obtaining bank loans.12 Also financial intermediaries actively participate in financial innovation to alleviate the problems of credit quotes (e.g. the ratio of loans to deposits cannot be above 75%) and requirements for capital adequacy ratio, the restrictions on interest rates of loans lead to a preference of banks towards large and state-owned firms and leave other firms starved of funding. Regulatory authorities in China have not delivered a standard definition of shadow banking. The ranking of shadow banking activities is banks' wealth investment products, trust business, agency of assets management, private financing and local government and enterprises financing, based on the volume of these activities13. The
re-lending activities among non-financial firms we study on just belong to the category of private lending. Although the scale of private lending is much smaller than WMP or trust business, it may influence both the stability of financial system and real economy. Financial frictions and imperfections in emerging countries are well documented in literatures. Allen et al. (2005) states that China performs poorly in the aspects of credit rights, investor protection and exhibits serious corruption, even though financial reforms have been taken these years. Firms in emerging countries are always confronted with financing constrains, especially for small and medium enterprises (SMEs) and private enterprises (PEs). In contrast with state-owned enterprises (SOEs), SMEs and PEs suffer discrimination in credit markets because of the following reasons: i) they cannot provide enough high-quality collaterals; ii) the credit history is so short that being regarded as high risks; iii) scale of loans for SMEs is relatively smaller than SOEs, so banks prefer to issue loans with a large sum based on the consideration of benefit-costs analysis; iv) central banks often apply some monetary policy tools, such as loan quota or loan to deposit ratio, to achieve its target, so these measures bring a credit contraction for some firms, commonly SMEs or PEs. Thus they cannot get access to the formal financing channel easily and then turn to informal finance or only rely on self-financing, even though these firms generate high profitability projects. SOEs could finance more than 30 percent of investment by banking loans while PEs only have less than 10 percent. (Song et al., 2011) This resource misallocation may impede the development of economy and leads to relatively low aggregate total factor productivity. To alleviate the financial constraints on SMEs and PEs, Chinese firms develop many financing channels either in banking sector or in shadow banking sector14. The first one is trust business, especially trust loans. Trust industry flourished since 1990s and expanded explosively after 2009. At the end of 2012, the percentage of trust funds devoted to infrastructure industry, real-estate industry and business entities are 23.6%, 9.9% and 26.6%15. Since many business entities are small and medium enterprises, it’s reasonable to conclude that trust funds support the development of credit constrained SMEs. But real-estate enterprise began to use trust loans as important financing channels after financial crisis, and the number of trust loans plan for real-estate industry has risen to more than 40 in 2012, amounting to 488 billion Yuan. Still the trust channel is limited for financing of credit-constrained firms in recent years since trust companies also rarely provide fund to young firms or private firms without high-quality collaterals and the new focus of trust is real-estate industry with continuous expansion in these years. The second channel is Wealth Management Product in credit category. This kind of WMP takes credit assets or entrusted loans as investment directions, appearing in 2006 for the first time. Banks issue WMP to raise fund from individual investors, and then invest the funds to trust loans plan executed by trust companies. These products develop very fast, the number of which grows
from 89 to 3345 over the period of 2006-2009. Yet this channel cannot sustain the growth and has limited help to alleviate the financial constrains. On the one hand, regulatory authorities began to notice the unitary credit WMP and China Banking Regulatory Commission (CBRC) closed the channel to issue loans through corporations between banks and trust companies since December 2010; on the other hand, investors buying WMP are mostly individuals in China, who are relatively risk-averse, motivating that the trust loans are basically delivered to high credit rating companies (or well-known companies) and firms backed by governments, rather than PEs or SMEs with prospective investment opportunities. The third and mostly related with our research channel is entrusted loans. This is one way of lending activities between two firms, permitted by laws. According to <Notice of People’s Bank of China on issues concerning entrusted loans by commercial banks> (2000), individual or enterprises are permitted to provide funds and then commercial banks issue loans instead. In the process, fund providers could appoint the fund receivers. Normally, a large firm with better access to bank loans re-lends these funds to another firm with strong credit constrain, while commercial banks stand out to grant the loans. Here the lending non-financial firms play a role of financial intermediaries, borrowing from banks and then lending to other non-financial firms, if they do not use their own funds to lend. This is one way of shadow banking activities conducted by non-financial firms. Although some local government authorities has restricted this business noticing of high risk brought since 2010, entrusted loans still develop explosively in recent years. The scale of entrusted loans increased by 2.55 trillion Yuan in 2013, taking the proportion of 28.6% of the increase in total social financing, and the total amount has risen 65% from 2011 to 2013, reaching 8.2 trillion Yuan. In 2013, the number of announcements from listed companies referred to entrusted loans amount to 39716. Some state-owned enterprises tend to lend excess cash holdings to other firms when borrowing from banks at a cheaper interest rate. The reasons lay behind the explosion of entrusted loans are twofold: direct bank loans face scale constrains and cannot meet the market needs; on the other hand, listed or state-owned companies with spare funds try to find high-yield investment channel. Some firms even drop part of normal operations to grant entrusted loans, in order to earn higher interest revenue because the interest rates of entrusted loans are considerable, sometimes over 20%. This channel partly solves the problem of indirect financing for SME and PE, but it has many limitations. Firstly, a large proportion of entrusted loans flow to real estate sector and local government financing platforms, rather than normal private or small firms with good investment opportunities; secondly, regulation authorities began to take serious notice for the risk brought by entrusted loans in 2014 and require the information of all entrusted loans to be recorded into the database of PRC, so this channel will face stricter regulation in following years. Therefore, although the above financing channels alleviate the financial constrains to an extent, one considerable source of funds for SMEs and PEs is private lending in shadow banking sector, containing the lending activities among firms or individuals !!!!!!!!!!!!!!!!!!!!!!!!!!!!!!!!!!!!!!!!!!!!!!!!!!!!!!!!16! Data!is!quoted!from!PRC!<China!Financial!Stability!Report!2014>.!
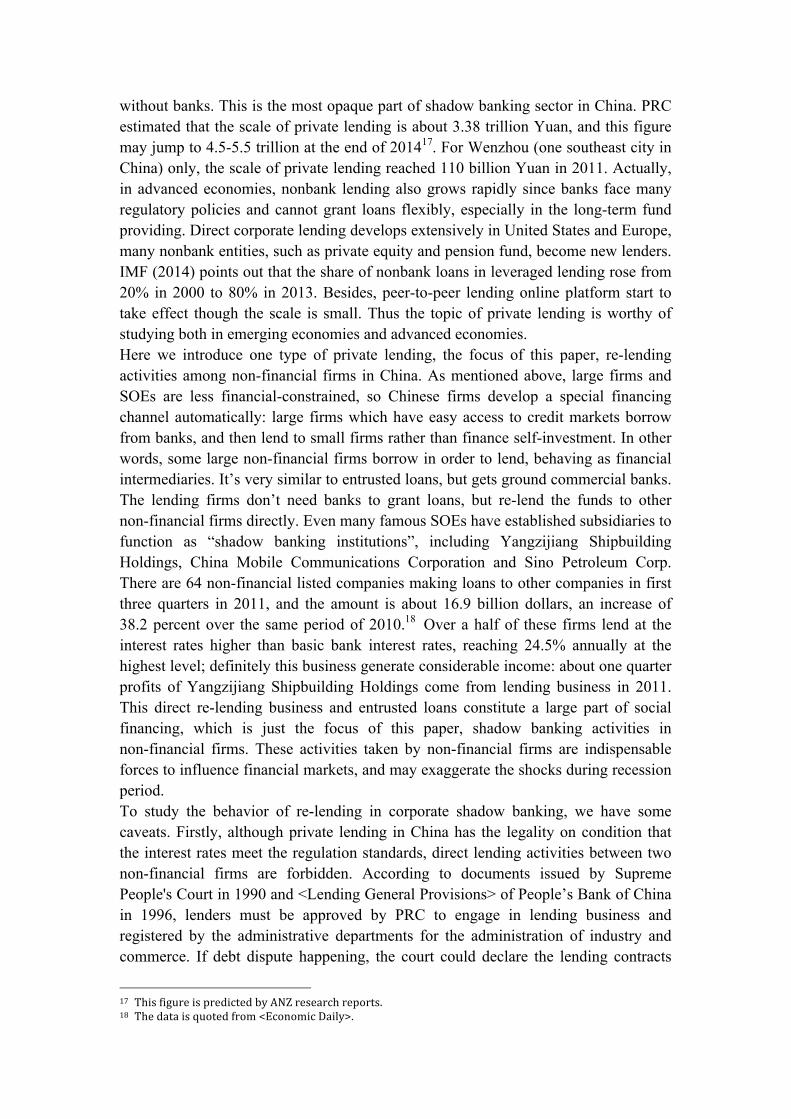
without banks. This is the most opaque part of shadow banking sector in China. PRC estimated that the scale of private lending is about 3.38 trillion Yuan, and this figure may jump to 4.5-5.5 trillion at the end of 201417. For Wenzhou (one southeast city in China) only, the scale of private lending reached 110 billion Yuan in 2011. Actually, in advanced economies, nonbank lending also grows rapidly since banks face many regulatory policies and cannot grant loans flexibly, especially in the long-term fund providing. Direct corporate lending develops extensively in United States and Europe, many nonbank entities, such as private equity and pension fund, become new lenders. IMF (2014) points out that the share of nonbank loans in leveraged lending rose from 20% in 2000 to 80% in 2013. Besides, peer-to-peer lending online platform start to take effect though the scale is small. Thus the topic of private lending is worthy of studying both in emerging economies and advanced economies. Here we introduce one type of private lending, the focus of this paper, re-lending activities among non-financial firms in China. As mentioned above, large firms and SOEs are less financial-constrained, so Chinese firms develop a special financing channel automatically: large firms which have easy access to credit markets borrow from banks, and then lend to small firms rather than finance self-investment. In other words, some large non-financial firms borrow in order to lend, behaving as financial intermediaries. It’s very similar to entrusted loans, but gets ground commercial banks. The lending firms don’t need banks to grant loans, but re-lend the funds to other non-financial firms directly. Even many famous SOEs have established subsidiaries to function as “shadow banking institutions”, including Yangzijiang Shipbuilding Holdings, China Mobile Communications Corporation and Sino Petroleum Corp. There are 64 non-financial listed companies making loans to other companies in first three quarters in 2011, and the amount is about 16.9 billion dollars, an increase of 38.2 percent over the same period of 2010.18 Over a half of these firms lend at the interest rates higher than basic bank interest rates, reaching 24.5% annually at the highest level; definitely this business generate considerable income: about one quarter profits of Yangzijiang Shipbuilding Holdings come from lending business in 2011. This direct re-lending business and entrusted loans constitute a large part of social financing, which is just the focus of this paper, shadow banking activities in non-financial firms. These activities taken by non-financial firms are indispensable forces to influence financial markets, and may exaggerate the shocks during recession period. To study the behavior of re-lending in corporate shadow banking, we have some caveats. Firstly, although private lending in China has the legality on condition that the interest rates meet the regulation standards, direct lending activities between two non-financial firms are forbidden. According to documents issued by Supreme People's Court in 1990 and <Lending General Provisions> of People’s Bank of China in 1996, lenders must be approved by PRC to engage in lending business and registered by the administrative departments for the administration of industry and commerce. If debt dispute happening, the court could declare the lending contracts
void. But the inter-corporations loan market is really large and promotes the development of financial system and real economy to an extent, regulation authorities begin to regulate this market and make these lending behavior legal gradually according to <Notice of the Supreme People's Court on Issuing the Several Opinions on Providing Judicial Guarantee and Services for Accelerating the Transformation of the Economic Development Mode> in 2010 and <Notice of the Supreme People's Court on Legally and Properly Hearing Cases on Disputes over Private Lending to Promote Economic Development and Maintain Social Stability> in 2011. Although laws don’t give clear statements whether lending contracts between non-financial firms are legal, lenders could take back principals and interests amounting to bank loan interests in the corresponding period if borrowers default in many lawsuits. So it’s reasonable to conjecture that re-lending business expand more after 2010. In our multivariate analysis, 2010 is also an important cutting year. Actually, entrusted loans in banks are special approaches of avoiding the regulation of direct lending activities among non-financial firms. Because of the illegality, firms do not record such business and put into clear accounting subjects in financial reports directly, so relevant data is limited. Hence, our research could only shed some light on the re-lending behavior using several indirect evidences. Secondly, what we plan to investigate is re-lending activities among non-financial firms, rather than related lending. The role of financial intermediaries played by firms is the focus. A strand of literature studies the inter-corporate loans, which is an agency problem that controlling shareholders may expropriate minority shareholders. For example, one firms lends to another firm with the same controlling shareholders or two firms are operated in one business group. The related lending is prevalent in emerging economies, and may hurt the interests of firms originating loans. The extent of related lending is correlated with corporate governance mechanism and the external economic environment development (e.g. Johnson, La Porta, Shleifer, and Lopez-de-Silanes, 2000; Djankov, La Porta, Lopez-de-Silanes, and Shleifer, 2008). But the re-lending business is not limited to companies with shareholder relationship; it provides another channel for companies possessing spare cash holdings to make more profits and also help high productivity but credit-constrained companies to obtain necessary capital. It’s a complement to present financing system. Also the efficiency and profitability of such a channel waits to be examined in this paper. These two types of lending in non-financial firms are recorded in balance sheets similarly but should have different economic consequences, so it’s necessary to distinguish them. Luckily, 2006 is a cutting year. In November 2006, eight government authorities jointly released announcements to clear related-party loans; if the loans were not solved till the end of 2006, management member would be arrested. Thus in the analysis, 2006 is a remarkable time point. 3. Methodology and data 3.1 Identification methods Being forbidden of direct re-lending business in non-financial firms in laws hampers the identification process, but we could still draw some indirect evidences based on
financial theories. In the theory of capital structure, firms could finance their investments in two ways: internal finance and external finance. Internal finance utilizes surplus fund generated from operations of firms, including retained earnings and depreciation and taking the forms of cash holdings and deposits on balance sheets. External financing is a way to raise funds from other entities outside firms, including bank loans, equity issues, bonds, and trade credit. A strand of literatures (Allen, 1993; Shyaßm-Sunder and Myers, 1999; Chirinko and Singha, 2003; Tong and Green, 2005; Huang and Song, 2006) studies the financing pattern in non-financing firms, preference of internal or external, bonds or equity. According to the influential “pecking order” theory (Myers, 1984), internal financing is the cheapest way, so firms prefer to employ internal funds and only tap the external funds in time of inadequate internal funds. For the purpose of our identification, we do not need firms strongly adhere to pecking order theory, but insist that internal financing is the first shot. And we will test the hypothesis in later parts. Based on the theory, the financial assets and financial liabilities on the balance sheets should be negatively correlated, capturing the movements of firms borrowing external funds and expending internal funds at the same time. When a firm intends to finance investments, it begins with a decrease in liquidity assets, such as cash holdings or bank deposits, and then it turn to borrow from banks or issue new bonds either because internal funds are inadequate or the firm plans to keep some liquid assets for daily operations. Then we should observe that financial assets decrease but liabilities increase, showing reversed signs. However, if firms are involved in shadow banking activities, which means they borrow in order to lend, then financial liabilities will not exhibit a negative relationship with financial assets, or even show a positive relationship because firms tend to re-lend a proportion of raised funds to other firms and keep left funds on the subject items of financial assets waiting for future usage. The financial intermediary function, the simultaneous borrowing and lending, definitely leads to a simultaneous increase in both cash holdings and debts. Likewise, one distinguished feature of banks is that they borrow in order to lend, and the increases in deposits are accompanied by increases in loans or stock of more securities. Thus non-financial firms with shadow banking business could be identified from sample firms based on the same signs of financial assets and liabilities. In the following analysis, we can observe a significant positive and negative association between financial assets and liabilities in China and U.S. correspondingly. Another identification method comes from Japan’s experience in 1980s. Non-financial firms in Japan conducted a “carry trade” to earn profits through issuing corporate securities in international market and depositing the raised funds into banks. Because Japan banking system liberalized the interest rates of time deposit at that time but the issuing costs of international securities are low, non-financial firms could earn money on the interest rate spread and change their roles vis-à-vis banks from debtor to creditor. Hattori et al. (2010) indicate the carry trade by the reverse correlation between liquidity ratio and business fixed investment. If non-financial firms operate normally, the liquidity ratio should be negatively correlated with lagged
business fixed investment, because the opportunity costs of cash holdings either from financial liabilities or internal funds are high and firms would arrange time matching between funds raising and business fixed investment. But these costs decrease if firms could deposit available funds into banks to earn interests, so that the correlation became loose and even vanish. There is a similar case in China. Firms are not necessary to worry about time mismatch if they could re-lend the surplus money to other firms. Thus we investigate the correlation between financial liquidity assets and lagged business fixed investment and show a significant change in correlation over the sample period. The re-lent loans on balance sheets of non-financial firms are always put into the subject of “other receivables” or “short-term investment” in China. But the balance sheets often do not provide details about “short-term investments”, and then we focus on “other receivables” for the analysis. “Receivables” have many categories in balance sheets, containing account receivables, current receivables, notes receivables and other receivables. But the constitutes of “other receivables” are complex, containing loans to employees and other companies, settlement amounts due for non-current asset sales, rent receivable, term deposits. These businesses are not ordinary transactions, and simple surveys of footnotes in financial statements could indicate that a proportion of other receivables are allocated to lending activities. But it should be noticed that other receivables only constitute a part of re-lending activities, maybe calling a lower bound, which reinforce conclusions of this paper. In normal operation of non-financial firms, the ratio of receivables to sales maintains a similarly stable trend, especially in the same industry. If firms exhibit a relatively high ratio over a certain period, compared to mean and median of the same industry both in China and in U.S., then it’s reasonable to conjecture that these firms are involved in shadow banking activities. Also the income flow from re-lending business is hidden on financial statements. Another measurement of re-lending business may be based on the trace of such income. According to account standards, the interest income from bank deposits are calculated under the subject of “interest revenue”, but the interest income generated from loans to other firms are not allowed to put in this subject of accounting. Some companies use the interest revenue to write down financial expense, and others allocate this type of interest income into “other operating income”. Thus we examine the relationship both between other operating income and other receivables and between financial expense and other receivables as robust checks. By analyzing the income generated from re-lending business, we may get some clues about the purpose of this business. There are two possible motivations: one is to keep close connections with some specific companies, such as upstream and downstream companies; one is to look for opportunities to earn more profits. Two motivations may lead to different performance of income, since former firms may charge very low or even zero interest rate on loans but the latter obviously charge higher interest rates. In our empirical results, a great change in the correlation between re-lending activities and profits takes place around 2006, in which year related loans are cleaned.
3.2 Sample description Our sample consists of 2549 companies in China during the period 1990-2013, constructing 32769 company-year observations. The firm level data mainly comes from Compustat Global database, supported by Standard & Poor’s financial services, which provides items of financial assets and liabilities, receivables and other fundamental financial variables. We also supplement the data by Wind database, providing the nature of companies, price, earning indicators, shareholder information and structure, institutional investors’ holdings. These two databases are merged using ISIN code19. Observations lack of necessary financial variables are dropped from the sample, such as cash and short-term investment, total receivables, PPE, etc. After the exclusion, the data consists of 2303 companies and 27417 observations.20 The selection of Compustat database for all interested balance sheet items is for comparisons across nations since the accounting standards and classification are consistent between Compustat Global and Compustat North America, which ensures the suitable application of U.S. industry level data to the same industry in China in the following analysis. Table 1
1990 to 2013 and the financial information in each year is quoted from the financial reports for last year. As what we’re interested in is the re-lending activities, the focuses are variables used in identification process. The table shows that the mean of financial assets and financial liabilities are 768.5 million and 1522 million Yuan, with large deviations. It’s also observed that the average of total receivables and other receivables deflated by total assets are 0.18 and 0.04 correspondingly. We also report some fundamental financial information of firms as control variables in empirical regressions: size, growth of total assets, sales, leverage, ROA and PE ratio. Since shareholder structure may influence the decisions whether to join the shadow banking, we also include some shareholder information. It shows that the proportions of local SOE, central SOE and PE in this sample are 34%, 15% and 42%, indicating that private firms are the most prevalent form. As expected, the mean of shares held by the largest shareholder (Block) is 0.39, occupying a large proportion of firms. And the average of shares controlled by institutional investors is 25.83%, even though China has not developed a mature financial market. Institutional investors often help to monitor the operations of firms and control the operating risk, so the proportion of institutional investors’ share may affect the implement of re-lending business. Besides, we also calculate the percentage of firms in which banks take a seat in ten largest shareholders because a close tie with banks leads to an easy access to financing and surplus funds for re-lending. 30% of 27417 firm-year observations show an ownership connection with banks. Figure 1 depicts the movements of financial assets and liabilities more clearly. Financial assets and liabilities are both scaled by sales and winsorized at 1% and 99% since sales exhibit large variations. The figure indicates that these two variables almost co-moved, contrary to the predications of pecking order theory. Figure 2 shows the trend of median business fixed investment growth rate (lagged one year) and liquidity financial assets scaled by sales. We observe a change in correlation between the cash holdings and the timing of business fixed investment. Before the turning point year 2000, liquidity assets held by non-financial firms exhibit a reasonable negative relationship with lagged growth rate of investment, but later the negative correlation vanished and these two variables become positively correlated except the financial crisis period. These two figures both give the directions for multivariate analysis in section 4.
Fig 1 The time series of financial assets and financial liabilities
Fig 2 Liquid financial assets and lagged growth rate of business fixed investment21
Table 2 presents the year-by–year mean across different natures of firms for total
receivables and other receivable, as a percentage of sales.22 According to Wind database, the sample firms are divided into seven categories: private firms, local government owned enterprises, central government owned enterprises, collective enterprise, public enterprises, foreign enterprises and others.23 For each year in table 2, the upper row reports other receivables and the lower row reports total receivables. The table gives some features of variation trends. First, private firms hold the highest ratio of receivables to sales and vary more. This may be partly due to a low bargaining power of private firms in markets and promote sales by more extreme ways. In 2013, nearly 40% of sales in private firms take the form of receivables. In contrast, state-owned firms operate more stable, less affected by external economic environment. Foreign firms also present relatively high ratios of receivables to sales, only after private firms. The reasons are similar and foreign firms try to establish their markets in China. In contrast, public enterprises show a most stable picture, followed by local SOE and Central SOE. Secondly, all kinds of firms experience a similar pattern with different extents over the sample period. Before 2000, either other receivables or total receivables maintain upward trends; from 2000 to around 2008, especially for 2005-2007, receivables declined continuously; after 2009, these two ratios become stable and even rise a little. The decrease during 2000-2008 may be due to the policies released by China Security Regulatory Commission (CSRC). From 2001, the commission requires listed companied to reduce loans lent to related parties, such as controlling shareholders, which are always fit into other receivables. The cleanup process of related loans in other receivables balance extended to 2006, ending with a joint announcement issued by eight government ministries. But receivables still has a large balance in recent years, and the upward trends in 2011-2013 should be explained by other reasons. We conjecture that the development of shadow banking in non-financial firms plays a role in the increase in receivables. Table 3 presents a summary of data across industries. Industries have their own features on the level of cash holdings, inventories, tangible assets and ways of payments; also some industries are more credit-constrained. These differences definitely affect the ability of re-lending in non-financial firms. From the table, we observe that service sector (e.g. art, entertainments, accommodation and food services) and real-estate industry have higher receivables, indicating that firms in these industries may tend to engage in re-lending business more. Besides, industries with higher trade credits and inventories, which stand for strong abilities of short-term financing, are always associated with higher receivable balances. This gives some insights about the relationship between credits constrains and re-lending activities. But the associations between external finance dependence and receivables or between tangibility and receivables are not clear in the univariate analysis, and we leave the question to next section.
Information 0.138 0.340 -506.5 0.210 0.317 0.390 Real Estate and Rental and Leasing
0.457 0.664 134.2 5.913 0.186 -0.235
Professional, Scientific, and Technical Services
0.231 0.449 151.5 0.383 0.216 0.705
Administrative and Support and Waste Management and Remediation Services
0.217 0.349 -17.48 0.309 0.341 0.154
Arts, Entertainment, and Recreation
0.235 0.359 0.101 0.586 0.238 0.161
Accommodation and Food Services
0.218 0.283 -4.833 0.0635 0.516 -1.348
Non-Operating Establishments
0.210 0.429 18.94 1.510 0.146 -0.891
4. Empirical Results 4.1 Identification of shadow banking activities in non-financial firms 4.1.1 financial assets and financial liabilities Though firms hide the information of re-lending business on financial statements, we still catch the activities through certain indirect methodologies illustrated in section 3. First, we examine the relationship between liquid financial assets and financial liabilities, to certify whether the increase of debts is devoted to real investments or to re-lending business. The setting of this model is referred to Shin and Zhao (2013). Panel A in table 4 presents the regression results of Chinese firms, including the interested financial liabilities scaled by sales, size, ROA, leverage, 2006 and 2008 dummies as independent variables. Financial assets stand for short-term investments and cash holdings, and financial liabilities equal to the sum of short-term debts and long-term debts. Size is calculated by log ratio of total assets, controlling the impact on relationship between financial assets and liabilities due to firm size; leverage is
equal to liabilities divided by assets; ROA controls profitability of firms. Adding 2006 dummy is for policy implication, the end of related loans in Nov 2006. 2008 dummy controls the financial crisis influence. The sign of coefficients on financial liabilities is our focus. The elaboration in section 3 has clearly shown that firms with normal operations should have a negative sign for this coefficient. Column 1 shows that financial assets are positive associated with financial liabilities at 1% significant level, indicating that these two variables co-move over the sample period. Column 2-4 reports that the significance and positive relationship is unchanged after including firm-level controls, firm and year fixed effects. Pecking order theory indicates that the increase of debts should be accompanied with decrease in cash holdings when financing investments. The contrary in regression results towards theory implication provides a basis for existence of unusual operation business. Firms face credit-constrains with different degree in China, so the reasonable explanation for holding the raised funds at hand rather than making business investments is the existence of other profitable opportunities. One may argue that holding the raised funds staying in the subject of cash holdings or short-term investments is in order to wait for a better timing to arrange business fixed investments. It should be noticed that the opportunity costs of holding funds are relatively high because of high interest rates charged by banks, so firms always have sufficient plans of investments before borrowing money. Besides, we would deny the possibility of waiting for investments by examine the relationship between liquid financial assets and business fixed investments (either lagged variables or growth rate) later; also we reinforce our conjecture that parts of borrowed funds are devoted to re-lending business by observing the co-movements of other receivables and financial liabilities. In column 5, we add the interaction term of financial liabilities and 2006-time dummy. Before 2006, related loans are prevalent in non-financial firms, so parts of surplus funds in firms may lend to related parties, such as controlling shareholders, which influence our identification results. The interaction term is used to catch the change of relationship between financial assets and liabilities. The coefficient of this interaction term is 0.073 at 1% significant level, indicating that financial assets are linked more closely with financial liabilities after 2006. In other words, even when firms are banned to lend related loans, an increase in financial liabilities is associated with a larger increase in cash holdings for uncommon use. The interaction term of financial liabilities and 2008 dummy in column 6 is to identify the effect of financial crisis. Still the coefficient of financial liabilities is positively significant and the association is closer after 2008. The results in panel A provide preliminary evidence for re-lending business. Here we interpret the positive relationship between financial assets and financial liabilities as the consequence of involvement of firms in re-lending business. For robust check, we should see opposite results in an economy in which the financial markets are frictionless and firms are less likely to finance investments from other firms. Thus to present the impacts of re-lending activities on balance sheets better, we do analogous analysis using data of the United States for comparisons over the same
sample period 1990-2013 in panel B. The coefficients of financial liabilities are significantly negative for the full sample in column1-2, presenting the obvious difference between Chinese and US firms. In column 3-6, we also divide the US data into subgroups for four quartiles based on total assets. Firms with size in quartile 2-4 all present negative relationship between financial assets and liabilities, conforming to the pecking order theory. The only exception is the smallest firms, but the explanatory power of the regression for the smallest firms is lowest. Combined with results for Chinese firms, the behavior pattern of US firms is quite different from Chinese firms, and there are no consistent co-movements of financial assets and liabilities in the United States. Non-financial firms in China exhibit distinctive feature of re-lending activities. Table 4
Dependent variables: log (finassets_sales) Panel A
Number of Firms 4,437 4,263 1,679 1,882 1,541 1,042
In China, large firms and state-owned enterprises always have better access to credit markets. Credit constrains with varying levels impact the availability of funds for re-lending, it’s hypothesized that less credit-constrained companies are more likely to engage in shadow banking activities. Columns 2-6 in panel A of table 5 show the regression results over the subsamples of private firms, local SOE, central SOE, public firms and foreign firms, and firms with different ownership behave differently. Surprisingly, the coefficient of financial liabilities become negative and insignificant in the subsample of private firms, indicating that private firms follow the predictions of pecking order theory and participated re-lending business less. Although the financial assets maintain a positive association with financial liabilities among foreign firms, the coefficient loses significance. In contrast, state-owned and public enterprises all keep positive coefficients at 1% significant level, of which central government owned firms are the most prominent. For central SOE, 1% increase in the ratio of financial liabilities to sales translates into 0.15% increase in liquid financial assets to sales ratio. These results are consistent with our hypothesis. On one hand, private firms face more difficulties in financing investments, compared to SOE, so that they lack of sufficient funds to re-lend to other firms; on the other hand, private firms have higher profitability and productivity growth than SOE (Nazrul et al., 2006; Dollar and Wei, 2007; Song et al., 2011, etc.), so the profits generated from re-lending business are not very attractive for private firms while SOE lack of good investment opportunities, inducing them to put eyes on business outside normal operations. For robust check, we also add interaction terms of financial liabilities with ownership dummy variables into regression using full sample to examine the ownership effect on firms’ behavior pattern towards re-lending business. The results are presented in panel B of table 524. First, we note that financial liabilities maintain significantly positive association with financial assets regardless of whether we add interaction terms, reinforcing the above conclusions. Then different ownership dummies interaction are included into regressions separately to distinguish their features. It’s observed that the interaction term of financial liabilities with SOE dummy shows a positive correlation with financial assets, indicating that an increase of same magnitude in financial liabilities generates a larger increase in financial assets in state-owned firms, compared with non state-owned firms. Conversely, column 2 shows that the
coefficient of interaction term with private enterprises dummy is significantly negative, indicating a relatively loose correlation between financial assets and liabilities in private firms subsample. The coefficients of interaction terms with public firms and foreign firms dummy variables are small and insignificant. The last column in panel B includes all interaction terms (except union firms and other firms) and still we find that private firms dummy interaction term weakens the correlation between financial assets and liabilities. These results are consistent with panel A: state-owned firms engage in re-lending business more deeply than private firms. Table 5
4.1.2 financial assets and business fixed investments This empirical method is applied to deny the possibility that fund raised from financial liabilities and staying in the form of cash holdings or short-term investments is waiting for better timing of investments. Hattori et al. (2010) and Bank of Japan (1991a) examine the 1980s bubble in Japan and highlights the transformation of some large non-financial firms from net debtors to net creditors to banks, integrated themselves into financial system. Large non-financial firms take bond markets as funding resources at low costs, and deposit the surplus in banks in form of time deposits with liberalized interest rates. This “carry trade” behavior is verified partly by the changes in correlation between liquidity ratio of non-financial firms and their business fixed investments. Similarly, the re-lending firms in China take bank loans or bonds as funding resources at low costs and lend to other firms to earn the carry-trade interest income. Thus it provides another identification direction for re-lending behavior. An increase in business fixed investments would lead to a decrease in cash holdings when firms operate normally: since liquid assets cannot generate considerable income but the interest rates of borrowed funds are relatively high, and hence the opportunity costs of holding idle funds are very high so that firms often schedule and match the time of borrowing money and disbursing investments very cautiously. In contrast, if firms borrow from banks, in order to lend rather than finance self-investment, obviously the relation between liquidity ratio and business fixed investment becomes weak or even reversed since firms are not necessary to match the timings of raising funds and disbursements for investments carefully to avoid high opportunity costs of cash holdings. Funds in financial assets could be re-lent to other firms to earn higher profits. Furthermore, restricted financial markets lead to a seller’s market for loans, so lending firms have the priority to decide the interest rates and terms. This advantage looses the relationship between business fixed investments and liquid financial assets further. Table 6 presents the regression results over different subsamples and the comparison between China and US. Without re-lending business, an increase in business fixed investments would induce a decrease in liquidity financial assets (e.g. cash holdings) definitely. US firms follow the nature pattern: column 4 shows that lagged business fixed investments keep a negative correlation with financial assets. Then we turn to examine the data for Chinese firms. In contrast, the coefficient of lagged business fixed investments is significantly positive over the whole sample period, indicating that firms’ internal funds are not used to finance investments. We observe from figure 2 that year 2000 is a turning point for the correlation between financial assets and fixed investments. Thus we also run analogous regressions over different sub-periods year-by-year and find that 2000 is indeed the cutting year. Thus we explore the change of the coefficients over 1990-1999 and 2000-2013 separately, and then observe that the increase of business fixed investments indeed lead to a decline in financial assets before 2000 but the correlation reversed subsequently. Over 2000-2013, 1% increase in business fixed investments leads to 0.02% increase in
financial assets. This change reinforces our conclusions, because non-financial firms are less likely to engage in re-lending business in 1990s but gradually did in recent years. For robust, we repeat the same analysis over same period 2000-2013 for non-financial firms in the United States. US firms still present negative correlation between financial assets and business fixed investments at 1% significant level. Taken together the identification results in step1, we know that non-financial firms in China keep a significantly positive correlation between financial assets and financial liabilities (a sharp contrast to pecking order theory) as well as a non-negative correlation between lagged business fixed investments and financial assets, indicating that firms use borrowed funds to behave as financial intermediaries rather than finance industrial investments. The combination of step1 and 2 in identification strongly support the existence of re-lending business. Table 6
Year and firm fixed effects Observations 24,261 3,394 20,867 49,137 23,553 R-squared 0.137 0.232 0.126 0.083 0.06 Number of firms 2,287 889 2,287 3,973 2,472
4.1.3 the trace of shadow banking on financial statements The above sections provide evidence of re-lending business from the pattern of financing behavior, and in this section we plan to support the conclusion by catching the trace of re-lending activities through subjects of financial statements. In China, lending between non-financial firms is not permitted and laws do not protect the rights of lender in such cases. But firms must reflect the cash flow of lending activities into financial statements, such as cash outflow of loans, cash inflow of the income generated from the loans. From simple surveys of footnotes in financial statements and investigations from employees in auditing institutes, we are suggested
that loans to other firms are always calculated into other receivables25 and interest revenues are used to write down financial expense or increase other operating income. Accordingly, we examine the correlation between financial liabilities and other receivables to confirm what fraction of funds collected would flow into re-lending business, and explore whether other operating income and financial expense would be correlated with other receivables which represent parts of re-lending activities. Table 7
Table 7 indicates that debts of firms are strongly positively associated with other receivables. In the regressions, we add free cash flow to control the availability of !!!!!!!!!!!!!!!!!!!!!!!!!!!!!!!!!!!!!!!!!!!!!!!!!!!!!!!!25! The!method!of!reporting!interVcorporate!loans!as!part!of!other!receivables!is!also!used!in!Ye!(2006)!and!! Jiang!et!al.!(2010).!
funds and the risk of re-lending, log ratio of total assets to control firm size effect, ROA for profitability and leverage for operating risks; after the inclusion of these factors, other receivables maintain a significantly positive correlation with financial liabilities. Even if we control the effects of trade receivables, which may has substitutable characteristics for the subject of other receivables, still 1% increase in log ratio of financial liabilities induces 0.26% increase in log ratio of other receivables at a significant level of 1%. The explanatory power of our model is relatively high, R2 up to 30%. In contrast, we could observe that the same model presents a very low explanatory power (R2 near to zero) when applying data of US firms in column 7 of panel A and the coefficient of financial liabilities is much smaller than the Chinese counterparts. The results across firms with different ownership follow the same pattern in the correlation results between financial assets and liabilities: Central government owned enterprises and public enterprises are more actively involved in shadow banking business. The central SOE have clear superiority to acquire bank loans and then re-lend to other firms; public firms lack block shareholders and thus ownership structure is relatively decentralized, so no actual controllers tend to prevent the engagement of non-core business. To distinguish the extent of relationship between other receivables and financial liabilities across ownership nature, we also report results of regression adding interaction terms with SOE dummy and PE dummy in panel B of table 726. Column 1 shows that state-owned firms obviously keep a tighter correlation between financial liabilities and other receivables, compared to non-SOEs. When divide the firms into private firms’ and other firms’ subsamples in column 2, private firms perform a relatively weak relation between financial liabilities and other receivables. These both tell that more proportion of raised external funds flow into other receivables in state-owned firms, and thus they are more engaged in re-lending business. This outcome is consistent with table 5, which indicating that private firms are less involved in shadow banking activities. One caveat to mention is that we focus the re-lending business devoted into other receivables in this paper, although lending firms may put the re-lent loans into other accounting subjects, such as short-term investments. But these subjects usually do not have subsidiary accounts and convergence trend intra-industries. Thus what we analysis is a lower bound for actual amount of re-lending business, instead reinforcing our conclusions. Then we turn to the trace of interest income generated from re-lending business. Table 8 and 9 show the regression results applying non-operating income and financial expense as dependent variables correspondingly. For clarifying the relationship between interests and other receivables, we divide into several sub-periods: 1990-1999, 2000-2005, 2006-2009 and 2010-2013. 2000 is a cutting year for the tests of pecking order theory and the results after 2000 is more reliable; 2006 is the end of related loans that generate very low interest income or lend at zero interest rate, distinctly different from re-lending business; and 2010 as a cutting year
is due to policy tendency towards inter-corporate lending after the release of some Notices both from central-government or local government authorities in 2010. Table 8
Dependent variable: log (Non-operating Income) Panel A
If the income of re-lending business definitely flows into non-operating income, these two should be positively correlated. We observe significantly positive coefficients of other receivables during all sub-periods, and the impact become stronger with time
going. The increase in non-operating income induced by 1% increase in other receivables doubles over the period 2009-2013 (the coefficients of other receivables climbs from 0.67 to 0.12), compared to 2000-2005, which is consistent with the growing up trend of re-lending activities these years. Similarly, to better explore the different patterns of firms across different ownership nature, we do analysis separately using subsamples of SOE and PE, as well as add interaction terms using whole sample. The results are presented in panel B of table 8. We could observe that the same increase in other receivables is associated with more increase in non-operating income for SOEs either in interaction term analysis or in subsample results, and the positive association is most prominent in local government-owned enterprises. The coefficients of Local SOE dummy and interaction terms of Local SOE dummy and other receivables are both significantly positive, while PE dummy exhibits a significantly negative impact. The hypothesis that SOEs tend to participate re-lending business more is supported again. Table 9
Dependent variable: log (financial expense) Panel A
Meanwhile, results in table 9 examining the correlation between other receivables and financial expense are promising. In general cases, other receivables have no clear connection with financial expenses, and when considering parts of other receivables come from debts there may be a co-movement pattern. But if some proportions of the interest income from re-lending business are used to write down interest expenses and the scale of re-lending business is large enough, we may observe opposite directions of these two, which is certificated by table 9. Column 1 reports a basic regression over the full sample and column 2-6 presents results over different sub-periods. The coefficients on other receivables are positive, and statistically and economically significant before 2006; the relationship becomes insignificant during 2006-2008. Notably, Ceteris paribus, 1% increase in log ratio of other receivables leads to unexpected 0.033% decrease in log ratio of financial expense over the period 2009-2013. In other words, the correlation between other receivables and financial expenses reversed after 2006. To avoid a spurious regression, we include financial liabilities as control variable in the model since financial expenses are mainly determined by the amounts of debts. The result, reported in last column of panel A in table 9, shows that the negative impact is robust to the control. The change from positive to negative correlations around 2006 may be exactly due to large amount of income from the upsurge of re-lending business in recent years and the endpoint of related incorporate loans. We also report results based on SOE and PE subgroup in panel B, but do not find obvious variations though the negative relationship holds in all subgroups. Although the results in table 8 and 9 cannot provide very solid evidences, the change in signs of relationship between other receivables and financial expense after 2009 indicates that some business allocated in other receivables decrease financial expense and increase non-operating income.
4.2 The role of policies in re-lending business To better exploit the mechanism of re-lending business, we examine the variation of such activities over different periods of policy changes and the impacts on relationship between financial assets and liabilities. Since monetary policies are mostly exogenous to non-financial firms but bring an undeniable force on firms’ following financing decisions, exploring the role of monetary policies provides a sidewise approach for better identification of re-lending business. We choose two kinds of policies: monetary policies and crisis response policies. The intuitions behind these policies are straightforward: the tight or loose monetary policies affect the available funds for re-lending business partly; the crisis response measures, especially four trillion RMB stimulus plan in 2008 financial crisis, have direct impacts on the liquidity of financial markets across industries. Since related loans are cleaned up from other receivables after 2006 and we consider the availability of data for monetary policies, this section applies 2007-2013 quarterly
data. Monetary policy indicators include deposit reserve ratio, M2 and Shanghai interbank offered rate (SHIBOR); also we quote social financing data to measure bank loans availability from People’s Bank of China for robustness. When PBC increases deposit reserve ratio, it’s regarded as tight monetary policy; when decrease, it’s as loose policy. When the growth rate of M2 decreases, it’s tight monetary policy; when increases, it’s loose. When SHIBOR increases, it’s a tight period; when decreases, it’s a loose period. Panel A and panel B in table 10 presents the impacts of monetary policies on variation of other receivables and the relationship between financial assets and financial liabilities correspondingly. First, we should note that inclusion of monetary policy indicators doesn’t change the sign and significance of the coefficients of financial liabilities in these two identification regressions. We add the dummy variables for tightness of monetary policy and the interaction term of these indicators with the key variables, financial liabilities. The results show that tight monetary policies represented by M2 and SHIBOR dummy variables impede the development of re-lending business, since we observe that other receivables decrease significantly and the relationship between financial assets and financial liabilities become loose when monetary policies are tight. The negative impact is logical: re-lending business is “re-lend”, so lending firms needs the upstream funds from banks or bond markets to lend; when market condition become tight, the amount of available funds for lending become less and thus re-lending activities are negatively affected. But one exception in table 10 is the positive impact of deposit reserve ratio indicator (“tight” in table 10) on other receivables (10 out of 12 regressions support the negative impacts). It shows that other receivables would increase when PBC increases deposit reserve ratio; in other words, the amount of re-lending business expands when bank loan capacity decreases. Meanwhile, the impact of tightness from deposit reserve ratio indicator on the relationship between financial assets and liabilities is still negative, consistent with M2 and SHIBOR. In other words, the proportions of raised funds flowing into financial assets become less in liquidity-lacking periods, no matter which monetary policy indicator we apply. Panel C presents the impacts of monetary policies in SOE and PE subgroups. Column 1-4 and 5-8 examine changes in the relationship between financial liabilities and other receivables and the relationship between financial assets and liabilities correspondingly, employing both M2 and SHIBOR measures. In general, SOEs are hit by tight monetary policies more heavily than PEs. Not only are the absolute values of coefficients of tight indicators and interaction terms in PE subgroup smaller than ones in SOEs, but also private firms increase, rather than decrease like other firms, the amount of re-lending business in liquidity-constrained period when applying M2 measure. The reasons behind may be embedded in the less extent of engagement of shadow banking activities among private firms. As we suggest above, the amount of other receivables would decrease because of less upstream funds available when authorities tighten credits; in contrast, receivables may increase for normal firms in credit squeeze because payments are possible to be in arrears from other firms. Also we explore the different patterns of SOEs and non-SOEs further by adding interaction
terms of ownership dummies and M2tight in panel D27, the same as in above sections. Though coefficients of interaction terms in some regressions are insignificant, all interaction terms with SOE dummy are negative while terms with PE dummy are positive, signaling that tight monetary policies attack the business of SOEs more vigorously. Table 1028
For robustness, we apply bank loan and entrusted loans data from social financing statistics to examine the impact of the upstream available funds on re-lending business. RMB bank loans represent the total amount of loans the society could obtain from banks; entrusted loans are a kind of substitute for direct loans between two firms, as illustrated in section 2. It’s reasonable to hypothesis: the more available bank credits the economy has, the more firms take re-lending business; the more entrusted loans are, the less direct inter-corporate loans are. In table 11, we observe that bank loans keep an expected positive correlation with other receivables and the relationship between financial assets and liabilities become tighter when banks loans increases. It suggests that the availability of upstream loans strongly positively affect the ability of re-lending activities for lending firms. When bank loans capacity strengthens, lending firms have more freedom to engage in shadow banking activities. We also find that entrusted loans have a significantly negative impact on other receivables. Entrusted loans are a legal substitute for firms’ direct lending and the interest rates of entrusted
loans could also be negotiated, so it’s a less risky and profitable channel for firms engaging in lending activities; obviously, an increase in entrusted loans is accompanied with a decrease in other receivables. But entrusted loans are also regulated, so it cannot substitute for the core re-lending business totally. Since the amounts of RMB bank loans represent condition of liquidity in financial markets and reflect the degree of tightness of monetary policies partly, the results in table 11 reinforce the conclusions from table 10 from an opposite direction, loose monetary policies motivate the development of re-lending business. Table 11
When considering the different patterns of SOE and non-SOE, we still run analogous regression in SOE and PE subsamples and add interaction terms of ownership dummies with bank loans in panel B of table 11. The comparison between column 1 and 2 reveals that the increase in re-lending business is larger in private firms than in state-owned firms, accompanied with an equal increase in bank loans. Besides, the coefficient of interaction term with SOE dummy is -0.064 at a 1% significant level; thus the growth rate of re-lending business in SOEs is slower than non-SOEs when bank release more credits, though both SOEs and non-SOEs boost the scale of business in credit-ease periods; but a decrease of bank loans would lead to a relatively
smaller decrease in SOEs. This finding is a little opposed to the results observed in table 10 in which SOEs are affected more seriously by tighten monetary policies. The difference may come from diversified channels of financing in SOEs: bank loans only represent a part of raised external funds, though relatively large. Chinese commercial banks always maintain kind relationship with SOEs, and thus the change in the amount of bank credits bring limited impacts; but monetary policies touch many areas, such as corporate bond market, from which private firms are more likely to be excluded. Combining all the channels together, the shocks to SOEs shall be more fiercely. In short, tight monetary policies impede the involvements of non-financial firms in re-lending business, probably through the availability of upstream funds that firms could obtain from banks or corporate bond markets. Table 12 Dependent variable: logorec_sales
Another time interval we’re interested is 2008 financial crisis period. During this period, the exports of Chinese firms are heavily attacked and many small firms bankrupted�export volume decreased by 8.2% in 2008 and total export and import volume decreased by 13.9%29 in 2009. The normal operations of firms face great
challenges and thus it’s reasonable to conjecture that re-lending business would shrink since firms devote most energy to maintain survival. But Chinese government launched four trillion RMB stimulus plan in Nov 2008, injecting more liquidity into markets. Large state-owned banks are suggested to help the implementation of the stimulus plan and thus expand credit supplies since 4th quarter of 2008. For firms in key industries focused by this government plan, they have better access to obtain bank loans. These two counteracting forces make the impact of crisis ambiguous. We add a crisis dummy variable into models, as well as the interaction term. We define 2008 Q4 to 2010 Q4 as crisis period because from 2008 Q4 the sign of recession in exports was just beginning and government launched the rescue plans in Nov 2008. Also the choice of ending quarter comes from the end of four billion plans. In table 12, we could observe that crisis dummy variable has a significantly negative correlation with other receivables, indicating that the scale of re-lending business had been reduced during the crisis period. But the interaction term with financial liabilities displays an opposites sign, which suggest that the relationship between financial liabilities and other receivables become tighter and an increase in debts induce more increase in other receivables. Combing these two results, it’s concluded that 2008 financial crisis shrink the re-lending business but more proportion of funds that firm raised externally would flow into shadow banking activities. Actually four billion stimulus plan is a form of loose monetary policies, so it should bring positive effects according to above analysis. Similarly, we examine the performance of SOEs and PEs separately, but find no obvious differences during the 2008 financial crisis period.
4.3 Ancillary tests In this section, we plan to explore cross-sectional factors that affect the participation of shadow banking business across non-financial firms. After confirming the existence of re-lending activities in Chinese firms, we are more interested in which kinds of firms tend to engage in such business. Above analysis has indicated that shadow-banking business are more prominent in state-controlled firms than in private firms, and we conjecture that this difference is due to better access of SOEs to financial markets and more profitable opportunities in private firms. Thus we are motivated to examine potential factors from three sides: firms’ growth opportunities and profitability, shareholder structure, and credit constrains and external finance dependence. The intuitions are straightforward: if a firm has many promising investments projects, it’s unnecessary to engage in such a forbidden-by-law business; also if a firm are more credit-constrained or lives in an industry with more external finance dependence, it may lack of sufficient funds to do such business; besides, shareholder structure, such as percentage of shares held by largest shareholder, definitely affect decision-making of normal operations. Table 13 provides a comprehensive analysis of growth factors affecting the involvement of shadow banking business. We apply other receivables scales by total assets as dependent variable. Growth and profitability factors include: ROA; P/E ratio; M/B ratio; growth rate of total assets; and profit growth; also we include log ratio of total assets to control size effect. PE ratio equals to a stock’s price divided by its after
tax earnings over 12 month period and signals market expectations; usually high PE ratio companies are regarded as high risk and growth companies. MB ratio equals to market value divided by book value, and a high MB ratio represents a better corporate image. Because government clears related-lending in other receivables in 2006 and related loans should have different influential factors, we divide our analysis into two sub-periods: 1990-2005 (column 1-4) and 2006-2013 (column 5-8) in panel A of table 1330. During 1990-2005, other receivables are higher for less profitable firms, and other growth factors have no obvious impacts on other receivables. These findings are consistent with conclusions in Jiang et al. (2010), indicating that tunneling through related loans is harmful to lending firms and related loans are higher in low ROA firms. They argue that this is an agency problem that controlling shareholders expropriate minority shareholders, since related-loans usually charge very low interest rates or even zero (Jian and Wong, 2010). However, the results during 2006-2013 provide a sharp contrast. Column 5 shows that coefficient of ROA shifts from significantly negative to significantly positive, and thus suggest that re-lending activities generate considerable income for firms, leading to a positive correlation between other receivables and profits. Column 1 and 5 also add PE ratio to differentiate its role during these two sub-periods; the coefficients of PE ratio turns from positive but insignificant over 1990-2005 to significantly negative over 2006-2013. In other words, firms with higher PE ratio are less likely to engage in re-lending business. This result is consistent with our hypothesis: if a firm owns better growth opportunities, it’s not necessary to participate such kind of non-operating business. Results in column 7 also confirm this hypothesis: re-lending business is more pervasive in firms with slower growth rate. Column 6 adds MB ratio and size and shows that firms with higher MB ratios and smaller size are more likely to participate re-lending activities. Column 8 suggests that profit growth has ignorable effect on the level of other receivables. Overall, the results in table 13 signify that fast-growing companies tend to focus on main operations and are less involved into re-lending business. The role of ownership nature is also necessary to be examined. Panel B presents the results of sub-samples and full sample with interaction terms over 2006-2013, the same as above analysis. We observe that the negative impact of PE ratio only happens in SOE subsample, especially central SOE group, but is ignorable in PE group. The interaction term with SOE dummy appear with a negative coefficient, indicating that shadow banking activities of SOEs are more likely to be adversely affected by growth opportunities. These results are promising since they are consistent with previous conclusions: section 4.1 has shown that central government owned enterprises present closer relationship between financial assets and financial liabilities, and are taken as the most prominent group to engage in re-lending business. Thus it’s reasonable to see a heavier blow to the re-lending business of SOEs when there are many profitable investments in the waiting list; after all, the involvement of private firms in such
business is limited, so that the influence of either exogenous or endogenous shocks is limited. To explore the impact of shareholder structure, we add Block (percentage of shares held by the largest shareholder), ins (shareholdings of institutional investors), and SOE dummy in models. Similarly, sample period is divided into two sub-periods: 1990-2005 and 2006-2013, and results are presented in Columns 1-4 and 5-8 of table 14 correspondingly. Through comparisons we could make several interesting findings. Column 1 and 5 show that Block has a negative relation with other receivables after controlling ROA, size and leverage in both sub-periods. Even though re-lending business may bring considerable profits, large shareholders are unwilling to participate it. The results are robust if we use shares of ten largest shareholders as independent variable, and the impact holds even including all other shareholder structure variables we’re interested. This negative effect may be due to risk imbedded in lending activities and large shareholders intend to guarantee their vested interest in normal operations. Likewise, shareholdings of institutional investors are significantly negative with re-lending business in either period (column 3 and column 7). Institutional investors are always taken as one effective way of external corporate governance and motivate a relatively transparent disclosure. The results indicate that institutional investors tend to avoid investments in firms highly involved in re-lending business. Besides, column 6 confirms that government controlled firms engage in re-lending business more after 2006, but this tendency is unclear in previous periods. These findings are consistent with the facts that state-owned firms have low productivity but better access to credit markets (Song et al., 2011), and also conform to analysis in Hsieh and Klenow (2009) saying that productivity and profitability of SOE has increased steadily in recent years. After all, re-lending business creates a new profit point for state-owned firms. Column 8 displays a larger effect exists in local government-owned firms though two SOE dummies are both significantly positive. Besides, we add bank dummy (it equals to one if any bank seats among ten largest shareholders; else, zero) to examine whether bank relation help firms to develop re-lending business, but no obvious effect exists. To engage in re-lending business, non-financial firms should have abundant free cash flows or reliable fund-raising channels, or the normal operations of main business may be affected. Table 15 presents the impact of credit constrains and external finance dependence on re-lending activities. We apply four indicators: EFdepedence, Inven, Tangibility and TrCredit. These measures represent different aspects of financial vulnerability of firms. EFdependence is calculated as capital expenditure minus the sum of cash flow from operations plus decrease in inventories and increase in payables divided by capital expenditure; it identifies external funding requirements for long-term projects. Inven equals the ratio of inventories to sales and presents the duration of production cycle and needs for short-term funds; Tangibility is calculated by tangible assets with the share of net plant, property and equipment in total book-value assets, and this measures the scale of assets firms could put as collaterals to raise funds. TrCredit is defined as change in account payables divided by change in
total assets; trade credit is one form of complementary for formal credit channels31. The calculation of these measures adopts data from North America Compustat database for all U.S. firms and is based on year-by-year industry median. We select U.S. firms as proxy rather than applying Chinese firms data directly for several considerations. U.S. firms operate more closely to steady-state equilibrium and financial markets have fewer frictions, so the data could reflect the external finance demands for each industry purely in absence of binding credit constrains. Table 15 provides regression results over 2006-2013 since re-lending activities are more prominent during this period according to above analysis. Column 1-4 present the impact from one of four measures of industry credit constrains separately. As expected, columns 1 and 5 (external finance dependence indicator, and trade credit indicator) show that re-lending business are less active for firms in more external finance dependent industries. The more external funds the industry demands, the fewer other receivables are, and the negative correlation is economically and statistically significant. Thus abundant cash flows are necessary to participate shadow-banking activities and more long-term projects impede firms to engage. Conversely, more trade credits promote the grow-up of re-lending business (column 4 and 5). TrCredit characterize the pattern of trade credit in certain industries and high balances in TrCredit provide part of short-term funds for firms. Obviously firms are less constrained to re-lend if they are less liquidity constrained. However, ratio of inventories to sales and tangibility are not related to involvement of firms in re-lending. When examining the role of credit constrains in SOE and PE subsamples respectively, we surprisingly find that coefficients of all four credit constrain measures are insignificant among state-owned firms but private firms keep a similar pattern as full sample exhibits. It suggests that the external finance dependence or credit constrains of corresponding industries have trivial impact on individual state-owned firms. To confirm the different pattern further, the interaction terms of external finance dependence indicator and trade credits indicator with ownership dummies are included. The results are supportive since the coefficient of interaction term with SOE dummy is significantly negative. Even more trade credits motivate the development of re-lending business in all sub-groups, the extent is smaller in state-owned firms. Overall, firms are more likely to engage in re-lending business if they are state-owned firms, have less growth opportunities and more concentrated shareholders, and operate in industries with less external finance dependence and high frequency of trade credit. One concern may come from the accuracy of other receivables as measures of re-lending business. Some segments of other receivables are not related with re-lending business. If we subtract US industry median of other receivables from firm level data32, similar results could be observed. Firms with more investment opportunities are less involved. Referring to ownership nature, state-owned firms are
5. Conclusions This paper presents evidence that shadow banking activities, or called re-lending business, are prevalent across non-financial firms in China. Firms don’t conform to predictions of pecking order theory that changes in financial assets and liabilities tend to keep opposite directions when internal and external funds are both applied in the timing of financing. The engagement of re-lending business leads to a simultaneous increase in financial assets and liabilities because firms behave as financial intermediaries in such case. Also the non-negative correlation between liquidity financial assets and lagged business fixed investments, showing that spare funds staying as cash holdings wait for usage other than financing investments, further supports the existence of re-lending business. We find that financial liabilities always remain a significantly positive relationship with other receivables, in which re-lending business is typically recorded, indicating that the part of raised external funds indeed flow into re-lending loans. Besides, an increase in other receivables will lead to an increase in non-operating income and a decrease in financial expenses, two of which stands for the interest income from re-lending business, after 2006. We should also notice that state-owned enterprises participate more prominently in our identification process. For robustness, we introduce exogenous monetary policy indicators into our analysis, and find that the signs and significance of all identification results are consistent and tight monetary policies impede firms to engage in re-lending business yet. These identification results all support the prevalence of re-lending business over the sample period. We examine the factors affecting the extent of participation in re-lending business for non-financial firms. We show that firms with prospective growth opportunities are less likely to re-lend loans; the business generates considerable income after 2006, in contrast to the adverse effect of related-party loans on firms’ profitability in previous periods. We also find that large shareholders and institutional investors do not favor the engagement of re-lending business, but state-owned enterprises show stronger tendency to be involved, maybe due to relatively sufficient funds resources and less investment opportunities in main business. Finally, we observe that external finance dependence restricts firms to go in for re-lending activities since strong external finance represents longer period of turnover of cash flows; meanwhile, trade credit provide more short-term liquid for firms, promoting the developments; still the results
show that state-owned enterprises are less affected by industry external finance dependence. The development of re-lending business has some positive impacts on Chinese financial system. First, it provides alternative financing channel for SMEs, which starve of funding in normal finance sector, and thus promote the growth of private business. Second, it solves part of information asymmetry during the process of granting bank loans in that firms usually lend to the familiar borrowing firms and frequently have dealings with each other, so lending firms get a relatively clear picture of the borrower, compared with bank. Besides, the negotiated interest rates on re-lending loans may provide a platform for testing liberalization of interest rate in China, promoting the marketization of financial system. But it should be noted that the re-lending business is out of regulation and bring potential risks into financial system, government authorities are expected to pay attention to these business. Though we describe an image of shadow banking activities in non-financial firms, it’s just the tip of iceberg in Chinese shadow banking sector. These activities are actually motivated by regulatory policies and immature financial markets, so more forms of similar activities will emerge continuously as long as these issues are not resolved. We may conjecture that entities locating in tight regulation areas are more likely to participate in various types of shadow banking activities, waiting for future studies. Furthermore, the economic consequences and risks brought by financial intermediaries activities beyond financial industry need to be examined for future researches, either empirically or theoretically; re-lending of funds among non-financial firms may improve the micro-level capital allocation and eliminate the financial frictions in a certain extent, since capital are possible to flow into firms with high productivities and more investment opportunities. But the risks cannot be ignored since they’re financing activities directly in real economy. At another level, monetary policies should be taken into considerations. Tight and loose monetary policies generate different market conditions for the development of shadow banking activities through distinct transmission mechanisms; conversely, the development of shadow banking business may influence the effectiveness and process of normal monetary policy transmission mechanisms, which leave for future studies. Reference Arteta, C. O., M. Carey, R. Correa and J. D. Kotter (2013). "Revenge of the Steamroller: ABCP as a Window on Risk Choices." FRB International Finance Discussion Paper(1076). Acharya, V. V., P. Schnabl and G. Suarez (2013). "Securitization without risk transfer." Journal of Financial economics 107(3): 515-536. Adelino, M. (2009). "Do investors rely only on ratings? The case of mortgage-backed securities." Job Market Paper, MIT Sloan School of Management and Federal Reserve Bank of Boston. Ashcraft, A. B., P. Goldsmith-Pinkham and J. I. Vickery (2010). "MBS ratings and the mortgage credit boom." FRB of New York Staff Report(449).
Buchuk, D., B. Larrain, F. Muñoz and F. Urzúa (2014). "The internal capital markets of business groups: Evidence from intra-group loans." Journal of Financial Economics 112(2): 190-212. Fahlenbrach, R. and R. M. Stulz (2011). "Bank CEO incentives and the credit crisis." Journal of Financial Economics 99(1): 11-26. Gennaioli, N., A. Shleifer and R. W. Vishny (2013). "A model of shadow banking." The Journal of Finance 68(4): 1331-1363. Gopalan, R., V. Nanda and A. Seru (2007). "Affiliated firms and financial support: Evidence from Indian business groups." Journal of Financial Economics 86(3): 759-795. Gorton, G. and A. Metrick (2012). "Securitized banking and the run on repo." Journal of Financial Economics 104(3): 425-451. Hachem, Song (2015). “The rise of China’s shadow banking system.”. Unpublished paper. Jiang, G., C. M. Lee and H. Yue (2010). "Tunneling through intercorporate loans: The China experience." Journal of Financial Economics 98(1): 1-20. Kacperczyk, M. and P. Schnabl (2013). "How Safe are Money Market Funds?" The Quarterly Journal of Economics. Khanna, T. and Y. Yafeh (2005). "Business groups in emerging markets: Paragons or parasites?" ECGI-Finance Working Paper(92). Krishnamurthy, A., S. Nagel and D. Orlov (2014). "Sizing Up Repo." The Journal of Finance 69(6): 2381-2417. Lin, M., N. R. Prabhala and S. Viswanathan (2013). "Judging borrowers by the company they keep: friendship networks and information asymmetry in online peer-to-peer lending." Management Science 59(1): 17-35. Myers, S. C. (1984). "The Capital Structure Puzzle." The Journal of Finance 39(3): 574-592. Ricks, M. (2010). "Shadow banking and financial regulation." Columbia Law and Economics Working Paper(370). Shin, H. S. and L. Zhao (2013). Firms as surrogate intermediaries: evidence from emerging economies, working paper, December. Singh, P. and B. Kumar (2012). "Trade-off Theory vs Pecking Order Theory Revisited Evidence from India." Journal of Emerging Market Finance 11(2): 145-159. Song, Z., K. Storesletten and F. Zilibotti (2011). "Growing like china." The American Economic Review 101(1): 196-233. Tong, G. and C. J. Green (2005). "Pecking order or trade-off hypothesis? Evidence on the capital structure of Chinese companies." Applied Economics 37(19): 2179-2189. !!
Appendix A Pecking order theory tests for Chinese firms A strand of literatures has tested the validity of pecking order theory in China (Ni and Yu, 2008; Tong and Green, 2005; Huang and Song, 2006). Usually the focus of these papers is on the capital structure and financing patterns, and alternative theory is trade-off hypothesis. Pecking order theory is proposed by Myer and Majluf (1984) based on asymmetric information, suggesting that there is no optimal debt ratio and firms prefer internal financing to external financing, debt preferred to equity when external funds are necessary. In contrast, trade-off theory requires firms to tradeoff benefits and costs of debts and suggests that similar firms should have close debt ratios. In this paper, we use the unusual positive correlation between financial assets and financial liabilities and non-negative correlation between business fixed investments and financial assets to clarify the existence of re-lending business, and one prerequisite is that firms should use internal funds when they finance investments. This assumption partly conforms to the prediction of pecking order theory: firms only tap external funds when internal funds are insufficient. But we don’t require Chinese firms to follow the financing pattern of pecking order theory and what we only need is internal funds are used (either partly or nearly all as pecking order theory predicts) when firms disburse real investments. Also we don’t care about the preference between debt and equity. For more convincingness, we still test the pecking order theory among Chinese firms in the appendix. In previous literatures, there are two directions for test: one is basic test, based on financial deficits are directly linked with debt and leverage; the other one focuses on determinants of capital structure. Here we repeat these two methods to specify that Chinese firms do not violate pecking order theory after 2000. The basic method is to test the following hypothesis: ∆! = ! + !!"# + !; !ℎ!"!!!"# = !"# + ! + ∆! − !"Here, ∆! is change in outstanding long-term debt in Shyam-Sunder and Myer’s model. But Ni and Yu (2008) suggest that Chinese firms prefer short-term debt as the main tool for financing, and thus we follow their instructions, applying change in total liabilities as ∆!. DEF is fund deficit of each firm; DIV is cash dividends, X is capital expenditure, ∆! is change in working capitals, and C is operating cash flows. According to pecking order theory, the coefficient ! should be equal to 1 since one-dollar fund deficit induce one-dollar increase in debt. Table A Dependent variable: delta_liabilities
R-squared 0.074 0.124 0.073 Number of firms 2,545 948 2,545
Table A present the test results. We observe that over the whole sample period 1990-2013 the coefficients of fund deficit are 0.322 at 1% significant level. Then we run analogous regressions over different sub-periods year by year, and find that 2000 is a cutting year. Before 2000, the correlation between fund deficit and liabilities are significantly negative, suggesting an obvious violation of pecking order theory; but after 2000, fund deficits keep a co-movement with change in liabilities. Although the coefficient is not equal to 1, it’s still significantly positive and we cannot reject the zero hypothesis. After all, the requirement of 1 is the strictest form of pecking order theory; in reality, it’s impossible for firms to draw external fund all from way of debt financing. Thus the results show that Chinese firms do not violate predictions of pecking order theory after 2000. This conclusion is consistent with Huang and Tong (2006) over the period of 1994-2003 and Tong and Green (2007) over 2001-2003. Meanwhile, Ni and Yu (2008) find that larger firms follow pecking order theory but smaller firms do not. Then we test pecking order theory from determinants of capital structure. We include some classical determinants into regressions: ROA, size (log ratio of sales), growth (growth rate of total assets) and cash dividends. According to predictions of pecking order theory, ROA, size, growth and cash dividends should have a negative, negative, positive and positive sign correspondingly. We divide full sample into different subgroups: 2000 is the cutting year for basic tests of pecking order theory, 2006 is the ending year for related loans and after 2009 the crisis has less impact and inter-corporate loans have more freedom. We could observe that most signs are consistent with expectation: profitability has a negative relationship with leverage; larger size induces more asymmetric information and more difficulty in obtaining external funds. But it’s noted that cash dividends are only significantly positively correlated with leverage over 2009-2013. It’s nature that more cash payments for dividends lead to more fund deficits, and then more leverage; the negative relationship between cash dividends and leverage before 2009 is confusing. Combing all the test results together, we still could conclude that non-financial firms in China do not violate pecking order theory, and especially evidence strongly supports pecking order hypothesis after 2009, the most important period during which we examine the re-lending business between firms. Table B
Appendix B Definitions of variables Variables Definitions Financial assets Cash holdings and short-term investments Financial liabilities Short-term debts + long-term debts Business fixed investments Increase (decrease) in net property, plant and equipment Size Log ratio of total assets Growth Growth rate of total assets Leverage Liabilities/Total assets Block Percentage of shares held by the largest shareholders Public enterprises (pub e)33 No actual controllers Local SOE Actual controllers are local governments. Central SOE Actual controllers are central governments. Private firms (pe) Actual controllers are individuals. Foreign firms (fe) Actual controllers are foreign entities. Tight Dummy variable, increasing deposit reserve ratio is 1,
else 0. M2tight Dummy variable, if the growth rate of M2 decrease, it’s
equal to 1, else 0. Shibortight Dummy variable, it’s equal to 1 if 30 day weighted
Shanghai interbank offer rate increases, else 0. PE ratio Price/earnings MB ratio Market value/Book value Institute (ins) Percentage of shares held by institutional investors EFdependence (Capital expenditure - cash flow from operations -
decrease in inventories - increase in payables) / capital expenditure
Inventory (inven) Inventories/sales Tangibility Tangible assets with the share of net plant, property and
equipment / total book-value assets TrCredit Increase (decrease) in account payables / increase