Page 1
Shahla H. Ali et al JMSCR Volume 03 Issue 05 May Page 5466
JMSCR Volume||03||Issue||05||Page 5466-5478||May 2015
An Investıgation of the Left Ventrıcle of Human Heart by Fluıd-Dynamıcs
Modelıng
Authors
Shahla H. Ali1, Abdulkadir YILDIZ
2 and Salih M. Atroshey
3
1Medicine faculty, Duhok University
2Department of Physics , Kahramanmaraş Sütçü Imam University
3Duhok Technical Institute , Duhok Polytechnic University.
www.jmscr.igmpublication.org Impact Factor 3.79
ISSN (e)-2347-176x
ABSTRACT
In this study an echocardiography device in Azadi Scientific Hospital of Duhok, Kurdistan - Iraq has been
used to mesure the Left Ventricle (LV) wall thickness of three Patient groups: control (19 patients), smoking
(15 patients) and asthma (9 patients) using a simulation method based on Computational Fluid Dynamics
(CFD). The study is based on the design of a computational model of the human Left Ventricle using specific
data (IVSd, LVIDd, LVPWd, IVSs, LVIDs and LVPWs) taken from the 2D M-mode echocardiography of
selected groups. However, the phase diastole data are used to simulate blood flow inside LV by ANSYS
FLUENT V14 based on CFD technology and the information have been used to build a numerical mesh for
CFD simulation which provides detail 2D LV velocity and pressure distributions in the LV cavity. Finally,
the data for the three groups are analyzed by SPSS V1 to observe how the diseases can affect on the LV two
phases (systole and diastole) parameters. The effects of the diseases (asthma, smoking and control), of the
Age , of the Sex and of the Body Mass Index (BMI) have been observed.
Keywords: Computational Fluid Dynamics (CFD), LV modeling, ANSYS FLUENT V14,M-mode echo,
Asthma, Smoking, LVwall thickness .
Page 2
Shahla H. Ali et al JMSCR Volume 03 Issue 05 May Page 5467
JMSCR Volume||03||Issue||05||Page 5466-5478||May 2015
Introduction
Heart is one of the most important organs located
in the chest of human body, located just behind
and slightly left of the breastbone. The heart
consists of four chambers, the two upper atria and
the two lower ventricles. The Left Ventricle is the
strongest chamber pumps blood with rich oxygen
to the rest of the body. However, the cardiac cycle
is divided into two main phases; the diastole
which is the ventricular filling phase, and the
systole that is the ventricular contraction phase as
seen in Fig 1.[1]
.
Figure 1. Two main phases of cardiac cycle: the
diastole and the systole phases [2]
The left ventricle is one of four chambers of the
heart. It is located in the bottom left portion of the
heart below the left atrium, separated by the mitral
valve [3]
. In the diastole phase, the heart ventricles
are relaxed and the heart fills with blood. In the
systole phase, the ventricles contract and pump
blood into the arteries. The fourth heart sound is a
soft sound due to an increase in the ventricular
pressure following an atrial systole. The pressure-
based coupled algorithm is an important milestone
in the development of the FLUENT solver, as it
provides the user with a modern, fully coupled
solution approach that is suitable for a wide range
of flows [4 & 5]
. Kronik et al. Arnett et al., Kühl et
al. and Gottdiener et al. [6,7 and 8]
defined M-mode
images which are a continuous 1-dimensional
graphic display and can be derived by selecting
any of the individual sector lines from which a 2D
image is constructed. M-mode echocardiography
is used to estimate chamber volumes and Left
Ventricular (LV) mass when those structures are
geometrically uniform.
Long et al. [9]
demonstrated a subject specific
approach for simulating blood flow within a LV
by a combined analysis of Computational Fluid
Dynamics (CFD) and Magnetic Resonance
Imaging (MRI). The Navier-Stokes equations for
3D time-dependent laminar flow with moving
walls were solved using a finite-volume based
CFD solver CFX4. Furthermore, Khalafv and et
al. [10]
demonstrated a quantitative assessment of
LV conditions in normal and patients with
myocardial infarction using ANSYS-CFX 12
version. The study seems to provide useful
information on intra-LV flow velocity and
pressure drops with diverse heart diseases. The
streamlines obtained in the 2D model indicate the
main characteristics of flows produced in the left
ventricle. It is also believed that the pressure–flow
relationship of the 2D model is a good indication
for the 3D model. Malvè et al. [11]
assumed that
the blood density was taken as 1050 kg/m3 and a
blood viscosity of 0.003528 Pa, and the blood
flow was assumed laminar and incompressible
under unsteady flow conditions.
Su et al. [12]
modeled left ventricle in two-
dimension (2D) with both mitral and aortic valves
Page 3
Shahla H. Ali et al JMSCR Volume 03 Issue 05 May Page 5468
JMSCR Volume||03||Issue||05||Page 5466-5478||May 2015
integrated. In both sexes the duration of smoking
increases by the number of cigarettes smoked
daily; smoking 1–4 cigarettes per day was
associated with a significantly higher risk of dying
from ischaemic heart disease and from all causes,
and from lung cancer in women. In both sexes
there is an increase in serum total cholesterol and
serum triglycerides by cigarette consumption,
while there is a decrease in physical activity
during leisure [13]
. The applications of CFD in bio-
medical problems are based on modeling the flow
of blood in the heart and vessels [14]
.
Finite element analysis is a method for numerical
solution of field problems, initially it was used in
the field of structural mechanics [15]
, and ANSYS
is a general-purpose finite-element modeling
package for numerically solving a wide variety of
mechanical problems. These problems include
static/dynamic, structural analysis (both linear and
nonlinear), heat transfer, and fluid problems, as
well as acoustic and electromagnetic problems [16]
.
In general, a finite-element solution is divided into
the following three stages:
A. Preprocessing: Defining the problem and
the major steps in preprocessing.
B. Solution: Assigning loads, constraints, and
solving.
C. Post processing: further processing and
viewing of the results. In this stage one
may wish to see (a) velocity contour
diagrams. (b) Pressure contour diagrams.
ANSYS FLUENT is newest computer program
for modeling fluid flow, heat transfer, and
chemical reactions in complex geometrics. The
program solves conservation equations for mass
and momentum which is called Navier-Stokes
equations.
These equations are complemented by algebraic
relations such as the equation of state for
compressible flow. For example, Navier-Stokes
and continuity equations for modeling fluid
motion, which can be two dimensional/three
dimensional, unsteady and compressible flow:
(2.1)
(2.3)
(2.4)
(2.5)
where ρ = fluid density, u and v are fluid
velocities in x, y directions respectively, P is
pressure and μ is dynamic viscosity.
In addition, there are two numerical methods in
the ANSYS FLUENT:
• Pressure-based solver
• Density-based solver
The pressure-based approach is used for low-
speed incompressible flows, while the density-
based approach is mainly used for high-speed
Page 4
Shahla H. Ali et al JMSCR Volume 03 Issue 05 May Page 5469
JMSCR Volume||03||Issue||05||Page 5466-5478||May 2015
compressible flows. For the present study
Pressure-based solver is used.
The main purpose of this thesis is to investigate
the effects of asthma and smoking diseases on the
Left Ventricle parameters by comparing a control
group of patients using CFD method. In order to
develop this procedure, the data of
echocardiography of three patient groups (asthma,
smoking and control) have first been taken from
in the cardiology department of Azadi scientific
hospital of Duhok in Kurdistan of Iraq. The
velocity and pressure gradient of blood flow
distribution inside a 2-D LV model for the three
groups have been simulated using ANSYS
FLUENT -V14. The results have been analyzed
statistically by using the SPSS software, 2001 for
Windows. Finally, the velocity and pressure of
blood between the Control, Smoking and Asthma
subjects are compared with each other.
Materials and Methods
This study was carried out during three months of
April, June and July 2013 in Scientific Azadi
Hospital, General Cardiology department in
Duhok City in Kurdistan of Iraq. All the subjects
in this study, who are the patients in the
Cardiology department, are divided into three
groups (or cases) as control, smoking, and asthma.
The detail of three cases, i.e. Case I, Case II and
Case III, are presented in Table 1
Table 1. The patients and their properties
Groups Male(ages/yr) Female(ages/yr) BMI(kg/m2) Total
CaseI(Control) 10 (18yr-60yr) 9 (25 yr- 80 yr) (18.37- 31.11)male
(22.22-9.54)female
19
CaseII(smoking) 10 (19yr-59yr) 5 (33 yr- 57 yr) (19.37- 29.03)male
(24.22-8.58)female
15
CaseIII (asthma) ----------- 9 (33 yr- 90 yr) (24.22- 41.52) 9
Here it should be noted that Body Mass Index
(BMI) was calculated as weight in kilograms
divided by the square of height in meters (kg/m2)
[17].
Since the main aim of the study is to examine the
pressure gradient and velocity of blood flow
inside LV we need the data of left ventricle wall
thickness of all the subjects. LV Wall thickness of
the subjects has been measured by M-mode 2D
echocardiography method, all the parameters have
been noted such as Inter Ventricular Septum
thickness wall at the end of diastole and systole
(IVSd and IVSs), Left entricular internal diameter
at the end of diastole and systole (LVIDd and
LVIDs), Left Ventricular Posterior Wall thickness
at the end diastole and systole (LVPWTd and
LVPWTs)), have been measured in cm.
Application of ANSYS FLUENT Method
In this section in order to examine the pressure
gradient and velocity of blood flow inside left
ventrical of human heart, we are going to apply
the data of three cases measured by M-mode
echocardiography given before to LV modeling
run by ANSYS V.14 simulation program, for
which one follows three main steps in a typical
ANSYS analysis as below [18]
:
Page 5
Shahla H. Ali et al JMSCR Volume 03 Issue 05 May Page 5470
JMSCR Volume||03||Issue||05||Page 5466-5478||May 2015
1. Modeling: This involves (Simplification,
idealizations), (Material Definition and it
is properties), (Meshing), respectively.
2. Solution: (Loading and supporting
condition), (Getting the solution).
3. Review results: (Plot/list results).
CFD is based on M-mode echocardiography in
practical real patient.
Geometry and Boundary Conditions
One of the main material in simulation is blood,
which is assumed to be an incompressible,
homogeneous and Newtonian fluid, and the
viscosity is 0.0035 Pa.s and the density is 1050
kg/m3. The other material is related to the property
of wall of LV. For example, it should have a
hyper elastic material wall with a density of
(1366) kg/m3 [15, 16, 19 and 20].
The LV wall has no slip boundary conditions at
the fluid-solid interface [21 and 22].
The blood flow
was characterized by rapidly accelerated and
decelerated laminar
and transient flow with
moving boundaries [22,23,24,25,26,27 and 28]
. The
domain was solved using second-order upwind
scheme.
Statistical Analysis
All data has been analyzed using the Statistical
Package for Social Science SPSS 1 windows
compatible computer. Level of statistical
signification was determined according to the
Duncan Groping test multiple ranges at level set
as ≤ 0.05. Descriptive data were expressed with
use of means values with the same or different
letters.
Results and Discussion
In this section we present the results of the
calculations and discuss the effects of diseases
(smoking and asthma) on LV human heart
parameters. The effects of smoking and asthma
together with the control group, which are
statistically analyzed, are presented and compared
to each other on a table. In particular, the results
of Left Ventrical wall thickness of human heart
data or six parameters, which are LVIDs, LVIDd,
IVSs, IVSd, LVWTs, and LVWTd, for the three
cases are illustrated in the figures, and the
correlation values of the six parameters between
the LV wall thickness are discussed.
As seen in Table 2, the statistic analysis of
Smoking and Asthma effects on Left Ventricle
parameters has been displayed in Table 2. The
results indicate that the six parameters of the
groups has been compared to each other. It can be
seen that the mean of IVSd for the smoking and
asthma in the first column increased to that of the
control group. On the other hand, the second
column shows a comparison of LVIDd of the
smoking and asthma subjects with the control
subjects, where the mean value of the smoking
and asthma slightly decreased to the control,
which is not statistically significant. The third
column shows a comparison of LVPWd values. A
significant difference between the smoking group
and the control can be seen while the asthma and
control subjectsis non-significant. However, there
is also no- significant difference between the
smoking and asthma and the control groups in the
4th
and 5th
columns. In particular, one can see an
obvious difference as the smoking and asthma
Page 6
Shahla H. Ali et al JMSCR Volume 03 Issue 05 May Page 5471
JMSCR Volume||03||Issue||05||Page 5466-5478||May 2015
groups are compared to the control groups in the
sixth column.
Table 2. Mean values of Left Ventricle parameters (IVSd, LVIDd, LVPWd, IVSs, LVIDs and LVPWs) for
the three Cases, Means with the same letter are not significantly different.
Disease IVSd(cm) LVIDd(cm) LVPWd(cm) IVSs(cm) LVIDs(cm) LVPWs(cm)
Mean Mean Mean Mean Mean Mean
Control 0.96b 4.48b 1.3a 1.48a 2.95b 1.53a
Smoking 1.31a 4.35b 1.21b 1.49a 3.01b 0.35b
Asthma 1.14a 4.28b 1.26a 1.37a 2.83b 0.35b
Moreover, the variation of these six parameters
with respect to female Ages for these three cases
have been illustrated in detail in the figures given
below. For example, Figure 2. shows the relation
between the Age and the Left Ventricle Posterior
Wall thickness in systole (LVPWs) for female
Smoking and Asthma subjects compare to the
female of control patient. The figure shows that
the LVPWs for the control are much greater than
the left ventricle posterior wall thickness in
systole for smoking. The relation between the Age
and the Left Ventricle Internal Diameter in systole
(LVIDs) for female of the smoking and asthma to
the female of the control patients are plotted in
Figure 2. The LVIDs at (33,50) point converge
together for female of control, smoking and
asthma.
Figure 3. displays the relation between the female
ages for Smoking and Asthma subjects with the
female of control and all their effect on the Inter
Ventricular Septum in Systole (IVSs) is displayed
in Figure 4. which shows that the IVSs at age 33
years for control patient is greater than IVSs for
smoking and asthma patient, and shows the
similarity of IVSs in (53, 57, 87 and 90) years for
control and asthma patient. On the other hand, the
IVSs is diverge in age (38, 40, 46 and 50) years.
Figure 2. The trend of the dependence Left Ventricle Posterior Wall in systolic (LVPWs) on Age in the
femal human cardiac (control, asthma and smoking).
0
0.2
0.4
0.6
0.8
1
1.2
1.4
1.6
1.8
33 38 40 46 50 53 57 87 90
Age(yr)
LV
PW
s(c
m)
LVPWs,CO.
LVPWs,S.
LVPWs,AS.
Page 7
Shahla H. Ali et al JMSCR Volume 03 Issue 05 May Page 5472
JMSCR Volume||03||Issue||05||Page 5466-5478||May 2015
Figure 3. The trend of the dependence Left Ventricle Internal Diameter in systolic (LVIDs) on Age in the
femal human cardiac (control, asthma and smoking)
Figure 4. The trend of the dependence Inter Ventricular Septum in systole (IVSs) on Age in the femal
human cardiac (control, asthma and smoking)
The relation between the female ages for Smoking
and Asthma subjects with the female of control
and all their effects on the Left Ventricle Posterior
Wall in diastole (LVPWd) is displayed in Figure
5. The LVPWd is converged for control, smoking,
and asthma subjects at age (33, 46, 53 & 90)
years, and it is similar at age (38, 40, 50, 57 and
87) year. Figure 6. depicts the relation between
the female ages for Smoking and Asthma subjects
with the female of control and all their effects on
0
0.5
1
1.5
2
2.5
3
3.5
4
4.5
33 38 40 46 50 53 57 87 90
Age(yr)
LV
IDs
(cm
)
LVIDs,CO.
LVIDs,S.
LVIDs,AS.
0
0.2
0.4
0.6
0.8
1
1.2
1.4
1.6
1.8
33 38 40 46 50 53 57 87 90
Age(yr)
IVS
s(c
m)
IVSs,CO.
IVSs,S.
IVSs,AS.
Page 8
Shahla H. Ali et al JMSCR Volume 03 Issue 05 May Page 5473
JMSCR Volume||03||Issue||05||Page 5466-5478||May 2015
the Left Ventricle Internal Diameter in diastolic
(LVIDd) which converged at age (50 and 87)
years and diverged at age (33, 53, 57 and 90)
years.
Figure 7. displays the relation between the female
ages for Smoking and Asthma subjects with the
female of control and all their effects on the Inter
Ventricular Septum in diastole (IVSd) which
show that the value of IVSd for control subject is
less than the other two cases, but IVSd for
Smoking is greater than Asthma and Control in
age 38, 40, 46 and 50 year.
Figure 5. The trend of the dependence Left Ventricle Posterior Wall in diastolic (LVPWd) on Age in the
femal human cardiac (control, asthma and smoking).
Figure 6. The trend of the dependence Left Ventricle Internal Diameter in diastolic (LVIDd) on Age in the
femal human cardiac (control, asthma and smoking)
0
0.2
0.4
0.6
0.8
1
1.2
1.4
1.6
33 38 40 46 50 53 57 87 90
Age(yr)
LV
PW
d(c
m)
LVPWd,CO.
LVPWd,S.
LVPWd,AS.
0
1
2
3
4
5
6
33 38 40 46 50 53 57 87 90
Age(yr)
LV
IDd
(cm
)
LVIDd,CO.
LVIDd,S.
LVIDd,AS.
Page 9
Shahla H. Ali et al JMSCR Volume 03 Issue 05 May Page 5474
JMSCR Volume||03||Issue||05||Page 5466-5478||May 2015
Figure 7. The trend of the dependence Inter Ventricular Septum in diastole (IVSd) on Age in the femal
human cardiac (control, asthma and smoking)
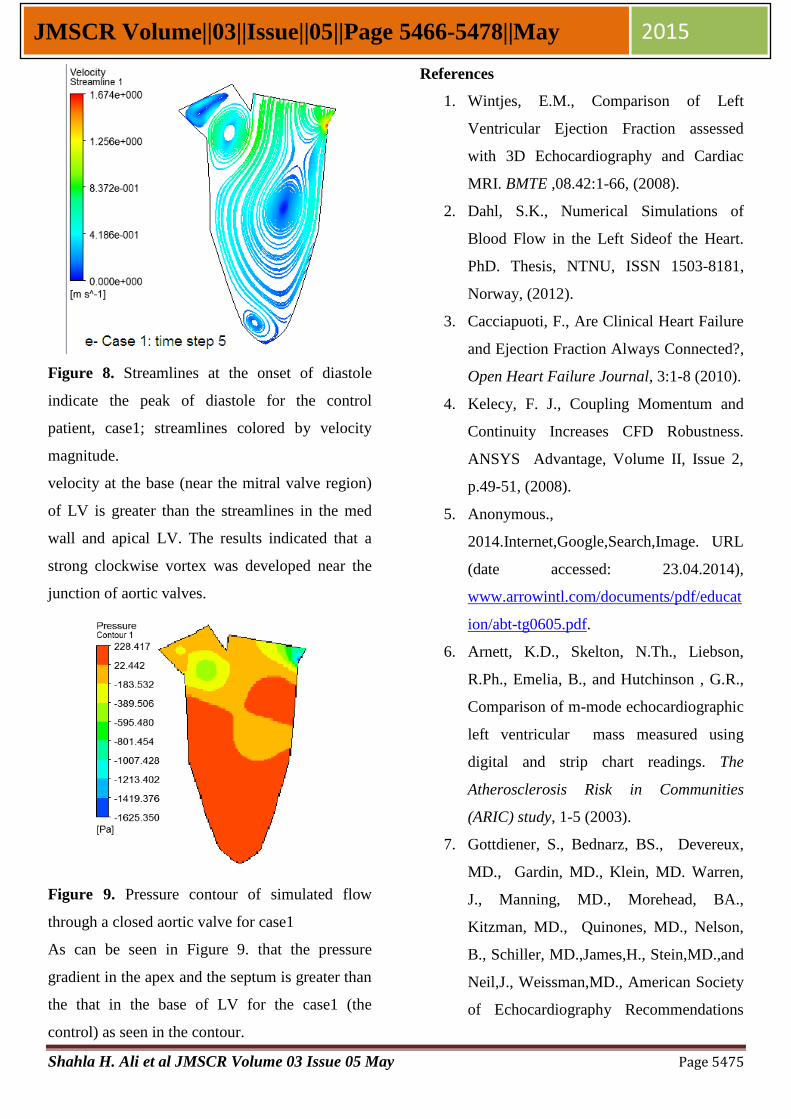
The simulation of the velocity and pressure
distribution inside LV for the three cases was
carried out using ANSYS and Fluent (ANSYS
Fluent14) program. The model used in the
calculations is based on mitral valve opened and
aortic valve closed [29, 30 ,31,32,33,34,35,36 and 37]
, and
presents the streamlines at the onset of diastole
with colors for velocity magnitude. It is worth of
noting that the movement of the mitral valve was
not modeled in the present study but the blood
flow at the mitral valve was modeled as a bell
mouth inlet. The blood entered into the LV from
the mitral orifice and rapidly filling phase began.
The final steps for filling LV with blood as
illustrated in the figures given below. The velocity
streamline in mitral valve region is much greater
as compared to the other regions, which can be
seen in the figures.
Let us now analysis the results in the figures.
Figure 8. illustrates 5 times step for blood flow
inside the LV from the onset of diastole to the
peak of diastole. However, we must note that the
average values of Inter Ventricular Septum in
diastole (IVSd), Left Ventricle Internal Diameter
in diastolic (LVIDd) and Left Ventricle Posterior
Wall in diastolic (LVPWd) have been taken from
the practical data of real control patients given in
Table 2. These three parameters have been applied
respectively to wall thickness of the control
patients, i.e. case 1. This model shows the
streamline velocity at the base (near the mitral
valve region) of LV, which is greater than the
streamlines in the mid-wall and apical LV. The
results indicated that a strong clockwise vortex
was developed near the junction of aortic valves.
According to (S.S. Khalafv et.al.2012), who also
found the similar streamline velocity using CFX
12 for modeling LV, the streamline velocity in
mitral valve region is greater than the others in
agreement with our results. Moreover, the results
indicated that a strong clockwise vortex was
developed near the junction of aortic and mitral
valves.
0
0.2
0.4
0.6
0.8
1
1.2
1.4
1.6
33 38 40 46 50 53 57 87 90
Age(yr)
IVS
d(c
m)
IVSd,CO.
IVSd,S.
IVSd,AS.
Page 10
Shahla H. Ali et al JMSCR Volume 03 Issue 05 May Page 5475
JMSCR Volume||03||Issue||05||Page 5466-5478||May 2015
Figure 8. Streamlines at the onset of diastole
indicate the peak of diastole for the control
patient, case1; streamlines colored by velocity
magnitude.
velocity at the base (near the mitral valve region)
of LV is greater than the streamlines in the med
wall and apical LV. The results indicated that a
strong clockwise vortex was developed near the
junction of aortic valves.
Figure 9. Pressure contour of simulated flow
through a closed aortic valve for case1
As can be seen in Figure 9. that the pressure
gradient in the apex and the septum is greater than
the that in the base of LV for the case1 (the
control) as seen in the contour.
References
1. Wintjes, E.M., Comparison of Left
Ventricular Ejection Fraction assessed
with 3D Echocardiography and Cardiac
MRI. BMTE ,08.42:1-66, (2008).
2. Dahl, S.K., Numerical Simulations of
Blood Flow in the Left Sideof the Heart.
PhD. Thesis, NTNU, ISSN 1503-8181,
Norway, (2012).
3. Cacciapuoti, F., Are Clinical Heart Failure
and Ejection Fraction Always Connected?,
Open Heart Failure Journal, 3:1-8 (2010).
4. Kelecy, F. J., Coupling Momentum and
Continuity Increases CFD Robustness.
ANSYS Advantage, Volume II, Issue 2,
p.49-51, (2008).
5. Anonymous.,
2014.Internet,Google,Search,Image. URL
(date accessed: 23.04.2014),
www.arrowintl.com/documents/pdf/educat
ion/abt-tg0605.pdf.
6. Arnett, K.D., Skelton, N.Th., Liebson,
R.Ph., Emelia, B., and Hutchinson , G.R.,
Comparison of m-mode echocardiographic
left ventricular mass measured using
digital and strip chart readings. The
Atherosclerosis Risk in Communities
(ARIC) study, 1-5 (2003).
7. Gottdiener, S., Bednarz, BS., Devereux,
MD., Gardin, MD., Klein, MD. Warren,
J., Manning, MD., Morehead, BA.,
Kitzman, MD., Quinones, MD., Nelson,
B., Schiller, MD.,James,H., Stein,MD.,and
Neil,J., Weissman,MD., American Society
of Echocardiography Recommendations
Page 11
Shahla H. Ali et al JMSCR Volume 03 Issue 05 May Page 5476
JMSCR Volume||03||Issue||05||Page 5466-5478||May 2015
for Use of Echocardiography in Clinical
Trials. Journal of the American Society of
Echocardiography, 17(10): 1086-1119,
(2004).
8. Kuhl, H.P., Hanrath, P., and Franke, A.,
M-Mode Echocardiography Overestimates
Left Ventricular Mass in Patients with
Normal Left Ventricular Shape. A
Comparative Study Using Three-
Dimensional Echocardiography. Eur J
Echocardiography, 4,313– 319,(2003).
9. Long, Q., Merrifield, R., Xu, X.Y., Kilner,
P.J., Firmin, D.N.,and Yang, G.Z., Intra-
ventricular blood flow simulation with
patient specific geometry. Proc. of the 4th
Annual IEEE Conf on Information
Technology Applications in Biomedicine,
p. 126-129, (2003).
10. Khalafvand, S.S., Zhong, L.K.,and Hung,
T., Fluid-dynamics modelling of the
human left ventricle with dynamic mesh
for normal and myocardial infarction:
Preliminary study. Computers in Biology
and Medicine, 42: 863–870, (2012).
11. Malvè, M., García, A., Ohayon, J.,and
Martínez, M.A., Unsteady blood flow and
mass transfer of a human left coronary
artery bifurcation: FSI vs. CFD.
International Communications in Heat
and Mass Transfer, 39: 745–751, (2012).
12. Su, B., Zhong, L., Wang, X.K., Zhan,
J.M., Tan, R.S., Allen, J.C., Tan, S.K.,
Kim, S. and Leo, H.L., Numerical
simulation of patient-specific left
ventricular model with both mitral and
aortic valves by FSI approach, Comput.
Methods Programs Biomed. http://dx.doi.-
org/10.1016/j.cmpb.2013.11.009,(2013).
13. Bjartveit, K., and Tverdal, A., Health
consequences of smoking 1–4 cigarettes
per day, Tob Control, 14: 315-320, (
2005).
14. Paleti, S.K.R., Finite Element Analysis
using ANSYS11, ISBN-10:8131760642,
New Delhi, India, 528pp, (2010).
15. Alper, B., Finite element analysis of the
beam strengthened with prefabricated
reinforced concrete,Scientific Research
and Essays ,5(6):533-544,( 2010).
16. Erdogan, M., and Ibrahim, G., The finit
element method and applications in
engineering using ANSYS,by springer
science +business media,LLC,United
states of America,686pp, (2006).
17. Domenichini, F., Querzoli, G., Cenedese,
A., and Pedrizzetti, G., Combined
experimental and numerical analysis of the
flow structure into the left ventricle.
Journal of Biomechanics, 40:1988–1994,
(2007).
18. Nakasone, Y., and Yoshimoto, S.,
Engineering Analysis with ANSYS
Software,first published, ISBN: 978-0-
7506-6875-0, Oxford OX2 8DP, 456p,
(2006).
19. Bee, T., Chan, N.A., Abu Osman, E.L.,
Kok, H.Ch., Yang Faridah, Ab.A., Amr,
Al.A., Nigel, H., Lovell, S.D., Sensitivity
Analysis of Left Ventricle with Dilated
Cardiomyopathy in Fluid Structure
Page 12
Shahla H. Ali et al JMSCR Volume 03 Issue 05 May Page 5477
JMSCR Volume||03||Issue||05||Page 5466-5478||May 2015
Simulation. Left Ventricle with Dilated
Cardiomyopathy, 8( 6) :1-11(2013).
20. Joshi, A., Leask, R., Myers, J., Ojha, M.,
Butany, J., Ethier, C., Intimal thickness is
not associated with wall shear stress
pattern in the human right coronary artery,
Arteriosclerosis. Thrombosis and Vascular
Biology - Journal of the American Heart
Association , 24: 2408–2413, (2004).
21. Johnston. B., Johnston. R., Corney, S.,
Kilpatrick, D., Non-Newtonian blood flow
in human right coronary arteries. steady
state simulations, Journal of
Biomechanics, 37 (9): 709–720, (2004).
22. Johnston, B., Johnston, R., Corney, S.,
Kilpatrick, D., Non-newtonian blood flow
in human right coronary arteries:
Transient simulations. Journal of
Biomechanics,39: 1116–1128, (2006).
23. Le, T. B., and Sotiropoulos, F., Fluid–
structure interaction of an aortic heart
valve prosthesis driven by an animated
anatomic left ventricle. Journal of
Computational Physics 244:41–62, (2013).
24. Boyang, S., Liang, Zh., Xi-Kun, W., Jun-
Mei, Zh., Ru, S.T., John, C., Allend, S.,
K., Tane, S., K., Hwa, L.L., Numerical
simulation of patient-specific left ventricu-
lar model with both mitral and aorticvalves
by FSI approach. computer methods and
programs in biomedicin, p.1-9, (2013).
25. Kanaris, A.G., Anastasiou, A.D. and Paras,
S.V., Modeling the effect of blood
viscosity on hemodynamic factors in a
small bifurcated artery. Chemical
Engineering Science, 71: 202–211, (2012).
26. Baccani, B., Domenichini, F., Pedrizzetti,
G., and Tonti, G., Fluid dynamics of the
left ventricular filling in dilated
cardiomyopathy. Journal of Biomechanics,
35:665–671, (2002).
27. Domenichini, F., and Pedrizzetti, G.,
Intraventricular vortex flow changes in the
infarcted left ventricle: numerical results in
an idealised 3d shape. Computer Methods
in Biomechanics and Biomedical Enginee-
ring, 14(1):91–101, February (2011).
28. Domenichini, F., and Pedrizzetti, G.,
Intraventricular vortex flow changes in the
infarcted left ventricle: numerical results in
an idealised 3d shape. Computer Methods
in Biomechanics and Biomedical Enginee-
ring, 14(1):91–101, February (2011).
29. Patrizia, A., Grenacher, C.C.S.,
Assessment of left ventricular size and
function in horses using anatomical M-
mode echocardiography. Journal of
Veterinary Cardiology, 12:111-121,
(2010).
30. Espino, D. M., Watkins, M. A., Shepherd,
D. E., Hukins, D. W., and Buchan, K. G.,
Simulation of blood flow through the
mitral valve of the heart: A fluid structure
interaction model. In Proceedings of the
COMSOL Users Conference, Birmingham,
(2006).
31. Hu, Y., Shi, L., Parameswaran, S.,
Smirnov, S., and He, Z., Left ventricular
vortex under mitral valve edge-to-edge
Page 13
Shahla H. Ali et al JMSCR Volume 03 Issue 05 May Page 5478
JMSCR Volume||03||Issue||05||Page 5466-5478||May 2015
repair, Cardiovascular Engineering and
Technology, 1(4): 235–243, (2010).
32. Long, Q., Merrifield, R., Yang, G., Kilner,
P. J., Firmin, D. N., and Xu, X. Y., The
influence of inflow boundary conditions
on intra left ventricle flow predictions,
Journal of Biomechanical Engineering,
ASME, 125:922–927, (2003).
33. Merrifield, R., Long, Q., Xu, X. Y.,
Kilner, P. J., Firmin, D. N., and Yang, G.
Z., Combined CFD/MRI Anaylysis of left
ventricular flow. Springer-Verlag, Berlin,
(2004).
34. Nakamura, M., Wada, S., and Yamaguchi,
T., Influence of the opening mode of the
mitral valve orifice on intraventricular
hemodynamics. Annals of Biomedical
Engineering, 34(6): 927–935,(2006).
35. Pierrakos, O., and Vlachos, P. P., The
effect of vortex formation on left
ventricular filling and mitral valve
efficiency. Journal of Biomechanical
Engineering, 128:527–539, (2006).
36. Saber,N.R., Gosman, A., Wood, N. B.,
Kilner, P. J., Charrier, C. L.m and Firmin,
D. N., Computational flow modeling of the
left ventricle based on in vivo mri data:
Initial experience. Annals of Biomedical
Engineering, 29:275–283, (2001).
37. Iaizzo, P. A., Handbook of cardiac
anatomy, physiology, and devices. New
York, NY, Springer, (2009).