46
© ABB Group September 4, 2010 | Slide 1 Optimization Solutions in Thermal Power Plants Shailesh Vidyarthi, 9th Energy Efficiency Summit 2010, Chennai

© ABB Group September 4, 2010 | Slide 1
Optimization Solutions in Thermal Power Plants
Shailesh Vidyarthi, 9th Energy Efficiency Summit 2010, Chennai

© ABB Group September 4, 2010 | Slide 2
“The need of the hour is to optimize the resources and rapidly adopt energy efficiency techniques and improvement mechanisms.”
- CII, 9th Energy Efficiency Summit 2010

© ABB Group September 4, 2010 | Slide 3
Contents
Today’s energy challenges
ABB in Energy Efficiency
Optimax® Plant Optimization Solution
Introduction
Product Portfolio
Optimax Products
Typical Layout
Summary

© ABB Group September 4, 2010 | Slide 4
Contents
Today’s energy challenges
ABB in Energy Efficiency
Optimax® Plant Optimization Solution
Introduction
Product Portfolio
Optimax Products
Typical Layout
Summary

© ABB Group September 4, 2010 | Slide 5
Today’s energy challengesRising demand
China
94% 177%
India
116% 261%
Europe and North America5.4% 26%
140%89%Growth in primary energy demandGrowth in electricity demand
IEA forecast 2007-30
M. East and Africa
© ABB Group September 4, 2010 | Slide 6
Today’s energy challengesPresent Scenario in India
• Demand for energy has risen steadily in the past decade.
• Electricity consumption is rising even faster, and is set to increase about 76 percent between 2007 and 2030 under current policies and trends (IEA estimate).
• India has set an ambitious target of generating 78,700 MW by 2012.
• Need of the hour is maximum utilization of installed capacity( Average PLF in thermal power stations for power utilities has gone up by around 12% for the period 1999-2010)
© ABB Group September 4, 2010 | Slide 7
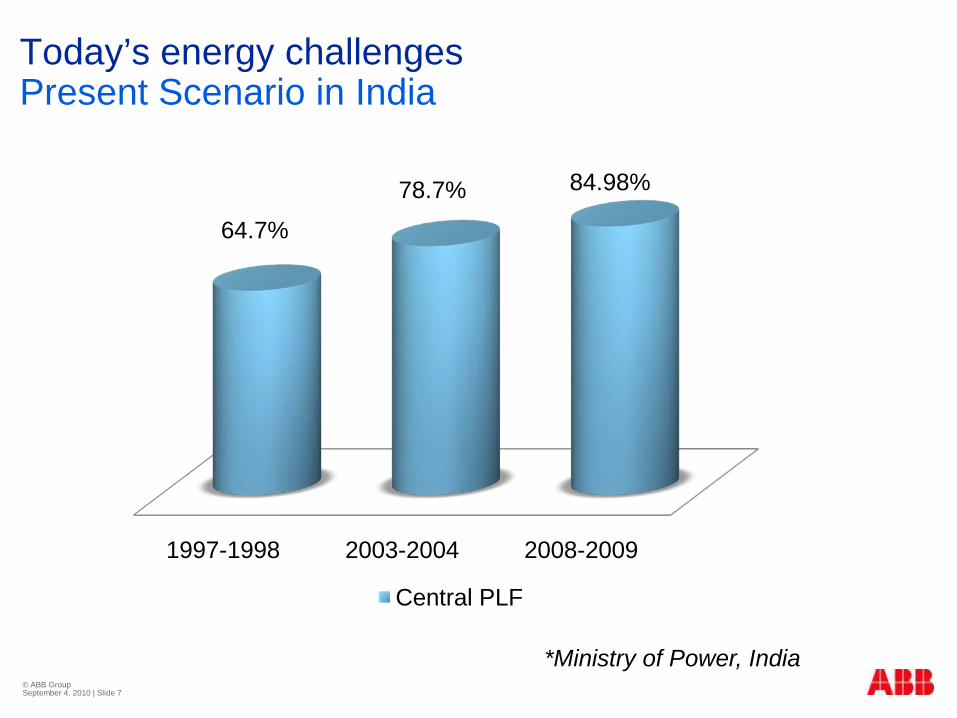
Today’s energy challengesPresent Scenario in India
1997-1998 2003-2004 2008-2009
64.7%
78.7% 84.98%
Central PLF
*Ministry of Power, India
© ABB Group September 4, 2010 | Slide 8
Today’s energy challengesPresent Scenario in India
Aim for overall improvement in efficiency of power plants in India.
*Ministry of Power, India

© ABB Group September 4, 2010 | Slide 9
Today’s energy challengesCut link between growth, energy use and emissions
Meeting these challenges requires the world to:
Reduce the correlation between economic growth
and energy use
Reduce the correlation between energy use and
emissions
Energyefficiency
Renewable sourcesof energy

© ABB Group September 4, 2010 | Slide 10
Contents
Today’s energy challenges
ABB in Energy Efficiency
Optimax® Plant Optimization Solution
Introduction
Product Portfolio
Optimax Products
Typical Layout
Summary
© ABB Group September 4, 2010 | Slide 11
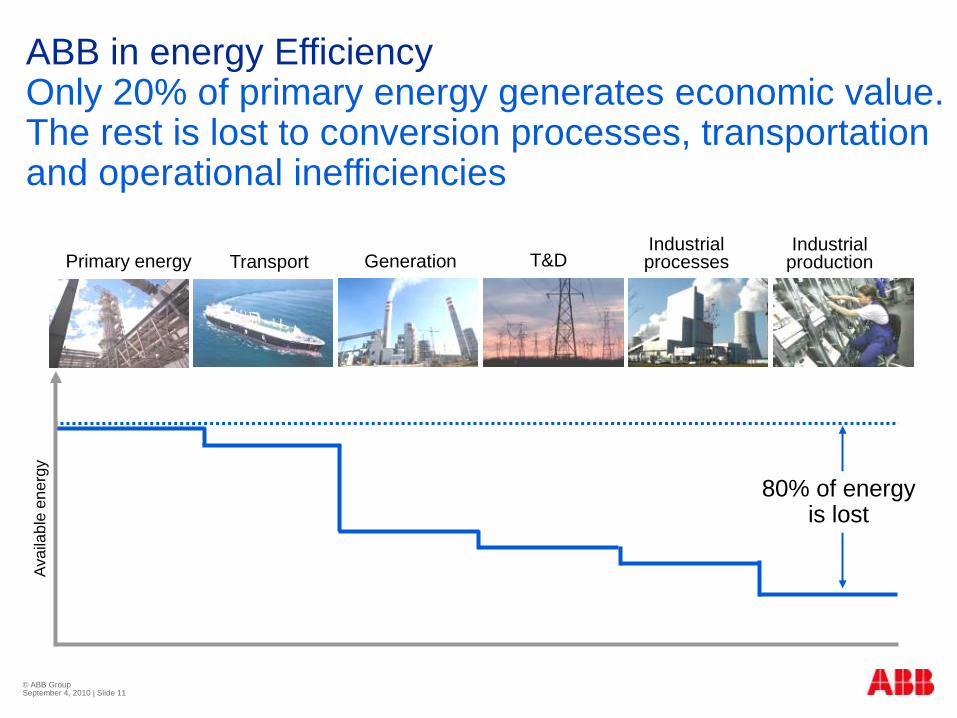
Primary energy Transport Generation T&DIndustrial processes
Industrial production
80% of energyis lost
Avai
labl
e en
ergy
ABB in energy EfficiencyOnly 20% of primary energy generates economic value.The rest is lost to conversion processes, transportationand operational inefficiencies
© ABB Group September 4, 2010 | Slide 12
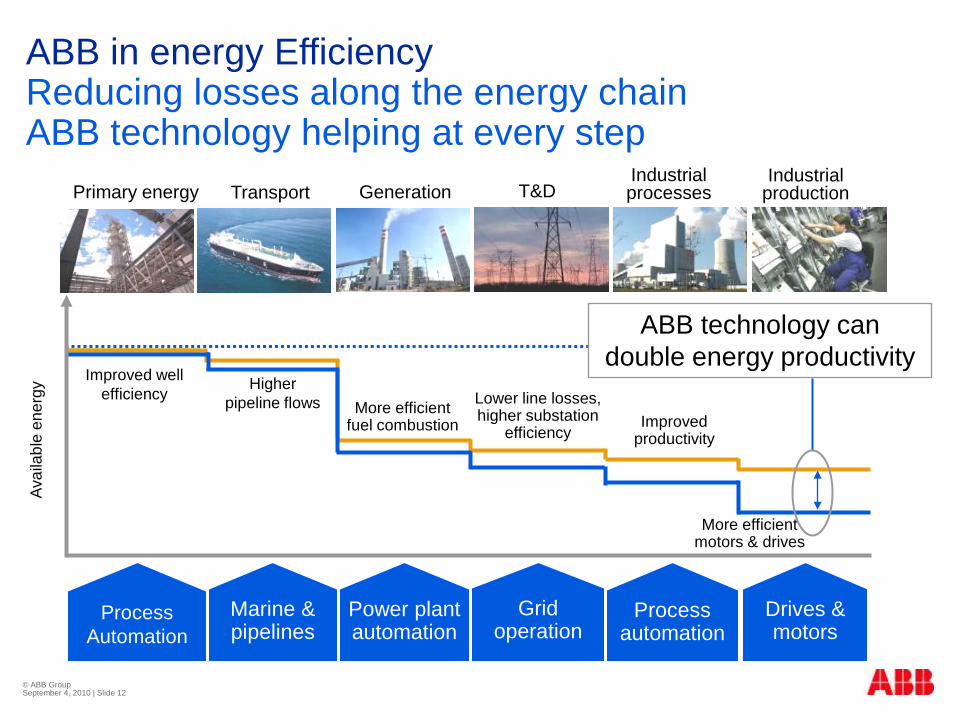
Primary energy Transport Generation T&DIndustrial processes
Industrial production
Avai
labl
e en
ergy
ABB technology can double energy productivity
More efficient fuel combustion
Higher pipeline flows
Improved well efficiency Lower line losses,
higher substation efficiency
Improved productivity
More efficient motors & drives
Drives &motors
ProcessAutomation
Marine & pipelines
Power plantautomation
Gridoperation
Processautomation
ABB in energy EfficiencyReducing losses along the energy chainABB technology helping at every step

© ABB Group September 4, 2010 | Slide 13
Contents
Today’s energy challenges
ABB in Energy Efficiency
Optimax® Plant Optimization Solution
Introduction
Product Portfolio
Optimax Products
Typical Layout
Summary
© ABB GroupSeptember 4, 2010 | Slide 14
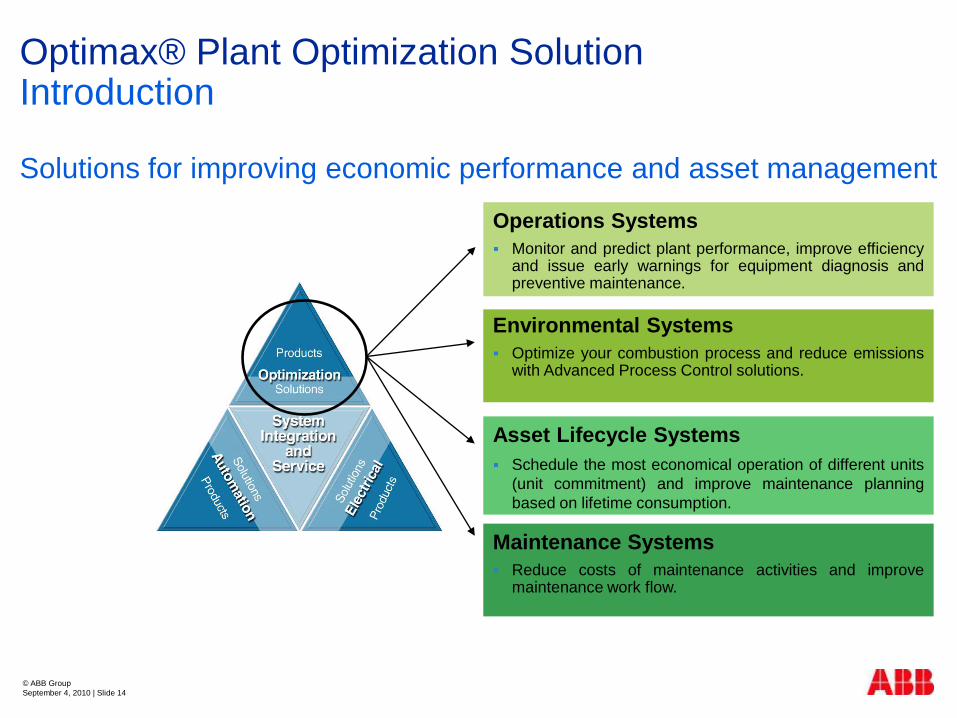
Environmental Systems Optimize your combustion process and reduce emissions
with Advanced Process Control solutions.
Asset Lifecycle Systems Schedule the most economical operation of different units
(unit commitment) and improve maintenance planningbased on lifetime consumption.
Operations Systems Monitor and predict plant performance, improve efficiency
and issue early warnings for equipment diagnosis andpreventive maintenance.
Maintenance Systems Reduce costs of maintenance activities and improve
maintenance work flow.
Optimax® Plant Optimization SolutionIntroduction
Solutions for improving economic performance and asset management

© ABB Group September 4, 2010 | Slide 15
Contents
Today’s energy challenges
ABB in Energy Efficiency
Optimax® Plant Optimization Solution
Introduction
Product Portfolio
Optimax Products
Typical Layout
Summary

© ABB GroupSeptember 4, 2010 | Slide 16
Optimax® Plant Optimization SolutionProduct Portfolio

© ABB Group September 4, 2010 | Slide 17
Contents
Today’s energy challenges
ABB in Energy Efficiency
Optimax® Plant Optimization Solution
Introduction
Product Portfolio
Optimax Products
Typical Layout
Summary

© ABB GroupSeptember 4, 2010 | Slide 18
Optimax Plant Performance Monitoring
Performance monitoring of power plants or water desalination plants
Calculates deviation between the expected and the measured data
Offers online thermodynamic models and what-if simulations
Reduces plant fuel costs
Improves predictive maintenance
Early detection of degradation possible
Provides the maximum flexibility in reconfiguring or dynamically modifying system parameters even during system operation
Optimax® Plant Optimization Solution

© ABB GroupSeptember 4, 2010 | Slide 19
Optimax Plant Performance MonitoringOptimax® Plant Optimization Solution
© ABB GroupSeptember 4, 2010 | Slide 20
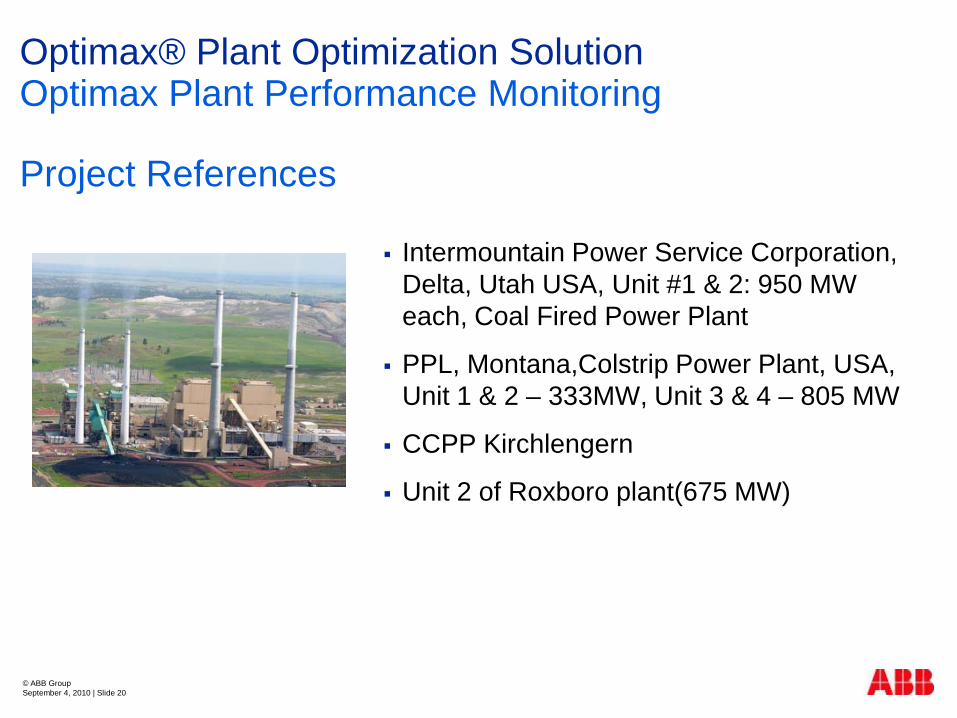
Intermountain Power Service Corporation, Delta, Utah USA, Unit #1 & 2: 950 MW each, Coal Fired Power Plant
PPL, Montana,Colstrip Power Plant, USA, Unit 1 & 2 – 333MW, Unit 3 & 4 – 805 MW
CCPP Kirchlengern
Unit 2 of Roxboro plant(675 MW)
Optimax Plant Performance Monitoring
Project References
Optimax® Plant Optimization Solution

© ABB GroupSeptember 4, 2010 | Slide 21
140k$ saved annually at Unit 2 of Roxboro plant(675 MW), North Carolina, USA. In addition, 100k$ annual saving achieved with performance testsreduction.
Using OPTIMAX, the detection of leakages at Astoria PP (Unit 30,360 MW), USA. result in cost saving equivalent of 150k$ per year.
50k$ can be saved annually by reducing the man power.
Information Management
Optimax Plant Performance Monitoring
Benefits
Optimax® Plant Optimization Solution

© ABB GroupSeptember 4, 2010 | Slide 22
Model-based tool able to accurately simulate thermodynamic behavior of the plant under varying ambient conditions and different steady-state operating modes
Calculation options
Simulation
Data Validation
Optimization
Optimax® Plant Optimization SolutionPowerCycle
© ABB GroupSeptember 4, 2010 | Slide 23
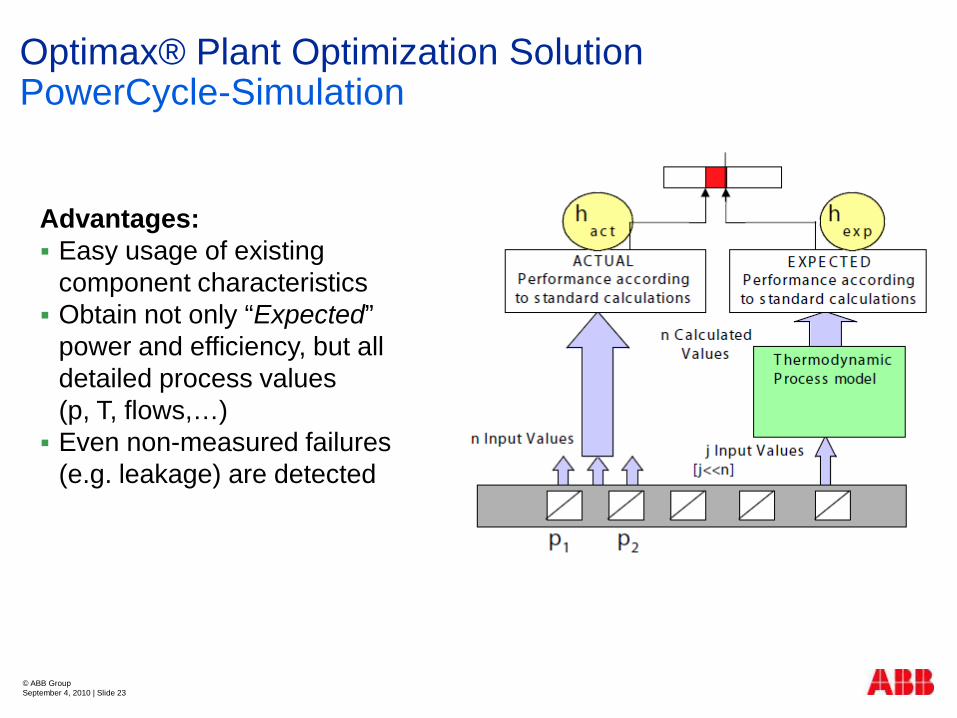
Advantages: Easy usage of existing
component characteristics Obtain not only “Expected”
power and efficiency, but all detailed process values (p, T, flows,…) Even non-measured failures
(e.g. leakage) are detected
Optimax® Plant Optimization SolutionPowerCycle-Simulation

© ABB GroupSeptember 4, 2010 | Slide 24
Steady-State simulation of thermodynamic behavior of the plant and its equipment
Online Simulations
What-If Simulations
Deviations from the optimal efficiency can be recognized.
Optimax® Plant Optimization SolutionPowerCycle-Simulation

© ABB GroupSeptember 4, 2010 | Slide 25
Measured values are integrated into the model
Alarm is generated if computed value deviates from the process value by more than a specified interval.
It is used for predictive maintenance and avoid unnecessary trips due to faulty alarms
Optimax® Plant Optimization SolutionPowerCycle-Data Validation
© ABB GroupSeptember 4, 2010 | Slide 26
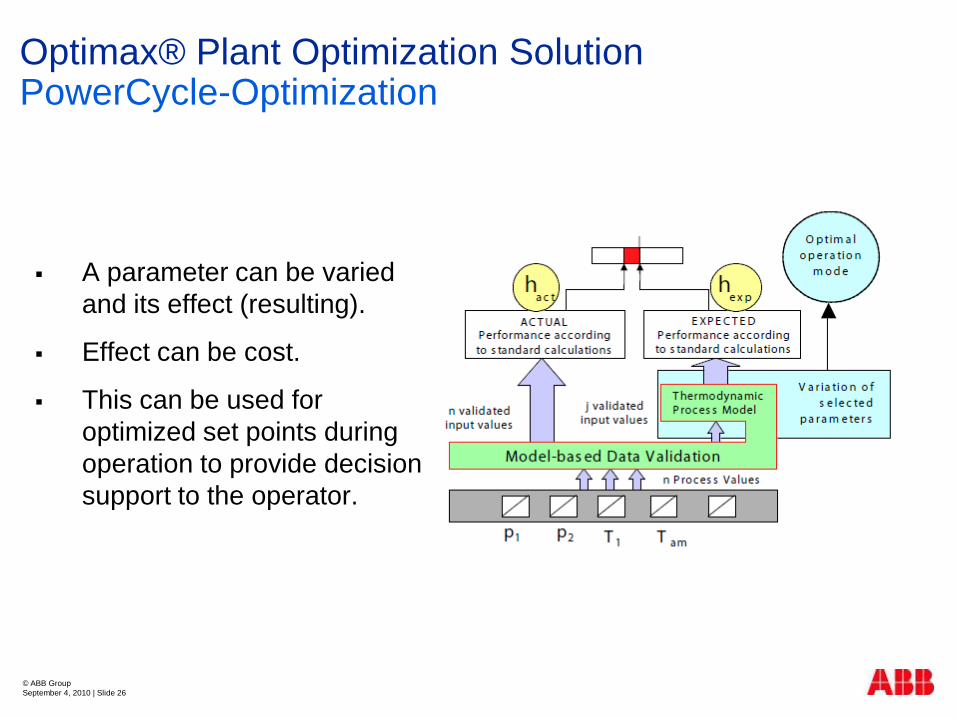
A parameter can be varied and its effect (resulting).
Effect can be cost.
This can be used for optimized set points during operation to provide decision support to the operator.
Optimax® Plant Optimization SolutionPowerCycle-Optimization
© ABB GroupSeptember 4, 2010 | Slide 27
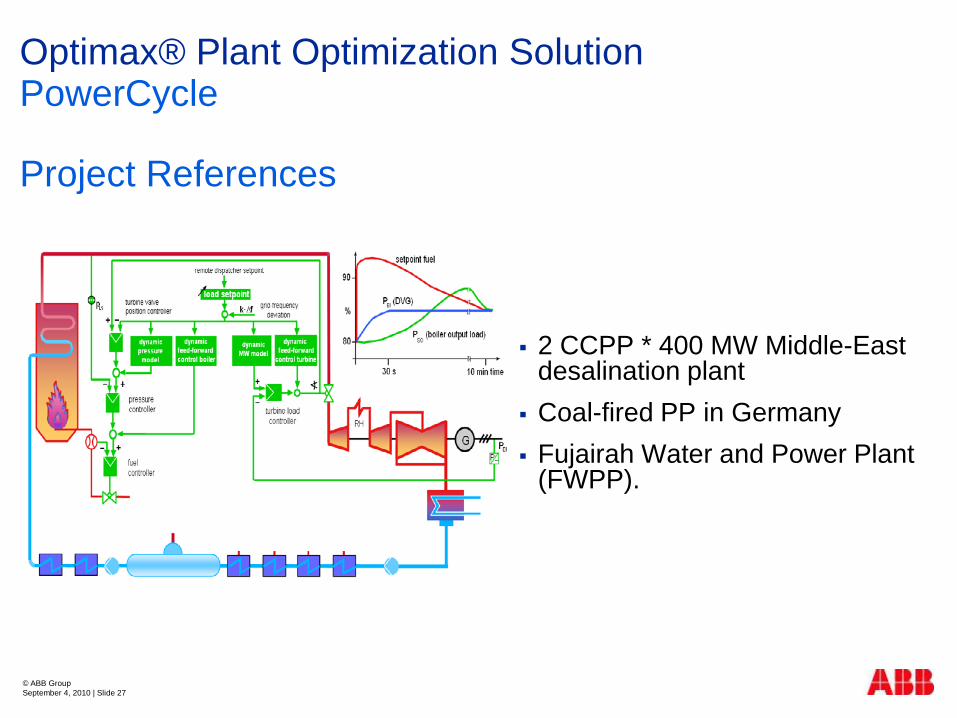
2 CCPP * 400 MW Middle-East desalination plant
Coal-fired PP in Germany Fujairah Water and Power Plant
(FWPP).
PowerCycle
Project References
Optimax® Plant Optimization Solution

© ABB GroupSeptember 4, 2010 | Slide 28
What-if simulations and optimization result in 1% fuel savings for a plant consisting of 2 CCPP * 400 MW.
By determining the optimal load distribution over the 2 GT’s, nearly 100k$ saved per year.
In a Middle-East desalination plant, 1.8% water production costs saved by calculating optimal set points for the Multi-Stage Flash (MSF) process.
Determining a better sub-cooling at a coal-fired PP in Germany, resulted in 110k$ saving peryear.
PowerCycle
Benefits
Optimax® Plant Optimization Solution

© ABB GroupSeptember 4, 2010 | Slide 29
Based on Model Predictive Control techniques (MPC) forclosed loop combustionoptimization of boilers fired with pulverized coal.
Models the multivariable nonlinear relationships of thecombustion process.
The relationships betweensignals/parameters are identified by analyzing theirhistorical data.
Optimax® Plant Optimization SolutionCombustion Optimizer

© ABB GroupSeptember 4, 2010 | Slide 30
Improves boiler efficiency, reduces emissions, lowers operating costs
NOx reduction.
Heat rate improvement
Steam Temperature
O2 control ( Excess)
Burner Tilt
Optimax® Plant Optimization SolutionCombustion Optimizer

© ABB GroupSeptember 4, 2010 | Slide 31
Optimax® Plant Optimization SolutionCombustion Optimizer

© ABB GroupSeptember 4, 2010 | Slide 32
6x500 MW JaenschwaldePlant,Vattenfalls,Germany
PPL, Montana,Colstrip Power Plant, USA
Unit 1 & 2 – 333MW
Unit 3 & 4 – 805 MW
Optimax® Plant Optimization SolutionCombustion Optimizer
Project References

© ABB GroupSeptember 4, 2010 | Slide 33
Reduce NOx by 8 - 40 % Heat rate improvements of:
0.5 - 1.5 % at base load
1.5 - 2.5 % at swing load Reduction of unburned carbon in
ash by 1 - 5 % Reduction of CO2 generation Maintenance of CO at desired
levels Improve availability
Environmental System
Optimax® Plant Optimization SolutionCombustion Optimizer
Benefits
© ABB GroupSeptember 4, 2010 | Slide 34
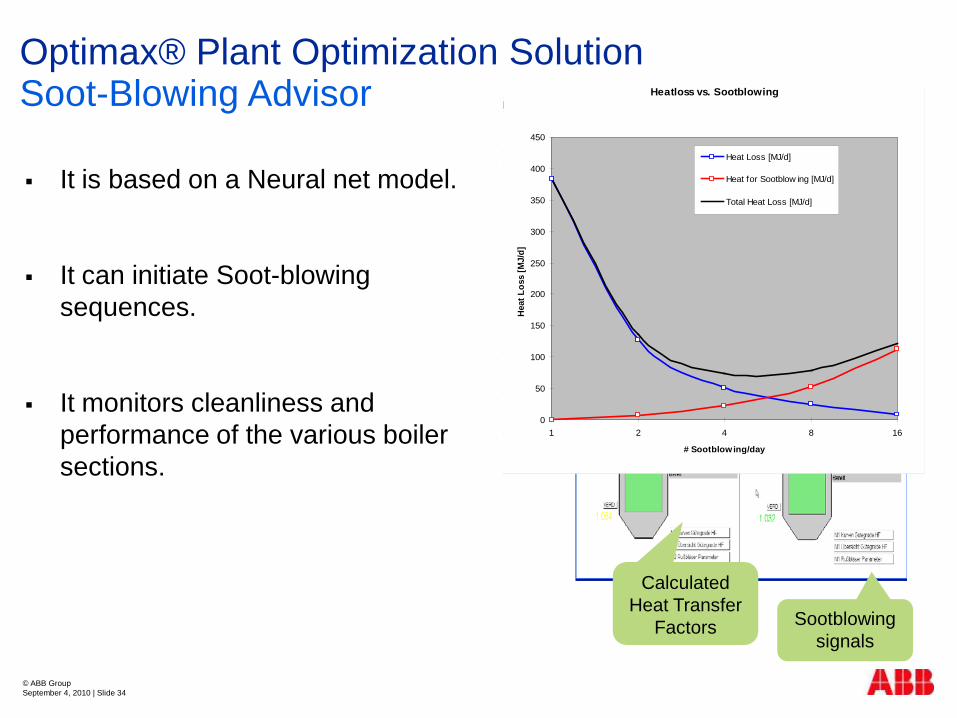
It is based on a Neural net model.
It can initiate Soot-blowing sequences.
It monitors cleanliness and performance of the various boiler sections.
Calculated Heat Transfer
Factors Sootblowing signals
86400kWh 8.64E+10 kJ 1 Heat Loss [MJ/d] 383 9000 kJ/kWh Heat for Sootblowing [MJ/d] 0.5 Total Heat Loss [MJ/d] 383.5 1350
203.6
5.55555556
Heatloss vs. Sootblowing
0
50
100
150
200
250
300
350
400
450
1 2 4 8 16
# Sootblowing/day
Hea
t Los
s [M
J/d]
Heat Loss [MJ/d]
Heat for Sootblow ing [MJ/d]
Total Heat Loss [MJ/d]
Optimax® Plant Optimization SolutionSoot-Blowing Advisor

© ABB GroupSeptember 4, 2010 | Slide 35
Tells the operator when and where to soot blow and for how much time.
Minimizes the overall cost for soot blowing.
Stops reduction of heat transfer efficiency and hence reduces loss of fuel.
Avoids high rates of tube wastage in the vicinity of soot blowers due to excessive wall blowing.
0
20
40
60
80
100
120
140
160
180
200
1.0 0.9 0.8 0.7Surface Effectiveness
ReheaterSuperheaterEconomizerFurnace
Base line heat Rate9734.6 BTU/kwhr
0.0 33 67 100Furnace Dirtiness %
Optimax® Plant Optimization SolutionSoot-Blowing Advisor

© ABB GroupSeptember 4, 2010 | Slide 36
265 MW Rawhide Energy Station Unit #1, Colorado,USA.
Optimax® Plant Optimization SolutionSoot-Blowing Advisor
Project References

© ABB GroupSeptember 4, 2010 | Slide 37
At the 265 MW Rawhide Energy Station Unit #1
60k$ saved with extended cleaning schedule
Operation cost reductions of 180k$ achieved by minimizing the reheat spray flow
Optimax® Plant Optimization SolutionSoot-Blowing Advisor
Benefits

© ABB GroupSeptember 4, 2010 | Slide 38
It is used for Boiler Start-up Optimization for large utility to meet base load to have shorter startup time. Similarly shorter shutdown time.
Based on nonlinear dynamic model.
It reduces startup costs for having plants of higher capacities having frequent startups.
Traditional vs. BoilerMax
unused potential
Savings with BoilerMax
design limits
Fuel flow
HP-Bypass position
LS-Temperature
dT thickwalled component
Optimax® Plant Optimization SolutionBoilerMax
© ABB GroupSeptember 4, 2010 | Slide 39
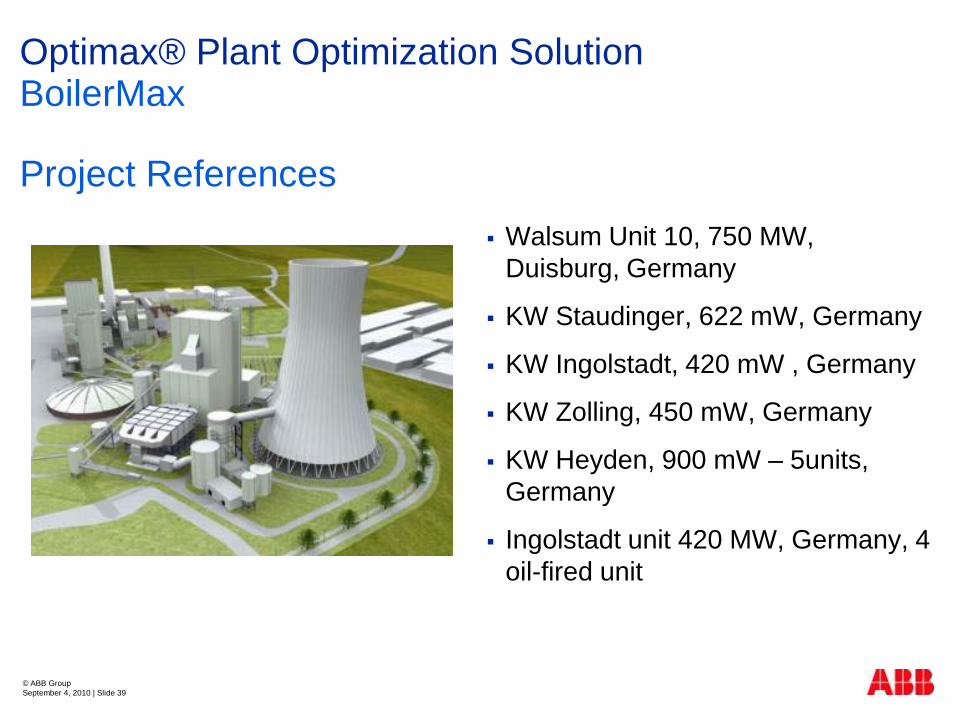
Walsum Unit 10, 750 MW, Duisburg, Germany
KW Staudinger, 622 mW, Germany
KW Ingolstadt, 420 mW , Germany
KW Zolling, 450 mW, Germany
KW Heyden, 900 mW – 5units, Germany
Ingolstadt unit 420 MW, Germany, 4 oil-fired unit
Optimax® Plant Optimization SolutionBoilerMax
Project References

© ABB GroupSeptember 4, 2010 | Slide 40
For a coal-fired unit of 700 MW, BoilerMax may reduce startupcosts by 10 to 15%, resulting in savings of 130k$ per year
Optimax® Plant Optimization SolutionBoilerMax
Benefits
© ABB Group September 4, 2010 | Slide 41
Contents
Today’s energy challenges
ABB in Energy Efficiency
Optimax® Plant Optimization Solution
Introduction
Product Portfolio
Optimax Products
Typical Layout
Summary
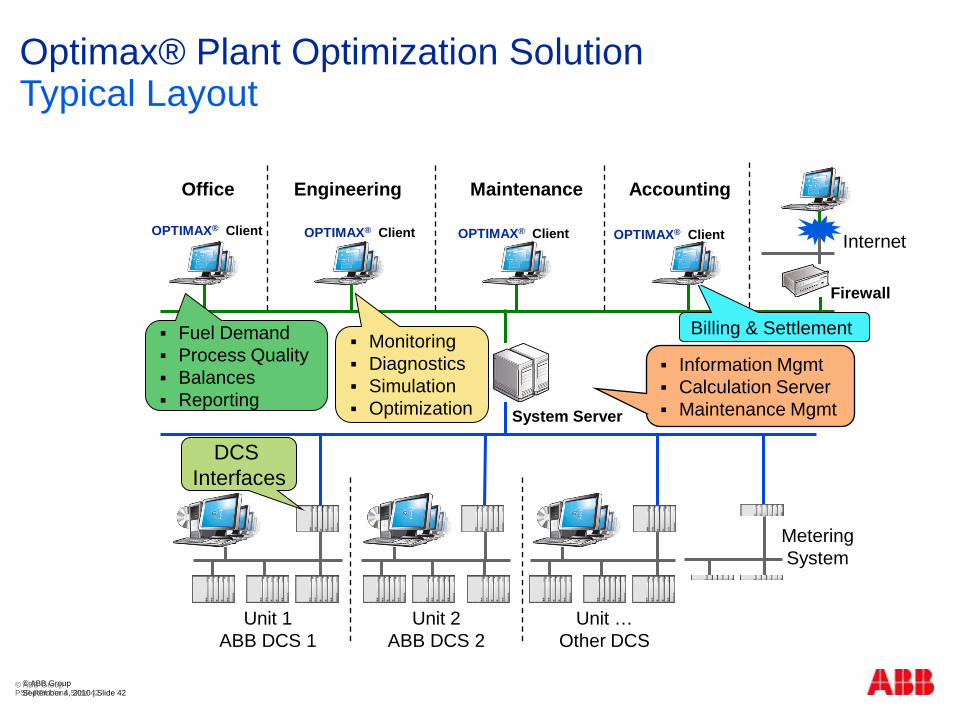
© ABB GroupSeptember 4, 2010 | Slide 42
© ABB Group PSP-PRU / ma Slide 42
Unit 2ABB DCS 2
Unit 1ABB DCS 1
Unit …Other DCS
System Server
Internet
Office Engineering Maintenance Accounting
Monitoring Diagnostics Simulation Optimization
Information Mgmt Calculation Server Maintenance Mgmt
MeteringSystem
Billing & Settlement Fuel Demand Process Quality Balances Reporting
OPTIMAX® ClientOPTIMAX® Client OPTIMAX® ClientOPTIMAX® Client
DCS Interfaces
Firewall
Optimax® Plant Optimization SolutionTypical Layout
© ABB Group September 4, 2010 | Slide 43
Contents
Today’s energy challenges
ABB in Energy Efficiency
Optimax® Plant Optimization Solution
Introduction
Product Portfolio
Optimax Products
Typical Layout
Summary
© ABB GroupSeptember 4, 2010 | Slide 44
Energy Efficiency, Fuel Conservation, Low Emissions
Power Plant Performance Reporting and Improvement under the Provision of the Indian Energy Conservation Act; Evonik,VGB are working under Indo German Program .
There were talk on regulations for the efficiency of Power Generation in European Union*
Different Power plants in India under the above banner have a Energy Management Policy which talks about efficiency and cost-effectiveness*.
Power and Productivity for a Better world
Summary
Optimization

© ABB Group September 4, 2010 | Slide 45
Summary
Thank you for your patience…………….Any questions please.
For any clarifications please write to [email protected]