Page 1
NC WARN
Duke Environmental Law and Policy Clinic
The Climate Times
Chapel Hill, North Carolina
March 29, 2016
J. David HughesPost Carbon Institute
Global Sustainability Research Inc.
Shale Gas: Myths and RealitiesLong-term Sustainability and Implications for Future
Energy Security
Page 2
Points to be covered:
- SHALE GAS – A look at the fundamentals with examples from
major U.S. plays
-The SHALE REVOLUTION and
CONVENTIONAL WISDOM
- IMPLICATIONS for long term energy sustainability
2
Page 3
Conventional Wisdom
• The United States is on the verge of Energy Independence thanks
to the “SHALE REVOLUTION”.
• Shale Gas production will continue to grow for the foreseeable
future (2040 at least) and prices will remain low.
• The way is clear for U.S. LNG exports to monetize the shale gas
bounty.
• Shale gas production, although temporarily in decline, can be
turned around very quickly with a slight increase in prices. The sky
is the limit when it comes to increasing production.
© Hughes GSR Inc, 2016
3
Page 5
0
2
4
6
8
10
12
0
5
10
15
20
25
30
35
40
2012 2015 2018 2021 2024 2027 2030 2033 2036 2039
Price
$2
01
3 p
er M
Mb
tuTr
illi
on
Cu
bic
Fe
et
pe
r Ye
ar
Year
LNG Imports Canada Imports
Shale Gas Alaska
Coalbed Methane Tight Gas
Conventional Offshore
Domestic Demand Price (Henry Hub)
U.S. Natural Gas Supply Projection by Source, 2012-2040,
EIA Reference Case 2015
Shale Gas
(+93% 2012-2040)
55% of 2040
Production
47% increase in
production by 2040
Tight Gas
Conventional/Other
Offshore
Alaska
U.S. domestic consumption
(data from EIA Annual Energy Outlook 2015, Tables 13 and 14, http://www.eia.gov/forecasts/aeo/er/excel/yearbyyear.xlsx)© Hughes GSR Inc, 2015
5
Price
Page 6
0
10
20
30
40
50
60
70
2000 2005 2010 2015 2020 2025 2030 2035 2040
Gas P
rod
ucti
on
(B
illi
on
cu
bic
feet
per
day)
Year
Other Antrim Bakken Woodford Fayetteville Utica Barnett Eagle Ford Haynesville/Bossier Marcellus
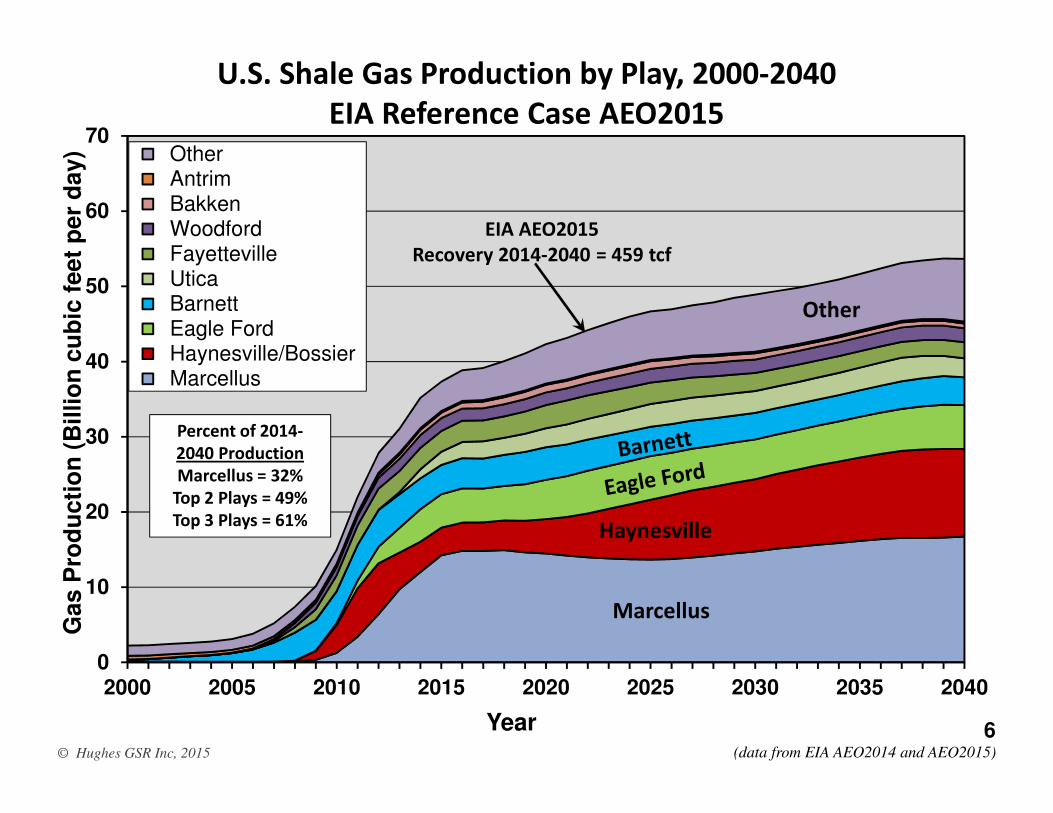
U.S. Shale Gas Production by Play, 2000-2040
EIA Reference Case AEO2015
© Hughes GSR Inc, 2015 (data from EIA AEO2014 and AEO2015)
Haynesville
Marcellus
Percent of 2014-
2040 Production
Marcellus = 32%
Top 2 Plays = 49%
Top 3 Plays = 61%
Other
EIA AEO2015
Recovery 2014-2040 = 459 tcf
6
Page 7
0
5
10
15
20
25
30
35
40
45
2000 2002 2004 2006 2008 2010 2012 2014
Gas P
rod
ucti
on
(B
illi
on
cu
bic
feet
per
day)
Year
Rest of US
Utica
Woodford
Marcellus
Eagle Ford
Antrim
Bakken
Fayetteville
Barnett
Haynesville
U.S. Shale Gas Production by Play, 2000-2016
© Hughes GSR Inc, 2016 (data from EIA Natural Gas Weekly Update, March, 2016 )
Barnett
Haynesville
Marcellus
Current Production
Top Play = 37%
Top 2 Plays = 48%
Top 6 Plays = 78%
5 Legacy Plays
Collectively Peaked in
August 2012 and
are down 32%
as of January 2016
Peak October 2015
Eagle Ford
7
Page 8
The Shale Play Life Cycle
• Discovery followed by leasing frenzy.
• Drilling boom follows to meet “held-by-production” lease requirements.
• Sweet spots identified, targeted and drilled off. Companies always drill
their best locations first.
• Production rises rapidly and is maintained for cash-flow despite
potentially uneconomic full-cycle costs.
• Sweet spots become saturated and well quality and field production
decline.
• Plays like the Haynesville become middle aged after just five years.
© Hughes GSR Inc, 2014 8
Page 9
0
500
1000
1500
2000
2500
3000
3500
4000
0
1
2
3
4
5
6
7
8
2007 2008 2009 2010 2011 2012 2013 2014 2015
Nu
mb
er o
f Pro
du
cin
g W
ells
Gas P
rod
ucti
on
(B
illi
on
cu
bic
feet
per
day)
Year
Gas Production
Number of Wells
SHALE PLAY LIFE CYCLE - Haynesville Gas Production and Number of
Producing Wells, 2007-2015
© Hughes GSR Inc, 2016 (data from Drillinginfo, March, 2016)
Peak November 2011
Production
Down 50%
Discovery
Leasing Boom
Drilling Boom
Decline
9
Page 10
© Hughes GSR Inc, 2016 (map by John Van Hoesen based on data from Drillinginfo, August, 2014)
Haynesville Play – Well Quality by Initial Gas Production
10
Page 11
0
1000
2000
3000
4000
5000
6000
7000
8000
1 6 11 16 21 26 31 36 41 46
Ga
s P
rod
uct
ion
(T
ho
usa
nd
cu
bic
fe
et
/da
y)
Months on Production
Haynesville Average Gas Well Decline Curve
3-Year Decline = 89%
First Year = 59%
Second Year = 54%
Third Year = 39%
Fourth Year = 23%
© Hughes GSR Inc, 2016 (data from Drillinginfo, March, 2016)
11
Page 12
0
500
1000
1500
2000
2500
3000
3500
4000
0
1
2
3
4
5
6
7
8
2010 2011 2012 2013 2014 2015
Nu
mb
er o
f Pro
du
cin
g W
ells
Gas P
rod
ucti
on
(B
illi
on
cu
bic
feet/
day)
Year
Pre-2014 Production
Total Production
Number of pre-2014 Wells
Total Number of Wells
First Year Field Decline = 41%
Haynesville Field Decline – Gas Production from all Wells Drilled
Prior to 2014
© Hughes GSR Inc, 2016 (data from Drillinginfo, March, 2016)
12
Page 13
0
200
400
600
800
1000
1200
-12000
-10000
-8000
-6000
-4000
-2000
0
2000
4000
6000
2008 2009 2010 2011 2012 2013 2014 2015
Drillin
g R
ate
(Wells
per Y
ear)
An
nu
al
Gas P
rod
ucti
on
Ad
ded
per
Well
(Th
ou
san
d c
ub
ic f
eet
per
day)
Year
Field Production Added per New Well
Wells Added in prior 12 months
Haynesville Annual Gas Production Added per New Well, 2008-2015
© Hughes GSR Inc, 2014 (data from Drillinginfo, February, 2014, three month trailing moving average)
Drilling Rate peaks @ 1100 wells/year
700 Wells per Year @ 7 bcf/day
@$9M/Well = $6.3 Billion/year
Production will fall to
3bcf/day with 200 wells/year
@$9M/Well = $1.8 Billion/yearGROWTH
DECLINE
13
Page 14
4000
4500
5000
5500
6000
6500
7000
2011 2012 2013 2014 2015
Avera
ge F
irst
Six
Mo
nth
Pro
du
cti
on
(T
ho
usan
d c
ub
ic f
eet/
day)
Year
Haynesville Average
Haynesville Well Productivity – Average Production Rate over First
Six Months, 2011-2015
(data from Drillinginfo, March, 2016)
Peak well productivity 2014
© Hughes GSR Inc, 2016
Down 4% from 2014 peak
Sweet Spot exhaustion?
Increase a result both of
better technology and
Sweet Spot focus
14
Page 15
Haynesville Sweetspot Well Footprint
1 Mile
© Hughes GSR Inc, 2016 (data from Drillinginfo, March, 2016)
15
Page 16
Haynesville Sweetspot Well Footprint
1 Mile
© Hughes GSR Inc, 2016 (data from Drillinginfo, March, 2016)
16
4-5 acre multi-well pads
Page 17
0
2000
4000
6000
8000
10000
12000
14000
16000
0
1
2
3
4
5
6
7
8
9
2000 2004 2008 2012 2016 2020 2024 2028 2032 2036 2040
Nu
mb
er o
f Pro
du
cin
g W
ells
Gas P
rod
ucti
on
(B
illi
on
cu
bic
feet
per
day)
Year
Most likely Production
High drilling rate Production
Low drilling rate Production
Most likely Wells - 300/y
High drilling rate Wells 500/y declining to 300/y
Low drilling rate Wells - current rate 200/y
Haynesville Gas Production Forecast in various Drilling Rate
Scenarios through 2040
© Hughes GSR Inc, 2014 (data from Drillinginfo, August, 2014,
Peak 2011
Recovery to date 11.7 tcf
Recovery by 2040
30-50 tcf
17
Page 18
0
2000
4000
6000
8000
10000
12000
0
2
4
6
8
10
12
14
2000 2004 2008 2012 2016 2020 2024 2028 2032 2036 2040
Nu
mb
er o
f Pro
du
cin
g W
ells
Gas P
rod
ucti
on
(B
illi
on
cu
bic
feet
per
day)
Year
EIA AEO2015 excess
Most likely Production
EIA AEO2015
Most likely Wells
Haynesville Gas Production in Most Likely Rate Scenario through
2040 compared to EIA 2015 Projection
© Hughes GSR Inc, 2015 (data from Drilling Deeper, 2014;EIA AEO2015 Reference Case Projection)
EIA AEO2015
Recovery 2014-2040 = 79 tcf
An Extra 50 tcf (174%)
Recovery 2014-2040 = 29 tcf
Peak 2011
18
Page 19
© Hughes GSR Inc, 2015 (data from EIA, 2015)
Distribution and elevation of Marcellus (feet)
19
Page 20
0
2000
4000
6000
8000
10000
12000
0
2
4
6
8
10
12
14
16
18
2007 2008 2009 2010 2011 2012 2013 2014 2015
Nu
mb
er o
f Pro
du
cin
g W
ells
Gas P
rod
ucti
on
(B
illi
on
cu
bic
feet
per
day)
Year
WV Production
PA Production
EIA Weekly
Number of Wells
Marcellus Gas Production and Number of
Producing Wells, 2007-2015
© Hughes GSR Inc, 2016
(data from Drillinginfo, March, 2016; PA 6-month trailing moving average;
WV 3-month trailing moving average with 2015 estimated; EIA Weekly = natural gas weekly report March 13, 2016)
20
Peak April 2015
Pennsylvania
WV
Page 21
Marcellus Shale Gas Play, All Wells, 2005-2014
© Hughes GSR Inc, 2014 (data from Drillinginfo, September, 2014)21
Page 22
0
1
2
3
4
Tril
lio
n C
ub
ic F
ee
t
County
Marcellus Cumulative Gas Production by County December, 2015
© Hughes GSR Inc, 2015 (data from Drillinginfo; PA current to December, 2015; WV current to December, 2014)
Top 2 counties = 39% of production
Top 5 counties = 68% of production
Top 8 counties = 81% of production
22
Page 23
0
1000
2000
3000
4000
5000
6000
7000
8000
1 6 11 16 21 26 31 36 41 46
Ga
s P
rod
uct
ion
(T
ho
usa
nd
cu
bic
fe
et
/da
y)
Months on Production
Susquehanna
Bradford
Lycoming
Washington
Next 4 counties
Other counties
Marcellus Average Gas Well Decline Curves by County
3-Year Decline
Susquehanna = 81%
Bradford = 72%
Lycoming = 77%
Washington = 81%
Next 4 counties = 85%
Other counties = 84%
© Hughes GSR Inc, 2016 (data from Drillinginfo, March, 2016)
23
Page 24
0
1
2
3
4
5
6
7
8
Susquehanna Bradford Lycoming Washington Next 4Counties
OtherCounties
Bil
lio
n C
ub
ic F
eet
County
Next 21 Years
First Four Years
Estimated Ultimate Recoverable Gas per Well By County
© Hughes GSR Inc, 2016 (data from Drillinginfo, March, 2016)
10
17
We
lls
10
46
We
lls
74
5 W
ell
s
11
36
We
lls
42
38
We
lls
16
85
We
lls
64% to 71% is Recovered
in first 4 Years
7.29
5.77
4.43
3.43
4.52
2.60
24
Page 25
0
1000
2000
3000
4000
5000
6000
7000
8000
2011 2012 2013 2014 2015
Av
era
ge F
irst
12
Mo
nth
s o
f P
rod
uct
ion
(Th
ou
san
d c
ub
ic f
ee
t /d
ay
)
Months on Production
Susquehanna
Bradford
Lycoming
Washington
Next 4 counties
Marcellus Average Well
First 12 Months of Production by County
© Hughes GSR Inc, 2016 (data from Drillinginfo, March, 2016)
Susquehanna
Technology hits limit
Other counties
Bradford
25
Page 26
Marcellus Northeast Pennsylvania Sweetspot Well Footprint
10 Miles
© Hughes GSR Inc, 2016 (data from Drillinginfo, March, 2016)
26
Page 27
Marcellus Northeast Pennsylvania Sweetspot Well Footprint
1 Mile
© Hughes GSR Inc, 2016 (data from Drillinginfo, March, 2016)
27
Page 28
Marcellus Northeast Pennsylvania Sweetspot Well Footprint
1 Mile
© Hughes GSR Inc, 2016 (data from Drillinginfo, March, 2016)
28
Page 29
0
5000
10000
15000
20000
25000
30000
35000
40000
45000
50000
0
2
4
6
8
10
12
14
16
18
2000 2004 2008 2012 2016 2020 2024 2028 2032 2036 2040
Nu
mb
er o
f Pro
du
cin
g W
ells
Gas P
rod
ucti
on
(B
illi
on
cu
bic
feet
per
day)
Year
West Virginia Production
Pennsylvania Production
Most Likely Rate 1320 Wells/year declining to 920
Marcellus Gas Production Forecast by State in Most Likely Drilling
Rate Scenario through 2040
© Hughes GSR Inc, 2016 (data from Drillinginfo, September, 2014)
Peak 2018
Recovery to date 17.3 tcf
Ultimate Recovery
129 tcf by 2040
Pennsylvania
West Virginia
29
Page 30
0
5000
10000
15000
20000
25000
30000
35000
40000
0
2
4
6
8
10
12
14
16
18
2000 2004 2008 2012 2016 2020 2024 2028 2032 2036 2040
Nu
mb
er o
f Pro
du
cin
g W
ells
Gas P
rod
ucti
on
(B
illi
on
cu
bic
feet
per
day)
Year
EIA AEO2015 excess
Most likely Production
EIA AEO2015
Most likely Wells
Marcellus Gas Production in Most Likely Rate Scenario through
2040 compared to EIA AEO 2015
© Hughes GSR Inc, 2015 (data from Drilling Deeper, 2014; EIA AEO2014 and EIA AEO2015)
Peak 2018
EIA AEO2015
Recovery 2014-2040 = 147 tcf
An Extra 27 tcf (22%)
Recovery 2014-2040 = 120 tcf
30
Page 31
0
2000
4000
6000
8000
10000
12000
Bakken Barnett Eagle Ford FayettevilleHaynesville Marcellus Woodford
Avera
ge W
ell
Pro
du
cti
on
(m
cf/
day)
County
Average
Sweet Spot
© Hughes GSR Inc, 2014 (data from Drillinginfo, October, 2014)
Major Shale Play Well Quality in 2013
Average and Sweet Spots – First 12 month Production Rate
31
Page 32
0
20000
40000
60000
80000
100000
120000
140000
160000
180000
200000
0
5
10
15
20
25
30
35
40
45
2000 2004 2008 2012 2016 2020 2024 2028 2032 2036 2040
Nu
mb
er o
f Pro
du
cin
g W
ells
Gas P
rod
ucti
on
(B
ilio
ncu
bic
feet/
per
day)
Year
Marcellus
Haynesville
Eagle Ford
Bakken
Woodford
Fayetteville
Barnett
Most likely Wells
Most Likely Drilling Rate Gas Production from Major Shale Plays
through 2040 (88% of 2014 Production)
© Hughes GSR Inc, 2014 (data from Drillinginfo, September, 2014,
Peak 2017
Marcellus
Recovery to
date 59 tcf
Remaining
232 tcf 2015-
2040
Barnett
Eagle Ford
Haynesville
32
Page 33
0
5
10
15
20
25
30
35
40
45
2000 2004 2008 2012 2016 2020 2024 2028 2032 2036 2040
Gas P
rod
ucti
on
(B
ilio
ncu
bic
feet/
per
day)
Year
EIA 2015 AdditionalMarcellusHaynesvilleEagle FordBakkenWoodfordFayettevilleBarnett
Most Likely Gas Production from Major Shale Plays through 2040
Compared to EIA AEO 2015 Projection
© Hughes GSR Inc, 2016 (data from Drillinginfo, September, 2014; EIA AEO2015)
Peak 2017
Recovery to
date 59 tcf
Remaining
232 tcf 2015-
2040
Marcellus
EIA 2015 Additional
125 tcf 2015-2040
or 54% more
20
40
EIA
Pro
du
ction
17
0%
Hig
he
er
Haynesville
Eagle Ford
Barnett
33
Page 34
0
10
20
30
40
50
60
2000 2004 2008 2012 2016 2020 2024 2028 2032 2036 2040
Gas P
rod
ucti
on
(B
ilio
ncu
bic
feet/
per
day)
Year
EIA 2015 Other PlaysEIA 2015 AdditionalMarcellusHaynesvilleEagle FordBakkenWoodfordFayettevilleBarnett
Most Likely Gas Production from Major Shale Plays through 2040
with EIA AEO 2015 Additions
© Hughes GSR Inc, 2016 (data from Drillinginfo, September, 2014; EIA AEO2015)
Recovery to
date 59 tcf
Remaining
232 tcf 2015-
2040
Marcellus
EIA 2015 Additional
From Major Plays
125 tcf 2015-2040
or 54% more
Haynesville
34
Page 35
- Shale has been a game-changer in the short-term, but projections
of long-term sustainability at low prices are highly questionable.
Summary and Implications
- Assuming long term sustainability of production at low prices is folly for energy policy. The shale revolution is a temporary windfall and
should be viewed as such.
- High quality shale plays are not ubiquitous – and plays are not
uniform. Sweet spots are exploited early in the development process.
The best parts of major plays are being drilled NOW.
35
- High well decline rates require a drilling treadmill and high capital
inputs to sustain production and offset field declines, along with
associated environmental impacts.
Page 36
Summary and Implications
- U.S. “Energy Independence” with the forecast energy trajectory is highly unlikely, barring a radical reduction in consumption and a major ramp up of renewable energy.
- A sustainable energy future requires a vision beyond the
next couple of quarters or the next election. In the absence of
a coherent plan, investments assuming cheap oil and gas in
the long term are
very likely to end badly.
36