244
Annual Report 2020 1 / 244 Stock Code: 603899 Short Name: M&G Stationery SHANGHAI M&G STATIONERY INC. Annual Report 2020
Annual Report 2020
1 / 244
Stock Code: 603899 Short Name: M&G Stationery
SHANGHAI M&G STATIONERY INC.
Annual Report 2020

Annual Report 2020
2 / 244
Going Forward with our Mission
Dear shareholders, partners and friends,
The year 2020 was an extraordinary year. Since the beginning of the year, the sudden
outbreak of the COVID-19 pandemic has brought tremendous impacts to various industries.
Due to such macroeconomic climate and the delay in school return date, many stationery
shops faced grave challenges to resume operation. Among such uncertainties, what M&G
can do is do "things with certainty". The Company acted quickly to fight against the
pandemic. On the one hand, we adopted pandemic prevention and control measures to protect
our employees, provided PPE for front-line workers and donated money and materials. On
the other hand, the Company took resolute steps to restart factories to resume production. In
the first half of the year, the Company recorded a decrease in results. With our strenuous
efforts, we achieved satisfactory performance in the second half. One of the most important
things we learned in 2020 is that if you truly aspire something , you can always work out a
way and if you persist enough, you can make the seemingly impossible come true.
In 2020, the Company recorded revenue of RMB13 billion, an increase of 17.9%, and net
profit of RMB1.2 billion, an increase of 18.4%. For the past years since going public, M&G
has maintained health growth and sound asset condition. The year 2020 was of great
significance to M&G. Exploring with the spirit of a startup company, M&G has been founded
for three decades, and it launched a new round of a five-year strategy plan.
The year 2021 is the beginning of China's 14th Five-Year Plan, and also the start of M&G's
new five-year strategy. M&G will adhere to the new development thinking of growth with
emphasis on quality and efficiency. Our new five-year strategy is formulated in line with the
direction of the previous strategy, and reflects China’s population trend and consumption
upgrade in the new era. The new strategy calls for product mix upgrade and on-line business
expansion, supported by digitalization, MBS, and merger and acquisition. The Company’s
mission is to "make study and work more joyful and effective", and the Company’s vision is
to become a "world-class M&G".
We believe that good stationery has vitality, as a good book and stationery is temperate and
can make a positive difference. In China, we see great potential in the stationery and creative
culture products industry. Every year, M&G launches thousands of new products based on
Annual Report 2020
3 / 244
consumer insights. To deliver a better experience for consumers, we hope to include new
features in our products, incorporating functionality and a sense of beauty and humor.
According to the vision to become "world-class M&G" as set out in our new five-year
strategy, M&G devotes to providing better products for China and the world, aiming to
become a pioneer in global stationery industry when it comes to products and technology.
From stationery to creative culture products, M&G must have a more open mindset. M&G
Colipu is committed to making work more joyful and effective, and becoming a leader in
China’s office supplies 2B industry with about one trillion RMB market. While promoting
international business and carrying out Dual Circulation, we will break various bottlenecks
and strive for higher goals.
Dear shareholders and partners, we will go forward with our mission in mind! M&G is
inspired by grand national rejuvenation, yet we also take clue from ordinary people. We
believe the best way to help us successfully is by helping related others successful, we believe
that the success of individuals and companies depends on their “energy, will and spirit”. We
believe in long-termism, choosing to do harder but right things, and doing daily work with
excellence. "The new era belongs to those who strive. Striving leads to happiness and striving
in itself is a happiness."
We would like to express our heartfelt thanks to our customers and partners, for your care
and support for the development of the Company. M&G is willing to work together with all
of you, remain true to our original aspiration, and forge ahead to promote a sustainable, sound
and high-quality development, and create better value for all shareholders. Strive towards a
"world-class M&G". We look forward to working with you towards a bright future!
Chairman: Chen Huwen
26 March 2021
Annual Report 2020
4 / 244
Important Notice
I. The Board of Directors, Supervisory Committee, directors, supervisors and senior management
of the Company warrant that the contents of this report are true, accurate and complete,
without any misrepresentation, misleading statements or material omissions, and severally and
jointly bear the legal responsibilities thereof.
II. All directors of the Company attended the Board meeting.
III. BDO China Shu Lun Pan Certified Public Accounts LLP has issued the audit report with
unqualified opinions to the Company.
IV. Chen Huwen, the chairman of the Company, Quan Qiang, CFO of the Company and Zhai Yu,
the head of the accounting department (person in charge of accounting), warrant the
truthfulness, accuracy and completeness of the financial report in this annual report.
V. Profit distribution plan or plan to convert surplus reserves into share capital approved by the
Board of Directors during the Reporting Period
The Company proposes to distribute cash dividend of RMB5.00 (tax inclusive) per 10 shares based
on the Company’s total share capital registered as at the registration date for the implementation of
dividend distribution. The profit distribution plan is subject to being submitted the Company's 2020 annual
general meeting of shareholders for deliberation.
VI. Risks statement of the forward-looking statements
"√ Applicable" "□ Not applicable"
Forward-looking statements including future plans and development strategies involved in this
annual report do not constitute the Company’s substantive commitments to investors. The investors are
advised to pay attention to investment risks.
VII. Is there any non-operating misappropriation of funds of the Company by any controlling
shareholders and their related parties
No
VIII. Has the Company provided any external guarantees in violation of the decision-making
procedures
No
IX. Are there more than half of the directors who cannot warrant the truthfulness, accuracy and
completeness of the annual report disclosed by the Company
No
X. Warning on significant risks
The Company has illustrated various risks and corresponding measures that the Company might face
in the production and operation. Please refer to the “Potential Challenges and Risks” set out in the
“Discussion and Analysis of Operation” under Chapter IV. Investors are advised to pay attention to risk
of investment.
XI. Others
"□ Applicable" "√ Not applicable"

Annual Report 2020
5 / 244
本报告分别以中、英文编制,在对中外文文本的理解上发生歧义时,以中文文本为准。
This English version is converted from the Chinese version.
In case of any discrepancy between the Chinese version and the English version, the
Chinese version shall prevail.

Annual Report 2020
6 / 244
Contents
Pressing Forward with Mission in Mind ..................................................................................................... 2
Chapter I Definition ............................................................................................................................ 7
Chapter II Company Profile and Key Financial Indicators .................................................................. 8
Chapter III Business Overview ............................................................................................................ 13
Chapter IV Discussion and Analysis of Operation............................................................................... 18
Chapter V Major Events ..................................................................................................................... 39
Chapter VI Changes in Ordinary Shares and Shareholders ................................................................. 66
Chapter VII Preference Shares .............................................................................................................. 76
Chapter VIII Directors, Supervisors, Senior Management and Employees ........................................... 77
Chapter IX Corporate Governance....................................................................................................... 84
Chapter X Corporate Bonds ................................................................................................................ 88
Chapter XI Financial Report ................................................................................................................ 89
Chapter XII References ....................................................................................................................... 244
Annual Report 2020
7 / 244
Chapter I Definition
I. Definition
In this report, unless the content requires otherwise, the following terms shall have the following
meanings:
Definition of common terms
The Report Annual Report 2020
Company, the Company, M&G
Stationery
SHANGHAI M&G STATIONERY INC.
M&G Group M&G Holdings (Group) Co., Ltd.
M&G Colipu Shanghai M&G Colipu Office Supplies Co., Ltd.
M&G Life(晨光生活馆) M&G Life Enterprise Management Co., Ltd.(晨光生活馆企
业管理有限公司)/Large retail store of the Company
M&G Technologies Shanghai M&G Information Technology Co., Ltd.(上海晨光
信息科技有限公司)
Jiekui Investment Shanghai Jiekui Investment Management Firm (L.P.)
Keying Investment Shanghai Keying Investment Management Office (L.P.)
Chenguang Venture Capital
Center(晨光创投)
Shanghai Chenguang Venture Capital Center (L.P.)
Chenguang Sanmei(晨光三美) Shanghai Chenguang Sanmei Property Investment Co., Ltd.
Jiumu Store(九木杂物社) Jiumu M&G Store Enterprise Management Co., Ltd.(九木杂
物社企业管理有限公司)/Large retail store of the Company
M&G Office Supplies(晨光办
公)
Shanghai M&G Office Supplies Co., Ltd.
Office Depot Office Depot Network Technology Co., Ltd.
Axus Stationery Axus Stationery (Shanghai) Company Ltd.
KA Key Account, usually referring to large cross-regional retailers
with large operating space and dense customer flow, including
RT-MART, Walmart, Carrefour, Hualian Supermarket.
Reporting Period Year 2020, from 1 January 2020 to 31 December 2020
Yuan, ten thousand Yuan,
hundred million Yuan
RMB, RMB10,000, RMB100 million
Annual Report 2020
8 / 244
Chapter II Company Profile and Key Financial Indicators
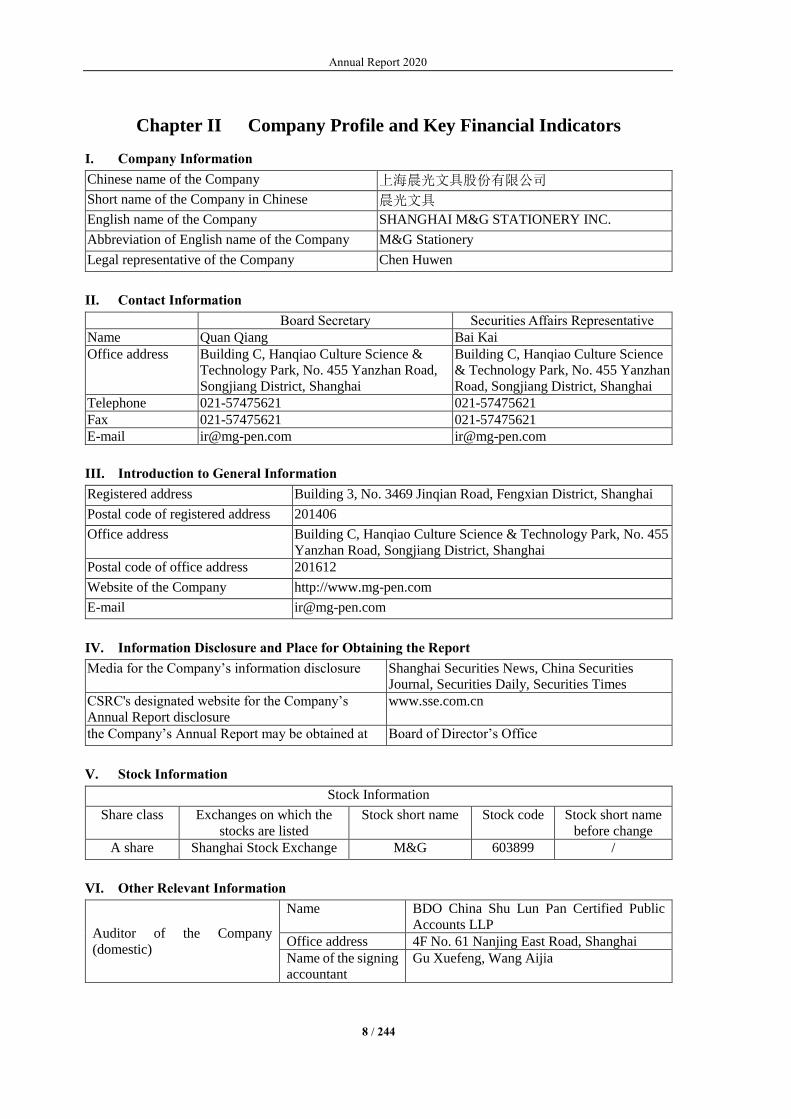
I. Company Information
Chinese name of the Company 上海晨光文具股份有限公司
Short name of the Company in Chinese 晨光文具
English name of the Company SHANGHAI M&G STATIONERY INC.
Abbreviation of English name of the Company M&G Stationery
Legal representative of the Company Chen Huwen
II. Contact Information
Board Secretary Securities Affairs Representative
Name Quan Qiang Bai Kai
Office address Building C, Hanqiao Culture Science &
Technology Park, No. 455 Yanzhan Road,
Songjiang District, Shanghai
Building C, Hanqiao Culture Science
& Technology Park, No. 455 Yanzhan
Road, Songjiang District, Shanghai
Telephone 021-57475621 021-57475621
Fax 021-57475621 021-57475621
E-mail [email protected] [email protected]
III. Introduction to General Information
Registered address Building 3, No. 3469 Jinqian Road, Fengxian District, Shanghai
Postal code of registered address 201406
Office address Building C, Hanqiao Culture Science & Technology Park, No. 455
Yanzhan Road, Songjiang District, Shanghai
Postal code of office address 201612
Website of the Company http://www.mg-pen.com
E-mail [email protected]
IV. Information Disclosure and Place for Obtaining the Report
Media for the Company’s information disclosure Shanghai Securities News, China Securities
Journal, Securities Daily, Securities Times
CSRC's designated website for the Company’s
Annual Report disclosure
www.sse.com.cn
the Company’s Annual Report may be obtained at Board of Director’s Office
V. Stock Information
Stock Information
Share class Exchanges on which the
stocks are listed
Stock short name Stock code Stock short name
before change
A share Shanghai Stock Exchange M&G 603899 /
VI. Other Relevant Information
Auditor of the Company
(domestic)
Name BDO China Shu Lun Pan Certified Public
Accounts LLP
Office address 4F No. 61 Nanjing East Road, Shanghai
Name of the signing
accountant
Gu Xuefeng, Wang Aijia
Annual Report 2020
9 / 244
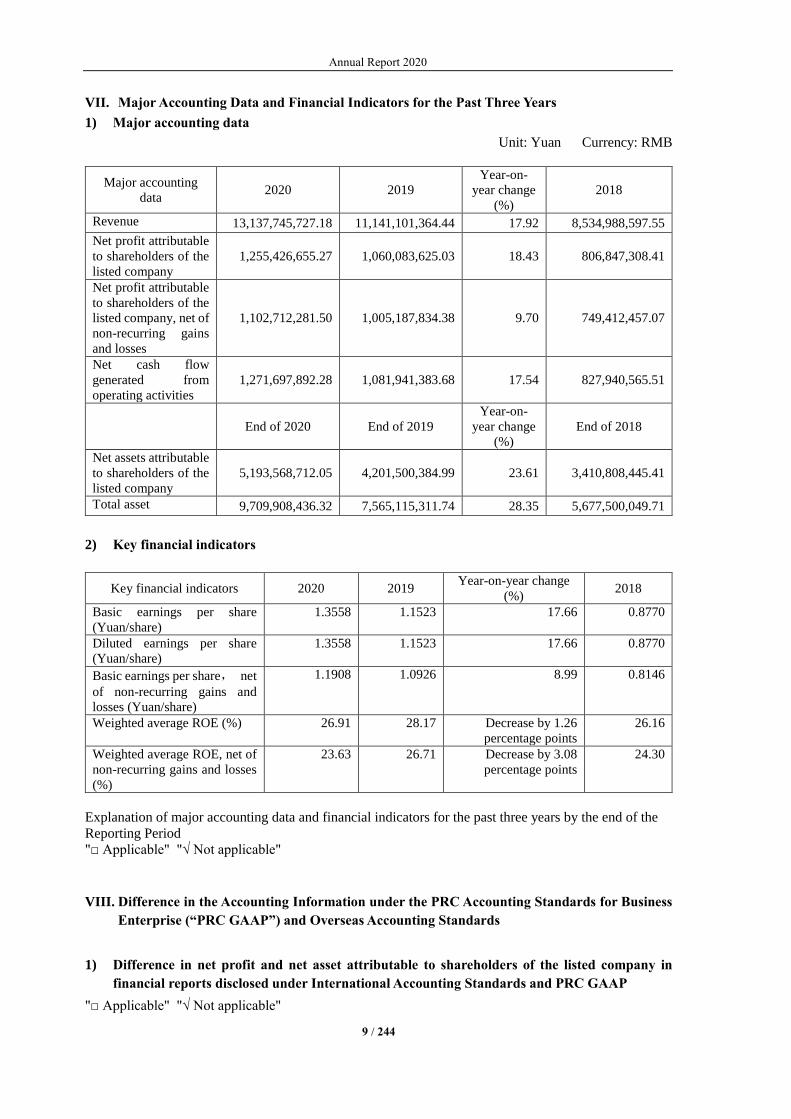
VII. Major Accounting Data and Financial Indicators for the Past Three Years
1) Major accounting data
Unit: Yuan Currency: RMB
Major accounting
data 2020 2019
Year-on-
year change
(%)
2018
Revenue 13,137,745,727.18 11,141,101,364.44 17.92 8,534,988,597.55
Net profit attributable
to shareholders of the
listed company
1,255,426,655.27 1,060,083,625.03 18.43 806,847,308.41
Net profit attributable
to shareholders of the
listed company, net of
non-recurring gains
and losses
1,102,712,281.50 1,005,187,834.38 9.70 749,412,457.07
Net cash flow
generated from
operating activities
1,271,697,892.28 1,081,941,383.68 17.54 827,940,565.51
End of 2020 End of 2019
Year-on-
year change
(%)
End of 2018
Net assets attributable
to shareholders of the
listed company
5,193,568,712.05 4,201,500,384.99 23.61 3,410,808,445.41
Total asset 9,709,908,436.32 7,565,115,311.74 28.35 5,677,500,049.71
2) Key financial indicators
Key financial indicators 2020 2019 Year-on-year change
(%) 2018
Basic earnings per share
(Yuan/share)
1.3558 1.1523 17.66 0.8770
Diluted earnings per share
(Yuan/share)
1.3558 1.1523 17.66 0.8770
Basic earnings per share, net
of non-recurring gains and
losses (Yuan/share)
1.1908 1.0926 8.99 0.8146
Weighted average ROE (%) 26.91 28.17 Decrease by 1.26
percentage points
26.16
Weighted average ROE, net of
non-recurring gains and losses
(%)
23.63 26.71 Decrease by 3.08
percentage points
24.30
Explanation of major accounting data and financial indicators for the past three years by the end of the
Reporting Period
"□ Applicable" "√ Not applicable"
VIII. Difference in the Accounting Information under the PRC Accounting Standards for Business
Enterprise (“PRC GAAP”) and Overseas Accounting Standards
1) Difference in net profit and net asset attributable to shareholders of the listed company in
financial reports disclosed under International Accounting Standards and PRC GAAP
"□ Applicable" "√ Not applicable"
Annual Report 2020
10 / 244
2) Differences in net profit and net assets attributable to shareholders of the listed company in
financial reports disclosed under overseas accounting standards and PRC GAAP
"□ Applicable" "√ Not applicable"
3) Explanation on the differences between PRC GAAP and Overseas Accounting Standards:
"□ Applicable" "√ Not applicable"
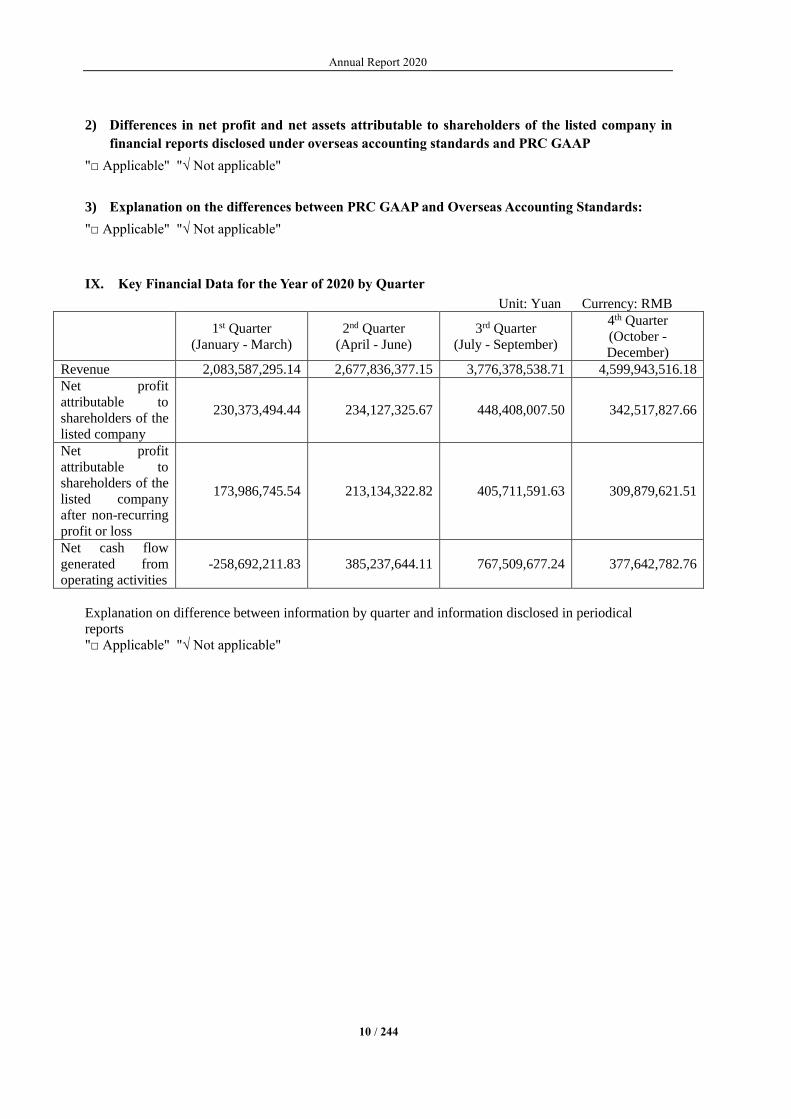
IX. Key Financial Data for the Year of 2020 by Quarter
Unit: Yuan Currency: RMB
1st Quarter
(January - March)
2nd Quarter
(April - June)
3rd Quarter
(July - September)
4th Quarter
(October -
December)
Revenue 2,083,587,295.14 2,677,836,377.15 3,776,378,538.71 4,599,943,516.18
Net profit
attributable to
shareholders of the
listed company
230,373,494.44 234,127,325.67 448,408,007.50 342,517,827.66
Net profit
attributable to
shareholders of the
listed company
after non-recurring
profit or loss
173,986,745.54 213,134,322.82 405,711,591.63 309,879,621.51
Net cash flow
generated from
operating activities
-258,692,211.83 385,237,644.11 767,509,677.24 377,642,782.76
Explanation on difference between information by quarter and information disclosed in periodical
reports
"□ Applicable" "√ Not applicable"

Annual Report 2020
11 / 244
X. Items and Amounts of Non-recurring Gains or Losses
"√ Applicable" "□ Not applicable"
Unit: Yuan Currency: RMB
Items of Non-recurring Gains or Losses Amounts in 2020 Notes (if applicable) Amounts in 2019 Amounts in 2018
Gains or losses on disposal of non-current assets 169,704.92 Mainly due to the Company's renewal of
some old equipment
6,081,606.95 -69,195.83
Government subsidies included in profits and losses for the
current period, excluding those closely related to the
normal business and of fixed amount or fixed quantity
granted on an on-going basis in accordance with certain
standards and in compliance with the State policies
135,222,930.01 Mainly including government subsidies
received during the Reporting Period and
government subsidies transferred from
deferred income
42,747,681.46
42,122,713.66
Gains or losses on entrusted investment or asset
management
35,517,479.65
Investment income arising from changes in fair values
held-for-trading financial assets, derivative financial
assets, held-for-trading financial liabilities and derivative
financial liabilities, and investment gains on the disposal
of held-for-trading financial assets, derivative financial
assets, held-for-trading financial liabilities, derivative
financial liabilities and other debt investment, except the
Company normal operations related to effective hedging
business
37,743,018.95 Revenue generated from purchase of
wealth management products
29,184,868.54
Reversal of provision for impairment of receivables and
contractual assets which are individually tested for
impairment
8,958,818.94 Mainly due to the provision reversal of bad
debts on individual receivables of the
Company
1,803,027.63
Other net non-operating income and expenses, other than
the above items
18,746,671.42 Mainly including the non-operating income
transferred from the proceeds from the
merger and acquisition of Office Depot,
and the expenditure of charity donations.
-5,743,388.02
-7,936,377.76
Effect of minority equity -18,957,557.36 -4,764,697.27 -2,192,444.11
Effect of income tax -29,169,213.11 -14,413,308.64 -10,007,324.27
Total 152,714,373.77 54,895,790.65 57,434,851.34

Annual Report 2020
12 / 244
XI. Items Measured at Fair Values
"√ Applicable" "□ Not applicable"
Unit: Yuan Currency: RMB
Items Opening balance Closing balance Changes in the Period Effect on profit for the Period
Held-for-trading financial assets 661,878,587.24 1,428,277,848.33 766,399,261.09 32,281,250.23
Receivables financing 29,549,924.83 61,412,976.46 31,863,051.63
Derivative financial assets
Other debt investments (including other
current assets)
Other non-current financial assets
Investments in other equity instruments 3,909,179.93 5,476,577.42 1,567,397.49
Held-for-trading financial liabilities
Derivative financial liabilities
Total 695,337,692.00 1,495,167,402.21 799,829,710.21 32,281,250.23
XII. Others
"□ Applicable" "√ Not applicable"
Annual Report 2020
13 / 244
Chapter III Business Overview
I. Description of the Company’s principal business, operation model and industry condition
during the Reporting Period
1) Principal business and operation model
1. Principal business
M&G Stationery is a comprehensive stationery supplier and an office servicer. The Company
integrates the value of creativity into its products and service advantages, advocates fashionable stationery
lifestyle, and provides solutions for study and work. Its traditional core businesses include designing,
developing, manufacturing and selling writing instruments, student stationery, office supplies and other
products under brands, and also the e-commerce business M&G Technologies; its New
businesses mainly comprise of own-operated retail stores - Jiumu Store and M&G Life, and direct office
supplies service - M&G Colipu. During the Reporting Period, there were no significant changes in the
Company's principal business and operation model.
2. Principal operation model
The Company has an independent and complete operation from design and development of brands
and products, procurement of raw materials and accessories, product manufacturing, supply chain
management and warehouse and logistics, to distribution network management. The Company is capable
of performing independent operation of business in the market. For R&D and new products development
model, the Company has an “entire design system” covering the whole process starting from customer
value proposition to product design, product mold to brand image design, incorporating trend-, theme and
experience-oriented development model to develop new products with a comprehensive categories
approach based on consumer insight. For manufacturing model, the Company uses the brand
manufacturing model that features sales-driven production, in-house and OEM outsourcing. The Company
has an independent system from raw material procurement to manufacturing and selling, and has
established its brands in the market. We have the advantages from participating in the whole value chain
from design, research and developing, manufacturing and selling stationery. For sales model, based on
features of stationery products and current situations of domestic stationery consumption, the Company
has developed its sales model that relies on regional distributors, complemented by direct sales to offices
2B customers, direct-sale store, KA sales, online sales, as well as international distribution. We are the
one of leading companies in China’s stationery business that engage in large-scale brand sales
management and franchise management.
M&G Technologies mainly comprises of online businesses in Tmall and JD. Tmall business is M&G
Technologies’ Tmall flagship store where customers can place orders. For the business on JD platform, it
takes purchase order monthly based on inventory and shelf sales ratio, and responds to purchase order
according to M&G Technologies’ actual inventory condition; after the order is confirmed, it will then be
forwarded to the warehouse system where it then delivers goods to JD according to the confirmed purchase
order. M&G Technologies is also responsible for online full platform marketing and management of
authorized online stores.
M&G retail store businesses include two store types: Jiumu stores and M&G Life stores. Targeting
female consumers aged 15-29, Jiumu Stores primarily sell stationery, cultural and recreative products,
educational and entertainment products, and daily household and home products. Jiumu stores are mostly
located in high-quality shopping malls in prime urban districts. Jiumu stores represent the Company’s
ongoing exploration in new retail model in lifestyle products with a distinct cultural element. Jiumu Store
started franchising in July 2018, where franchisees pay contract deposit and decoration fee according to
contracts, and store rent, store staff salary, utilities and other costs incurred in franchising stores. M&G

Annual Report 2020
14 / 244
Life stores mainly target students aged 8-15, primarily selling stationery products. M&G Life stores mostly
locate in Xinhua Bookstore and compound bookstores, M&G Life stores represent the Company’s efforts
to move beyond the dominant traditional channels of retail stationery shops nearby schools.
In the direct office supplies service business,M&G Colipu provides governments, public institutions,
Fortune Global 500 companies and other SMEs with cost-effective one-stop office supplies procurement
service. M&G Colipu has a rich product offering, covering office supplies, MRO industrial products,
marketing gifts, employee benefits and corporate services, more than one million products including office
paper, office stationery, office supplies, office equipment, computers and accessories, digital and
communications, office appliances, daily necessities, labor protection industrial supplies, food and
beverages, business gifts and office furniture. By shortening the supply chain, M&G Colipu provides
customers with cost-effective procurement and customized value-added services.
With changing demographics of China in particular the decreasing birth rate, it becomes increasingly
difficult to achieve revenue growth from unit volume growth in the future, and stationery industry growth
is increasingly driven by consumption upgrade and product upgrade. The Company’s traditional core
businesses are challenged with changing demands from more individualized population born after 1990
and 2000. Stationery consumption in China is becoming more brand conscious, innovative, individualized
and more premium. There is a clear growth in demand for better cultural and creative products, which
accelerates industry transformation towards one with more cultural and creative elements. M&G
Technologies reflects channel diversification trend and helps the Company's omni-channel strategy by
expansion of online business. Jiumu stores and M&G Life stores both serve as the Company’s bridgehead
to continue products and channels upgrading of its traditional core businesses, and they play an important
role in promoting the Company’s brands and products upgrade. M&G Colipu’s direct office supplies
service business meets demands for purchasing office supplies from large corporations and institutions,
which helps boosting the sales of writing instruments and office stationery of the Company’s traditional
core business.
3. Major driver for revenue growth
(1) Social transformation and consumption upgrade; (2) State investment in education; (3) Favorable
policy environment for culture industry development; (4) Continued growth in household income; (5)
Second-child policy; (6) Fragmented industry with low concentration.
2) Situations and features of industry where the Company operates, and industry status of the
Company
1. Situations of industry where the Company operates
According to Guidelines for the Industry Classification of Listed Companies (revised in 2012) issued
by China Securities Regulatory Commission, and results of industry classification of listed companies
released by China Securities Regulatory Commission, the Company is classified to stationery, arts, sports
and entertainment products industry. The Company is a member of China Stationery & Sporting Goods
Association, and China Writing Instrument Association.
During January-November 2020, revenue of China’s stationery and office supplies industry
amounted to RMB136.7 billion, representing a decline of 1% from the previous year, and total profits
amounted to RMB7.9 billion, representing a fall of 11% from the previous year. There were 1,033
enterprises above designated size in China’s stationery and office supplies industry (Source: China
Stationery & Sporting Goods Association).
In 2020, 212 member enterprises of China Writing Instrument Association recorded revenue from
principal business of RMB14.5 billion, representing a decrease of 11% from the previous year, and
realized profits of RMB0.7 billion, representing a decline of 20% from the previous year. In 2020, writing
instrument industry exports amounted to USD2.4 billion, down 16% from previous year. Affected by the
pandemic, the demand for writing instruments decreased across the world, and export was severely hit in

Annual Report 2020
15 / 244
2020, reaching the lowest point in the past ten years. The writing instrument industry imports amounted
to USD800 million, up 1% from the previous year. (Source: China Writing Instrument Association)
2. Features of the industry
(1) Periodicity
Writing instruments, student stationery and office supplies are less affected by economic fluctuations.
With low unit price, writing instruments and student stationery are more of necessity goods with relatively
low income elasticity, relatively less sensitive to economic fluctuations.
(2) Seasonality
There is seasonality in the demand for student stationery. Months before a new semester (summer
and winter vacation) is what the stationery industry calls “schooling peak season”, during which sales of
student stationery usually peaks.
3. Development trend of the industry
With the changes in the way of life and consumption habit of consumers, China’s retail industry
entered a new stage of redevelopment and innovation. Stationery industry faces challenges with
uncertainty of external environment, diversification of retail channels, and more individualized demands
from main customers group (now being the post-90s and post-00s). With the changing demographics of
China in particular the decreasing birth rate, stationery industry revenue growth comes less from by unit
volume growth, and more from consumption upgrade and product upgrade. Domestic market demand for
mid- to high-end stationery products keeps increasing, reshaping market structure dominated by low-end
products. This provides opportunities for mid- to high-end stationery products with better quality and
higher price. China’s population of 1.4 billion accounts for about 18% of global population, while leading
stationery companies in China can continue to mostly rely on the huge domestic market, they also have
room for international expansion in international markets, which could reinforce each other under
favorable conditions.
Traditional retail stationery shops nearby school are still the dominant channel for China’s stationery
industry, and shares of other retail formats are increasing faster. Sales terminals and channels of the
industry are becoming more diversified, upgrading and competition in channels becomes more obvious.
Domestic consumption for stationery in China becomes more brand conscious, innovative, individualized
and more premium. There is a growing demand for premium cultural and creative products, stationery
products are moving from those primarily focus on functionality towards those with more cultural and
creative elements catering to customers. There are around thousands of stationery manufacturers in
China’s domestic stationery industry and the industry is quite decentralized. There are a few leading
companies for most sub-category stationery products, with continued development in the stationery
industry, there could be higher industry consolidation, and leading companies could gain larger market
shares.
The market of the direct office supplies service has been growing fast in China. According to industry
research report, the scale of the market of broad office supplies (including office furniture, equipment and
other office supplies) in China reached more than RMB1 trillion. Regulation on the Implementation of the
Government Procurement Law of the People's Republic of China in 2015 explicitly requires that the state
shall promote the utilization of information networks for carrying out digital government procurement. In
2019, the Notice on Promoting Fair Competition and Optimizing the Business Environment in
Government Procurement clearly proposed to accelerate the promotion of electronic government
procurement. With strong national policy supports, B2B office supplies procurement in China got a unique
opportunity for rapid development. At present days, driven by favorable policies and leading large and
medium-sized enterprises, various digital procurement service providers are entering the market,
accelerating development of e-procurement with public purchasing. The continuous integration and
development of public procurement and high technology has also promoted the development of public
procurement towards more professional, intelligent market-oriented and international.
Annual Report 2020
16 / 244
During the pandemic, offline consumption was hindered, and consumption towards online
accelerated. According to the National Bureau of Statistics, online retail sales across the country recorded
RMB12 trillion in 2020, a year-on-year increase of 11%. Leading consumer products companies seized
opportunities of online consumption and achieved sustained growth through online and offline integration.
China's digital economy accounts for 36% of the total economy (source: China Academy of
Information and Communications Technology). Data has become a new factor of production. Industrial
digitization is becoming the main pillar of the digital economy. Traditional industries have gained growth
momentum in the digital age.
With smart technology and products upgrade, promotion of national education informatization and
the development of the online education market, smart stationery products have developed rapidly in the
past few years. Technology-empowered smart pens and smart books are widely adopted in online
education, providing an increasingly better user experience.
4. Company position in the industry
As a leader of “own brand + domestic demand” in China’s stationery industry, the Company has a
strong first-mover and leading advantage, with a wide and deep distribution network coverage in China’s
stationery market. At the end of the Reporting Period, the Company has a national distribution network
covering over 80,000 retail stationery shops using the store sign “M&G Stationery” across China, enabling
the Company to establish market leading position for its own brand products amidst competitions. The
Company ranked first in “Top Ten Enterprises in China’s Light Industry and Writing Instrument” for nine
consecutive years.
II. Explanation on substantial changes in major assets of the Company during the Reporting
Period
"√ Applicable" "□ Not applicable"
Please refer to 2 (3) Analysis on Assets and Liabilities set out in Discussion and Analysis of Operation
under Chapter IV for more details.
III. Analysis on core competitiveness during the Reporting Period
"√ Applicable" "□ Not applicable"
1. Brand advantage
As a leader of “own brand + domestic demand” in China’s stationery industry, the Company has
established a leading position for its own brand products amidst competitions of domestic market. The
Company ranked the first in “Top Ten Enterprises in China’s Light Industry and Writing Instrument” for
nine consecutive years. M&G brand has sound brand recognition among consumers, and served as the
designated stationery brand for Boao Forum for Asia for many years. During the Reporting Period, the
Company won the "Shanghai Brand" certification.
2. Channel advantage
The Company has a strong first-mover and leading advantage with a wide and deep coverage of
distribution network across China. The Company has established an efficient distribution management
system and a domestic terminal network with deep penetration. At the end of the Reporting Period, the
Company has 36 tier-one distributor partners, and about 1,200 tier-two and tier-three distributor partners
across China, covering over 80,000 retail stationery shops with “M&G Stationery” logo across China.
3. Design and R&D advantage
The Company has the capability to respond timely to market and strong R&D capacity for new
products. The Company conducts market research for new product development and identifies market
trends. The Company launches about one thousand new products each year to meet consumer needs,
covering writing instruments, writing pads, art materials, office supplies and other categories. Through
innovation, the Company has developed a variety of products such as quick-drying series, heat erasable
series, and professional painting materials. The Company was awarded high profile industrial design
Annual Report 2020
17 / 244
awards including German iF Award, Red Dot Design Award, G-mark, and IDEA, also product design
awards such as Gold Ideas Medal and Red Star Medal, reflecting the Company’s design capabilities. The
Company pioneered application of antibacterial, high-density, spray-free, and biodegradable materials,
broadened stationery materials, helped the environmental protection and green development of the
industry.
4. Technology advantage
The Company has raw material formula and production process with intellectual property rights. The
Company was recognized as a national high-tech enterprise since 2010. The Company hosts the “national
industry design center”, “China key laboratory of light industry and writing instrument engineering
technology”, “Shanghai research center of writing instrument engineering technology” and other national,
provincial and ministerial level technology centers. The testing laboratory of the Company obtained
CNAS certification qualification and testing results are recognized by over 100 countries. The Company
has undertaken a number of national, provincial and ministerial-level and independent research and
development projects. The Company won two First Prizes for State Science and Technology Progress
Award issued by China National Light Industry Council.
5. Manufacturing advantage
The Company benefits from experience of large-scale manufacturing accumulated from past years,
in-house mold capability, reliable supply chain, sound quality control system and adoption of information
management systems. The Company has the capability of large-scale manufacturing with high quality
control standard. Its product quality has won general recognition and favorable comments from consumers.
The Company promotes the application of intelligent manufacturing technology in the production and
inspection, and applies machine vision technology in various key links to improve the efficiency. The
Company sets itself as a model for transforming the stationery industry towards a leaner manufacturing
model.
6. Supply chain advantage
With the idea of partnership in its business operation, the Company has strived to build a high
standard supply chain ecosystem. The Company keeps upgrading the management for supply chain, and
has information collaboration, inventory optimization, financial support, quality and order management,
performance optimization to help supply chain partners to be stronger, improve consistency and operation
capability of our supply chain partners.

Annual Report 2020
18 / 244
Chapter IV Discussion and Analysis of Operation
I. Discussion and Analysis of Operation
In the first half of 2020, due to the impact of the COVID-19 pandemic, both domestic economic
growth momentum and foreign trade demand significantly slowed down. The office stationery industry
was severely affected by the macro economy and delayed school openings, especially primary and
secondary schools. On the one hand, the Company actively complied with pandemic prevention and
control measures; on the other hand, the Company steadily promoted resumption of factory and production,
raced against time to resume normal operations. In the second half of the year, thanks to the efforts of the
state and local government, pandemic was largely brought under control, national GDP resumed positive
growth. Company management paid close attention to market dynamics and actively took
countermeasures. Guided by company strategy, and driven by innovations, the Company continued to
execute its growth strategy and business plans. Adhering to normalized pandemic control measures, the
Company managed to maintain its growth momentum and further enhance its competitiveness through
such measures as focused channel cultivation, rapid growth of online business, comprehensive advance of
traditional core business and continuous expansion of new businesses. At the same time, the Company's
internal management was continuously improved and the restricted stock incentive plan for 2020 was
introduced, demonstrating confidence in long-term development and determination to grow stronger.
Operation of the Company in 2020 is summarized as follows:
1. Push the Four Segments of Traditional Core Business
(1) Mass market stationery segment
With "exploitation of potential, collaboration, product capability" as the key words, continued the
strong product strategy, develop less and better products. This segment continued to optimize product
structure and increase contribution of individual products. It established a mechanism to unleash the
potential of long life cycle products and has achieved initial results in the development of long life cycle
and best-selling products. Promotion for category was carried out collaboratively with offline distribution
channel to increase on shelf ratio, coordination was made with online channel to identify potential products
and form individual best-selling products for distribution. Online product management and ordering
procedures were formulated to meet customer ordering needs and increase online sales of consumer
products.
(2) Premium stationery segment
Improved the development and presentation for key categories based on terminal sale to develop
formations of premium stationery segment with strong function; focused on top star products and core
popular products to enhance the contribution of individual products, combined with mature serialized
products and trendy stationery (such as blind boxes, products featuring IP and season-theme, etc.) to open
up a situation where medium and high priced items coexist. With quality improved on the Company’s
single stores in key areas, the proportion of high-quality premium stationery products in traditional
channels was enhanced. At the same time, the Company shortened the channels, continued to promote
direct-to-customer business both at headquarters and at partner level, focused on quality domestic
stationery retail terminals (bookstores, grocery retail and stationery retail terminals).
(3) Arts and kids drawing segment
Optimized product structure, promoted long life cycle products and new products, increased
contribution from key products; made further efforts to build dedicated areas for products of this segment
in various channels, developed national art stores, explored big store business, and increased terminal on
shelf rate of art products; accelerated the expansion of online product lines and opportunity categories,
created online best-selling products. The online sales of best-selling marker pens, clays, and pigments
increased significantly, and professional art and puzzle categories were expanded. Through the promotion

Annual Report 2020
19 / 244
of key product categories, the expansion of dedicated areas, and seminars, arts products for children were
promoted. Online and offline channels were integrated to promote CARIOCA brand products. The
CARIOCA brand added new products to existing portfolios.
(4) Office stationery segment
Under the pandemic, product development cycle was shortened. Anti-pandemic office supplies were
launched. The office stationery segment was further developed and integrated solutions were proposed so
that core products could be put on shelves. The online sales of office supplies significantly increased.
Focus was placed on development and breakthrough of “key customer”, “key category” and “key
platform”. Developed large office stationery customers across the country. The segment made further
efforts to develop the professional channel model of direct office supplies.
2. Focus and Optimize Channels
Due to the COVID-19 pandemic, the traditional core business was greatly restricted in the first half
of the year. School opening was delayed, which impacted the operation of terminals near schools. The
Company's sales team and partners worked together to actively maintain retail terminals and helped them
to boost sales and confidence. With favorable policy support and as the pandemic was largely brought
under control, market picked up during the schooling peak season, many business indicators steadily
improved. During the Reporting Period, the Company adhered to its strategy, focused on key terminals,
cultivated model stores, pushed optimization and upgrading of domestic channels: (1) improved single
store quality, facilitated the upgrading of distribution centers; (2) strengthened categories promotion and
dedicated retail spaces for key products, promoted the optimization of the product mix of terminals across
the country, opened up channels, and established a normal promotion mechanism for staple products; (3)
built dedicated areas for key categories in the sales terminal, increased the on shelf ratio of staple products
on the counter, and improved the quality of single stores; and (4) focused on improving single stores
quality in key areas to improve shares in key business districts. At the end of the Reporting Period, the
Company has 36 tier-one distributor partners, and about 1,200 tier-two and tier-three distributor partners
across China, covering over 80,000 retail stationery shops with “M&G Stationery” logo across China. The
Company actively promoted M&G Alliance APP, to build a stronger connection among headquarters,
multi-tier distribution partners and retail stationery shops with the help of digital tools, improved
digitization of business and flow of information.
3. Increase Online Sales
During the Reporting Period, facing declined demand from offline terminals, M&G Technologies
accelerated the development of online distribution channels, developed best-selling products based on
demand and traffic flow. Growth rate of online business was significantly higher than the industry average:
(1) collaborated with the four segments of traditional core business to launch many products for online
sales; (2) enhanced online product development capabilities and made breakthroughs in new products
while continuing efforts for existing product portfolios; (3) carried out external and internal live streaming
events to improve category promotion efficiency and brand exposure; (4) emphasized market management
to strengthen collaboration of the online distribution system; and (5) actively promoted key stores to
increase market share and strengthened member operations. During the Reporting Period, M&G
Technologies recorded revenue of RMB473 million, representing an increase of 59% from the previous
year. During the Reporting Period, M&G Technologies increased expenditure on brand promotion and
online distribution channels.
Unit: 0’000
M&G Technologies 2020 2019 2018 3-year average
Revenue 47,368.78 29,668.20 23,434.15 33,490.38
Net profit -1,195.77 -120.59 963.31 -117.68
Annual Report 2020
20 / 244
4. Continue to Improve Brand Image
During the Reporting Period, the Company made progress in corporate brand infrastructure, brand
communication, and public relations. Launced a number of season-themed events such as cherry blossom
season, children season and exam season. Brand and product information reached core audience. The
Company's brand influence and reputation were enhanced. During such events, the Company gained tens
of millions of exposures on social media platforms such as Weibo, Bilibili, and Xiaohongshu; the
Company put product placement on websites, print media, WeChat, and Weibo, etc., gaining tens of
millions of exposures which increased brand value.
5. Promote Design and R&D
During the Reporting Period, the Company’s product segments continued innovations based on
consumer insights, optimized online and offline products offerings, and improved its product portfolio
based on market feedback. The successful development and production of new color series writing
instruments expanded products application. The research projects under the 13th Five-Year National Key
R&D Program - New Environmentally Friendly Materials for Writing Instrument, several sub-projects
were completed and entered final review stage. The Company promoted cooperation with external design
resources, and launched "M&G Global Design Center - Israel Studio", attracting more overseas
outstanding designers to contribute the Company’s products and brands.
6. Steadily Develop Own-operated Retail Stores
The Company actively improved product portfolio and service model of its own-operated retail stores,
developed Jiumu Store and tried some remodeling for M&G Life stores. During the Reporting Period, the
business of retail stores was greatly affected by the pandemic. In the first half of the year, retail stores
were mostly closed or operated abnormally. Since the second half of the year, stores have gradually
recovered operations, customer traffic has gradually picked up. M&G Life (including Jiumu Store)
recorded revenue of RMB654 million, representing an increase of 9%. Jiumu Store recorded revenue of
RMB558 million, representing an increase of 21%. At the end of the Reporting Period, the Company had
441 large own-operated retail stores in China, of which 80 are M&G Life, and 361 are Jiumu Stores (237
own stores and 124 franchise stores).
Jiumu Stores continued to optimize its product mix and explored new category opportunities. Jiumu
Stores maintained steady development of offline channels, promoted online businesses such as the opening
of Tmall’s official flagship store, live broadcast, and social media marketing, boosted customer repurchase
through several season themed and holiday marketing. M&G Life continued to optimize store operation
and management, improved efficiency and reduced store labor costs, with single store quality
improvement as its main target. During the Reporting Period, due to lower customer traffic and new stores
opening, loss of the own-operated retail store business increased.
Unit: 0’000
M&G Life (consolidated) 2020 2019 2018 3-year average
Revenue 65,484.36 60,063.70 30,592.14 52,046.73
Net profit -5,022.93 -804.67 -3,030.04 -2,952.55
Of which, Jiumu Store 2020 2019 2018 3-year average
Revenue 55,849.09 46,043.51 15,299.61 39,064.07
Net profit -4,207.86 -693.11 -2,602.78 -2,501.25
7. Continue to Grow M&G Colipu
M&G Colipu leveraged its channel advantages, optimized resources, boosted supplies for epidemic
prevention and control and helped other companies. Relying on its electronic transaction system,
intelligent warehousing and logistics system, high-quality product supply chain and personalized service,
M&G Colipu's business continued to develop. During the Reporting Period, M&G Colipu recorded
Annual Report 2020
21 / 244
revenue of RMB5,000 million, representing an increase of 37% from the previous year. Its influence in
the direct office supplies service market was further enhanced.
(1) Customer Development
For government customers, M&G Colipu was shortlisted for e-commerce projects of the People’s
Government of Shandong Province, Hu’nan Province, and Chongqing Municipal People’s Government;
for central state-owned enterprises, M&G Colipu was shortlisted for procurement projects of China
Resources Group, China Railway, Aluminum Corporation of China and Commercial Aircraft Corporation
of China (COMAC); for financial institutions, M&G Colipu was shortlisted for the branch project of CCB,
CEB and SPD Bank; for other enterprises, M&G Colipu won the bidding for procurement projects of
Shimao Group, SF Express and Lingang Group. M&G Colipu launched MRO online stores.
(2) Warehouse and Logistics
As of the end of the Reporting Period, M&G Colipu operates 6 central warehouses across the country,
covering North China, South China, East China, West China, Central China, and Northeast China. The
central warehouse in Northeast China was added to improve order responsiveness. At the same time, a
new central warehouse in East China was put into use, which adopted several intelligent processing
systems such as the dense storage system, indicating M&G Colipu becomes one of leading companies
with intelligent warehousing and logistics.
Unit: 0’000
M&G Colipu 2020 2019 2018 3-year average
Revenue 500,027.59 365,806.17 258,604.90 374,812.89
Net profit 14,382.86 7,580.35 3,213.52 8,392.24
8. Continue to Improve Internal Management
During the Reporting Period, the Company focused on “pandemic prevention and control, production
capacity restoration, cost reduction and efficiency enhancement, and quality improvement”, established a
pandemic prevention and control process, ensured product delivery. The Company actively promoted the
MBS (M&G Management System) to implement multiple company-level improvement projects,
including new product SKU control, channel efficiency improvement, APP order fulfillment rate
improvement, etc., promoted lean management, formed standard processes, and continuously improved
management capabilities.
The Company paid equal attention to broadening revenues and saving costs. Costs were cut down
and supply chain was improved through product value engineering and lean production. The Company
continued to advance the proactive prevention mechanism by using big data to analyze potential quality
risks and tracking the implementation of improvement measures, to prevent production of defective
products from the source and improve product quality.
For human resources, through development methods such as the leadership curriculum system and
internal trainer team, high-potential training projects, mentor guidance, job rotation learning, personal
development path design, etc., carried out talent training and ability enhancement.
9. Continue Digitalization
During the Reporting Period, the Company continued to empower business with data, promoted the
construction of data middle platform. The Company refactored the MDM (Commodity Master Data
Management) system, and developed and launched the QMS (Quality Management) system and the IPQC
(Production Quality Process Inspection) system to visualize quality inspection process; M&G Alliance
APP was upgraded continuously to improve user experience.
10. Implement Equity Incentive Plan
During the Reporting Period, the Company implemented the 2020 restricted stock incentive plan with
the first batch of stocks granted at the end of May 2020. The Company's implementation of the restricted
Annual Report 2020
22 / 244
stock incentive plan is conducive to further improving the Company's governance structure, improving its
incentive mechanism, enhancing management team and business backbones' sense of responsibility and
mission to achieve the Company's sustainable and healthy development, and is also conducive to the
Company's sustainable development. During the Reporting Period, the Company’s share-based payment
recognized as current year expenses was RMB8 million.
11. Axus Stationery
Export business accounts for more than 70% of the revenue of Axus Stationery. During the Reporting
Period, export was severely affected by the pandemic and the overseas market suffered greatly.
Particularly in South America, a key market of Axus Stationery, factories and schools were closed and
export revenue declined. In China, the school opening was delayed in the first half of 2020, sales of the
self-owned brand MARCO, which targets students and focuses on basic writing instruments, recorded a
year-on-year decline. Through adjustments in the second half of the year, domestic sales were largely
restored on par with the same period last year. Factories efficiency was at a multi-year low due to
fluctuaration in capacity utiliazation. During the Reporting Period, Axus Stationery incurred significant
losses, primarily due to high manufacturing cost resulting from under utilization of its factories.
12. Actively Explore Overseas Markets
The Company's products are exported to more than 50 countries and regions, with distribution and
procurement networks in Thailand, Vietnam, Malaysia and other countries. During the Reporting Period,
the Company actively explored overseas markets, and dispatched experienced project teams to Africa,
promoted M&G products and business models based on local conditions. With the mission of “providing
affordable and quality stationery to local students”, the Company started to form a channel model and
product development tailored to local conditions.
II. Financial Performance during the Reporting Period
In 2020, the Company recorded revenue of RMB13,137,745,700, representing an increase of 17.92%
from the previous year. The net profit attributable to shareholders of the listed company amounted to
RMB1,255,426,700, representing an increase of 18.43% from the previous year, while net profit
attributable to shareholders of the listed company after deducting non-recurring profit and loss amounted
to RMB1,102,712,300, representing an increase of 9.70% as compared to the corresponding period of last
year. As at the end of 2020, total asset of the Company amounted to RMB9,709,908,400, representing an
increase of 28.35% from the previous year. The net asset attributable to shareholders of the listed company
amounted to RMB5,193,568,700, representing an increase of 23.61% from the previous year. The
Company has maintained health growth and sound asset condition.

Annual Report 2020
23 / 244
1) Analysis of principal operation
1. Analysis of change in certain items in income statement and cash flow statement
Unit: Yuan Currency: RMB
Item Amount in the current period
Amount in the same period last
year
Change in the proportion
(%)
Revenue 13,137,745,727.18 11,141,101,364.44 17.92
Operation cost 9,806,609,999.48 8,229,837,268.86 19.16
Selling expenses 1,103,184,023.51 980,166,101.18 12.55
Administrative expenses 602,627,135.41 469,262,188.13 28.42
R&D expenses 160,178,941.89 160,403,362.97 -0.14
Financial expenses 9,060,176.35 -8,397,277.65 207.89
Net cash flow generated from operating activities 1,271,697,892.28 1,081,941,383.68 17.54
Net cash flow generated from investing activities -1,065,448,932.04 -74,352,686.18 -1,332.97
Net cash flow from financing activities -200,057,726.09 -364,300,101.66 -45.08
2. Analysis of revenue and cost
"√ Applicable" "□ Not applicable"
During the Reporting Period, the Company's traditional core business increased by 9% as compared to the corresponding period of last year, and new business
increased by 32% as compared to the corresponding period of last year.
(1). Result of principal business by industry, product and region
Unit: Yuan Currency: RMB
Result of principal business by industry
By industry Revenue Operation cost Gross margin (%) Change in revenue
from last year (%)
Change in cost
from last year (%)
Change in gross
profit margin from
last year (%)
Manufacturing and
sales of stationery
and office supplies
7,745,854,967.03 5,165,288,162.73 33.32 9.33 6.35 Increase by 1.87
percentage points
Retail industry 5,385,322,954.25 4,641,066,357.09 13.82 32.96 37.61 Decrease by 2.91
percentage points

Annual Report 2020
24 / 244
Service industry 2,368,196.45 / / -48.10 / /
Result of principal business by product
By product Revenue Operation cost Gross margin (%) Change in revenue
from last year (%)
Change in cost
from last year (%)
Change in gross
profit margin from
last year (%)
Writing instruments 2,280,319,347.53 1,349,337,371.37 40.83 4.29 -2.44 Increase by 4.08
percentage points
Student stationery 2,705,879,062.04 1,801,327,917.08 33.43 2.29 1.13 Increase by 0.77
percentage points
Office stationery 2,821,455,762.73 2,024,465,110.41 28.25 20.22 17.30 Increase by 1.79
percentage points
Other products 323,247,832.92 180,119,757.57 44.28 8.30 12.64 Decrease by 2.15
percentage points
Direct sales of
office supplies
5,000,275,916.06 4,451,104,363.39 10.98 36.69 40.01 Decrease by 2.11
percentage points
Management fee
for franchising
2,368,196.45 / / -48.10 / /
Result of principal business by region
By geography Revenue Operation cost Gross margin (%) Change in revenue
from last year (%)
Change in cost
from last year (%)
Change in gross
profit margin from
last year (%)
China 12,770,598,738.37 9,508,541,355.21 25.54 18.75 19.81 Decrease by 0.66
percentage points
Other countries 362,947,379.36 297,813,164.61 17.95 -5.91 1.57 Decrease by 6.04
percentage points
Explanation on result of principal business by industry, product and geography
1. Revenue from principal business of the Company includes revenue from manufacturing and selling stationery and office supplies, revenue from retail industry
and revenue from service industry.
2. Revenue from retail industry refers to revenue gained by M&G Colipu and M&G Life through selling non-M&G products. During the Reporting Period, sales of
the above categories grew continuously.
3. Revenue from service industry refers to management fee for franchising. The reasons for the decrease during the Reporting Period were: (1) The number of
franchise stores of Jiumu Stores decreased; (2) The franchise stores of traditional channels stopped charging franchise management fees since 2017, and the
management fees that have been collected are recognized in the benefit year.
4. Writing instruments refer to products of writing utensil sold by the Company (excluding M&G Colipu).

Annual Report 2020
25 / 244
5. Student stationery refers to products of student stationery sold by the Company (excluding M&G Colipu).
6. Office stationery refers to products of office supplies sold by the Company (excluding M&G Colipu).
7. Other products refer to products sold by the Company (excluding M&G Colipu) apart from writing instruments, student stationery and office supplies.
8. Direct sales of office supplies refer to products in all categories sold by M&G Colipu. During the Reporting Period, business of M&G Colipu developed rapidly.
Unit: 0’000
Result of revenue by business
Business Revenue in 2020 Revenue in 2019 Change in amount Change
Traditional core business 757,611.01 694,737.18 62,873.83 9.05%
Colipu Office Supplies business 500,027.59 365,806.17 134,221.42 36.69%
Retail large store business 65,484.36 60,063.70 5,420.66 9.02%
Transactions offset -9,348.39 -6,496.91 -2,851.48
Total 1,313,774.57 1,114,110.14 199,664.43 17.92%
(2). Analysis of production and sales volume
"√ Applicable" "□ Not applicable"
Major products Unit Production Sales Inventory
Change in
production from
last year (%)
Change in sales
from last year
(%)
Change in
inventory from
last year (%)
Writing instruments Piece 2,327,748,721 2,313,385,523 595,035,911 1.12 1.88 2.47
Student stationery Piece 5,356,021,889 5,336,153,012 664,318,843 -2.52 0.58 3.08
Office stationery Piece 1,621,574,646 1,605,115,091 155,040,179 13.93 13.54 11.88
Other products Piece 10,234,954 9,552,791 6,092,965 -18.62 4.08 12.61
Direct sales of office
supplies
Piece 375,325,301 374,156,127 22,283,146 29.21 29.68 5.54
Explanation on production and sales volume
No
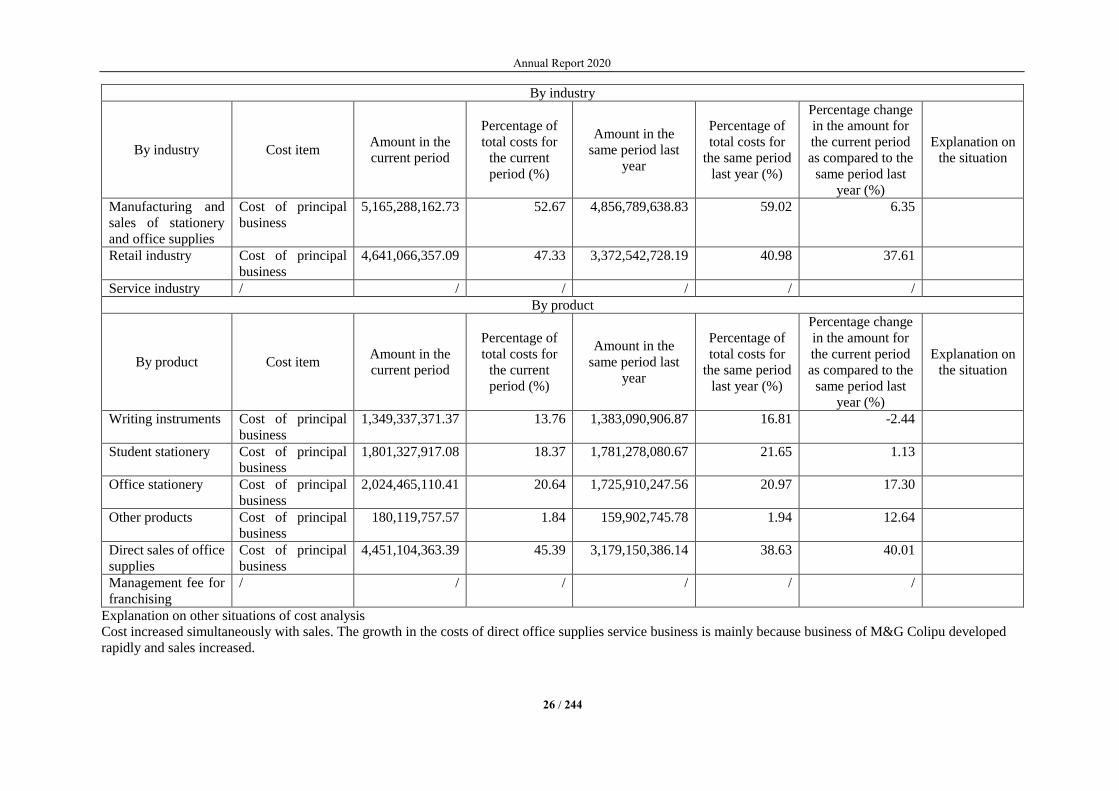
(3). Analysis of cost
Unit: RMB Yuan
Annual Report 2020
26 / 244
By industry
By industry Cost item Amount in the
current period
Percentage of
total costs for
the current
period (%)
Amount in the
same period last
year
Percentage of
total costs for
the same period
last year (%)
Percentage change
in the amount for
the current period
as compared to the
same period last
year (%)
Explanation on
the situation
Manufacturing and
sales of stationery
and office supplies
Cost of principal
business
5,165,288,162.73 52.67 4,856,789,638.83 59.02 6.35
Retail industry Cost of principal
business
4,641,066,357.09 47.33 3,372,542,728.19 40.98 37.61
Service industry / / / / / /
By product
By product Cost item Amount in the
current period
Percentage of
total costs for
the current
period (%)
Amount in the
same period last
year
Percentage of
total costs for
the same period
last year (%)
Percentage change
in the amount for
the current period
as compared to the
same period last
year (%)
Explanation on
the situation
Writing instruments Cost of principal
business
1,349,337,371.37 13.76 1,383,090,906.87 16.81 -2.44
Student stationery Cost of principal
business
1,801,327,917.08 18.37 1,781,278,080.67 21.65 1.13
Office stationery Cost of principal
business
2,024,465,110.41 20.64 1,725,910,247.56 20.97 17.30
Other products Cost of principal
business
180,119,757.57 1.84 159,902,745.78 1.94 12.64
Direct sales of office
supplies
Cost of principal
business
4,451,104,363.39 45.39 3,179,150,386.14 38.63 40.01
Management fee for
franchising
/ / / / / /
Explanation on other situations of cost analysis
Cost increased simultaneously with sales. The growth in the costs of direct office supplies service business is mainly because business of M&G Colipu developed
rapidly and sales increased.
Annual Report 2020
27 / 244
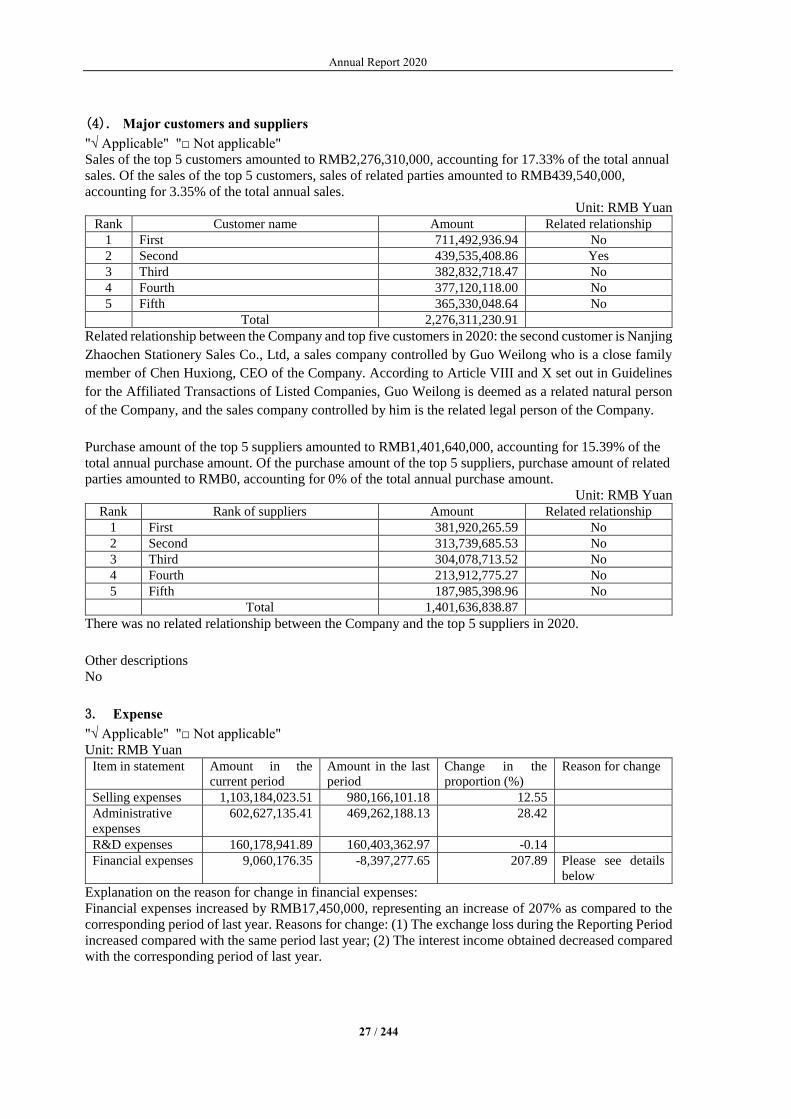
(4). Major customers and suppliers
"√ Applicable" "□ Not applicable"
Sales of the top 5 customers amounted to RMB2,276,310,000, accounting for 17.33% of the total annual
sales. Of the sales of the top 5 customers, sales of related parties amounted to RMB439,540,000,
accounting for 3.35% of the total annual sales.
Unit: RMB Yuan
Rank Customer name Amount Related relationship
1 First 711,492,936.94 No
2 Second 439,535,408.86 Yes
3 Third 382,832,718.47 No
4 Fourth 377,120,118.00 No
5 Fifth 365,330,048.64 No
Total 2,276,311,230.91
Related relationship between the Company and top five customers in 2020: the second customer is Nanjing
Zhaochen Stationery Sales Co., Ltd, a sales company controlled by Guo Weilong who is a close family
member of Chen Huxiong, CEO of the Company. According to Article VIII and X set out in Guidelines
for the Affiliated Transactions of Listed Companies, Guo Weilong is deemed as a related natural person
of the Company, and the sales company controlled by him is the related legal person of the Company.
Purchase amount of the top 5 suppliers amounted to RMB1,401,640,000, accounting for 15.39% of the
total annual purchase amount. Of the purchase amount of the top 5 suppliers, purchase amount of related
parties amounted to RMB0, accounting for 0% of the total annual purchase amount.
Unit: RMB Yuan
Rank Rank of suppliers Amount Related relationship
1 First 381,920,265.59 No
2 Second 313,739,685.53 No
3 Third 304,078,713.52 No
4 Fourth 213,912,775.27 No
5 Fifth 187,985,398.96 No
Total 1,401,636,838.87
There was no related relationship between the Company and the top 5 suppliers in 2020.
Other descriptions
No
3. Expense
"√ Applicable" "□ Not applicable"
Unit: RMB Yuan
Item in statement Amount in the
current period
Amount in the last
period
Change in the
proportion (%)
Reason for change
Selling expenses 1,103,184,023.51 980,166,101.18 12.55
Administrative
expenses
602,627,135.41 469,262,188.13 28.42
R&D expenses 160,178,941.89 160,403,362.97 -0.14
Financial expenses 9,060,176.35 -8,397,277.65 207.89 Please see details
below
Explanation on the reason for change in financial expenses:
Financial expenses increased by RMB17,450,000, representing an increase of 207% as compared to the
corresponding period of last year. Reasons for change: (1) The exchange loss during the Reporting Period
increased compared with the same period last year; (2) The interest income obtained decreased compared
with the corresponding period of last year.
Annual Report 2020
28 / 244
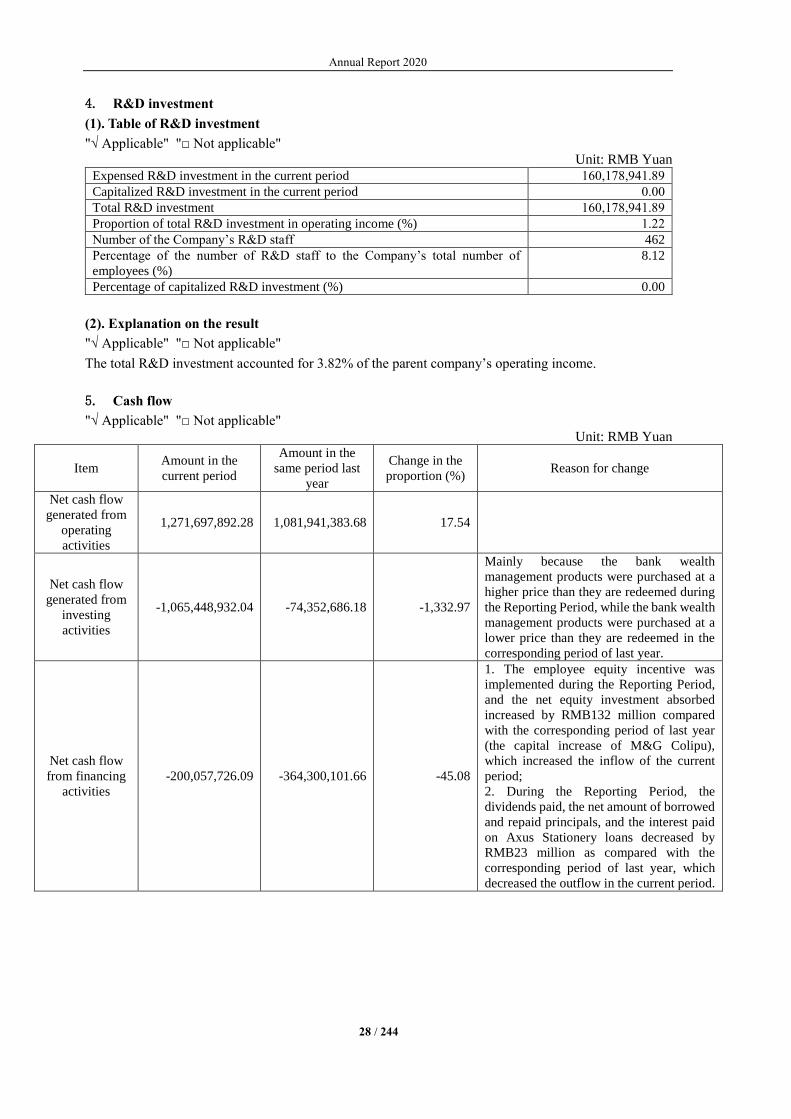
4. R&D investment
(1). Table of R&D investment
"√ Applicable" "□ Not applicable"
Unit: RMB Yuan
Expensed R&D investment in the current period 160,178,941.89
Capitalized R&D investment in the current period 0.00
Total R&D investment 160,178,941.89
Proportion of total R&D investment in operating income (%) 1.22
Number of the Company’s R&D staff 462
Percentage of the number of R&D staff to the Company’s total number of
employees (%)
8.12
Percentage of capitalized R&D investment (%) 0.00
(2). Explanation on the result
"√ Applicable" "□ Not applicable"
The total R&D investment accounted for 3.82% of the parent company’s operating income.
5. Cash flow
"√ Applicable" "□ Not applicable"
Unit: RMB Yuan
Item Amount in the
current period
Amount in the
same period last
year
Change in the
proportion (%) Reason for change
Net cash flow
generated from
operating
activities
1,271,697,892.28 1,081,941,383.68 17.54
Net cash flow
generated from
investing
activities
-1,065,448,932.04 -74,352,686.18 -1,332.97
Mainly because the bank wealth
management products were purchased at a
higher price than they are redeemed during
the Reporting Period, while the bank wealth
management products were purchased at a
lower price than they are redeemed in the
corresponding period of last year.
Net cash flow
from financing
activities
-200,057,726.09 -364,300,101.66 -45.08
1. The employee equity incentive was
implemented during the Reporting Period,
and the net equity investment absorbed
increased by RMB132 million compared
with the corresponding period of last year
(the capital increase of M&G Colipu),
which increased the inflow of the current
period;
2. During the Reporting Period, the
dividends paid, the net amount of borrowed
and repaid principals, and the interest paid
on Axus Stationery loans decreased by
RMB23 million as compared with the
corresponding period of last year, which
decreased the outflow in the current period.

Annual Report 2020
29 / 244
2) Explanation on significant change of profit caused by non-core business
"□ Applicable" "√ Not applicable"
3) Analysis of assets and liabilities
"√ Applicable" "□ Not applicable"
1. Assets and liabilities
Unit: RMB Yuan
Items
Amount as at the
end of the current
period
Percentage of total
assets at the end of
current period (%)
Amount as at the
end of last period
Percentage of total
assets at the end of
last period (%)
Change in percentage
for the current period
over the last period (%)
Explanation
Cash and
equivalents
2,562,158,926.11 26.39 1,935,600,694.35 25.59 32.37 Increase in cash and equivalents brought by the growth of
income and net profit.
Held-for-
trading
financial
assets
1,428,277,848.33 14.71 661,878,587.24 8.75 115.79 Mainly because the unredeemed bank wealth management
products increased as compared with the corresponding
period of last year.
Accounts
receivable
1,561,211,468.90 16.08 1,026,094,724.15 13.56 52.15 The growth in sales in the second half of the year caused the
accounts receivable to increase, of which M&G Colipu had
a longer account period and the accounts receivable
increased significantly.
Receivables
financing
61,412,976.46 0.63 29,549,924.83 0.39 107.83 Mainly because M&G Colipu received more bank
acceptance bills as compared with the corresponding period
of last year.
Prepayment 131,596,384.76 1.36 85,371,444.73 1.13 54.15 Mainly because the Company developed and was required to
make more advance payments for goods.
Non-current
assets due
within one
year
4,637,213.00 0.05 0.00 Compensation payable to the Company by the original
shareholders of Axus Stationery according to the agreement
will expire within one year.
Long-term
receivables
0.00 6,624,590.00 0.09 -100.00 Compensation payable to the Company by the original
shareholders of Axus Stationery according to the agreement
was partially recovered during the Reporting Period, and the
remaining receivables will be due within one year.
Investments in 5,476,577.42 0.06 3,909,179.93 0.05 40.10 Increase in return on the investment for Shanghai M&G

Annual Report 2020
30 / 244
other equity
instruments Culture and Creativity (上海晨光文化创意) held by the
Company for non-transaction purpose
Fixed assets 1,847,635,724.45 19.03 1,163,702,352.12 15.38 58.77 Mainly because Songjiang office house and Qingcun
Production Base Construction Project were converted into
fixed assets.
Construction
in progress
54,946,300.66 0.57 260,469,728.76 3.44 -78.90 Mainly because Qingcun Production Base Construction
Project was converted into fixed assets.
Goodwill 0.00 30,175,537.19 0.40 -100.00 After the goodwill impairment test, the Company made
provision for impairment of all the goodwill formed by the
acquisition of Axus Stationery.
Deferred
income tax
assets
99,939,414.58 1.03 36,623,535.59 0.48 172.88 Deferred income tax assets were mostly generated from the
share-based payment expenses related to equity incentives,
the asset depreciation and amortization difference between
M&G Colipu's parent company and subsidiary companies,
deferred income, and deductible losses.
Other non-
current assets
6,258,468.47 0.06 315,153,408.27 4.17 -98.01 Mainly because Songjiang office house was converted into
fixed assets.
Accounts
payable
2,602,020,507.99 26.80 1,861,072,467.87 24.60 39.81 The Company's sales growth in the fourth quarter also
brought an increase in purchases, of which M&G Colipu
increased significantly.
Accounts
received in
advance
0.00 206,762,293.94 2.73 -100.00 According to the requirements of the new revenue standards,
the advance receipts that meet the requirements of the
standards were transferred to contract liabilities.
Taxes payable 477,240,219.10 4.91 258,583,118.14 3.42 84.56 1. The growth of revenue and total profit in the fourth quarter
caused the turnover tax payable and corporate income tax
payable to increase; 2. Timing difference of tax payment for
some companies.
Other payables 625,468,675.97 6.44 331,438,976.35 4.38 88.71 Mainly because the obligation to repurchase restricted
stocks, unpaid provisional estimate of the construction
project of the Qingcun Production Base Construction
Project, and the margins collected by M&G Colipu from
suppliers increased.
Contract
liabilities
114,100,035.35 1.18 0.00 According to the requirements of the new revenue standards,
the advance receipts that meet the requirements of the
standards were transferred to contract liabilities.
Other current
liabilities
13,746,089.97 0.14 0.00 Taxes and charges relating to contract liabilities.

Annual Report 2020
31 / 244
Estimated
liabilities
12,211,357.80 0.13 0.00 Possible liabilities incurred by returned goods according to
the requirements of the new revenue standards.
Other descriptions
No
2. Major restricted assets as at the end of the Reporting Period
"√ Applicable" "□ Not applicable"
On 24 September 2020, Axus Stationery and Industrial Bank Co., Ltd. Shanghai Zhangyang Branch entered into the Line Credit Contract numbered Zhang
Yang SXAS2020 with the credit line of RMB250,000,000.00 for 12 months from 24 September 2020 to 23 September 2021. The specific types of line business
include, but are not limited to, working capital loans, bank notes, and letters of credit.
On 24 September 2020, Axus Stationery and Industrial Bank Co., Ltd. Shanghai Zhangyang Branch entered into the Maximum Mortgage Contract numbered
Zhang Yang DYAS2020. This contract is a sub-contract of the Line Credit Contract. The maximum principal limit of the mortgage under this contract is
RMB200,000,000.00, and the mortgage limit is valid from 24 September 2020 to 23 September 2021.
The mortgage term runs from the effective date of the mortgage contract to the termination of litigation for facility credit. The collaterals for mortgage include:
Name of collateral Ownership No. Original value Accumulated depreciation Net value
No. 111 Xuezi South Road, Xianghuaqiao Street, Qingpu District HFDQ Zi (2013) No. 015437 47,061,453.52 24,976,111.47 22,085,342.05
No. 233 Xuezi South Road, Xianghuaqiao Street, Qingpu District HFDQ Zi (2013) No. 013396 32,156,238.78 12,856,455.39 19,299,783.39
No. 333 Xuezi South Road, Xianghuaqiao Street, Qingpu District HFDQ Zi (2015) No. 015718 60,230,210.97 15,309,106.79 44,921,104.18
Total 139,447,903.27 53,141,673.65 86,306,229.62
Under the framework of the above-mentioned Line Credit Contract and Maximum Mortgage Contract, on 24 September 2020, Axus Stationery and Industrial
Bank Co., Ltd. Shanghai Zhangyang Branch signed the Working Capital Loans Contract numbered Zhang Yang LDAS2020, with the contractual loan amount of
RMB180,000,000.00, the loan period of 12 months from 25 September 2020 to 24 September 2021, and the loan interest rate of one-year term LPR.
As of 31 December 2020, the outstanding loan of Axus Stationery was RMB180,000,000.00.
3. Other descriptions
"□ Applicable" "√ Not applicable"
4) Analysis on industry operating information
"√ Applicable" "□ Not applicable"
Please refer to “I. Description of the Company’s principal business, operation model and industry condition during the Reporting Period” set out in “Business
Overview” of Chapter III.

Annual Report 2020
32 / 244
5) Analysis of investment
1、 Overall analysis of external equity investment
"√ Applicable" "□ Not applicable"
During the Reporting Period, the Company made foreign investments.
(1) Significant equity investment
"√ Applicable" "□ Not applicable"
1. The Company has established a wholly-owned subsidiary, Shanghai Chenxun Enterprise
Management Co., Ltd., with a registered capital of RMB70 million; the Company has completed the
relevant industrial and commercial registration procedures, and has not yet paid the capital;
2. the Company has established a subsidiary Shanghai Qizhihaowan Cultural and Creative Co., Ltd.,
with an investment of RMB57 million; the Company has promised but has not contributed RMB57.0
million, with the shareholding ratio of 57%.
(2) Significant non-equity investment
"□ Applicable" "√ Not applicable"
(3) Financial assets measured at fair value
"□ Applicable" "√ Not applicable"
6) Sale of significant assets and equity interests
"□ Applicable" "√ Not applicable"
7) Analysis of major controlled companies and shareholding companies
"√ Applicable" "□ Not applicable"
Unit: 0’000 Currency: RMB
Company Name Nature of the
business
Major products
and services
Registered
capital
Total asset Net assets Net profit
Shanghai M&G Zhenmei
Stationery Co., Ltd.(上海晨
光珍美文具有限公司)
Wholesale and retail Stationery and
office supplies 1,000.00 3,426.47 -603.38 322.06
Shanghai M&G Colipu Office
Supplies Co., Ltd. Wholesale and retail Office supplies 66,000.00 243,746.53 56,879.45 14,382.86
Shanghai M&G Stationery &
Gift Co., Ltd.(上海晨光文具
礼品有限公司)
Wholesale and retail Stationery and
office supplies 19,941.94 121,266.40 46,755.47 8,037.45
M&G Life Enterprise
Management Co., Ltd.(晨光
生活馆企业管理有限公司)
Wholesale and retail Stationery and
office supplies 10,000.00 43,751.23 -7,469.18 -5,022.93
Shanghai M&G Jiamei Manufacturing, Stationery and 3,000.00 4,800.12 3,842.31 104.69
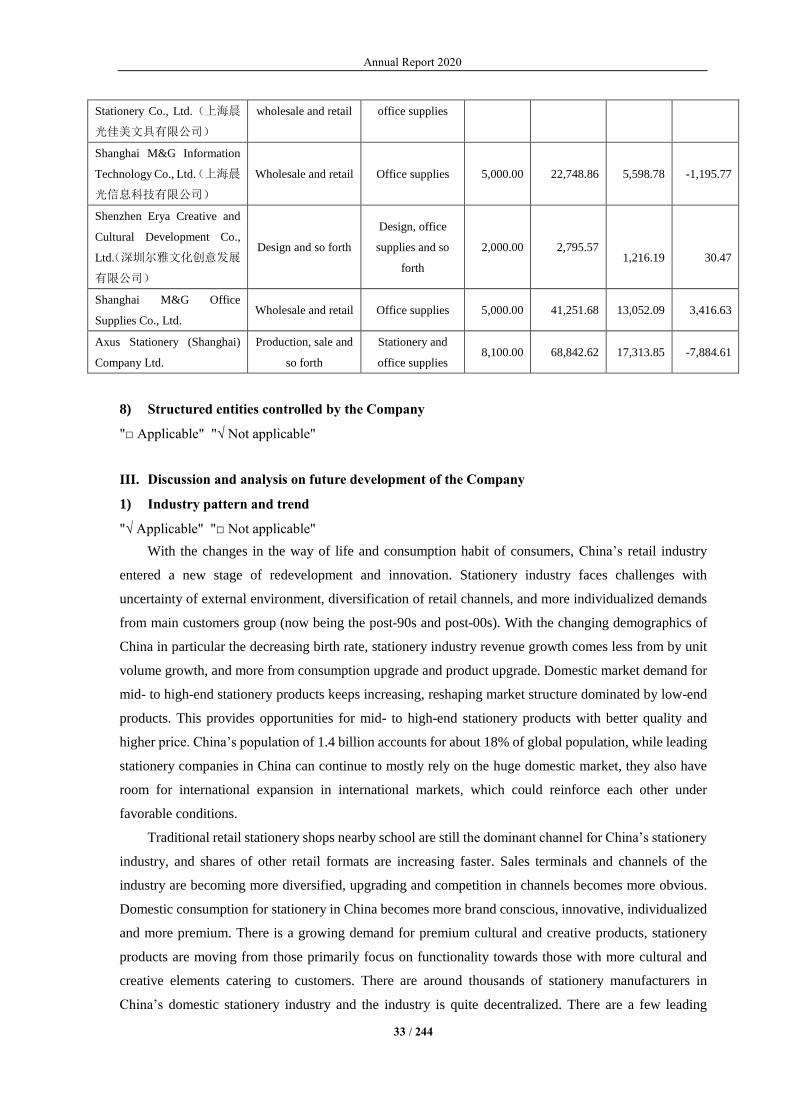
Annual Report 2020
33 / 244
Stationery Co., Ltd.(上海晨
光佳美文具有限公司)
wholesale and retail office supplies
Shanghai M&G Information
Technology Co., Ltd.(上海晨
光信息科技有限公司)
Wholesale and retail Office supplies 5,000.00 22,748.86 5,598.78 -1,195.77
Shenzhen Erya Creative and
Cultural Development Co.,
Ltd.(深圳尔雅文化创意发展
有限公司)
Design and so forth
Design, office
supplies and so
forth
2,000.00 2,795.57
1,216.19
30.47
Shanghai M&G Office
Supplies Co., Ltd. Wholesale and retail Office supplies 5,000.00 41,251.68 13,052.09 3,416.63
Axus Stationery (Shanghai)
Company Ltd.
Production, sale and
so forth
Stationery and
office supplies 8,100.00 68,842.62 17,313.85 -7,884.61
8) Structured entities controlled by the Company
"□ Applicable" "√ Not applicable"
III. Discussion and analysis on future development of the Company
1) Industry pattern and trend
"√ Applicable" "□ Not applicable"
With the changes in the way of life and consumption habit of consumers, China’s retail industry
entered a new stage of redevelopment and innovation. Stationery industry faces challenges with
uncertainty of external environment, diversification of retail channels, and more individualized demands
from main customers group (now being the post-90s and post-00s). With the changing demographics of
China in particular the decreasing birth rate, stationery industry revenue growth comes less from by unit
volume growth, and more from consumption upgrade and product upgrade. Domestic market demand for
mid- to high-end stationery products keeps increasing, reshaping market structure dominated by low-end
products. This provides opportunities for mid- to high-end stationery products with better quality and
higher price. China’s population of 1.4 billion accounts for about 18% of global population, while leading
stationery companies in China can continue to mostly rely on the huge domestic market, they also have
room for international expansion in international markets, which could reinforce each other under
favorable conditions.
Traditional retail stationery shops nearby school are still the dominant channel for China’s stationery
industry, and shares of other retail formats are increasing faster. Sales terminals and channels of the
industry are becoming more diversified, upgrading and competition in channels becomes more obvious.
Domestic consumption for stationery in China becomes more brand conscious, innovative, individualized
and more premium. There is a growing demand for premium cultural and creative products, stationery
products are moving from those primarily focus on functionality towards those with more cultural and
creative elements catering to customers. There are around thousands of stationery manufacturers in
China’s domestic stationery industry and the industry is quite decentralized. There are a few leading
Annual Report 2020
34 / 244
companies for most sub-category stationery products, with continued development in the stationery
industry, there could be higher industry consolidation, and leading companies could gain larger market
shares.
The market of the direct office supplies service has been growing fast in China. According to industry
research report, the scale of the market of broad office supplies (including office furniture, equipment and
other office supplies) in China reached more than RMB1 trillion. Regulation on the Implementation of the
Government Procurement Law of the People's Republic of China in 2015 explicitly requires that the state
shall promote the utilization of information networks for carrying out digital government procurement. In
2019, the Notice on Promoting Fair Competition and Optimizing the Business Environment in
Government Procurement clearly proposed to accelerate the promotion of electronic government
procurement. With strong national policy supports, B2B office supplies procurement in China got a unique
opportunity for rapid development. At present days, driven by favorable policies and leading large and
medium-sized enterprises, various digital procurement service providers are entering the market,
accelerating development of e-procurement with public purchasing. The continuous integration and
development of public procurement and high technology have also promoted the development of public
procurement towards more professional, intelligent market-oriented and international.
During the pandemic, offline consumption was hindered, and consumption towards online
accelerated. According to the National Bureau of Statistics, online retail sales across the country recorded
RMB12 trillion in 2020, a year-on-year increase of 11%. Leading consumer products companies seized
opportunities of online consumption and achieved sustained growth through online and offline integration.
China's digital economy accounts for 36% of the total economy (source: China Academy of
Information and Communications Technology). Data has become a new factor of production. Industrial
digitization is becoming the main pillar of the digital economy. Traditional industries have gained growth
momentum in the digital age.
With smart technology and products upgrade, promotion of national education informatization and
the development of the online education market, smart stationery products have developed rapidly in the
past few years. Technology-empowered smart pens and smart books are widely adopted in online
education, providing an increasingly better user experience.
2) Development strategy of the Company
"√ Applicable" "□ Not applicable"
To consolidate competitive advantages of traditional core businesses by adhering to the mission of
"make study and work more joyful and effective", being consumer centric, and emphasizing on innovation
of technology and products; to further develop new business including direct office supplies service and
own-operated retail stores; to actively expand international market; and to promote digitalization,
organization development and talents, mergers and acquisitions with synergy. With continued efforts in
those four areas, to realize the vision of becoming a "world-class M&G".

Annual Report 2020
35 / 244
The Company’s mission is to "make study and work more joyful and effective", and the
Company’s vision is to become a "world-class M&G".
3) Operation plan
"√ Applicable" "□ Not applicable"
In 2021, the Company plans to reach revenue of RMB16,200,000,000, an increase of 23%, mainly
through the following:
1. Traditional core business
To make good use of the advantages in channel, brand, design and R&D and supply chain, to maintain
fast and stable growth in traditional core business, improve the quality of development, continue product
mix upgrade, and improve quality of online business.
(1) Promote four segments comprehensively
① Mass market stationery segment
The Company will focus on development of long life cycle products and best-selling products,
increase share of long life cycle products, increase new products with longer life cycle with new functions,
new technologies and at higher prices. Continue to improve design capabilities and quality. Using MBS
method to continuously optimize new product development process and reduce lead time of product
development. The Company will take advantage of online channels to enhance the sales of mass market
products.
② Premium stationery segment
The Company will continue to optimize the existing product offering of premium stationery segment,
improve product mix, increase contribution of single products, create a series of best-selling products, and
increase the proportion of premium stationery segment in traditional channels; and develop tailored
premium stationery products for Jiumu Stores, direct channels, E-commerce and APPs to better meet
demand of higher income consumers. The Company will also focus more on best-selling products by better
coordinating marketing, design, supply chain and channel actions, improve the launch pace and
distribution of IP products.
③ Office stationery segment
The Company will strengthen the development and promotion of office products, focus on the
development of high-end innovative products in terms of solving pain points of end users, optimize quality
control process; promote channel transformation with direct supply from the headquarters focusing on the
development of key customers; expand M&G stores for office supplies and develop model stores for office
supplies on a continuous basis; focus on development of online office supplies in all categories and
multiple channels to drive the overall growth of the office supplies.
④ Arts and kids drawing segment
The Company will focus on product design and quality upgrade and development of high-value best-
selling products; create best-selling products and drive channels through categories; develop e-commerce
product lines with integrated thinking, carry out cultivation of categories to form M&G's integrated
online product matrix + channel promotion matrix + supply support plan of arts products for children, and
build loyalty of children's arts category at new channels; exert more efforts in the exploration of new
categories; expand category width and improve the store product structure.
(2) Focus on and further develop traditional channels, and promote channel transformation

Annual Report 2020
36 / 244
The Company will focus on key terminals, and build model stores to improve single store quality,
facilitate the optimization and upgrading of franchise stores and delivery centers, and upgrade channel.
Besides, the Company will also strengthen promotion for categories and dedicated zones for products to
increase on shelf ratio of the must-have products, increase presence in major business districts and expand
market share, promote direct supply both at headquarters and partners level to create incremental sales.
The Company will better utilize data to upgrade traditional distribution network, including using M&G
Alliance APP to shorten the feedback between retail terminal and the Company, to form a closed-loop
order and increase the number of APP monthly active users.
(3) Improve online business quality
M&G Technologies will join in hands with product segments to launch online products and build a
standard process for online product development, explore opportunities in key categories, improve product
efficiency, improve online product offering; use platform data to guide the development of premium
products; coordinate brand and the segments to build the content output capacity of product promotion.
To build promotion matrix of celebrity, live broadcast and video, to promote new channel business
including Douyin live broadcast and Xiaohongshu; enhance online operations capabilities by combining
Tmall digital category captain project and promote a more refined membership operations.
(4) Continue digitalization
In line with corporate strategy, the Company plans to build foundation for M&G's data governance,
initiate quick-win projects for members and channels, and improve products and core business processes
of the supply chain. The Company will establish a unified data standard to improve M&G's data analysis;
upgrade the existing dealer information system to improve the ability to "select the right stores and deliver
the right goods"; use member operations as a key handle to grow online business.
(5) Axus Stationery to reduce loss
Stabilize overseas markets and continue to develop MARCO’s own brand and online business, build
brand image of MARCO’s professional art pencils, increase sources of revenue and cut costs, increase
efficiency, improve quality improvement and new product launch, aiming for an turnaround.
2. New business development
(1) Continue to develop retail large store business
For Jiumu Stores, continue to exert efforts in member operations, closed-loop online business,
continuous optimization of products, and optimization of store operating standards to achieve high-quality
growth of offline channels and higher growth of online business. As M&G’s bridgehead in upgrading its
products and channels, Jiumu stores will work closely with the Company to increase the sales ratio of
premium products. M&G Life will improve operation capacity of the stores and sales of per employee,
and optimize human resource cost for stores.
(2) Continue to grow M&G Colipu
Business in direct sales of office supplies continues to achieve booming development since M&G
Colipu follows requirement on well-informed, open and transparent government procurement, and meets
requirements that enterprises desire to increase procurement efficiency and reduce procurement cost for
non-production office and administration supplies. Renowned companies in the industry continue to
enhance competitiveness through improving service quality, enriching product categories, seeking more
customers and developing nationwide supply chain system. M&G Colipu is expected to maintain
relatively rapid growth, and become one of the main competitors in its market. M&G Colipu will continue
to win new large national customers, while maintaining good services for contracted projects, to increase
Annual Report 2020
37 / 244
prefecture-level city coverage, strengthen sales and service capabilities, and improve supply chain systems,
to enhance service efficiency, better meet market needs, and improve organizational capabilities.
4) Potential risks
"√ Applicable" "□ Not applicable"
1. Risks in operation management
With the great growth in the scale of assets and sale of the Company, the Company faces new
challenges in operation management system, internal control system and staff management. Although the
Company has developed operation management system and internal control system that accord with
features of its business and technology in its development, and has recruited and cultivated stable core
management team, operation of the Company will be adversely affected if the aforesaid management
system and management staff fail to promptly adapt to the rapid expansion of the Company. Therefore,
the Company will keep improving its management system and internal control system, and adopt various
measures to improve qualification of management staff.
2. Market risks
With social transformation and consumption upgrading, stationery market presents opportunities for
structure-based development. If the Company is unable to anticipate market trends in time and adapt to
market changes from aspects of product upgrading, quality management to sale strategy, the Company
will encounter certain risks in market competition. Having been aware of the problem, the Company
enhanced product R&D under the guidance of the market, optimized product structure, and developed a
sounder quality management and control system. Market strategies are formulated based on market survey,
analysis of big data and management discussion.
3. Risks from fiscal and taxation
According to Article 28 of Enterprise Income Tax Law of the People's Republic of China, the
enterprise income tax on important high- and new-tech enterprises that are necessary to be supported by
the state shall be levied at the reduced tax rate of 15%. The Company was re-recognized as a national
high- and new-tech enterprise on 28 October 2019, and started to implement the policy of reduced
enterprise income tax rate of 15% on 1 January 2019 for 3 years. If the state adjusts preferential income
tax policy for high- and new-tech enterprises, or the Company fails to pass the review after its qualification
of high- and new-tech enterprise expires, operation performance of the Company will be adversely
affected. As such, the Company performs strict control according to assessment standards for high- and
new-tech enterprises to ensure that it meets all indicators, and qualifies and passes the annual review and
renewal for high- and new-tech enterprises.
4. Risks from COVID-19
Since the outbreak of COVID-19 at the beginning of 2020, domestic economy growth and demand
of foreign trade have slowed down significantly. Although demand of stationery industry is relatively rigid,
it has been affected by macro-economy and delay in new semester, especially for primary and middle
schools. The impact of COVID-19 on the macro-economy is uncertain, adding uncertainties to the
Annual Report 2020
38 / 244
Company’s operation in 2021. The Company pays close attention to the development of COVID-19, and
adopts active measures to reduce risks and uncertainties brought by COVID-19.
5) Others
"□ Applicable" "√ Not applicable"
IV. Explanation on the failure to disclose as per rules due to inapplicability or special reasons such
as state secrets and business secrets and the reasons thereof
"□ Applicable" "√ Not applicable"

Annual Report 2020
39 / 244
Chapter V Major Events
I. Proposal for profit distribution of ordinary shares or capitalization of capital reserve
1) Formulation, implementation or adjustment of the cash dividend policy
"√ Applicable" "□ Not applicable"
1. The existing profit distribution policy of the Company is implemented after it was passed at the
20th meeting of the fourth Board meeting and 2019 annual general meeting.
2. Principle in profit distribution of the Company: the Company implements the dividend distribution
policy which entitles the shareholders to the same rights and same dividends, under which shareholders
are entitled to receive dividends and other kinds of distribution of interests based on the number of shares
held by them. The Company adopts active profit distribution policy, which emphasizes investors’
reasonable investment returns while maintaining sustainability and stability. The Company is allowed to
distribute profit in cash or shares, but its profit distribution shall not exceed the range of the accumulated
distributable profits or affect the Company’s ability to continue as a going concern.
3. Overall approaches to distribute profit of the Company: the Company distributes dividends in cash
or shares, or cash-and-shares, and if the Company satisfies the conditions for cash dividends, priority
should be given to profit distribution by means of cash dividends.
4. Specific conditions and proportion for cash dividends: the Company primarily adopts cash
dividend as its profit distribution policy. The Company may distribute cash dividend when it makes a
profit in the current year and the distributable profits are positive after making up losses, contributing to
the statutory reserves and surplus reserves, but the profit distribution shall not exceed the range of the
accumulated distributable profits. In general, if there are no material investment plans or significant cash
expenditure, the Company may distribute profit in cash for a single year not less than 20% of the
distributable profit realized in the current year.
In addition, as for the proportion of cash dividends to the total profit distribution, the Board of
Directors shall take into full account of various factors such as features of the industries where the
Company operates, the stage of development, its own business model, level of profitability, and whether
there is significant capital expenditure arrangement, to distinguish the following situations and determine
differentiated cash dividend proportion in accordance with the procedures as required by the Articles of
Association:
(1) If the Company is at a mature stage of development and has no significant capital expenditure
arrangement, the proportion of cash dividends in the profit distribution shall be at least 80% when the
profit distribution is made;
(2) If the Company is at a mature stage of development and has significant capital expenditure
arrangement, the proportion of cash dividends in the profit distribution shall be at least 40% when the
profit distribution is made;
Annual Report 2020
40 / 244
(3) If the Company is at a growing stage of development and has no significant capital expenditure
arrangement, the proportion of cash dividends in the profit distribution shall be at least 30% when the
profit distribution is made;
(4) If the Company is at a growing stage of development and has significant capital expenditure
arrangement, the proportion of cash dividends in the profit distribution shall be at least 20% when the
profit distribution is made.
The aforesaid “significant investment plans” or “significant cash expenditure” refers to one of the
following:
(1) The proposed external investment, acquisition of assets or purchase of equipment by the Company
in the coming twelve months with accumulated expenses amounting to or exceeding 50% of the latest
audited net assets of the Company and exceeding RMB50,000,000;
(2) The proposed external investment, acquisition of assets or purchase of equipment by the Company
in the coming twelve months with accumulated expenses amounting to or exceeding 30% of the latest
audited total assets of the Company.
Significant investment plans or significant cash expenditure that meets the above conditions shall be
reviewed and approved at the general meeting after being reviewed by the Board meeting.
5. During the Reporting Period, the formulation and implementation of the cash dividend policy has
complied with the Articles of Association and the resolutions of the general meetings. The dividend
distribution standards and proportions are clearly stated, and relevant decision making procedures and
systems are complete. Independent directors have diligently served their obligations, and played their roles.
As minority shareholders have opportunities to fully express their opinions and appeals, their legitimate
interests have been fully protected.

Annual Report 2020
41 / 244
2) Plan or proposal for dividend distribution of ordinary shares or transfer of capital reserve fund to share capital of the Company for the latest three
years (including the Reporting Period)
Unit: Yuan Currency: RMB
Year of
distribution
Number of
bonus shares
per 10 shares
(shares)
Amount of
dividends
distributed per 10
shares (Yuan)
(inclusive of tax)
Number of shares
transferred per 10
shares (shares)
Amount of cash
dividends
(inclusive of tax)
Net profit attributable to the ordinary
shareholders of the listed company in
the consolidated financial statements
for the distribution year
Percentage of the net profit
attributable to the ordinary
shareholders of the listed
company in the consolidated
financial statements (%)
2020 0 5 0 463,713,800.00 1,255,426,655.27 36.94
2019 0 4 0 368,000,000.00 1,060,083,625.03 34.71
2018 0 3 0 276,000,000.00 806,847,308.41 34.21
3) The inclusion of shares repurchased through cash offer in cash dividend
"□ Applicable" "√ Not applicable"
4) If the Company records profit distributable to ordinary shareholders of the Company during the Reporting Period is positive but there is no proposal
for cash dividend, the Company shall disclose the reasons, the usage and the utilization plan of the undistributed profits in detail
"□ Applicable" "√ Not applicable"
II. Performance of undertakings
1) Undertakings by the Company’s beneficial controllers, shareholders, related parties, acquirers, the Company and other related parties during or
subsisted in the Reporting Period
"√ Applicable" "□ Not applicable"
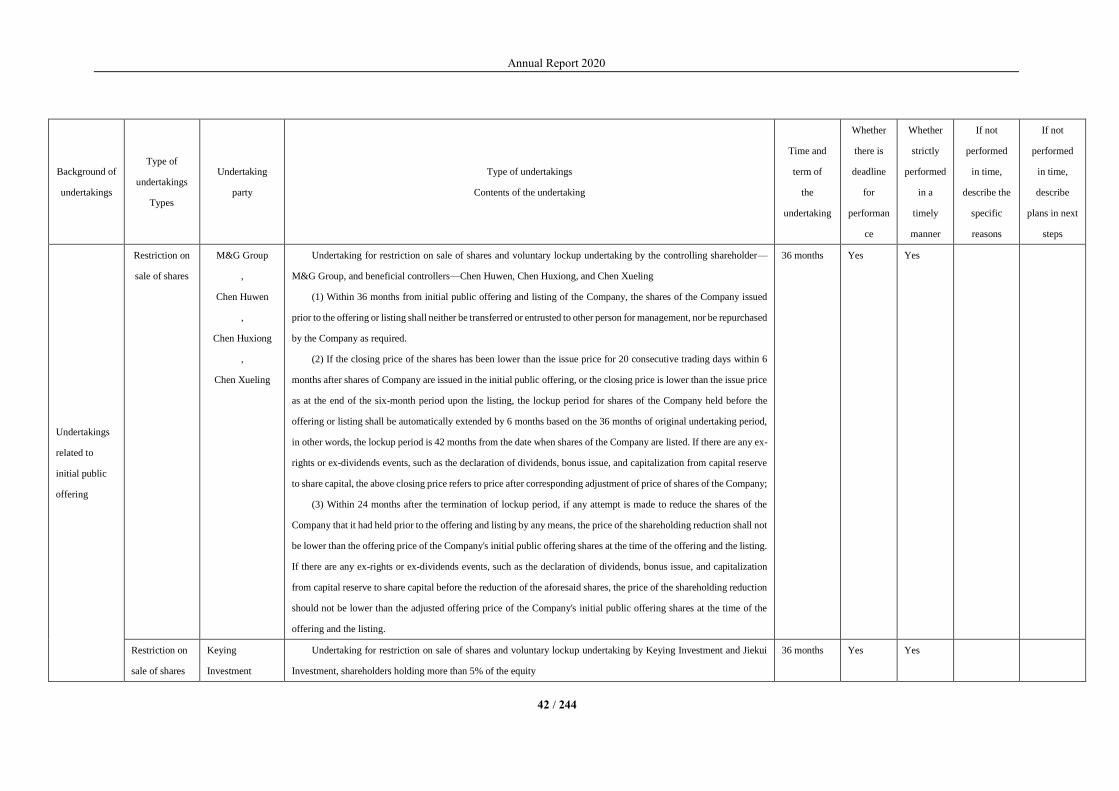
Annual Report 2020
42 / 244
Background of
undertakings
Type of
undertakings
Types
Undertaking
party
Type of undertakings
Contents of the undertaking
Time and
term of
the
undertaking
Whether
there is
deadline
for
performan
ce
Whether
strictly
performed
in a
timely
manner
If not
performed
in time,
describe the
specific
reasons
If not
performed
in time,
describe
plans in next
steps
Undertakings
related to
initial public
offering
Restriction on
sale of shares
M&G Group
,
Chen Huwen
,
Chen Huxiong
,
Chen Xueling
Undertaking for restriction on sale of shares and voluntary lockup undertaking by the controlling shareholder—
M&G Group, and beneficial controllers—Chen Huwen, Chen Huxiong, and Chen Xueling
(1) Within 36 months from initial public offering and listing of the Company, the shares of the Company issued
prior to the offering or listing shall neither be transferred or entrusted to other person for management, nor be repurchased
by the Company as required.
(2) If the closing price of the shares has been lower than the issue price for 20 consecutive trading days within 6
months after shares of Company are issued in the initial public offering, or the closing price is lower than the issue price
as at the end of the six-month period upon the listing, the lockup period for shares of the Company held before the
offering or listing shall be automatically extended by 6 months based on the 36 months of original undertaking period,
in other words, the lockup period is 42 months from the date when shares of the Company are listed. If there are any ex-
rights or ex-dividends events, such as the declaration of dividends, bonus issue, and capitalization from capital reserve
to share capital, the above closing price refers to price after corresponding adjustment of price of shares of the Company;
(3) Within 24 months after the termination of lockup period, if any attempt is made to reduce the shares of the
Company that it had held prior to the offering and listing by any means, the price of the shareholding reduction shall not
be lower than the offering price of the Company's initial public offering shares at the time of the offering and the listing.
If there are any ex-rights or ex-dividends events, such as the declaration of dividends, bonus issue, and capitalization
from capital reserve to share capital before the reduction of the aforesaid shares, the price of the shareholding reduction
should not be lower than the adjusted offering price of the Company's initial public offering shares at the time of the
offering and the listing.
36 months Yes Yes
Restriction on
sale of shares
Keying
Investment
Undertaking for restriction on sale of shares and voluntary lockup undertaking by Keying Investment and Jiekui
Investment, shareholders holding more than 5% of the equity
36 months Yes Yes

Annual Report 2020
43 / 244
,
Jiekui
Investment
(1) Within 36 months from initial public offering and listing of the Company, the shares of the Company issued
prior to the offering or listing shall neither be transferred or entrusted to other person for management, nor be repurchased
by the Company as required.
(2) If the closing price of the shares has been lower than the issue price for 20 consecutive trading days within 6
months after shares of Company are issued in the initial public offering, or the closing price is lower than the issue price
as at the end of the six-month period upon the listing, the lockup period for shares of the Company held before the
offering or listing shall be automatically extended by 6 months based on the 36 months of original undertaking period,
in other words, the lockup period is 42 months from the date when shares of the Company are listed. If there are any ex-
rights or ex-dividends events, such as the declaration of dividends, bonus issue, and capitalization from capital reserve
to share capital, the above closing price refers to price after corresponding adjustment of price of shares of the Company;
(3) After the aforesaid undertaking period expires, the proportion of shares unlocked every year shall not exceed
25% of the total shares of the Company held;
(4) Within 24 months after the termination of lockup period, if any attempt is made to reduce the shares of the
Company that it had held prior to the offering and listing by any means, the price of the shareholding reduction shall not
be lower than the offering price of the Company's initial public offering shares at the time of the offering and the listing.
If there are any ex-rights or ex-dividends events, such as the declaration of dividends, bonus issue, and capitalization
from capital reserve to share capital before the reduction of the aforesaid shares, the price of the shareholding reduction
should not be lower than the adjusted offering price of the Company's initial public offering shares at the time of the
offering and the listing;
(5) Notwithstanding any change in the position of some of the partners in the joint venture or their departure from
the joint venture, the joint venture will strictly perform the above undertakings.
Others M&G Group Shareholding and intention to reduce shareholding of the controlling shareholder—M&G Group
(1) M&G Group advocates that shares of the Company should be held in the long term to ensure that M&G Group
shares operation achievements of the Company on a continuous basis. Therefore, M&G Group has the intention to hold
shares of the Company for a long term.
(2) After the lockup period of the Company’s shares held by M&G Group expires, it is possible that M&G Group
might reduce shareholding of the Company appropriately for the development requirement of M&G Group. In this
Not
applicable
No Yes
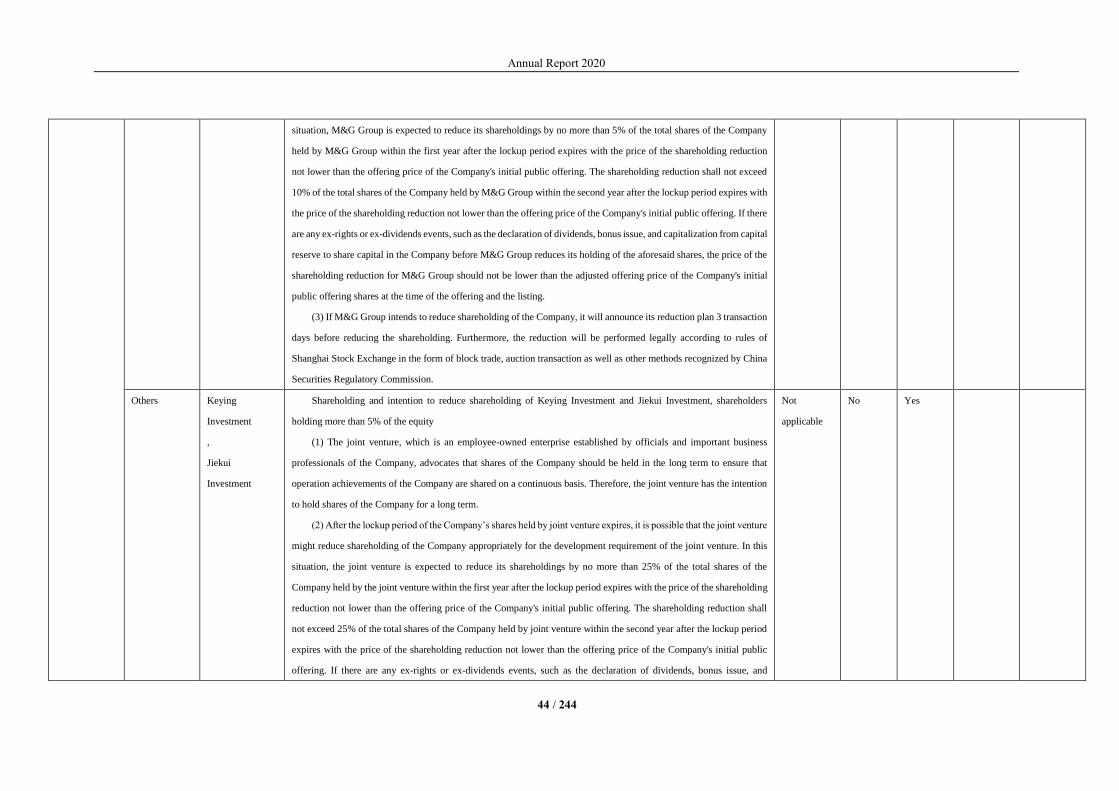
Annual Report 2020
44 / 244
situation, M&G Group is expected to reduce its shareholdings by no more than 5% of the total shares of the Company
held by M&G Group within the first year after the lockup period expires with the price of the shareholding reduction
not lower than the offering price of the Company's initial public offering. The shareholding reduction shall not exceed
10% of the total shares of the Company held by M&G Group within the second year after the lockup period expires with
the price of the shareholding reduction not lower than the offering price of the Company's initial public offering. If there
are any ex-rights or ex-dividends events, such as the declaration of dividends, bonus issue, and capitalization from capital
reserve to share capital in the Company before M&G Group reduces its holding of the aforesaid shares, the price of the
shareholding reduction for M&G Group should not be lower than the adjusted offering price of the Company's initial
public offering shares at the time of the offering and the listing.
(3) If M&G Group intends to reduce shareholding of the Company, it will announce its reduction plan 3 transaction
days before reducing the shareholding. Furthermore, the reduction will be performed legally according to rules of
Shanghai Stock Exchange in the form of block trade, auction transaction as well as other methods recognized by China
Securities Regulatory Commission.
Others Keying
Investment
,
Jiekui
Investment
Shareholding and intention to reduce shareholding of Keying Investment and Jiekui Investment, shareholders
holding more than 5% of the equity
(1) The joint venture, which is an employee-owned enterprise established by officials and important business
professionals of the Company, advocates that shares of the Company should be held in the long term to ensure that
operation achievements of the Company are shared on a continuous basis. Therefore, the joint venture has the intention
to hold shares of the Company for a long term.
(2) After the lockup period of the Company’s shares held by joint venture expires, it is possible that the joint venture
might reduce shareholding of the Company appropriately for the development requirement of the joint venture. In this
situation, the joint venture is expected to reduce its shareholdings by no more than 25% of the total shares of the
Company held by the joint venture within the first year after the lockup period expires with the price of the shareholding
reduction not lower than the offering price of the Company's initial public offering. The shareholding reduction shall
not exceed 25% of the total shares of the Company held by joint venture within the second year after the lockup period
expires with the price of the shareholding reduction not lower than the offering price of the Company's initial public
offering. If there are any ex-rights or ex-dividends events, such as the declaration of dividends, bonus issue, and
Not
applicable
No Yes

Annual Report 2020
45 / 244
capitalization from capital reserve to share capital before the Company reduces its holding of the aforesaid shares, the
price of the shareholding reduction for the Company should not be lower than the adjusted offering price of the
Company's initial public offering shares at the time of the offering and the listing.
(3) If the joint venture intends to reduce shareholding of the Company, it will announce its reduction plan 3
transaction days before reducing the shareholding. Furthermore, the reduction will be performed legally according to
rules of Shanghai Stock Exchange in the form of block trade, auction transaction as well as other methods recognized
by China Securities Regulatory Commission.
Address
competition
between
counterparts
M&G Group
,
Keying
Investment
,
Jiekui
Investment
Undertaking in relation to non-competition by M&G Group, Keying Investment and Jiekui Investment
(1) The enterprise and other enterprises (except the Company and enterprises controlled by it) controlled and (or)
invested by it currently have not engaged in any form of business or activity that constitutes or may constitute a direct
or indirect competition relationship with principal businesses of the Company and enterprises controlled by it.
(2) After the initial public offering and listing of the Company, the enterprise and other enterprises (except the
Company and enterprises controlled by it) controlled and (or) invested by it will not:
① engage in any form of business or activity that constitutes or may constitute a direct or indirect competition
relationship with current or future principal businesses that the Company and enterprises controlled by it specialize in;
② support other enterprises other than the Company and enterprises controlled by it in any form of business or
activity that constitutes or may constitute a direct or indirect competition relationship with current or future principal
businesses that the Company and enterprises controlled by it specialize in;
③ interfere in any form of business or activity that constitutes or may constitute a direct or indirect competition
relationship with current or future principal businesses that the Company and enterprises controlled by it specialize in.
Apart from the aforesaid undertaking, the enterprise further guarantees that it will
① ensure its independence in assets, businesses, employees, finance and institution according to relevant rules of
laws and regulations;
② adopt legal and effective measures to stop companies, enterprises and other economic organizations that the
Company has control right from engaging directly or indirectly in the same or similar businesses with the Company;
③ not take advantage of its position as the controlling shareholder of the Company to carry out any other activities
that may harm the rights of the Company and other shareholders.
Not
applicable
No Yes
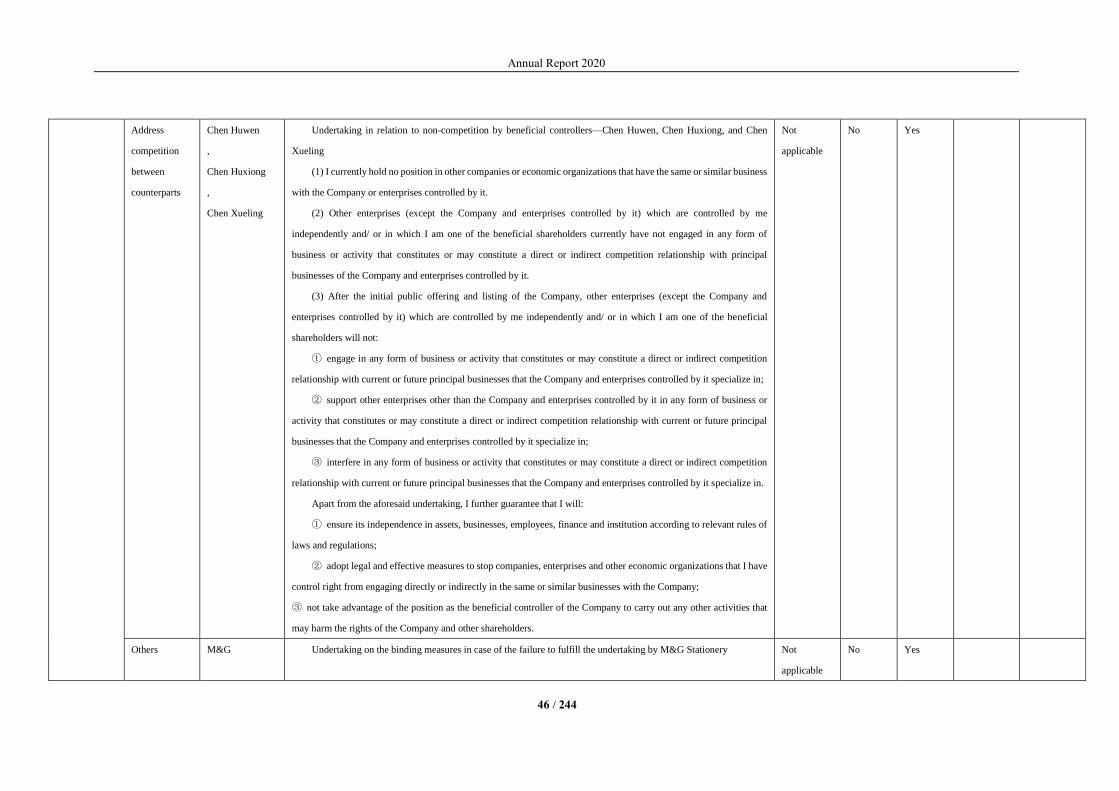
Annual Report 2020
46 / 244
Address
competition
between
counterparts
Chen Huwen
,
Chen Huxiong
,
Chen Xueling
Undertaking in relation to non-competition by beneficial controllers—Chen Huwen, Chen Huxiong, and Chen
Xueling
(1) I currently hold no position in other companies or economic organizations that have the same or similar business
with the Company or enterprises controlled by it.
(2) Other enterprises (except the Company and enterprises controlled by it) which are controlled by me
independently and/ or in which I am one of the beneficial shareholders currently have not engaged in any form of
business or activity that constitutes or may constitute a direct or indirect competition relationship with principal
businesses of the Company and enterprises controlled by it.
(3) After the initial public offering and listing of the Company, other enterprises (except the Company and
enterprises controlled by it) which are controlled by me independently and/ or in which I am one of the beneficial
shareholders will not:
① engage in any form of business or activity that constitutes or may constitute a direct or indirect competition
relationship with current or future principal businesses that the Company and enterprises controlled by it specialize in;
② support other enterprises other than the Company and enterprises controlled by it in any form of business or
activity that constitutes or may constitute a direct or indirect competition relationship with current or future principal
businesses that the Company and enterprises controlled by it specialize in;
③ interfere in any form of business or activity that constitutes or may constitute a direct or indirect competition
relationship with current or future principal businesses that the Company and enterprises controlled by it specialize in.
Apart from the aforesaid undertaking, I further guarantee that I will:
① ensure its independence in assets, businesses, employees, finance and institution according to relevant rules of
laws and regulations;
② adopt legal and effective measures to stop companies, enterprises and other economic organizations that I have
control right from engaging directly or indirectly in the same or similar businesses with the Company;
③ not take advantage of the position as the beneficial controller of the Company to carry out any other activities that
may harm the rights of the Company and other shareholders.
Not
applicable
No Yes
Others M&G Undertaking on the binding measures in case of the failure to fulfill the undertaking by M&G Stationery Not
applicable
No Yes
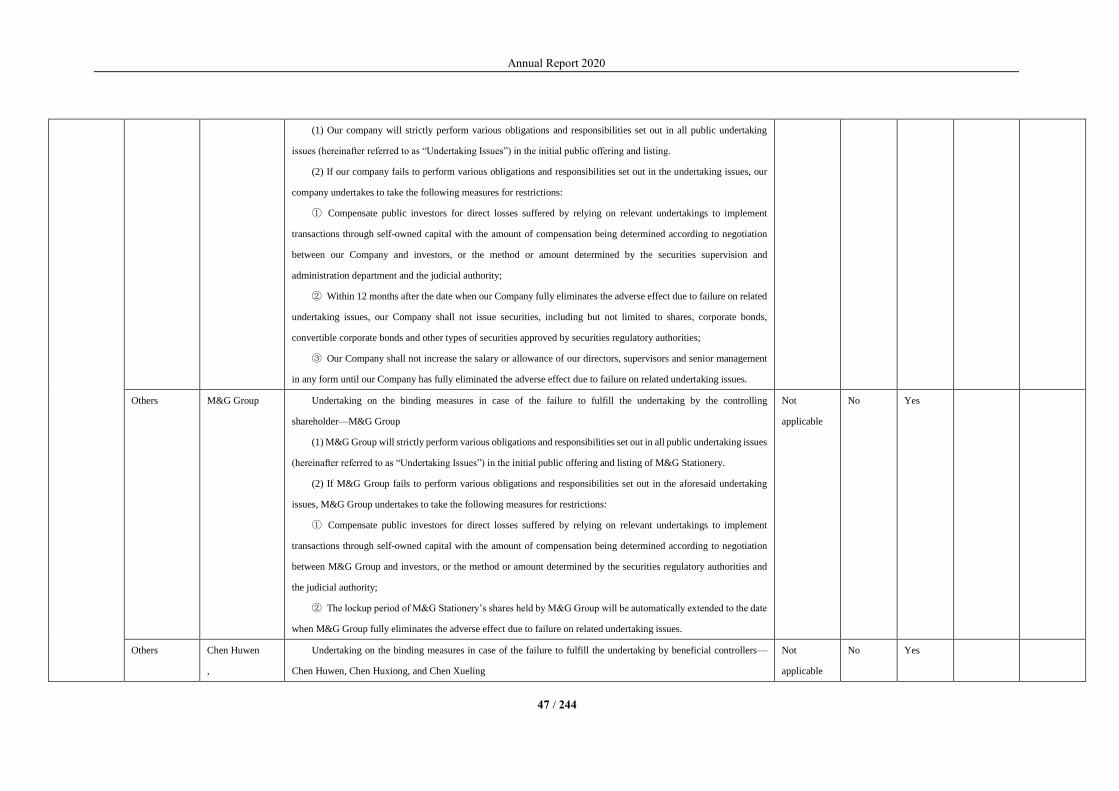
Annual Report 2020
47 / 244
(1) Our company will strictly perform various obligations and responsibilities set out in all public undertaking
issues (hereinafter referred to as “Undertaking Issues”) in the initial public offering and listing.
(2) If our company fails to perform various obligations and responsibilities set out in the undertaking issues, our
company undertakes to take the following measures for restrictions:
① Compensate public investors for direct losses suffered by relying on relevant undertakings to implement
transactions through self-owned capital with the amount of compensation being determined according to negotiation
between our Company and investors, or the method or amount determined by the securities supervision and
administration department and the judicial authority;
② Within 12 months after the date when our Company fully eliminates the adverse effect due to failure on related
undertaking issues, our Company shall not issue securities, including but not limited to shares, corporate bonds,
convertible corporate bonds and other types of securities approved by securities regulatory authorities;
③ Our Company shall not increase the salary or allowance of our directors, supervisors and senior management
in any form until our Company has fully eliminated the adverse effect due to failure on related undertaking issues.
Others M&G Group Undertaking on the binding measures in case of the failure to fulfill the undertaking by the controlling
shareholder—M&G Group
(1) M&G Group will strictly perform various obligations and responsibilities set out in all public undertaking issues
(hereinafter referred to as “Undertaking Issues”) in the initial public offering and listing of M&G Stationery.
(2) If M&G Group fails to perform various obligations and responsibilities set out in the aforesaid undertaking
issues, M&G Group undertakes to take the following measures for restrictions:
① Compensate public investors for direct losses suffered by relying on relevant undertakings to implement
transactions through self-owned capital with the amount of compensation being determined according to negotiation
between M&G Group and investors, or the method or amount determined by the securities regulatory authorities and
the judicial authority;
② The lockup period of M&G Stationery’s shares held by M&G Group will be automatically extended to the date
when M&G Group fully eliminates the adverse effect due to failure on related undertaking issues.
Not
applicable
No Yes
Others Chen Huwen
,
Undertaking on the binding measures in case of the failure to fulfill the undertaking by beneficial controllers—
Chen Huwen, Chen Huxiong, and Chen Xueling
Not
applicable
No Yes

Annual Report 2020
48 / 244
Chen Huxiong
,
Chen Xueling
(1) I will strictly perform various obligations and responsibilities set out in all public undertaking issues (hereinafter
referred to as “Undertaking Issues”) in the initial public offering and listing of M&G Stationery.
(2) If I fail to perform various obligations and responsibilities set out in the aforesaid undertaking issues, I undertake
to take the following measures for restrictions:
① Compensate public investors for direct losses suffered by relying on relevant undertakings to implement
transactions through self-owned capital with the amount of compensation being determined according to negotiation
between investors and me, or the method or amount determined by the securities regulatory authorities and the judicial
authority;
② The lockup period of M&G Stationery’s shares held by me directly or indirectly will be automatically extended
to the date when I fully eliminate the adverse effect due to failure on related undertaking issues.
③ I shall not require M&G Stationery to increase my salary or allowance in any form, nor shall I accept the
increase of salary or allowance by M&G Stationery in any form until I have fully eliminated the adverse effect due to
failure on related undertaking issues.
Others Keying
Investment
,
Jiekui
Investment
Undertaking on the binding measures in case of the failure to fulfill the undertaking by Keying Investment and
Jiekui Investment, shareholders holding more than 5% of the equity
(1) The joint venture will strictly perform various obligations and responsibilities set out in all public undertaking
issues (hereinafter referred to as “Undertaking Issues”) in the initial public offering and listing of M&G Stationery.
(2) If the joint venture fails to perform various obligations and responsibilities set out in the aforesaid undertaking
issues, the joint venture undertakes to take the following measures for restrictions:
① Compensate public investors for direct losses suffered by relying on relevant undertakings to implement
transactions through self-owned capital with the amount of compensation being determined according to negotiation
between the joint venture and investors, or the method or amount determined by the securities regulatory authorities and
the judicial authority;
② The lockup period of M&G Stationery’s shares held by the joint venture will be automatically extended to the
date when the joint venture fully eliminates the adverse effect due to failure on related undertaking issues.
Not
applicable
No Yes
Annual Report 2020
49 / 244
2) Where the Company has profit forecasts on assets or projects, and the Reporting Period was
within the term of profit forecasts, the Company has to state whether such profit forecasts on
assets or projects are fulfilled and the reasons thereof
Whether the original profit forecast is reached and the description of reasons
"□ Fulfilled" "□ Unfulfilled" "√ Not applicable"
3) Execution of the performance undertakings and its impact on the goodwill impairment testing
"□ Applicable" "√ Not applicable"
III. Occupation of funds and repayment of debts during the Reporting Period
"□ Applicable" "√ Not applicable"
IV. Explanation of the Company on the “non-standard opinions audit report” from accounting
firm
"□ Applicable" "√ Not applicable"
V. Analysis and explanation from the Company on the reasons and impact of the change of
accounting policies, accounting estimates or correction on significant accounting errors
1) Analysis and explanation from the Company on the reasons and impact of the change of
accounting policies or accounting estimates
"√ Applicable" "□ Not applicable"
1. Implementation of the Accounting Standards for Business Enterprises No. 14 - Revenue (revised
in 2017)
The Ministry of Finance revised the Accounting Standards for Business Enterprises No. 14 - Revenue
(hereinafter referred to as the "New Revenue Standards") in 2017. The revised standards stipulate that for
the first implementation of the standards, the amounts of retained earnings and other related items in the
financial statements at the beginning of the year should be adjusted according to the cumulative impact,
and the information for the comparable period should not be adjusted.
The Company implements the new revenue standards from 1 January 2020. According to the
provisions of the new revenue standards, the Company only adjusted the amounts of retained earnings and
other related items in the financial statements at the beginning of 2020 for the cumulative impact of
contracts that have not been completed on the date of first implementation, and did not make adjustments
to the comparative financial statements. The main impacts of the implementation of the standards are as
follows:
Contents and reasons of changes in
accounting policies
Review and
approval
procedure
Affected item in
statement
Effect on balance at 1 January
2020
Consolidation Parent
company
(1) The original revenue from the e- The 20th meeting Accounts 47,244,304.93
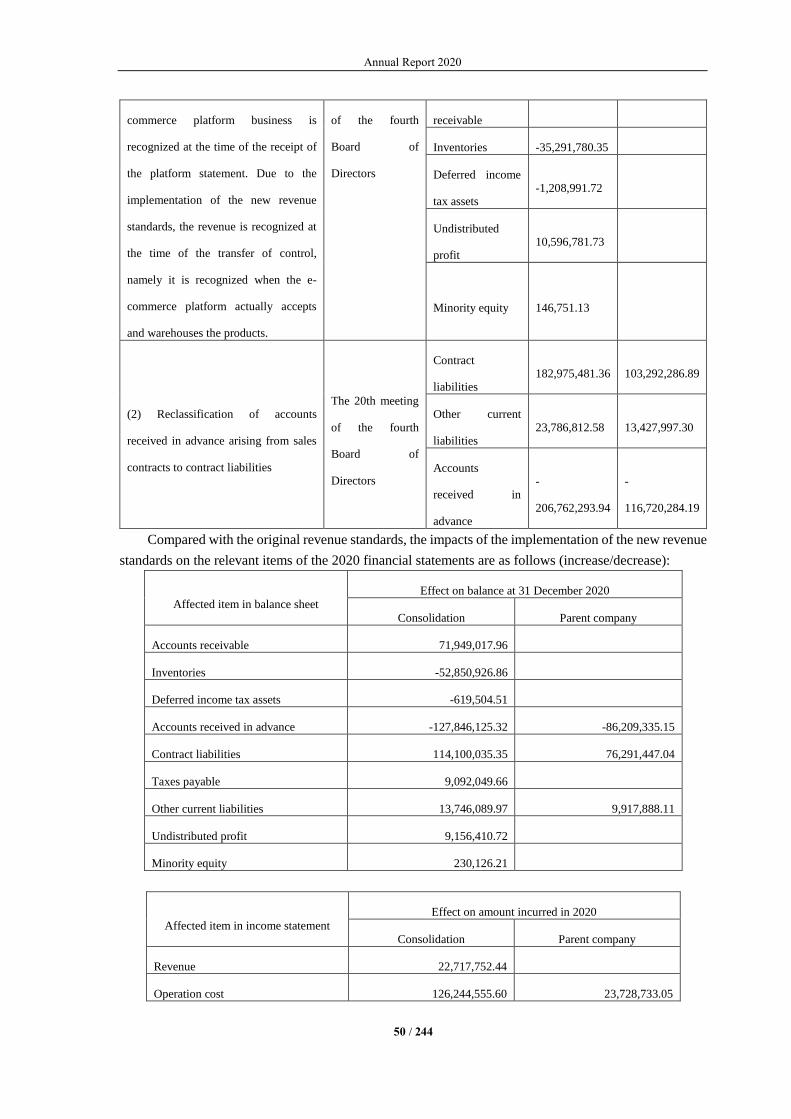
Annual Report 2020
50 / 244
commerce platform business is
recognized at the time of the receipt of
the platform statement. Due to the
implementation of the new revenue
standards, the revenue is recognized at
the time of the transfer of control,
namely it is recognized when the e-
commerce platform actually accepts
and warehouses the products.
of the fourth
Board of
Directors
receivable
Inventories -35,291,780.35
Deferred income
tax assets -1,208,991.72
Undistributed
profit 10,596,781.73
Minority equity 146,751.13
(2) Reclassification of accounts
received in advance arising from sales
contracts to contract liabilities
The 20th meeting
of the fourth
Board of
Directors
Contract
liabilities 182,975,481.36 103,292,286.89
Other current
liabilities 23,786,812.58 13,427,997.30
Accounts
received in
advance
-
206,762,293.94
-
116,720,284.19
Compared with the original revenue standards, the impacts of the implementation of the new revenue
standards on the relevant items of the 2020 financial statements are as follows (increase/decrease):
Affected item in balance sheet Effect on balance at 31 December 2020
Consolidation Parent company
Accounts receivable 71,949,017.96
Inventories -52,850,926.86
Deferred income tax assets -619,504.51
Accounts received in advance -127,846,125.32 -86,209,335.15
Contract liabilities 114,100,035.35 76,291,447.04
Taxes payable 9,092,049.66
Other current liabilities 13,746,089.97 9,917,888.11
Undistributed profit 9,156,410.72
Minority equity 230,126.21
Affected item in income statement
Effect on amount incurred in 2020
Consolidation Parent company
Revenue 22,717,752.44
Operation cost 126,244,555.60 23,728,733.05

Annual Report 2020
51 / 244
Selling expenses -77,637,937.98 7,318,738.06
Administrative expenses -31,047,471.11 -31,047,471.11
Credit impairment losses -1,269,284.91
Income tax expenses -210,406.66
Net profit -1,356,995.93
2. Implementation of the Interpretation of Accounting Standards for Business Enterprises No. 13
The Ministry of Finance issued the Interpretation of Accounting Standards for Business Enterprises
No. 13 (Cai Kuai [2019] No. 21, hereinafter referred to as "Interpretation No. 13") on 10 December 2019,
which comes into force on 1 January 2020. No retrospective adjustment is required.
(1) Determination of related parties
Interpretation No. 13 clarifies that the following circumstances constitute a related party: a joint
venture or associate between an enterprise and other member units (including parent companies and
subsidiaries) of the enterprise group to which it belongs; a joint venture of an enterprise and other joint
ventures or associates of the enterprise. In addition, Interpretation No. 13 clarifies that two or more
companies that are only significantly affected by one party do not constitute related parties. It also adds
that associates include associates and their subsidiaries, and joint ventures include joint ventures and their
subsidiaries.
(2) Definition of business
Interpretation No. 13 completes the three elements of business composition, refines the judgment
conditions of the business composition, and introduces the "concentration test" option to simplify to a
certain extent the judgment of whether a combination obtained not under common control constitutes a
business.
The Company implements Interpretation No. 13 from 1 January 2020, and the comparative financial
statements are not adjusted. The implementation of Interpretation No. 13 had no significant impact on the
Company's financial status and operating results.
3. Implementation of the Interim Provisions on the Accounting Treatment of Carbon Emission Permit
Trading
On 16 December 2019, the Ministry of Finance issued the Interim Provisions on the Accounting
Treatment of Carbon Emission Permit Trading (Cai Kuai [2019] No. 22), which is applicable to related
companies in the key emission units engaged in the trading business of carbon emission rights in
accordance with the Interim Measures for the Administration of Carbon Emission Permit Trading and
other relevant regulations (hereinafter referred to as "key emission companies"). The Provisions come into
effect on 1 January 2020, and key emission companies should adopt the future applicable law to apply the
Provisions.
The Company implements the Provisions from 1 January 2020, and the comparative financial
statements are not adjusted. The implementation of the Provisions had no significant impact on the
Company's financial status and operating results.
4. Implementation of the Provisions on the Accounting Treatment of the COVID-19 Pandemic-
related Rental Concessions

Annual Report 2020
52 / 244
On 19 June 2020, the Ministry of Finance issued the Provisions on the Accounting Treatment of the
COVID-19 Pandemic-related Rental Concessions (Caikuai (2020) No. 10) with immediate effect,
allowing companies to adjust relevant rental concessions incurred between 1 January 2020 and the
implementation date of the Provisions. According to the Provisions, companies can resort to a simplified
method for accounting treatment for rental reductions, deferred rent payment and other rental concessions
relating to COVID-19 pandemic that meet the stipulations of the Provisions.
The Company used the simplified method for accounting treatment for all rental concessions that fall
within the scope of the Provisions, and adjusted the relevant rent concessions incurred between 1 January
2020 and the effective date of the Provisions accordingly.
As the lessee, the Company adopted a simplified method to deal with related rental concessions to
offset the current operating costs, management expenses and sales expenses totaling RMB
12,799,186.64.
2) Analysis and explanation from the Company on the reasons and impact of the correction on
significant accounting errors
"□ Applicable" "√ Not applicable"
3) Communication with the previous accounting firm
"□ Applicable" "√ Not applicable"
4) Other descriptions
"□ Applicable" "√ Not applicable"
VI. Appointment and dismissal of the accounting firm
Unit: 0’000 Currency: RMB
Current accounting firm
Name of domestic accounting firm BDO China Shu Lun Pan Certified Public Accounts
LLP
Remuneration of domestic accounting firm 136.5
Term of office of domestic accounting firm 11
Name Remuneration
Internal control audit accounting firm BDO China Shu Lun Pan Certified Public
Accounts LLP
52.5
Explanation on appointment and dismissal of the accounting firm
"√ Applicable" "□ Not applicable"
During the Reporting Period, the BDO China Shu Lun Pan Certified Public Accounts LLP was re-
appointed as the audit institution.
Explanation on the change of accounting firm during the auditing period
"□ Applicable" "√ Not applicable"

Annual Report 2020
53 / 244
VII. Risk of suspension of listing
1) Causes of suspension of listing
"□ Applicable" "√ Not applicable"
2) Measures to be taken by the Company
"□ Applicable" "√ Not applicable"
VIII. Situation and causes for termination of listing
"□ Applicable" "√ Not applicable"
IX. Matters related to bankruptcy and reorganisation
"□ Applicable" "√ Not applicable"
X. Material litigation and arbitration
"□ the Company had material litigation and arbitration during the year"
"√ the Company did not have material litigation and arbitration during the year"
XI. Punishment and rectification to the listed Company, its directors, supervisors, senior
management, controlling shareholders, beneficial controllers and acquirers
"□ Applicable" "√ Not applicable"
XII. Explanation on credibility status of the Company, its controlling shareholders and beneficial
controllers during the Reporting Period
"√ Applicable" "□ Not applicable"
During the Reporting Period, since the Company, its controlling shareholders and beneficial controllers
maintained sound credibility, there had been no refusal to implement effective judgments of a court or
default of any material overdue debt.
XIII. Equity incentive plan, employee shareholding plan or other employee incentive measures
of the Company and their impacts
1) Incentive matters disclosed in temporary announcements and without further progress or
change in subsequent implementation
"√ Applicable" "□ Not applicable"
Overview of matters Query index
On 10 April 2020, the Company held the 20th
meeting of the fourth Board of Directors and the 13th
meeting of the fourth Board of Supervisors, which
reviewed and passed the Proposal on the Company's
2020 Restricted Stock Incentive Plan (Draft) and Its
Announcement on Resolutions of the 20th Meeting
of the Fourth Board of Directors numbered 2020-
006
Annual Report 2020
54 / 244
Summary, the Proposal on the Management
Measures for the Implementation of the Company's
2020 Restricted Stock Incentive Plan, and the
Proposal on Requesting the General Meeting of
Shareholders to Authorize the Board of Directors to
Deal with Matters Related to Restricted Stock
Incentives.
Announcement on Resolutions of the 13th Meeting
of the Fourth Board of Directors numbered 2020-
007
Announcement on the Summary of the Equity
Incentive Plan Draft numbered 2020-015
On 8 May 2020, the Company held the 2019
Annual General Meeting of Shareholders, which
reviewed and passed the Proposal on the Company's
2020 Restricted Stock Incentive Plan (Draft) and Its
Summary, the Proposal on the Management
Measures for the Implementation of the Company's
2020 Restricted Stock Incentive Plan, and the
Proposal on Requesting the General Meeting of
Shareholders to Authorize the Board of Directors to
Deal with Matters Related to Restricted Stock
Incentives.
Announcement on Resolutions of the 2019 Annual
General Meeting of Shareholders numbered 2020-
022
On 8 May 2020, the Company held the 1st
meeting of the fifth Board of Directors and the 1st
meeting of the fifth Board of Supervisors, which
reviewed and passed the Proposal on Adjusting the
2020 Restricted Stock Incentive Plan and the
Proposal on Granting Restricted Stocks to Incentive
Objects in 2020.
Announcement on Resolutions of the 1st Meeting of
the Fifth Board of Directors numbered 2020-024
Announcement on Resolutions of the 1st Meeting of
the Fifth Board of Supervisors numbered 2020-025
Announcement on Adjusting Matters Related to the
2020 Restricted Stock Incentive Plan numbered
2020-026
Proposal on Granting Restricted Stocks to Incentive
Objects in 2020 numbered 2020-027
On 29 May 2020, the Company completed the
registration of restricted stocks with China Securities
Depository and Clearing Corporation Limited
Shanghai Branch.
Announcement on the Results of the First Grant of
the 2020 Restricted Stock Incentive Plan numbered
2020-029
2) Incentive matters which have not been disclosed in temporary announcements or with further
progress
Equity incentive
"□ Applicable" "√ Not applicable"
Other descriptions
"□ Applicable" "√ Not applicable"
Employee shareholding plan
"□ Applicable" "√ Not applicable"
Other incentive measures

Annual Report 2020
55 / 244
"□ Applicable" "√ Not applicable"
XIV. Major related transactions
1) Related transactions in relation to daily operation
1. Events disclosed in temporary announcements and without further progress or change in
subsequent implementation
"□ Applicable" "√ Not applicable"
2. Events disclosed in temporary announcements and with further progress or change in
subsequent implementation
"√ Applicable" "□ Not applicable"
The 20th meeting of the fourth Board meeting and 2019 annual general meeting of the Company
reviewed and passed the Proposal on the Implementation of Daily Related Transactions in 2019 and
Expected Daily Related Transactions in 2020, and issued the Announcement on the Implementation of
Daily Related Transactions in 2019 and Expected Daily Related Transactions in 2020 (numbered 2020-
011) on 14 April 2020.
In 2020, sales to the sales company controlled by Guo Weilong were estimated to be
RMB460,000,000.00. It was estimated that fees for the lease of self-owned houses (including office
buildings, workshops, parking space, warehouses and dormitories) paid to M&G Group will amounted to
RMB4,620,952.38; fees for the lease of self-owned office buildings and parking space amounted to
RMB3,831,849.04; utilities amounted to RMB6,000,000.00. M&G Colipu is expected to pay M&G Group
RMB11,714,870.72 for the lease of self-owned office building and parking space; M&G Colipu is
expected to pay M&G Group RMB3,125,755.71 for the lease of self-owned office building; M&G
Technologies is expected to pay M&G Group RMB1,675,847.14 for the lease of self-owned office
building and parking space; M&G Life is expected to pay M&G Group RMB5,714.29 for the lease of
parking space.
In 2020, actual sales to the sales company controlled by Guo Weilong were RMB439,535,408.86.
Fees for the lease of self-owned houses (including office buildings, workshops, parking space, warehouses
and dormitories) actually paid to M&G Group amounted to RMB4,620,952.38; fees for the lease of self-
owned office buildings and parking space amounted to RMB3,519,671.17; and utilities amounted to
RMB5,164,795.80. M&G Colipu actually paid M&G Group RMB10,761,012.43 for the lease of self-
owned office building and parking space; M&G Colipu actually paid M&G Group RMB2,865,276.09 for
the lease of self-owned office building; M&G Technologies actually paid M&G Group RMB1,541,431.33
for the lease of self-owned office building and parking space; M&G Life actually paid M&G Group
RMB5,714.29 for the lease of self-owned parking space.
3. Events not disclosed in temporary announcements
"□ Applicable" "√ Not applicable"
Annual Report 2020
56 / 244
2) Related transactions as a result of acquisition and disposal of assets or equity
1. Events disclosed in temporary announcements and without further progress or change in
subsequent implementation
"□ Applicable" "√ Not applicable"
2. Events disclosed in temporary announcements and with further progress or change in
subsequent implementation
"□ Applicable" "√ Not applicable"
3. Events not disclosed in temporary announcements
"□ Applicable" "√ Not applicable"
4. Disclosable performance achievements during the Reporting Period when involved with
agreed-upon performance
"□ Applicable" "√ Not applicable"
3) Major related transactions in joint external investment
1. Events disclosed in temporary announcements and without further progress or change in
subsequent implementation
"□ Applicable" "√ Not applicable"
2. Events disclosed in temporary announcements and with further progress or change in
subsequent implementation
"□ Applicable" "√ Not applicable"
3. Events not disclosed in temporary announcements
"□ Applicable" "√ Not applicable"
4) Creditor’s rights and debts with related parties
1. Events disclosed in temporary announcements and without further progress or change in
subsequent implementation
"□ Applicable" "√ Not applicable"
2. Events disclosed in temporary announcements and with further progress or change in
subsequent implementation
"□ Applicable" "√ Not applicable"
3. Events not disclosed in temporary announcements
"□ Applicable" "√ Not applicable"

Annual Report 2020
57 / 244
5) Others
"□ Applicable" "√ Not applicable"
XV. Material contracts and their performance
1) Trusteeship, contracting and leasing matters
1. Trusteeship
"□ Applicable" "√ Not applicable"
2. Contracting
"□ Applicable" "√ Not applicable"
3. Leasing
"□ Applicable" "√ Not applicable"
2) Guarantees
"□ Applicable" "√ Not applicable"
3) Entrusting others to manage cash assets
1. Entrusted wealth management
(1) Overall condition of entrusted wealth management
"√ Applicable" "□ Not applicable"
Unit: 0’000 Currency: RMB
Types Source of fund Amount incurred Undue balance Overdue uncollected
amount
Entrusted wealth
management of
banks
Raised capital 0 0 0
Entrusted wealth
management of
banks
Self-owned
capital
151,000 140,000 0
Others
"□ Applicable" "√ Not applicable"
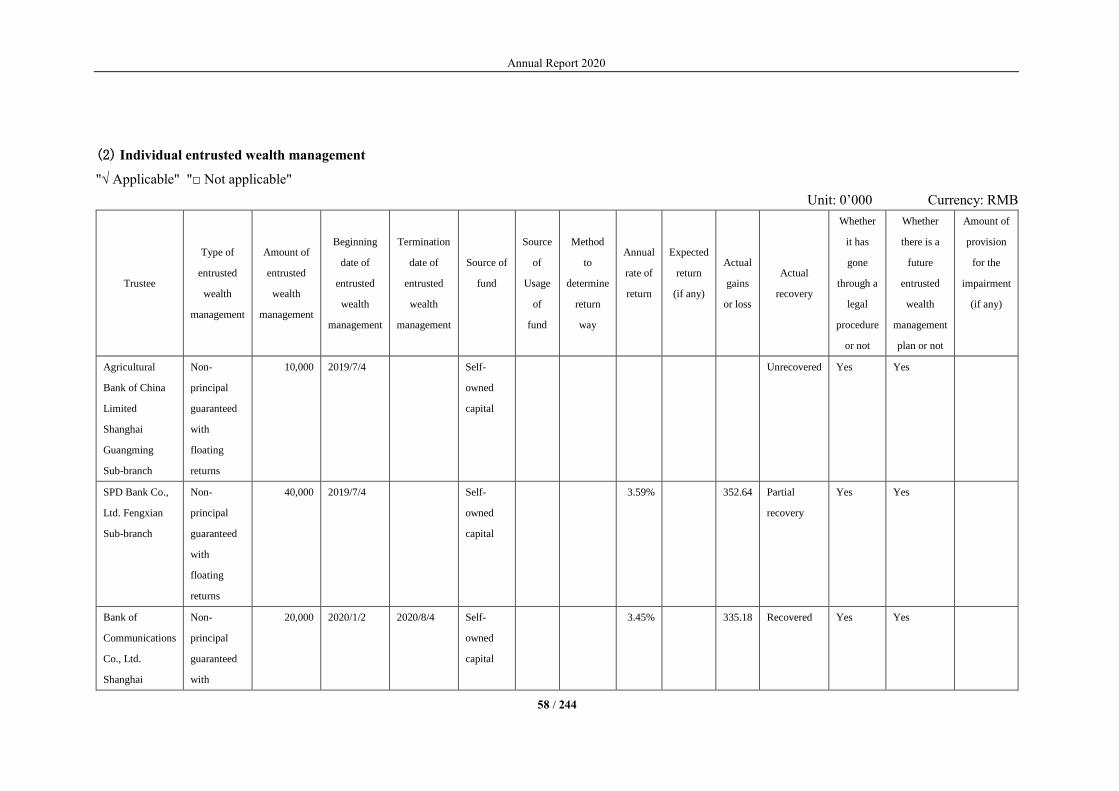
Annual Report 2020
58 / 244
(2) Individual entrusted wealth management
"√ Applicable" "□ Not applicable"
Unit: 0’000 Currency: RMB
Trustee
Type of
entrusted
wealth
management
Amount of
entrusted
wealth
management
Beginning
date of
entrusted
wealth
management
Termination
date of
entrusted
wealth
management
Source of
fund
Source
of
Usage
of
fund
Method
to
determine
return
way
Annual
rate of
return
Expected
return
(if any)
Actual
gains
or loss
Actual
recovery
Whether
it has
gone
through a
legal
procedure
or not
Whether
there is a
future
entrusted
wealth
management
plan or not
Amount of
provision
for the
impairment
(if any)
Agricultural
Bank of China
Limited
Shanghai
Guangming
Sub-branch
Non-
principal
guaranteed
with
floating
returns
10,000 2019/7/4 Self-
owned
capital
Unrecovered Yes Yes
SPD Bank Co.,
Ltd. Fengxian
Sub-branch
Non-
principal
guaranteed
with
floating
returns
40,000 2019/7/4 Self-
owned
capital
3.59% 352.64 Partial
recovery
Yes Yes
Bank of
Communications
Co., Ltd.
Shanghai
Non-
principal
guaranteed
with
20,000 2020/1/2 2020/8/4 Self-
owned
capital
3.45% 335.18 Recovered Yes Yes

Annual Report 2020
59 / 244
Fengxian Sub-
branch
floating
returns
SPD Bank Co.,
Ltd. Fengxian
Sub-branch
Non-
principal
guaranteed
with
floating
returns
40,000 2020/1/3 2020/1/19 Self-
owned
capital
2.95% 51.73 Recovered Yes Yes
SPD Bank Co.,
Ltd. Fengxian
Sub-branch
Non-
principal
guaranteed
with
floating
returns
20,000 2020/4/2 2020/7/1 Self-
owned
capital
3.90% 192.33 Recovered Yes Yes
Agricultural
Bank of China
Limited
Shanghai
Guangming
Sub-branch
Non-
principal
guaranteed
with
floating
returns
15,000 2020/4/8 2020/5/22 Self-
owned
capital
3.02% 55.91 Recovered Yes Yes
Agricultural
Bank of China
Limited
Shanghai
Guangming
Sub-branch
Non-
principal
guaranteed
with
floating
returns
15,000 2020/4/9 2020/7/13 Self-
owned
capital
3.29% 128.53 Recovered Yes Yes
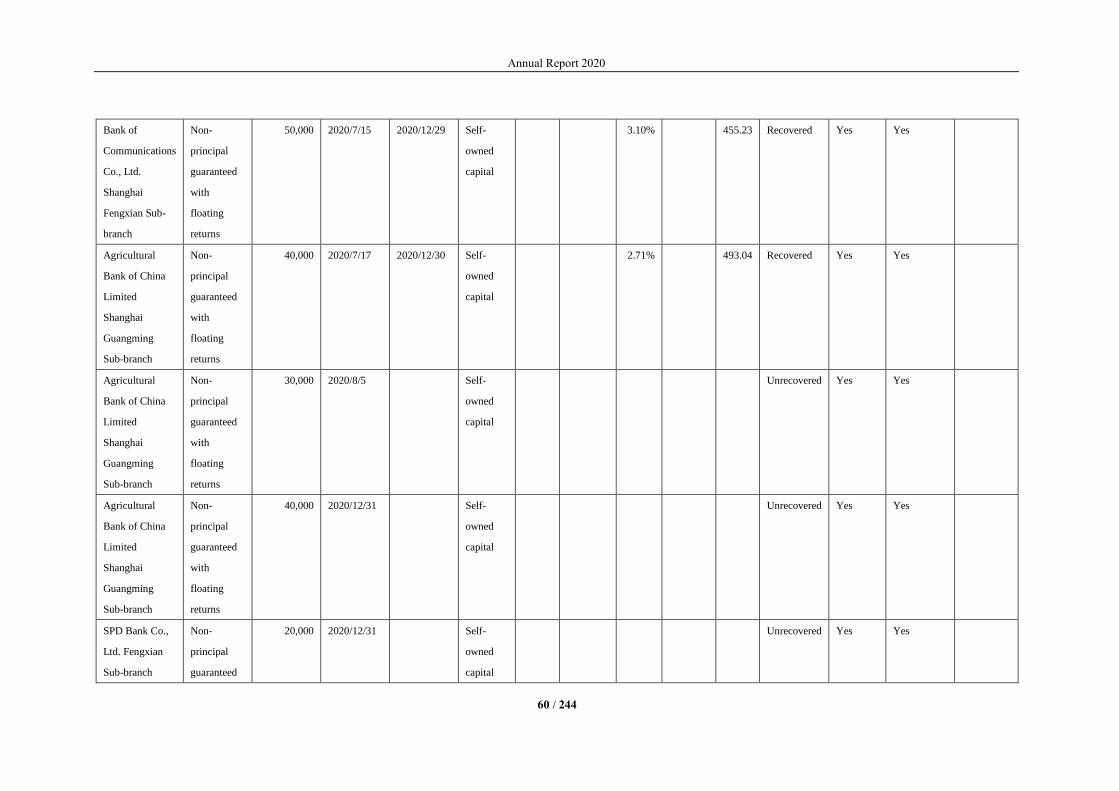
Annual Report 2020
60 / 244
Bank of
Communications
Co., Ltd.
Shanghai
Fengxian Sub-
branch
Non-
principal
guaranteed
with
floating
returns
50,000 2020/7/15 2020/12/29 Self-
owned
capital
3.10% 455.23 Recovered Yes Yes
Agricultural
Bank of China
Limited
Shanghai
Guangming
Sub-branch
Non-
principal
guaranteed
with
floating
returns
40,000 2020/7/17 2020/12/30 Self-
owned
capital
2.71% 493.04 Recovered Yes Yes
Agricultural
Bank of China
Limited
Shanghai
Guangming
Sub-branch
Non-
principal
guaranteed
with
floating
returns
30,000 2020/8/5 Self-
owned
capital
Unrecovered Yes Yes
Agricultural
Bank of China
Limited
Shanghai
Guangming
Sub-branch
Non-
principal
guaranteed
with
floating
returns
40,000 2020/12/31 Self-
owned
capital
Unrecovered Yes Yes
SPD Bank Co.,
Ltd. Fengxian
Sub-branch
Non-
principal
guaranteed
20,000 2020/12/31 Self-
owned
capital
Unrecovered Yes Yes
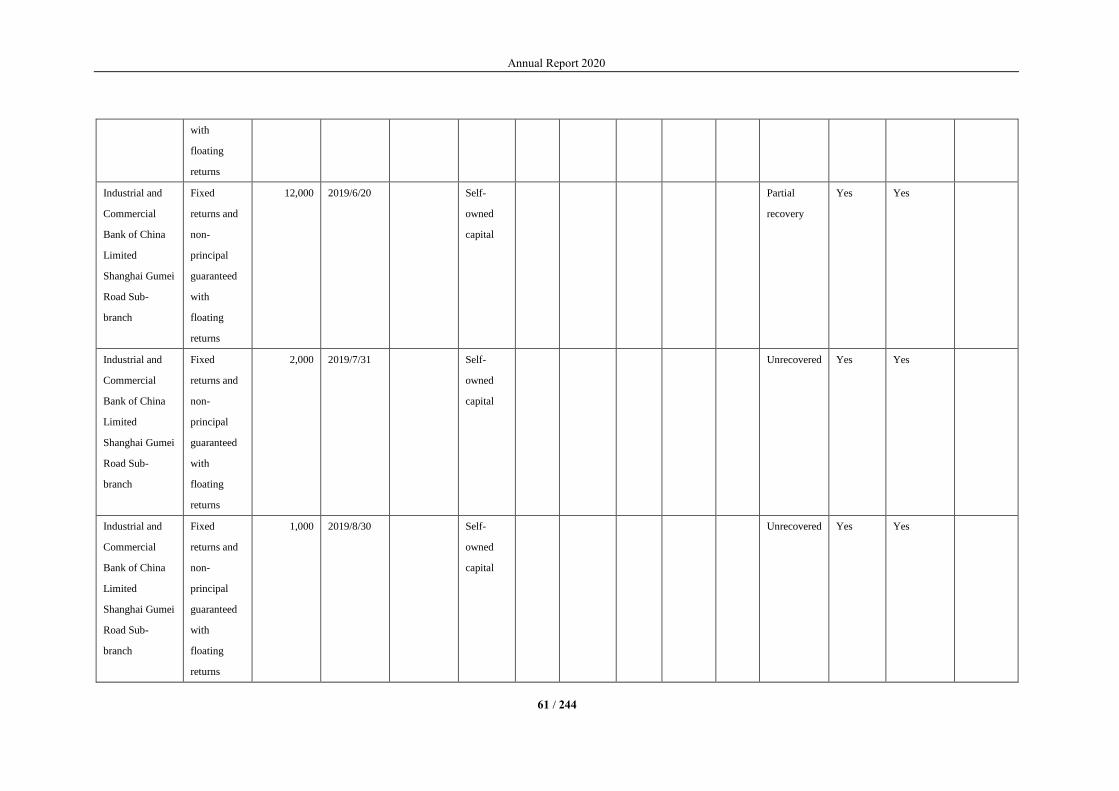
Annual Report 2020
61 / 244
with
floating
returns
Industrial and
Commercial
Bank of China
Limited
Shanghai Gumei
Road Sub-
branch
Fixed
returns and
non-
principal
guaranteed
with
floating
returns
12,000 2019/6/20 Self-
owned
capital
Partial
recovery
Yes Yes
Industrial and
Commercial
Bank of China
Limited
Shanghai Gumei
Road Sub-
branch
Fixed
returns and
non-
principal
guaranteed
with
floating
returns
2,000 2019/7/31 Self-
owned
capital
Unrecovered Yes Yes
Industrial and
Commercial
Bank of China
Limited
Shanghai Gumei
Road Sub-
branch
Fixed
returns and
non-
principal
guaranteed
with
floating
returns
1,000 2019/8/30 Self-
owned
capital
Unrecovered Yes Yes
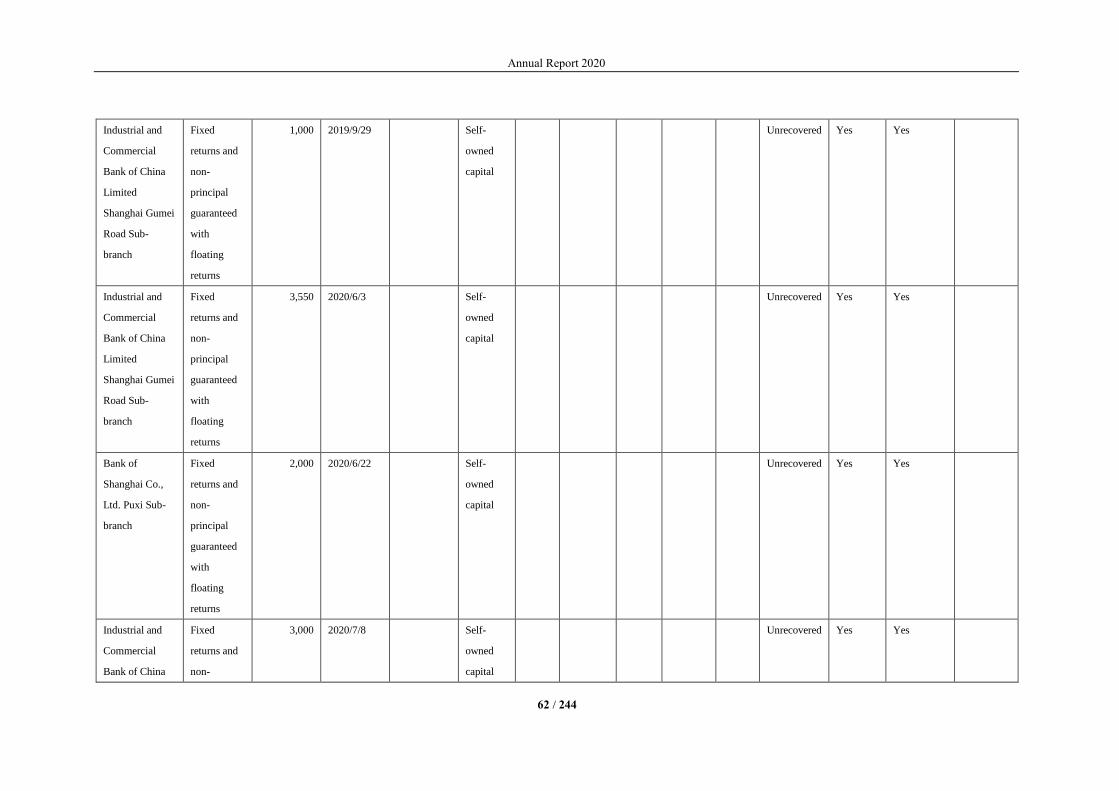
Annual Report 2020
62 / 244
Industrial and
Commercial
Bank of China
Limited
Shanghai Gumei
Road Sub-
branch
Fixed
returns and
non-
principal
guaranteed
with
floating
returns
1,000 2019/9/29 Self-
owned
capital
Unrecovered Yes Yes
Industrial and
Commercial
Bank of China
Limited
Shanghai Gumei
Road Sub-
branch
Fixed
returns and
non-
principal
guaranteed
with
floating
returns
3,550 2020/6/3 Self-
owned
capital
Unrecovered Yes Yes
Bank of
Shanghai Co.,
Ltd. Puxi Sub-
branch
Fixed
returns and
non-
principal
guaranteed
with
floating
returns
2,000 2020/6/22 Self-
owned
capital
Unrecovered Yes Yes
Industrial and
Commercial
Bank of China
Fixed
returns and
non-
3,000 2020/7/8 Self-
owned
capital
Unrecovered Yes Yes

Annual Report 2020
63 / 244
Limited
Shanghai Gumei
Road Sub-
branch
principal
guaranteed
with
floating
returns
China
Merchants Bank
Co., Ltd. Beijing
Branch
Dongsanhuan
Sub-branch
Fixed
returns and
non-
principal
guaranteed
with
floating
returns
3,550 2020/3/31 2020/6/3 Self-
owned
capital
3.36% 20.57 Recovered Yes Yes
Others
"□ Applicable" "√ Not applicable"

Annual Report 2020
64 / 244
(3) Provision for the impairment of entrusted wealth management
"□ Applicable" "√ Not applicable"
2. Entrusted loans
(1) Overall condition of entrusted loans
"□ Applicable" "√ Not applicable"
Others
"□ Applicable" "√ Not applicable"
(2) Individual entrusted loans
"□ Applicable" "√ Not applicable"
Others
"□ Applicable" "√ Not applicable"
(3) Provision for the impairment of entrusted loans
"□ Applicable" "√ Not applicable"
3. Others
"□ Applicable" "√ Not applicable"
4) Other material contracts
"□ Applicable" "√ Not applicable"
XVI. Explanation on other material matters
"□ Applicable" "√ Not applicable"
XVII. Active fulfillment of social responsibilities
1) Poverty alleviation of the listed companies
"□ Applicable" "√ Not applicable"
2) Overview of social responsibility
"√ Applicable" "□ Not applicable"
For more details, please refer to 2020 Annual Report on Social Responsibilities disclosed by the
Company on the website of the Shanghai Stock Exchange (www.sse.com.cn) on 30 March 2021.

Annual Report 2020
65 / 244
3) Environmental information
1. Explanation on environmental protection of the Company and its major subsidiaries falling
into the category of key pollutant discharging units designated by the environmental protection
authorities
"□ Applicable" "√ Not applicable"
2. Explanation on environmental protection of companies other than key pollutant discharging
units
"√ Applicable" "□ Not applicable"
The Company does not belong to the key pollutant discharging units published by national
environmental protection authorities. As the Company pays great attention to environmental protection,
the greening rate of its sites is high. During the production process, the plastic raw granular edges did not
produce solid waste or environmental pollution after going through smashing, re-granulating and recycling
process; paperboard edges for package was recycled and sold by classification to local recycle stations for
recycled paper. The Company has not admixed any harmful recycling waste in its production, so no
volatile gas that is harmful to the health of human beings was produced. Besides, domestic wastewater
was disposed in accordance with sewage treatment regulations set by the local government.
3. Explanation on reasons for not disclosing the environmental information of companies other
than key pollutant discharging units
"□ Applicable" "√ Not applicable"
4. Explanation on further progress or changes of environmental information disclosed during the
Reporting Period
"□ Applicable" "√ Not applicable"
4) Other descriptions
"□ Applicable" "√ Not applicable"
XVIII. Convertible corporate bonds
"□ Applicable" "√ Not applicable"

Annual Report 2020
66 / 244
Chapter VI Changes in Ordinary Shares and Shareholders
I. Changes in share capital of ordinary shares
1) Changes in ordinary shares
1. Changes in ordinary shares
Unit: share
Before this change Increase or decrease (+ or -) due to this change After this change
Number Percentage
(%)
Issuance of
new shares
Bonus
shares
Shares transferred
from provident
funds
Others Sub-total Number Percentage
(%)
I. Shares held subject to selling
restrictions
0 0 7,427,600 7,427,600 7,427,600 0.80
1. Shares held by the state
2. Shares held by the state-owned legal
person
3. Shares held by other domestic funds 0 0 7,427,600 7,427,600 7,427,600 0.80
Including: Shares held by domestic
non-state-owned legal person
Shares held by domestic natural
person
0 0 7,427,600 7,427,600 7,427,600 0.80
4. Shares held by foreign funds
Including: Shares held by foreign legal
person
Shares held by foreign natural
person
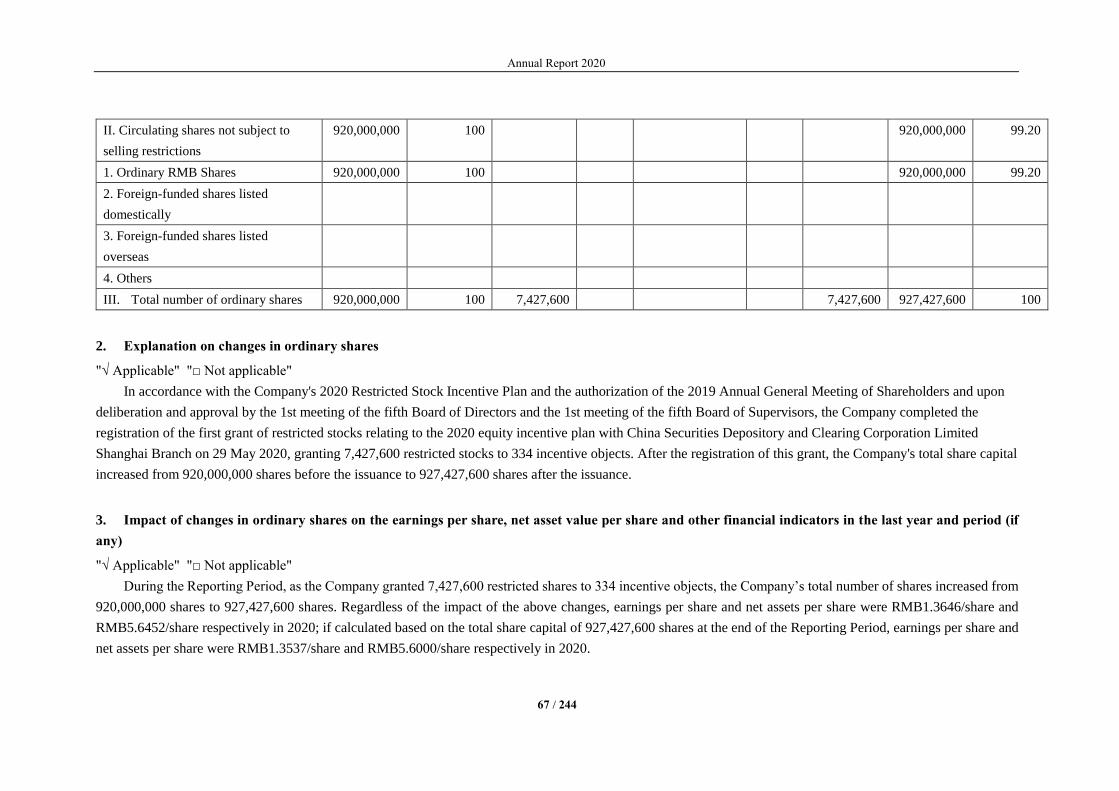
Annual Report 2020
67 / 244
II. Circulating shares not subject to
selling restrictions
920,000,000 100 920,000,000 99.20
1. Ordinary RMB Shares 920,000,000 100 920,000,000 99.20
2. Foreign-funded shares listed
domestically
3. Foreign-funded shares listed
overseas
4. Others
III. Total number of ordinary shares 920,000,000 100 7,427,600 7,427,600 927,427,600 100
2. Explanation on changes in ordinary shares
"√ Applicable" "□ Not applicable"
In accordance with the Company's 2020 Restricted Stock Incentive Plan and the authorization of the 2019 Annual General Meeting of Shareholders and upon
deliberation and approval by the 1st meeting of the fifth Board of Directors and the 1st meeting of the fifth Board of Supervisors, the Company completed the
registration of the first grant of restricted stocks relating to the 2020 equity incentive plan with China Securities Depository and Clearing Corporation Limited
Shanghai Branch on 29 May 2020, granting 7,427,600 restricted stocks to 334 incentive objects. After the registration of this grant, the Company's total share capital
increased from 920,000,000 shares before the issuance to 927,427,600 shares after the issuance.
3. Impact of changes in ordinary shares on the earnings per share, net asset value per share and other financial indicators in the last year and period (if
any)
"√ Applicable" "□ Not applicable"
During the Reporting Period, as the Company granted 7,427,600 restricted shares to 334 incentive objects, the Company’s total number of shares increased from
920,000,000 shares to 927,427,600 shares. Regardless of the impact of the above changes, earnings per share and net assets per share were RMB1.3646/share and
RMB5.6452/share respectively in 2020; if calculated based on the total share capital of 927,427,600 shares at the end of the Reporting Period, earnings per share and
net assets per share were RMB1.3537/share and RMB5.6000/share respectively in 2020.

Annual Report 2020
68 / 244
4. Other contents that the Company deems necessary and the securities regulatory authorities require disclosing
"□ Applicable" "√ Not applicable"
2) Changes in restricted shares
"√ Applicable" "□ Not applicable"
Unit: Share
Name of shareholder
Number of restricted
shares at the
beginning of the year
Number of restricted
shares unlocked
during the current
year
Number of restricted
shares increased
during the current
year
Number of restricted
shares at the end of
the year
Reason for restricted
sale
Date of unlocking
restricted sale
Incentive objects of
restricted stocks in
2020
0 0 7,427,600 7,427,600 Equity incentive
selling restrictions
Note
Total 0 0 7,427,600 7,427,600 / /
Note: The restricted stocks granted by the equity incentive plan implemented in 2020 must be unlocked in batches in accordance with the Company's 2020
Restricted Stock Incentive Plan.

Annual Report 2020
69 / 244
II. Issuance and listing of securities
1) Issuance of securities as at the Reporting Period
"□ Applicable" "√ Not applicable"
Explanation on issuance of securities as at the Reporting Period (please provide separate explanation on
the bonds with different interest rates during their duration):
"□ Applicable" "√ Not applicable"
2) Changes in the total number of ordinary shares and shareholder structure of the Company and
changes in the structure of assets and liabilities of the Company
"□ Applicable" "√ Not applicable"
3) Existing internal employee shares
"□ Applicable" "√ Not applicable"
III. Shareholder and beneficial controller
1) Total number of shareholders
Total number of shareholders of ordinary shares as at the end of the Reporting Period 18,160
Total number of shareholders of ordinary shares at the end of last month prior to the
disclosure date of this annual report
33,203
Total number of shareholders of preferred shares whose voting rights have been restored
as at the end of the Reporting Period
0
Total number of shareholders of preferred shares whose voting rights have been restored
at the end of last month prior to the disclosure date of this annual report
0

Annual Report 2020
70 / 244
2) Table of shareholdings of the top ten shareholders and the top ten shareholders of shares in circulation (or shareholders not subject to selling restrictions)
as at the end of the Reporting Period
Unit: share
Shareholdings of the top ten shareholders
Name of shareholder
(full name)
Change during
the Reporting
Period
Number of shares
held as at the end of
the period
Percentage
(%)
Number of shares
held subject to
selling restrictions
Pledged or frozen Nature of
shareholder Share
status Number
M&G Holdings (Group) Co., Ltd. 0 536,000,000 57.79 0
No
0 Domestic
nonstate-owned
legal person
Hong Kong Securities Clearing Company
Limited
-528,095 32,961,426 3.55 0 No
0 Unknown
Industrial and Commercial Bank of China
Limited-Invesco Great Wall Emerging
Mature and Hybrid Equity Investment
Funds(中国工商银行股份有限公司-景
顺长城新兴成长混合型证券投资基金)
9,500,094 21,499,948 2.32 0
No
0 Unknown
Shanghai Keying Investment Management
Office (L.P.)
-5,850,000 17,550,000 1.89 0 No
0 Others
Shanghai Jiekui Investment Management
Firm (L.P.)
-5,775,000 17,325,000 1.87 0 No
0 Others
Chen Huxiong -5,700,000 17,100,000 1.84 0 No
0 Domestic
natural person
Chen Huwen -5,700,000 17,100,000 1.84 0 No
0 Domestic
natural person

Annual Report 2020
71 / 244
Chen Xueling -3,600,000 10,800,000 1.16 0 No
0 Domestic
natural person
Bank of China Limited-Invesco Great Wall
Ding Yi Hybrid Security Investment Fund
(LOF)(中国银行股份有限公司-景顺长
城鼎益混合型证券投资基金)
-560,000 8,700,000 0.94 0
No
0 Unknown
Central Huijin Asset Management Co., Ltd. 0 8,539,200 0.92 0 No 0 Unknown
Shareholdings of the top ten shareholders of non-restricted circulating shares
Name of shareholder Number of non-restricted circulating shares held Type and number of shares
Type Number
M&G Holdings (Group) Co., Ltd. 536,000,000 Ordinary RMB Shares 536,000,000
Hong Kong Securities Clearing Company Limited 32,961,426 Ordinary RMB Shares 32,961,426
Industrial and Commercial Bank of China Limited-Invesco
Great Wall Emerging Mature and Hybrid Equity Investment
Funds(中国工商银行股份有限公司-景顺长城新兴成长
混合型证券投资基金)
21,499,948
Ordinary RMB Shares
21,499,948
Shanghai Keying Investment Management Office (L.P.) 17,550,000 Ordinary RMB Shares 17,550,000
Shanghai Jiekui Investment Management Firm (L.P.) 17,325,000 Ordinary RMB Shares 17,325,000
Chen Huxiong 17,100,000 Ordinary RMB Shares 17,100,000
Chen Huwen 17,100,000 Ordinary RMB Shares 17,100,000
Chen Xueling 10,800,000 Ordinary RMB Shares 10,800,000
Bank of China Limited-Invesco Great Wall Ding Yi Hybrid
Security Investment Fund (LOF)(中国银行股份有限公司
-景顺长城鼎益混合型证券投资基金)
8,700,000
Ordinary RMB Shares
8,700,000
Central Huijin Asset Management Co., Ltd. 8,539,200 Ordinary RMB Shares 8,539,200

Annual Report 2020
72 / 244
Explanation on the related relationship or parties acting in
concert among the above shareholders
There is related relationship among the shareholders—M&G Group, Keying Investment, Jiekui Investment,
Chen Huwen, Chen Huxiong, and Chen Xueling. Chen Huwen, Chen Huxiong, and Chen Xueling are parties
acting in concert. Save as the above, the Company is not aware of any related relationship or parties acting in
concert as set out in Measures for the Administration of the Takeover of Listed Companies among the
aforesaid shareholders.
Explanation on the preference shareholders with voting rights
restored and their shareholdings
No
Shareholdings of the top ten shareholders subject to trading moratorium and the condition of trading moratorium
"√ Applicable" "□ Not applicable"
Unit: share
Number Name of shareholder subject to selling
restrictions
Number of shares held
subject to selling
restrictions
Available-for-listing-and-trading conditions of shares
held subject to selling restrictions Selling restrictions
Available-for-listing-
and-trading time
Number of new available-for-
listing-and-trading shares
1 Incentive objects of restricted stocks in 2020 7,427,600 Equity incentive
selling restrictions
Explanation on the related relationship or parties acting in
concert among the above shareholders
Not applicable
Note: The restricted stocks granted by the equity incentive plan implemented in 2020 must be unlocked in batches in accordance with the Company's 2020
Restricted Stock Incentive Plan.

Annual Report 2020
73 / 244
3) Strategic investors or general legal persons becoming the top ten shareholders because of
placing of new shares
"□ Applicable" "√ Not applicable"
IV. Controlling shareholder and beneficial controllers
1) Controlling shareholder
1 Legal person
"√ Applicable" "□ Not applicable"
Name M&G Holdings (Group) Co., Ltd.
Person in charge of the Company or
legal representative
Chen Huxiong
Establishment date 2007-05-10
Main operation businesses Industrial investment, infrastructure investment, consultation
for investment information (excluding broker), consultation
for enterprise
management and relevant businesses, domestic trade
(excluding projects with national special approval)
(For the above items subject to licensing or permit, relevant
approval must be obtained prior to operation)
Equity interests of other domestic and
overseas listed companies controlled or
invested during the Reporting Period
No
Other explanations No
2 Natural person
"□ Applicable" "√ Not applicable"
3 Special explanation on the Company not having controlling shareholders
"□ Applicable" "√ Not applicable"
4 Index and date of changes in controlling shareholders during the Reporting Period
"□ Applicable" "√ Not applicable"
5 Diagram of the ownership and controlling relationship between the Company and its
controlling shareholders
"√ Applicable" "□ Not applicable"

Annual Report 2020
74 / 244
2) Beneficial controllers
1 Legal person
"□ Applicable" "√ Not applicable"
2 Natural person
"√ Applicable" "□ Not applicable"
Name Chen Huwen
Nationality China
Acquire right of residence in other countries or regions or not No
Main job and title Chairman of the Board of Shanghai
M&G Stationery Inc.
Shareholdings in other domestic or overseas listed companies
over the past 10 years
No
Name Chen Huxiong
Nationality China
Acquire right of residence in other countries or regions or not Yes
Main job and title Vice-chairman of the Board and CEO of
Shanghai M&G Stationery Inc.
Shareholdings in other domestic or overseas listed companies
over the past 10 years
No
Name Chen Xueling
Nationality China
Acquire right of residence in other countries or regions or not No
Main job and title Chairman of the Board and vice
president of Shanghai M&G Stationery
Inc.
Shareholdings in other domestic or overseas listed companies
over the past 10 years
No
3 Special explanation on the Company not having beneficial controllers
"□ Applicable" "√ Not applicable"

Annual Report 2020
75 / 244
4 Index and date of changes in beneficial controllers during the Reporting Period
"□ Applicable" "√ Not applicable"
5 Diagram of the ownership and controlling relationship between the Company and its beneficial
controllers
"√ Applicable" "□ Not applicable"
6 Control of the Company by beneficial controllers by way of trust or other means of asset
management
"□ Applicable" "√ Not applicable"
3) Other explanation regarding the controlling shareholders and the beneficial controllers
"□ Applicable" "√ Not applicable"
V. Other legal person shareholders with more than 10% shareholdings
"□ Applicable" "√ Not applicable"
VI. Explanation on limitation on reduction of shareholding
"□ Applicable" "√ Not applicable"
Annual Report 2020
76 / 244
Chapter VII Preference Shares
"□ Applicable" "√ Not applicable"
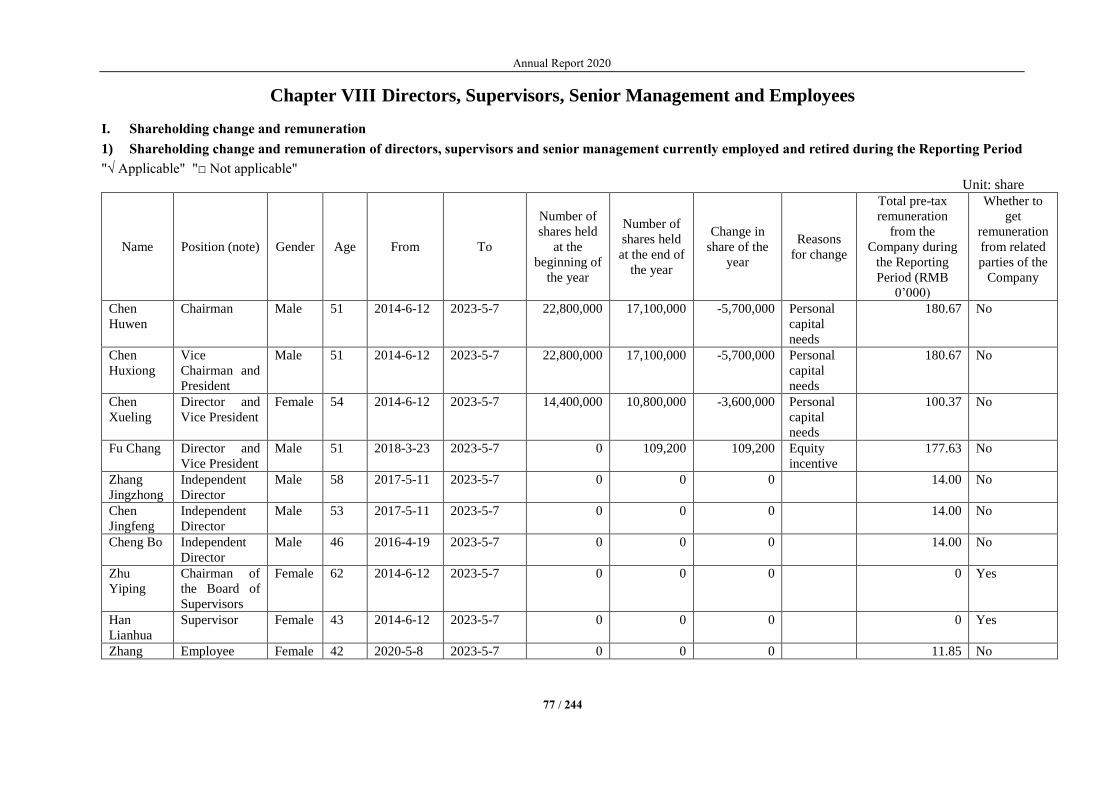
Annual Report 2020
77 / 244
Chapter VIII Directors, Supervisors, Senior Management and Employees
I. Shareholding change and remuneration
1) Shareholding change and remuneration of directors, supervisors and senior management currently employed and retired during the Reporting Period
"√ Applicable" "□ Not applicable"
Unit: share
Name Position (note) Gender Age From To
Number of
shares held
at the
beginning of
the year
Number of
shares held
at the end of
the year
Change in
share of the
year
Reasons
for change
Total pre-tax
remuneration
from the
Company during
the Reporting
Period (RMB
0’000)
Whether to
get
remuneration
from related
parties of the
Company
Chen
Huwen
Chairman Male 51 2014-6-12 2023-5-7 22,800,000 17,100,000 -5,700,000 Personal
capital
needs
180.67 No
Chen
Huxiong
Vice
Chairman and
President
Male 51 2014-6-12 2023-5-7 22,800,000 17,100,000 -5,700,000 Personal
capital
needs
180.67 No
Chen
Xueling
Director and
Vice President
Female 54 2014-6-12 2023-5-7 14,400,000 10,800,000 -3,600,000 Personal
capital
needs
100.37 No
Fu Chang Director and
Vice President
Male 51 2018-3-23 2023-5-7 0 109,200 109,200 Equity
incentive
177.63 No
Zhang
Jingzhong
Independent
Director
Male 58 2017-5-11 2023-5-7 0 0 0 14.00 No
Chen
Jingfeng
Independent
Director
Male 53 2017-5-11 2023-5-7 0 0 0 14.00 No
Cheng Bo Independent
Director
Male 46 2016-4-19 2023-5-7 0 0 0 14.00 No
Zhu
Yiping
Chairman of
the Board of
Supervisors
Female 62 2014-6-12 2023-5-7 0 0 0 0 Yes
Han
Lianhua
Supervisor Female 43 2014-6-12 2023-5-7 0 0 0 0 Yes
Zhang Employee Female 42 2020-5-8 2023-5-7 0 0 0 11.85 No
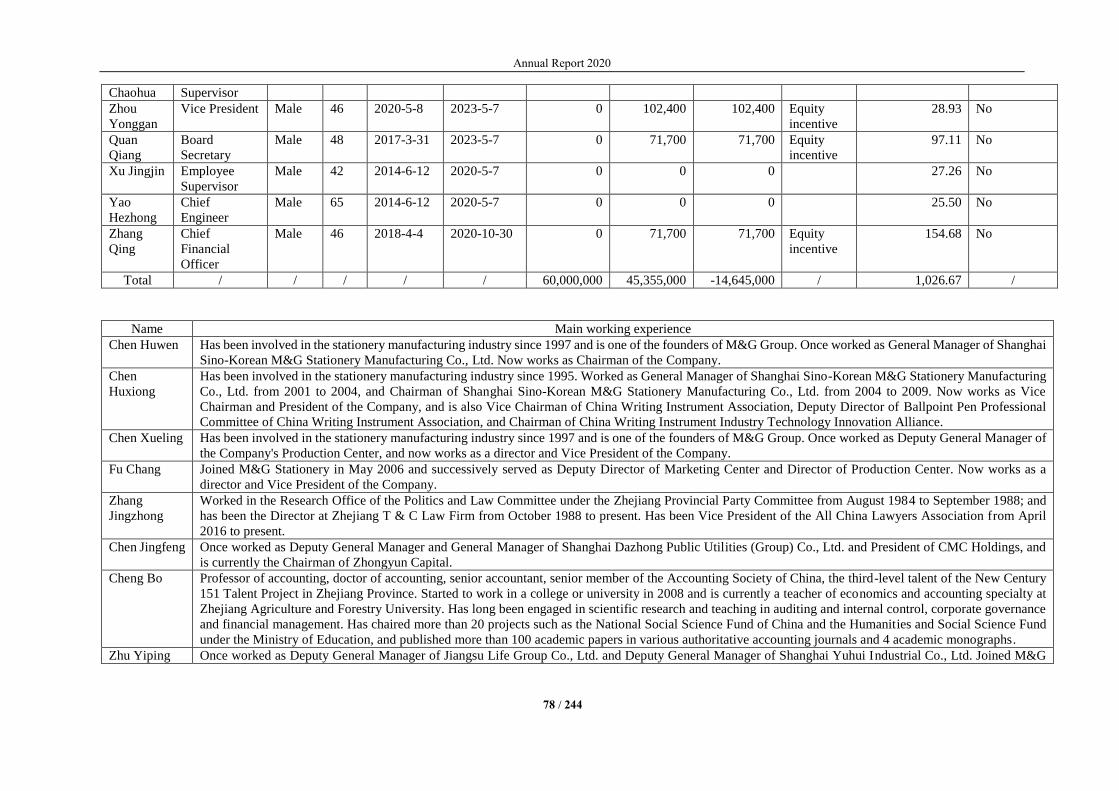
Annual Report 2020
78 / 244
Chaohua Supervisor
Zhou
Yonggan
Vice President Male 46 2020-5-8 2023-5-7 0 102,400 102,400 Equity
incentive
28.93 No
Quan
Qiang
Board
Secretary
Male 48 2017-3-31 2023-5-7 0 71,700 71,700 Equity
incentive
97.11 No
Xu Jingjin Employee
Supervisor
Male 42 2014-6-12 2020-5-7 0 0 0 27.26 No
Yao
Hezhong
Chief
Engineer
Male 65 2014-6-12 2020-5-7 0 0 0 25.50 No
Zhang
Qing
Chief
Financial
Officer
Male 46 2018-4-4 2020-10-30 0 71,700 71,700 Equity
incentive
154.68 No
Total / / / / / 60,000,000 45,355,000 -14,645,000 / 1,026.67 /
Name Main working experience
Chen Huwen Has been involved in the stationery manufacturing industry since 1997 and is one of the founders of M&G Group. Once worked as General Manager of Shanghai
Sino-Korean M&G Stationery Manufacturing Co., Ltd. Now works as Chairman of the Company.
Chen
Huxiong
Has been involved in the stationery manufacturing industry since 1995. Worked as General Manager of Shanghai Sino-Korean M&G Stationery Manufacturing
Co., Ltd. from 2001 to 2004, and Chairman of Shanghai Sino-Korean M&G Stationery Manufacturing Co., Ltd. from 2004 to 2009. Now works as Vice
Chairman and President of the Company, and is also Vice Chairman of China Writing Instrument Association, Deputy Director of Ballpoint Pen Professional
Committee of China Writing Instrument Association, and Chairman of China Writing Instrument Industry Technology Innovation Alliance.
Chen Xueling Has been involved in the stationery manufacturing industry since 1997 and is one of the founders of M&G Group. Once worked as Deputy General Manager of
the Company's Production Center, and now works as a director and Vice President of the Company.
Fu Chang Joined M&G Stationery in May 2006 and successively served as Deputy Director of Marketing Center and Director of Production Center. Now works as a
director and Vice President of the Company.
Zhang
Jingzhong
Worked in the Research Office of the Politics and Law Committee under the Zhejiang Provincial Party Committee from August 1984 to September 1988; and
has been the Director at Zhejiang T & C Law Firm from October 1988 to present. Has been Vice President of the All China Lawyers Association from April
2016 to present.
Chen Jingfeng Once worked as Deputy General Manager and General Manager of Shanghai Dazhong Public Utilities (Group) Co., Ltd. and President of CMC Holdings, and
is currently the Chairman of Zhongyun Capital.
Cheng Bo Professor of accounting, doctor of accounting, senior accountant, senior member of the Accounting Society of China, the third-level talent of the New Century
151 Talent Project in Zhejiang Province. Started to work in a college or university in 2008 and is currently a teacher of economics and accounting specialty at
Zhejiang Agriculture and Forestry University. Has long been engaged in scientific research and teaching in auditing and internal control, corporate governance
and financial management. Has chaired more than 20 projects such as the National Social Science Fund of China and the Humanities and Social Science Fund
under the Ministry of Education, and published more than 100 academic papers in various authoritative accounting journals and 4 academic monographs.
Zhu Yiping Once worked as Deputy General Manager of Jiangsu Life Group Co., Ltd. and Deputy General Manager of Shanghai Yuhui Industrial Co., Ltd. Joined M&G
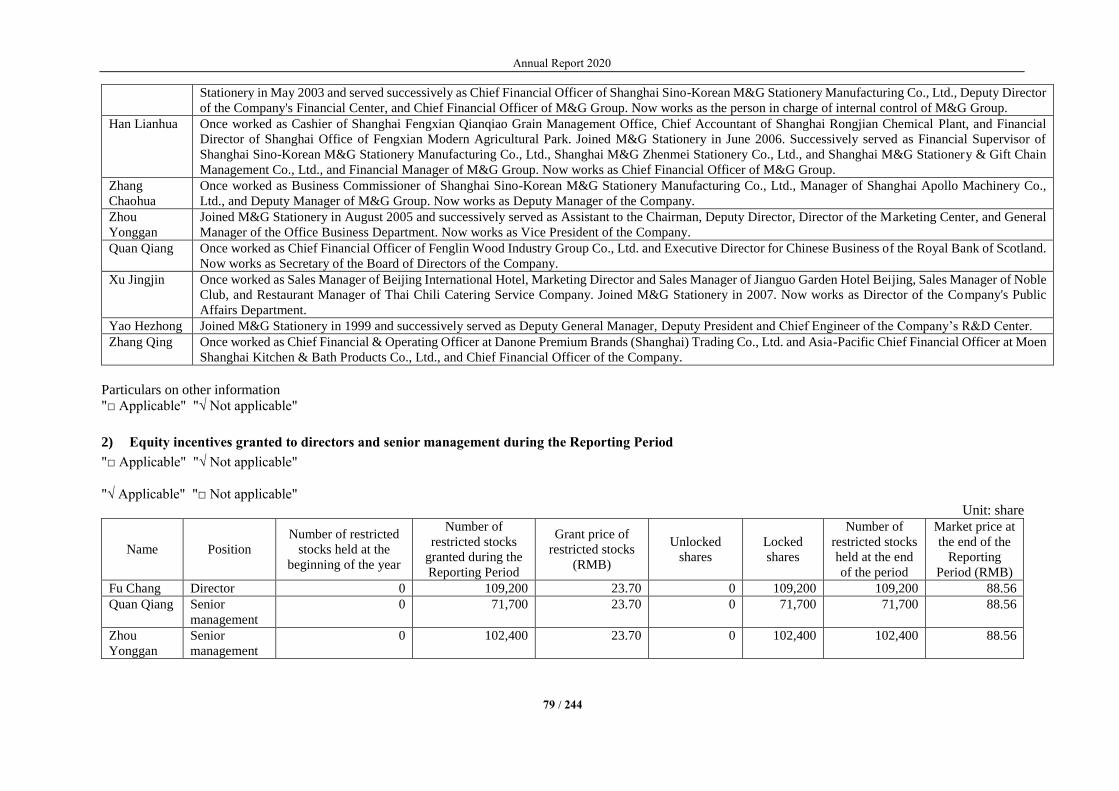
Annual Report 2020
79 / 244
Stationery in May 2003 and served successively as Chief Financial Officer of Shanghai Sino-Korean M&G Stationery Manufacturing Co., Ltd., Deputy Director
of the Company's Financial Center, and Chief Financial Officer of M&G Group. Now works as the person in charge of internal control of M&G Group.
Han Lianhua Once worked as Cashier of Shanghai Fengxian Qianqiao Grain Management Office, Chief Accountant of Shanghai Rongjian Chemical Plant, and Financial
Director of Shanghai Office of Fengxian Modern Agricultural Park. Joined M&G Stationery in June 2006. Successively served as Financial Supervisor of
Shanghai Sino-Korean M&G Stationery Manufacturing Co., Ltd., Shanghai M&G Zhenmei Stationery Co., Ltd., and Shanghai M&G Stationery & Gift Chain
Management Co., Ltd., and Financial Manager of M&G Group. Now works as Chief Financial Officer of M&G Group.
Zhang
Chaohua
Once worked as Business Commissioner of Shanghai Sino-Korean M&G Stationery Manufacturing Co., Ltd., Manager of Shanghai Apollo Machinery Co.,
Ltd., and Deputy Manager of M&G Group. Now works as Deputy Manager of the Company.
Zhou
Yonggan
Joined M&G Stationery in August 2005 and successively served as Assistant to the Chairman, Deputy Director, Director of the Marketing Center, and General
Manager of the Office Business Department. Now works as Vice President of the Company.
Quan Qiang Once worked as Chief Financial Officer of Fenglin Wood Industry Group Co., Ltd. and Executive Director for Chinese Business of the Royal Bank of Scotland.
Now works as Secretary of the Board of Directors of the Company.
Xu Jingjin Once worked as Sales Manager of Beijing International Hotel, Marketing Director and Sales Manager of Jianguo Garden Hotel Beijing, Sales Manager of Noble
Club, and Restaurant Manager of Thai Chili Catering Service Company. Joined M&G Stationery in 2007. Now works as Director of the Company's Public
Affairs Department.
Yao Hezhong Joined M&G Stationery in 1999 and successively served as Deputy General Manager, Deputy President and Chief Engineer of the Company’s R&D Center.
Zhang Qing Once worked as Chief Financial & Operating Officer at Danone Premium Brands (Shanghai) Trading Co., Ltd. and Asia-Pacific Chief Financial Officer at Moen
Shanghai Kitchen & Bath Products Co., Ltd., and Chief Financial Officer of the Company.
Particulars on other information
"□ Applicable" "√ Not applicable"
2) Equity incentives granted to directors and senior management during the Reporting Period
"□ Applicable" "√ Not applicable"
"√ Applicable" "□ Not applicable"
Unit: share
Name Position
Number of restricted
stocks held at the
beginning of the year
Number of
restricted stocks
granted during the
Reporting Period
Grant price of
restricted stocks
(RMB)
Unlocked
shares
Locked
shares
Number of
restricted stocks
held at the end
of the period
Market price at
the end of the
Reporting
Period (RMB)
Fu Chang Director 0 109,200 23.70 0 109,200 109,200 88.56
Quan Qiang Senior
management
0 71,700 23.70 0 71,700 71,700 88.56
Zhou
Yonggan
Senior
management
0 102,400 23.70 0 102,400 102,400 88.56

Annual Report 2020
80 / 244
Zhang Qing Senior
management
0 71,700 23.70 0 71,700 71,700 88.56
Total / 0 355,000 / 0 355,000 355,000 /
II. Employment of directors, supervisors and senior management currently employed and retired during the Reporting Period
1) Employment in shareholders’ companies
"√ Applicable" "□ Not applicable"
Name of person employed Name of shareholder’s company Position held in shareholder’s
company From To
Chen Huwen M&G Group President 2007-05-10
Chen Huwen Keying Investment General Partner 2011-02-18
Chen Huxiong M&G Group Chairman 2007-05-10
Chen Huxiong Jiekui Investment General Partner 2011-02-18
Chen Xueling M&G Group Director 2007-05-10
Zhu Yiping M&G Group Person in charge of internal
control
2020-01-01
Han Lianhua M&G Group Chief Financial Officer 2020-01-01
Particulars on employment in
shareholders’ companies
Save for the personnel disclosed above, none of other directors, supervisors and senior management of the Company were
employed by the shareholders’ companies.
2) Employment in other companies
"√ Applicable" "□ Not applicable"
Name of person employed Name of other companies Position held in other companies From To
Chen Huwen Chenguang Venture Capital Center(晨光创投) General Partner 12 May 2011
Chen Huwen Chenguang Sanmei(晨光三美) General Manager 26 May 2008
Chen Huxiong Chenguang Venture Capital Center(晨光创投) Limited Partner 12 May 2011
Chen Huxiong Chenguang Sanmei(晨光三美) Chairman 26 May 2008
Chen Xueling Chenguang Venture Capital Center(晨光创投) Limited Partner 12 May 2011
Chen Xueling Chenguang Sanmei(晨光三美) Director 26 May 2008
Zhang Jingzhong Zhejiang T & C Law Firm Director October 1988
Zhang Jingzhong Kweichow Moutai Co., Ltd. Independent Director August 2016
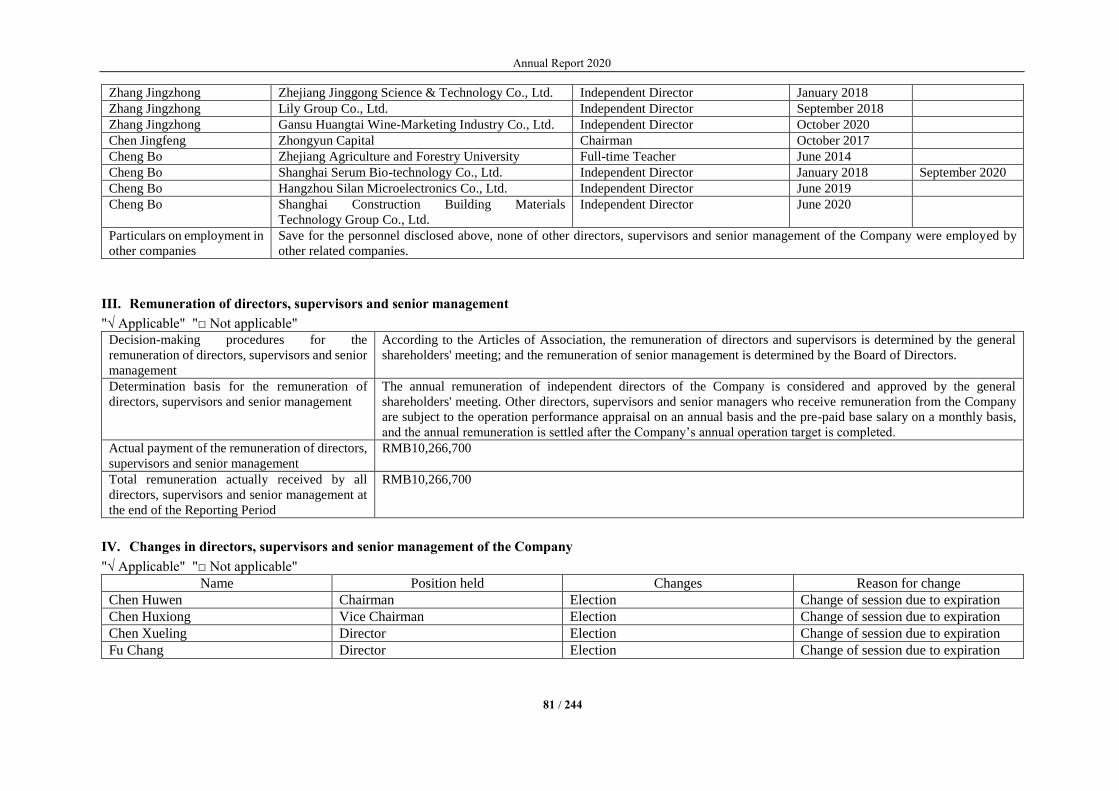
Annual Report 2020
81 / 244
Zhang Jingzhong Zhejiang Jinggong Science & Technology Co., Ltd. Independent Director January 2018
Zhang Jingzhong Lily Group Co., Ltd. Independent Director September 2018
Zhang Jingzhong Gansu Huangtai Wine-Marketing Industry Co., Ltd. Independent Director October 2020
Chen Jingfeng Zhongyun Capital Chairman October 2017
Cheng Bo Zhejiang Agriculture and Forestry University Full-time Teacher June 2014
Cheng Bo Shanghai Serum Bio-technology Co., Ltd. Independent Director January 2018 September 2020
Cheng Bo Hangzhou Silan Microelectronics Co., Ltd. Independent Director June 2019
Cheng Bo Shanghai Construction Building Materials
Technology Group Co., Ltd.
Independent Director June 2020
Particulars on employment in
other companies
Save for the personnel disclosed above, none of other directors, supervisors and senior management of the Company were employed by
other related companies.
III. Remuneration of directors, supervisors and senior management
"√ Applicable" "□ Not applicable"
Decision-making procedures for the
remuneration of directors, supervisors and senior
management
According to the Articles of Association, the remuneration of directors and supervisors is determined by the general
shareholders' meeting; and the remuneration of senior management is determined by the Board of Directors.
Determination basis for the remuneration of
directors, supervisors and senior management
The annual remuneration of independent directors of the Company is considered and approved by the general
shareholders' meeting. Other directors, supervisors and senior managers who receive remuneration from the Company
are subject to the operation performance appraisal on an annual basis and the pre-paid base salary on a monthly basis,
and the annual remuneration is settled after the Company’s annual operation target is completed.
Actual payment of the remuneration of directors,
supervisors and senior management
RMB10,266,700
Total remuneration actually received by all
directors, supervisors and senior management at
the end of the Reporting Period
RMB10,266,700
IV. Changes in directors, supervisors and senior management of the Company
"√ Applicable" "□ Not applicable"
Name Position held Changes Reason for change
Chen Huwen Chairman Election Change of session due to expiration
Chen Huxiong Vice Chairman Election Change of session due to expiration
Chen Xueling Director Election Change of session due to expiration
Fu Chang Director Election Change of session due to expiration

Annual Report 2020
82 / 244
Zhang Jingzhong Independent Director Election Change of session due to expiration
Chen Jingfeng Independent Director Election Change of session due to expiration
Cheng Bo Independent Director Election Change of session due to expiration
Zhu Yiping Chairman of the Board of Supervisors Election Change of session due to expiration
Han Lianhua Supervisor Election Change of session due to expiration
Zhang Chaohua Employee Supervisor Election Change of session due to expiration
Chen Huxiong President Employment Change of session due to expiration
Chen Xueling Vice President Employment Change of session due to expiration
Fu Chang Vice President Employment Change of session due to expiration
Zhou Yonggan Vice President Employment Change of session due to expiration
Quan Qiang Board Secretary Employment Change of session due to expiration
Xu Jingjin Employee Supervisor Retired Expiration of term of office
Yao Hezhong Chief Engineer Retired Expiration of term of office
Zhang Qing Chief Financial Officer Retired Resigned for personal reasons
V. Particulars on punishments by securities regulatory authorities in the past three years
"□ Applicable" "√ Not applicable"
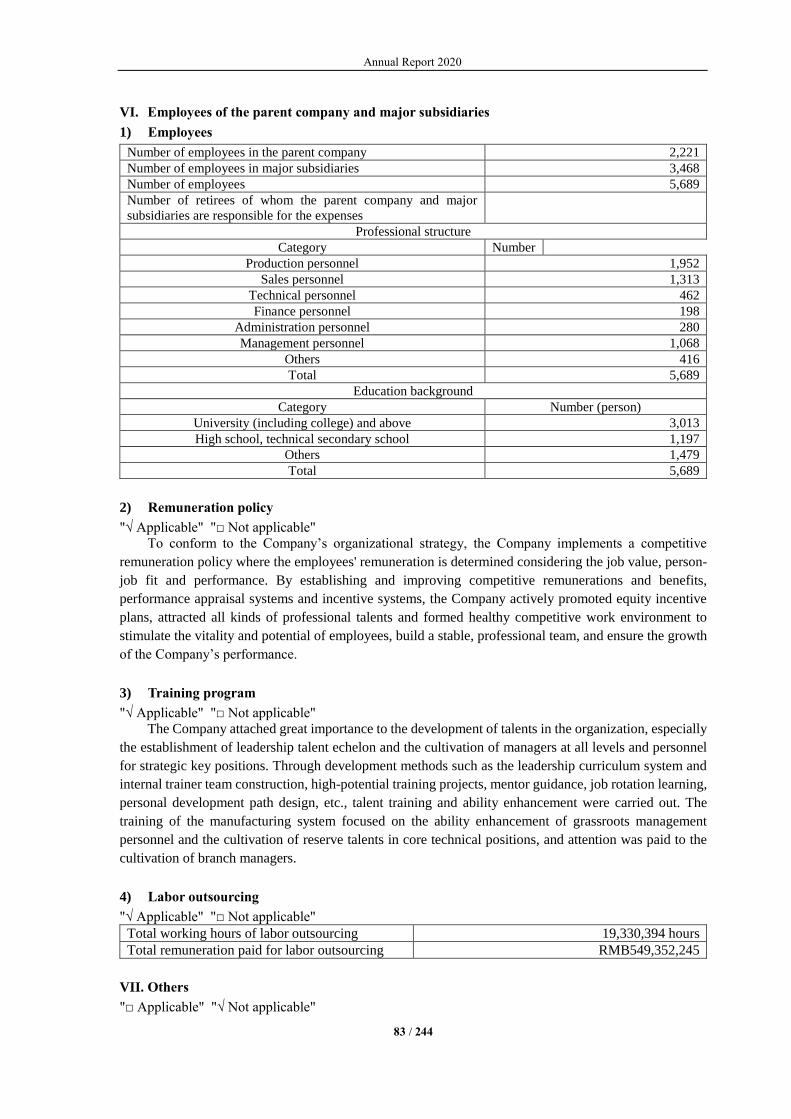
Annual Report 2020
83 / 244
VI. Employees of the parent company and major subsidiaries
1) Employees
Number of employees in the parent company 2,221
Number of employees in major subsidiaries 3,468
Number of employees 5,689
Number of retirees of whom the parent company and major
subsidiaries are responsible for the expenses
Professional structure
Category Number
Production personnel 1,952
Sales personnel 1,313
Technical personnel 462
Finance personnel 198
Administration personnel 280
Management personnel 1,068
Others 416
Total 5,689
Education background
Category Number (person)
University (including college) and above 3,013
High school, technical secondary school 1,197
Others 1,479
Total 5,689
2) Remuneration policy
"√ Applicable" "□ Not applicable"
To conform to the Company’s organizational strategy, the Company implements a competitive
remuneration policy where the employees' remuneration is determined considering the job value, person-
job fit and performance. By establishing and improving competitive remunerations and benefits,
performance appraisal systems and incentive systems, the Company actively promoted equity incentive
plans, attracted all kinds of professional talents and formed healthy competitive work environment to
stimulate the vitality and potential of employees, build a stable, professional team, and ensure the growth
of the Company’s performance.
3) Training program
"√ Applicable" "□ Not applicable"
The Company attached great importance to the development of talents in the organization, especially
the establishment of leadership talent echelon and the cultivation of managers at all levels and personnel
for strategic key positions. Through development methods such as the leadership curriculum system and
internal trainer team construction, high-potential training projects, mentor guidance, job rotation learning,
personal development path design, etc., talent training and ability enhancement were carried out. The
training of the manufacturing system focused on the ability enhancement of grassroots management
personnel and the cultivation of reserve talents in core technical positions, and attention was paid to the
cultivation of branch managers.
4) Labor outsourcing
"√ Applicable" "□ Not applicable"
Total working hours of labor outsourcing 19,330,394 hours
Total remuneration paid for labor outsourcing RMB549,352,245
VII. Others
"□ Applicable" "√ Not applicable"

Annual Report 2020
84 / 244
Chapter IX Corporate Governance
I. Particulars on corporate governance
"√ Applicable" "□ Not applicable"
During the Reporting Period, the Company, in strict compliance with the Company Law, the
Securities Law, the Code of Corporate Governance for Listed Companies, and other relevant laws and
regulations promulgated by the China Securities Regulatory Commission and the Shanghai Stock
Exchange, continuously optimized the corporate governance structure of the Company and improved the
operational level of the Company, strengthened the management of insider information, and enhanced the
awareness of information disclosure responsibility, to ensure continuous and stable development and
effectively protect the legitimate rights and interests of investors and relevant stakeholders. The specific
governance situation was as follows:
1. Shareholders and general shareholders’ meetings: the Company could hold general shareholders’
meetings in accordance with the requirements of the Company Law, the Articles of Association, and the
Rules of Procedure of the General Shareholders’ Meeting. Proposals, procedures, and voting at the general
shareholders’ meetings were strictly implemented in accordance with the relevant provisions. When
considering proposals related to related-party transactions, related shareholders avoided voting to ensure
fair and reasonable related-party transactions. For the convenience of the Company's shareholders, general
shareholders’ meetings allow its shareholders to vote on site or online. This ensures the minority
shareholders have the right to stay informed about and vote on major issues of the Company and participate
in the operation of the Company and this also helps protect the interests of minority shareholders.
Resolutions adopted at general shareholders’ meetings met the requirements of laws and regulations, and
complied with the lawful rights and interests of all shareholders, especially minority shareholders.
2. Directors and the Board of Directors: All directors of the Company could, in accordance with the
Rules of Procedure of the Board of Directors and other systems, earnestly perform their duties as directors
and make prudent and scientific decisions. The convening of each meeting met the requirements of
relevant regulations. During the Reporting Period, the Company completed the election of the new session
of Board of Directors. The Company's Board of Directors had four special committees, namely, the Audit
Committee, the Strategy Committee, the Nomination Committee, and the Remuneration and Appraisal
Committee. The special committees performed their duties with due diligence and conscientiousness in
accordance with their respective working rules to promote the scientific decision-making and standardized
operation of the Board of Directors.
3. Supervisors and the Board of Supervisors: The Board of Supervisors of the Company was
responsible for the Company and its shareholders, strictly implemented the relevant provisions of the
Company Law, the Articles of Association and the Rules of Procedure of the Board of Supervisors,
earnestly fulfilled its duties, attended the general meeting of shareholders and the meetings of the Board
of Directors, convened the meetings of the Board of Supervisors, and exercised supervisory functions and
powers in accordance with the law, supervising corporate governance, major issues, financial conditions,
and the compliance with rights and regulations of the Company's directors, managers and other senior
management in performing their duties, and promoting the legal and standardized operations of the
Company. During the Reporting Period, the Company completed the election of the new session of Board
of Supervisors.
4. Controlling shareholder and listed company: the Company and its controlling shareholders were
independent of each other in personnel, assets, finance, organization and operating business. The
Company's Board of Directors, Board of Supervisors and internal institutions could operate independently.
The Company's major decisions were made by the general shareholders' meeting in accordance with the
law. The controlling shareholders exercised the rights of shareholders in accordance with the law, and had
no behaviors that directly or indirectly interfered with the Company's decisions and business activities by
circumventing the Company's general shareholders' meeting.
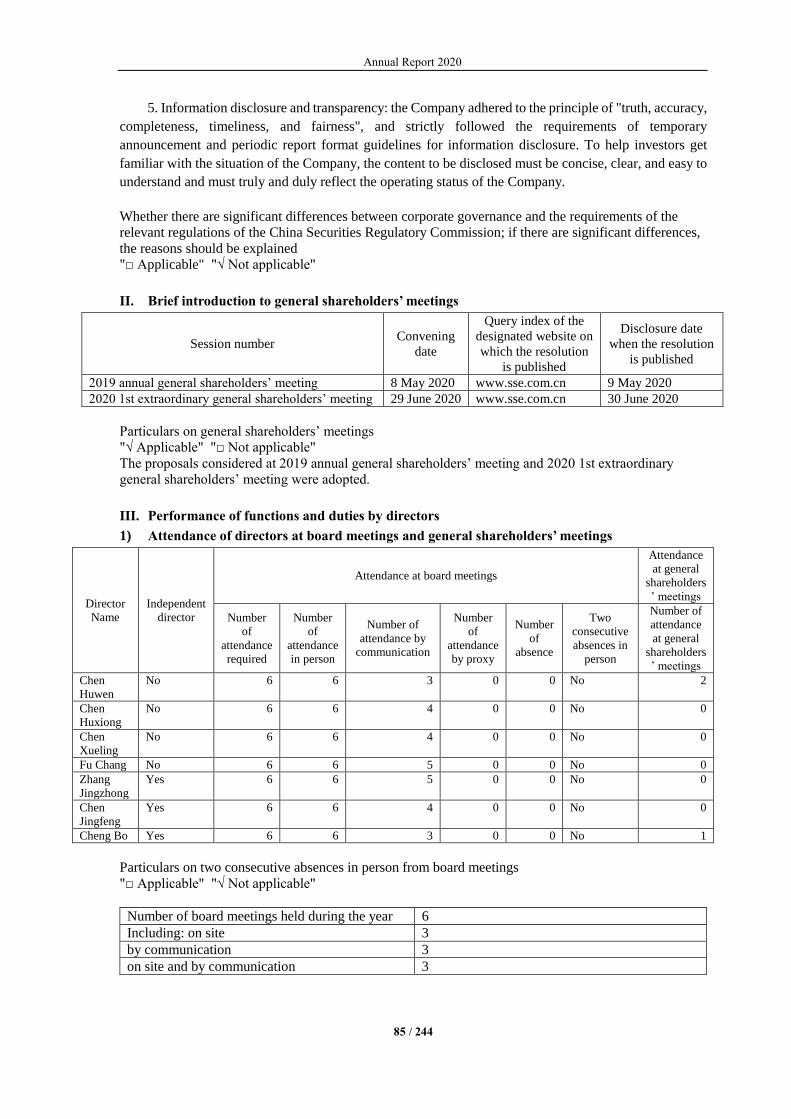
Annual Report 2020
85 / 244
5. Information disclosure and transparency: the Company adhered to the principle of "truth, accuracy,
completeness, timeliness, and fairness", and strictly followed the requirements of temporary
announcement and periodic report format guidelines for information disclosure. To help investors get
familiar with the situation of the Company, the content to be disclosed must be concise, clear, and easy to
understand and must truly and duly reflect the operating status of the Company.
Whether there are significant differences between corporate governance and the requirements of the
relevant regulations of the China Securities Regulatory Commission; if there are significant differences,
the reasons should be explained
"□ Applicable" "√ Not applicable"
II. Brief introduction to general shareholders’ meetings
Session number Convening
date
Query index of the
designated website on
which the resolution
is published
Disclosure date
when the resolution
is published
2019 annual general shareholders’ meeting 8 May 2020 www.sse.com.cn 9 May 2020
2020 1st extraordinary general shareholders’ meeting 29 June 2020 www.sse.com.cn 30 June 2020
Particulars on general shareholders’ meetings
"√ Applicable" "□ Not applicable"
The proposals considered at 2019 annual general shareholders’ meeting and 2020 1st extraordinary
general shareholders’ meeting were adopted.
III. Performance of functions and duties by directors
1) Attendance of directors at board meetings and general shareholders’ meetings
Director
Name
Independent
director
Attendance at board meetings
Attendance
at general
shareholders
’ meetings
Number
of
attendance
required
Number
of
attendance
in person
Number of
attendance by
communication
Number
of
attendance
by proxy
Number
of
absence
Two
consecutive
absences in
person
Number of
attendance
at general
shareholders
’ meetings
Chen
Huwen
No 6 6 3 0 0 No 2
Chen
Huxiong
No 6 6 4 0 0 No 0
Chen
Xueling
No 6 6 4 0 0 No 0
Fu Chang No 6 6 5 0 0 No 0
Zhang
Jingzhong
Yes 6 6 5 0 0 No 0
Chen
Jingfeng
Yes 6 6 4 0 0 No 0
Cheng Bo Yes 6 6 3 0 0 No 1
Particulars on two consecutive absences in person from board meetings
"□ Applicable" "√ Not applicable"
Number of board meetings held during the year 6
Including: on site 3
by communication 3
on site and by communication 3

Annual Report 2020
86 / 244
2) Independent directors' objections to the Company's related matters
"□ Applicable" "√ Not applicable"
3) Others
"□ Applicable" "√ Not applicable"
IV. If there is any objection to important opinions and suggestions put forward by the special
committees under the board of directors in performing its functions and duties during the
Reporting Period, the specific situation should be disclosed
"□ Applicable" "√ Not applicable"
V. Particulars on risks in the Company identified by the board of supervisors
"□ Applicable" "√ Not applicable"
VI. Particulars on the situations that the Company and its controlling shareholders cannot
guarantee independence and cannot maintain self-operation ability in the aspects of business,
personnel, assets, organization and finance
"□ Applicable" "√ Not applicable"
The corresponding solutions, work progress and follow-up work plan of the Company in case of
horizontal competition
"□ Applicable" "√ Not applicable"
VII. Establishment and implementation of appraisal mechanism and the incentive mechanism for
senior management during the Reporting Period
"√ Applicable" "□ Not applicable"
During the Reporting Period, the Company established a comprehensive appraisal mechanism for
senior management. Quarterly and annual appraisals were conducted based on the completion of KPI and
daily routine work by the departments for which senior management were responsible. Through the
appraisal, not only the Company's overall operation and main economic indicators were achieved, but also
the development of the senior management personnel was realized, so as to fully mobilize the work
enthusiasm and operation potential of the senior management.
VIII. Whether to disclose the self-appraisal report on internal control
"√ Applicable" "□ Not applicable"
2020 Appraisal Report on Internal Control was considered and approved at the 5th meeting of the
fifth Board of Directors of the Company. For the full text of the report, please see 2020 Appraisal Report
on Internal Control disclosed on the website of the Shanghai Stock Exchange (www.sse.com.cn) on 30
March 2021.
Particulars on major defects in the internal control during the Reporting Period
"□ Applicable" "√ Not applicable"
IX. Particulars on the audit report on internal control
"√ Applicable" "□ Not applicable"
The Company engaged BDO China Shu Lun Pan Certified Public Accounts LLP to audit the
implementation of internal control in its 2020 financial statements and the Audit Report on Internal
Control was issued. For the full text of the report, please see 2020 Audit Report on Internal Control
disclosed on the website of the Shanghai Stock Exchange (www.sse.com.cn) on 30 March 2021.

Annual Report 2020
87 / 244
Whether to disclose the audit report on internal control: yes
Opinion type of the audit report on internal control: With unqualified opinion
X. Others
"□ Applicable" "√ Not applicable"

Annual Report 2020
88 / 244
Chapter X Corporate Bonds
"□ Applicable" "√ Not applicable"

Annual Report 2020
89 / 244
Chapter XI Financial Report
I. Auditor’s report
"√ Applicable" "□ Not applicable"
Xin Kuai Shi Bao Zi [2021] No. ZA10558
To the shareholders of Shanghai M&G Stationery Inc.:
i. Audits’ opinion
We have audited the accompanying financial statements of Shanghai M&G Stationery Inc.
(hereinafter referred to as “M&G Stationery”), which comprise the consolidated and parent company’s
balance sheets as at 31 December 2020, the consolidated and parent company’s income statements, the
consolidated and parent company’s cash flow statements, and the consolidated and parent company’s
statements of changes in shareholders’ equity for the year of 2020, as well as notes to financial statements.
In our opinion, the accompanying financial statements were prepared in accordance with the
Accounting Standards for Business Enterprises in all material aspects and give a true and fair view of the
consolidated and parent company’s financial position of M&G Stationery as at 31 December 2020 and of
its consolidated and parent company’s operating results and cash flows for the year of 2020.
ii. Basis of auditors’ opinion
We have conducted our audit in accordance with the Chinese Auditing Standards for Certified
Public Accountants. The “Responsibilities of Certified Public Accountants for Auditing of Financial
Statements” in the auditor’s report further illustrate our responsibilities under those standards. In
accordance with the Code of Professional Ethics of Chinese Certified Public Accountants, we are
independent of M&G Stationery and have performed other responsibilities in respect of professional ethics.
We believe that the audit evidence we have obtained is sufficient and appropriate to provide a basis for
our opinion.
iii.Key audit matters
Key audit matters are those matters that, in our professional judgment, were of most significance
in our audit of the financial statements for the current period. These matters were addressed in the context
of our audit of the financial statements as a whole and, in forming our opinion thereon, we do not provide
a separate opinion on these matters.
The key audit matters identified in our audit are summarized as follows:
Key audit matters How our audit addressed the key audit matter
1) Recognition of the revenue
Please refer to notes to financial statements for
accounting policies set out in “III Significant
Accounting Policies and Accounting
Estimates” (XXIII) and “V Notes to
Consolidated Financial Statements”
(XXXVII).
M&G Stationery mainly specializes in selling
stationery and office supplies.
In 2020, M&G Stationery’s revenue from
principal business in sales recognition
amounted to RMB13,133,546,100.
M&G Stationery recognized revenue based on
the expected amount of consideration that it is
1. We understood and evaluated design of the key
internal control designed by management and we
tested the effectiveness of implementing key controls;
2. We inspected customer contracts, on a sample
basis, to identify terms and conditions related to the
transfer of control over the goods, and assessed the
timing of revenue recognition with reference to the
requirements of prevailing accounting standards;
3. We selected samples for revenue transactions
recorded during the current year, with invoices, sales
contracts, goods delivery notes or transport
documents to assess whether the related revenue was

Annual Report 2020
90 / 244
entitled to receive when the customer obtains
control of the relevant products.
Since revenue is one of the key performance
indicators of M&G Stationery, there is
possibly inherent risk of inappropriately
recognizing revenue to reach specific purpose
in revenue recognition made based on the sales
group of distributor; there is possibly potential
risk of material misstatement in revenue
recognition made based on the sales group of
end customer because it involves many
transactions with small amount for each
transaction, so we recognized revenue
recognition as a key audit matter.
recognized in accordance with M&G Stationery’s
revenue recognition accounting policies;
4. We performed analytical procedures on revenue
and cost, including analysis of revenue, cost, gross
profit margin fluctuations in each month of the current
period, and performed analysis on sales model to
observe whether there is any abnormal transaction;
5. We took samples from revenue transactions that
took place shortly before and after the balance sheet
date, by checking delivery orders and other supportive
documents to assess whether revenue was recognized
in the correct accounting period.
6. We evaluated the accuracy and authenticity of the
revenue amount by implementing the income letter
verification procedure and checking goods return after
the period.
2) Anticipated credit loss of accounts receivable
Please refer to notes to financial statements for
accounting policies set out in “III Significant
Accounting Policies and Accounting
Estimates” (IX) and “V Notes to Consolidated
Financial Statements” (III).
As at 31 December 2020, balance of accounts
receivable amounted to RMB1,598,035,700,
and provision made for credit impairment loss
of accounts receivable amounted to
RMB36,824,200.
M&G Stationery measured provision for loss
of accounts receivable in accordance with
amount of anticipated credit loss in the entire
lifetime. The anticipated credit loss requires
the management to take into consideration of
forward-looking information apart from
combining historical experience and current
situations, involving lots of estimation and
judgment, so we recognized anticipated credit
loss of accounts receivable as a key audit
matter.
1. We understood and evaluated design of the key
internal control regarding impairment of financial
assets (including accounts receivable) designed by
management and we tested the effectiveness of
implementing key controls;
2. We evaluated rationality of the estimation on
anticipated credit loss of accounts receivable,
including judgment of forward-looking information;
basis of estimation on anticipated credit loss made on
a single item, and basis of estimation on anticipated
credit loss made on portfolio, including rationality of
the division for portfolio;
3. We reviewed credit risk assessment performed
by the management on internal and external
environment of M&G Stationery’s operation, integrity
of different customers, repayment history, repayment
capacity, and historical experience in credit loss;
4. We recalculated to check whether measurement
of provision for loss made by the management on
single and portfolio accounts receivable is consistent
with the amount of anticipated credit loss in the entire
existing period.
iv. Other information
The management of M&G Stationery (hereinafter referred to as the “management”) is responsible
for the other information which comprises all the information covered in M&G Stationery 2020 Annual
Report other than the financial statements and this auditor’s report.
Our audit opinion on the financial statements does not cover the other information and we do not
express any form of assurance conclusion thereon.
In conjunction with our audit to the financial statements, our responsibility is to read the other
information. During the process, we considered whether there is material inconsistency or there is likely
Annual Report 2020
91 / 244
material misstatement between the other information and the financial statements or the information we
obtained during the audit.
As we have performed the work on the other information obtained before the date of our auditor’s
report, we shall report if we confirmed there was a material misstatement among the other information.
We have nothing needed to be reported on this case.
v.Responsibilities of the management and governing bodies for the financial statements
The management shall be responsible for the preparation of financial statements in accordance with
the Accounting Standards for Business Enterprises to enable them to be fairly reflected, and to design,
implement and maintain the necessary internal controls so that there is no material misstatement due to
fraud or error in the financial statements.
In the preparation of the financial statements, the management is responsible for assessing M&G
Stationery’s continuous operating capacity, disclosing matters relating to continuous operations (if
applicable), and applying the continuing operating assumptions unless the management plans to perform
liquidation, cease operation or otherwise has no realistic choice.
The governing bodies are responsible for overseeing the financial reporting process of M&G
Stationery.
vi.Responsibilities of CPA for the audit of the financial statements
Our objective is to obtain reasonable assurance of the financial statements as a whole whether there
is a material misstatement due to fraud or error and to issue an auditor’s report containing audit opinion.
Reasonable assurance is a high level of assurance, but is not a guarantee that an audit conducted in
accordance with China Standards on Auditing will always detect a material misstatement when it exists.
Misstatements can arise from fraud or error and are considered material if, individually or in the aggregate,
they could reasonably be expected to influence the economic decisions of users taken on the basis of these
financial statements.
As part of an audit in accordance with the auditing standards, we exercised professional judgment
and maintained professional skepticism throughout the audit. We also performed the following works:
(1) to identify and assess the risks of material misstatement of the financial statements, whether due
to fraud or error; design and perform audit procedures responsive to those risks; and obtain audit evidence
that is sufficient and appropriate to provide a basis for our opinion. The risk of not detecting a material
misstatement resulting from fraud is higher than for one resulting from error, as fraud may involve
collusion, forgery, intentional omissions, misrepresentations, or the override of internal control.
(2) to understand the internal control related to the audit to design the appropriate audit procedures.
(3) to evaluate the appropriateness of accounting policies used and the reasonableness of accounting
estimates and related disclosures made by the management.
(4) to draw a conclusion on the appropriateness of the management’s use of the going concern basis
of accounting and, based on the audit evidence obtained, whether a material uncertainty exists related to
events or conditions that may cast significant doubt on the ability of M&G Stationery to continue as a
going concern. If we conclude that a material uncertainty exists, we are required to draw attention in our
auditor’s report to the related disclosures in the financial statements or, if such disclosures are inadequate,
to modify our opinion. Our conclusions are based on the audit evidence obtained up to the date of our
auditor’s report. However, future events or conditions may cause M&G Stationery to cease to continue as
a going concern.
(5) to evaluate the overall presentation, structure and content (including disclosure) of the financial
statements, and to assess whether the financial statements reflect the related transactions and events fairly.
(6) to obtain sufficient and appropriate audit evidence of the financial information of the entity or
business activity of the M&G Stationery in order to express an opinion on the consolidated financial

Annual Report 2020
92 / 244
statements. We are responsible for directing, supervising and performing group audits. We take full
responsibility for the audit opinion.
We communicated with the governing bodies regarding, among other matters, the planned scope
and timing of the audit and significant audit findings, including any significant deficiencies in internal
control that we identify during the audit.
We also provided a statement to management on compliance with ethical requirements related to
independence, and communicated with governing bodies about all relationships and other matters that
may be reasonably considered to affect our independence, as well as related precautions (if applicable).
From the matters we had discussed with the governing bodies, we confirmed which matters were
most important to the audit of the financial statements for the current period and thus constituted the key
audit matters. We set out these matters in the auditor’s report. Unless the disclosure of these matters are
forbidden by the laws and regulations, or, in rare cases, if it is reasonably expected that the negative
impacts caused by discussing certain matters in the auditor’s report would be larger than the benefits for
public interest, we shall not disclose the matters in the auditor’s report under such circumstances.
BDO China Shu Lun Pan CPAs Certified Public Accountant: Gu Xuefeng (Project Partner)
LLP
Certified Public Accountant: Wang Aijia
Shanghai• China 26 March 2021

Annual Report 2020
93 / 244
II. Financial Statements
Consolidated Balance Sheet
31 December 2020
Prepared by: SHANGHAI M&G STATIONERY INC.
Unit: Yuan Currency: RMB Item Notes 31 December 2020 31 December 2019
Current assets:
Cash and equivalents VII. 1 2,562,158,926.11 1,935,600,694.35
Transaction settlement funds
Lending funds
Held-for-trading financial assets VII. 2 1,428,277,848.33 661,878,587.24
Derivative financial assets
Bills receivable VII. 4
Accounts receivable VII. 5 1,561,211,468.90 1,026,094,724.15
Receivables financing VII. 6 61,412,976.46 29,549,924.83
Prepayment VII. 7 131,596,384.76 85,371,444.73
Premium receivable
Reinsurance premium receivable
Reserves for reinsurance contract receivable
Other receivables VII. 8 141,753,102.00 117,647,039.93
Including: Interest receivable
Dividend receivable
Financial assets purchased under agreements to
resell
Inventories VII. 9 1,322,812,846.83 1,378,108,759.85
Contract assets
Held for sale assets
Non-current assets due within one year VII. 12 4,637,213.00
Other current assets VII. 13 27,286,607.30 29,280,925.29
Total current assets 7,241,147,373.69 5,263,532,100.37
Non-current assets:
Loans and advances to customers
Debt investment
Other debt investment
Long-term receivables VII. 16 6,624,590.00
Long-term equity investments VII. 17 34,722,395.67 35,582,783.47
Investments in other equity instruments VII. 18 5,476,577.42 3,909,179.93
Other non-current financial assets
Investment real estate
Fixed assets VII. 21 1,847,635,724.45 1,163,702,352.12
Construction in progress VII. 22 54,946,300.66 260,469,728.76
Productive biological assets
Oil and gas assets
Right-of-use assets
Intangible assets VII. 26 320,746,328.60 331,005,762.09
Development expenses
Goodwill VII. 28 30,175,537.19
Long-term prepaid expenses VII. 29 99,035,852.78 118,336,333.95
Deferred income tax assets VII. 30 99,939,414.58 36,623,535.59
Other non-current assets VII. 31 6,258,468.47 315,153,408.27
Total non-current assets 2,468,761,062.63 2,301,583,211.37
Total assets 9,709,908,436.32 7,565,115,311.74
Current liabilities:
Short-term borrowings VII. 32 180,176,000.00 183,193,763.86
Borrowings from central bank
Placements from banks and other financial
institutions

Annual Report 2020
94 / 244
Held-for-trading financial liabilities
Derivative financial liabilities
Bills payable
Accounts payable VII. 36 2,602,020,507.99 1,861,072,467.87
Accounts received in advance VII. 37 206,762,293.94
Contract liabilities VII. 38 114,100,035.35
Financial assets sold under repurchase
agreements
Deposits from customers and other banks
Brokerage for trading securities
Brokerage for underwriting securities
Employee benefits payable VII. 39 152,625,106.89 154,119,492.32
Taxes payable VII. 40 477,240,219.10 258,583,118.14
Other payables VII. 41 625,468,675.97 331,438,976.35
Including: Interest payable
Dividend payable
Fees and commissions payable
Reinsured accounts payable
Held-for-sale liabilities
Non-current liabilities due within one year
Other current liabilities VII. 44 13,746,089.97
Total current liabilities 4,165,376,635.27 2,995,170,112.48
Non-current liabilities:
Reserves for insurance contracts
Long-term borrowings
Bonds payable
Including: Preference shares
Perpetual bonds
Lease liabilities
Long-term payables VII. 48 8,420,000.00 6,620,000.00
Long-term employee benefits payable
Estimated liabilities VII. 50 12,211,357.80
Deferred income VII. 51 46,132,513.40 65,823,213.11
Deferred income tax liabilities VII. 30 36,781,069.25 36,576,744.55
Other non-current liabilities
Total non-current liabilities 103,544,940.45 109,019,957.66
Total liabilities 4,268,921,575.72 3,104,190,070.14
Owner’s equity (or shareholders’ equity):
Share capital VII. 53 927,427,600.00 920,000,000.00
Other equity instruments
Including: Preference shares
Perpetual bonds
Capital reserve VII. 55 533,384,131.66 272,347,764.53
Less: Treasury shares VII. 56 176,034,120.00
Other comprehensive income VII. 57 2,141,402.48 526,359.55
Special reserve
Surplus reserve VII. 59 464,042,659.91 440,260,399.59
General risk provision
Undistributed profit VII. 60 3,442,607,038.00 2,568,365,861.32
Total equity attributable to the owners of the
parent company
5,193,568,712.05 4,201,500,384.99
Minority equity 247,418,148.55 259,424,856.61
Total owners’ equity (or shareholders’ equity) 5,440,986,860.60 4,460,925,241.60
Total liabilities and owner's equity (or
shareholders’ equity)
9,709,908,436.32 7,565,115,311.74
Legal Representative: Chen Huwen Accountant in charge: Quan Qiang Person in charge of
Accounting Department: Zhai Yu

Annual Report 2020
95 / 244
Parent Company’s Balance Sheet
31 December 2020
Prepared by: SHANGHAI M&G STATIONERY INC.
Unit: Yuan Currency: RMB
Item Notes 31 December 2020 31 December 2019
Current assets:
Cash and equivalents 1,887,003,379.89 1,358,805,872.56
Held-for-trading financial assets 1,272,219,811.46 509,467,061.37
Derivative financial assets
Bills receivable
Accounts receivable XVII. 1 177,648,799.65 82,949,224.65
Receivables financing
Prepayment 36,987,935.22 9,630,209.45
Other receivables XVII. 2 399,678,347.22 285,036,794.54
Including: Interest receivable 35,000.00 192,500.00
Dividend receivable
Inventories 332,755,309.92 448,245,658.48
Contract assets
Held for sale assets
Non-current assets due within one year 4,637,213.00
Other current assets 150,000,000.00 150,047,540.99
Total current assets 4,260,930,796.36 2,844,182,362.04
Non-current assets:
Debt investment
Other debt investment
Long-term receivables 6,624,590.00
Long-term equity investments XVII. 3 1,098,535,037.00 1,089,168,192.56
Investments in other equity instruments 5,476,577.42 3,909,179.93
Other non-current financial assets
Investment real estate
Fixed assets 1,471,196,714.32 749,415,024.84
Construction in progress 50,603,926.95 258,864,834.00
Productive biological assets
Oil and gas assets
Right-of-use assets
Intangible assets 177,722,510.27 182,268,368.82
Development expenses
Goodwill
Long-term prepaid expenses 5,417,965.45 10,106,589.01
Deferred income tax assets 29,239,636.35 5,469,359.66
Other non-current assets 5,829,768.47 311,929,028.24
Total non-current assets 2,844,022,136.23 2,617,755,167.06
Total assets 7,104,952,932.59 5,461,937,529.10
Current liabilities:
Short-term borrowings
Held-for-trading financial liabilities
Derivative financial liabilities
Bills payable
Accounts payable 320,744,916.72 225,831,712.59
Accounts received in advance 116,720,284.19
Contract liabilities 76,291,447.04
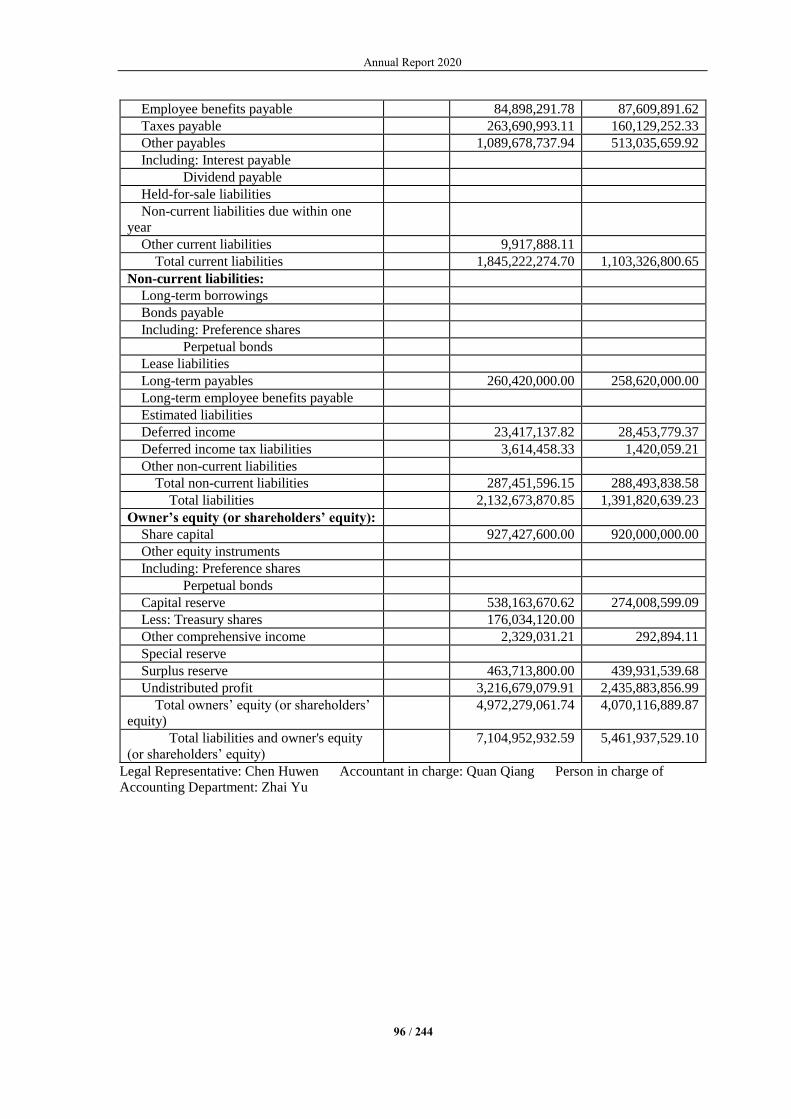
Annual Report 2020
96 / 244
Employee benefits payable 84,898,291.78 87,609,891.62
Taxes payable 263,690,993.11 160,129,252.33
Other payables 1,089,678,737.94 513,035,659.92
Including: Interest payable
Dividend payable
Held-for-sale liabilities
Non-current liabilities due within one
year
Other current liabilities 9,917,888.11
Total current liabilities 1,845,222,274.70 1,103,326,800.65
Non-current liabilities:
Long-term borrowings
Bonds payable
Including: Preference shares
Perpetual bonds
Lease liabilities
Long-term payables 260,420,000.00 258,620,000.00
Long-term employee benefits payable
Estimated liabilities
Deferred income 23,417,137.82 28,453,779.37
Deferred income tax liabilities 3,614,458.33 1,420,059.21
Other non-current liabilities
Total non-current liabilities 287,451,596.15 288,493,838.58
Total liabilities 2,132,673,870.85 1,391,820,639.23
Owner’s equity (or shareholders’ equity):
Share capital 927,427,600.00 920,000,000.00
Other equity instruments
Including: Preference shares
Perpetual bonds
Capital reserve 538,163,670.62 274,008,599.09
Less: Treasury shares 176,034,120.00
Other comprehensive income 2,329,031.21 292,894.11
Special reserve
Surplus reserve 463,713,800.00 439,931,539.68
Undistributed profit 3,216,679,079.91 2,435,883,856.99
Total owners’ equity (or shareholders’
equity)
4,972,279,061.74 4,070,116,889.87
Total liabilities and owner's equity
(or shareholders’ equity)
7,104,952,932.59 5,461,937,529.10
Legal Representative: Chen Huwen Accountant in charge: Quan Qiang Person in charge of
Accounting Department: Zhai Yu
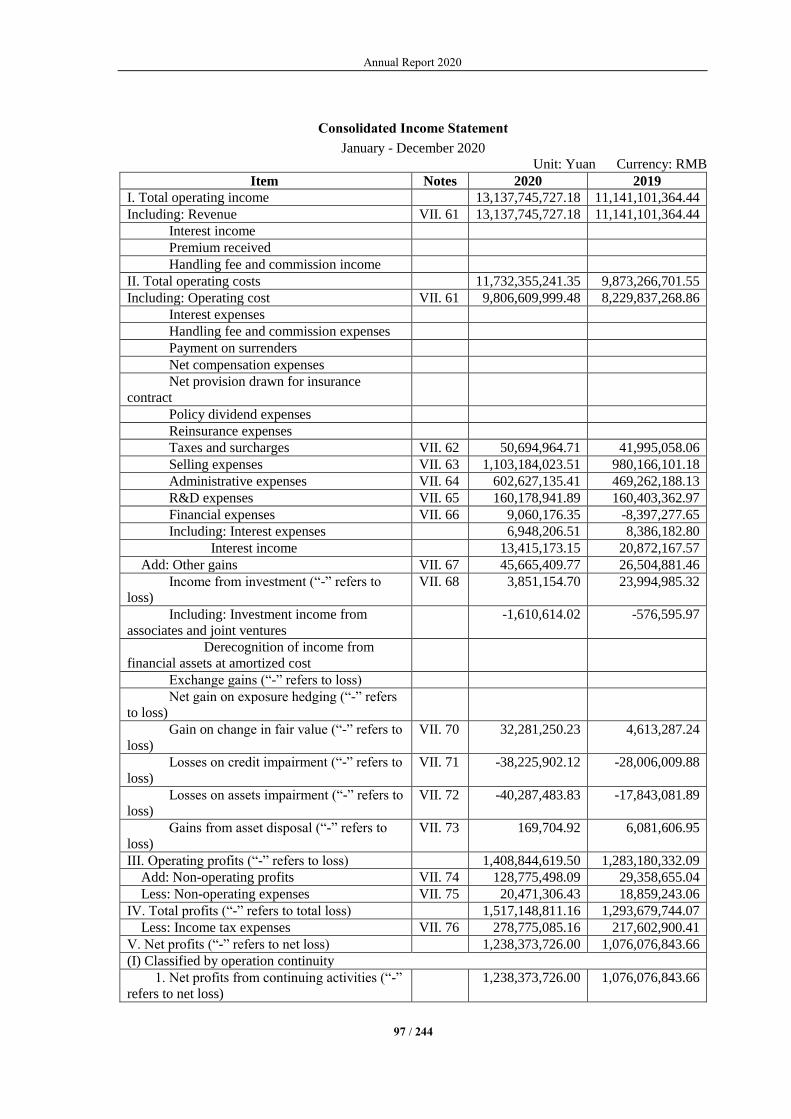
Annual Report 2020
97 / 244
Consolidated Income Statement
January - December 2020
Unit: Yuan Currency: RMB
Item Notes 2020 2019
I. Total operating income 13,137,745,727.18 11,141,101,364.44
Including: Revenue VII. 61 13,137,745,727.18 11,141,101,364.44
Interest income
Premium received
Handling fee and commission income
II. Total operating costs 11,732,355,241.35 9,873,266,701.55
Including: Operating cost VII. 61 9,806,609,999.48 8,229,837,268.86
Interest expenses
Handling fee and commission expenses
Payment on surrenders
Net compensation expenses
Net provision drawn for insurance
contract
Policy dividend expenses
Reinsurance expenses
Taxes and surcharges VII. 62 50,694,964.71 41,995,058.06
Selling expenses VII. 63 1,103,184,023.51 980,166,101.18
Administrative expenses VII. 64 602,627,135.41 469,262,188.13
R&D expenses VII. 65 160,178,941.89 160,403,362.97
Financial expenses VII. 66 9,060,176.35 -8,397,277.65
Including: Interest expenses 6,948,206.51 8,386,182.80
Interest income 13,415,173.15 20,872,167.57
Add: Other gains VII. 67 45,665,409.77 26,504,881.46
Income from investment (“-” refers to
loss)
VII. 68 3,851,154.70 23,994,985.32
Including: Investment income from
associates and joint ventures
-1,610,614.02 -576,595.97
Derecognition of income from
financial assets at amortized cost
Exchange gains (“-” refers to loss)
Net gain on exposure hedging (“-” refers
to loss)
Gain on change in fair value (“-” refers to
loss)
VII. 70 32,281,250.23 4,613,287.24
Losses on credit impairment (“-” refers to
loss)
VII. 71 -38,225,902.12 -28,006,009.88
Losses on assets impairment (“-” refers to
loss)
VII. 72 -40,287,483.83 -17,843,081.89
Gains from asset disposal (“-” refers to
loss)
VII. 73 169,704.92 6,081,606.95
III. Operating profits (“-” refers to loss) 1,408,844,619.50 1,283,180,332.09
Add: Non-operating profits VII. 74 128,775,498.09 29,358,655.04
Less: Non-operating expenses VII. 75 20,471,306.43 18,859,243.06
IV. Total profits (“-” refers to total loss) 1,517,148,811.16 1,293,679,744.07
Less: Income tax expenses VII. 76 278,775,085.16 217,602,900.41
V. Net profits (“-” refers to net loss) 1,238,373,726.00 1,076,076,843.66
(I) Classified by operation continuity
1. Net profits from continuing activities (“-”
refers to net loss)
1,238,373,726.00 1,076,076,843.66
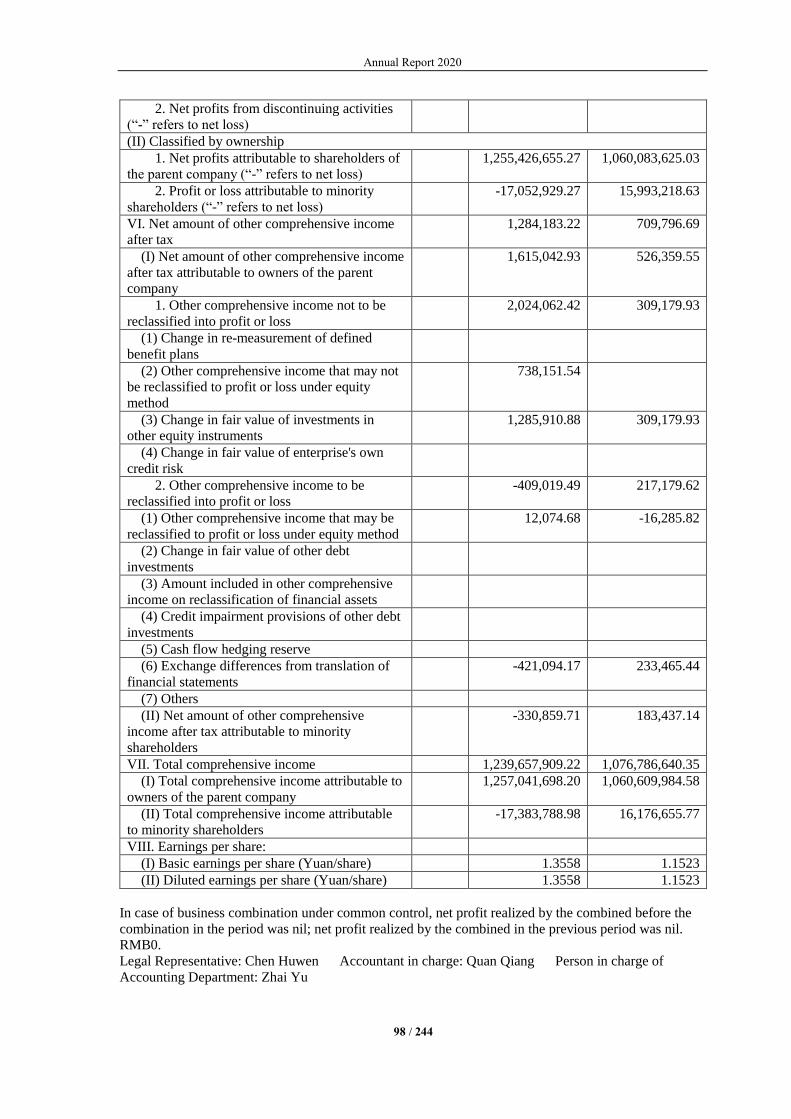
Annual Report 2020
98 / 244
2. Net profits from discontinuing activities
(“-” refers to net loss)
(II) Classified by ownership
1. Net profits attributable to shareholders of
the parent company (“-” refers to net loss)
1,255,426,655.27 1,060,083,625.03
2. Profit or loss attributable to minority
shareholders (“-” refers to net loss)
-17,052,929.27 15,993,218.63
VI. Net amount of other comprehensive income
after tax
1,284,183.22 709,796.69
(I) Net amount of other comprehensive income
after tax attributable to owners of the parent
company
1,615,042.93 526,359.55
1. Other comprehensive income not to be
reclassified into profit or loss
2,024,062.42 309,179.93
(1) Change in re-measurement of defined
benefit plans
(2) Other comprehensive income that may not
be reclassified to profit or loss under equity
method
738,151.54
(3) Change in fair value of investments in
other equity instruments
1,285,910.88 309,179.93
(4) Change in fair value of enterprise's own
credit risk
2. Other comprehensive income to be
reclassified into profit or loss
-409,019.49 217,179.62
(1) Other comprehensive income that may be
reclassified to profit or loss under equity method
12,074.68 -16,285.82
(2) Change in fair value of other debt
investments
(3) Amount included in other comprehensive
income on reclassification of financial assets
(4) Credit impairment provisions of other debt
investments
(5) Cash flow hedging reserve
(6) Exchange differences from translation of
financial statements
-421,094.17 233,465.44
(7) Others
(II) Net amount of other comprehensive
income after tax attributable to minority
shareholders
-330,859.71 183,437.14
VII. Total comprehensive income 1,239,657,909.22 1,076,786,640.35
(I) Total comprehensive income attributable to
owners of the parent company
1,257,041,698.20 1,060,609,984.58
(II) Total comprehensive income attributable
to minority shareholders
-17,383,788.98 16,176,655.77
VIII. Earnings per share:
(I) Basic earnings per share (Yuan/share) 1.3558 1.1523
(II) Diluted earnings per share (Yuan/share) 1.3558 1.1523
In case of business combination under common control, net profit realized by the combined before the
combination in the period was nil; net profit realized by the combined in the previous period was nil.
RMB0.
Legal Representative: Chen Huwen Accountant in charge: Quan Qiang Person in charge of
Accounting Department: Zhai Yu
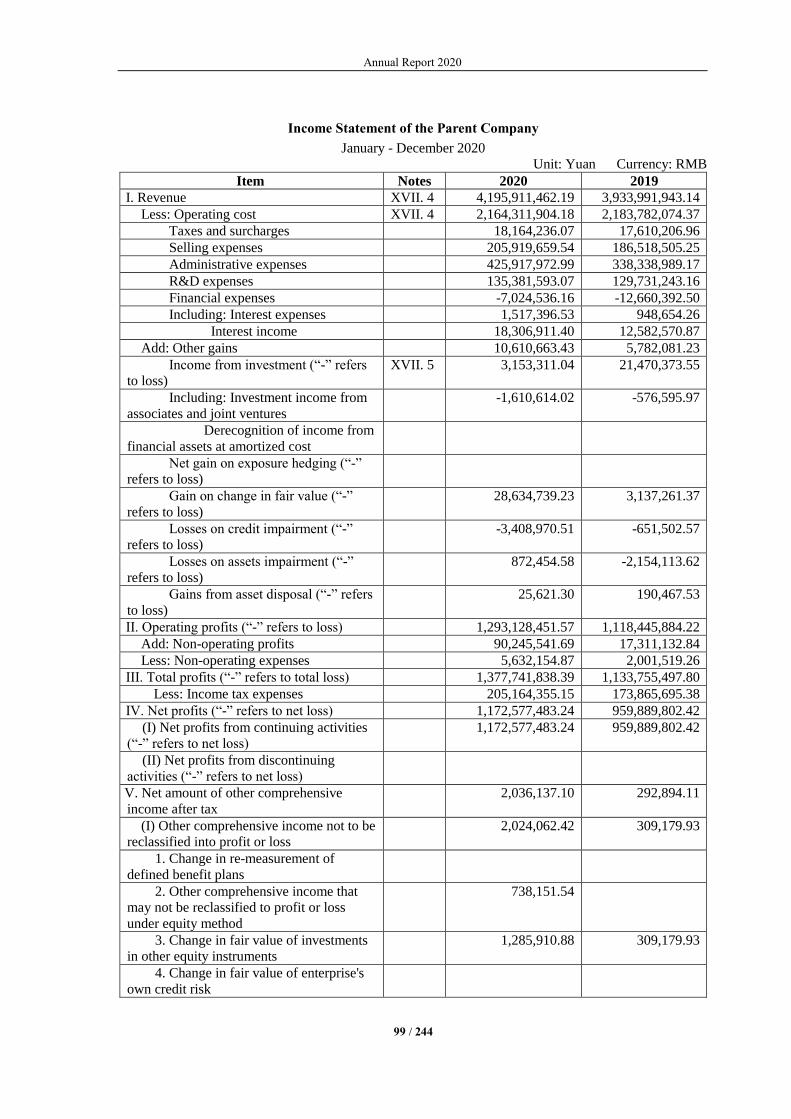
Annual Report 2020
99 / 244
Income Statement of the Parent Company
January - December 2020
Unit: Yuan Currency: RMB
Item Notes 2020 2019
I. Revenue XVII. 4 4,195,911,462.19 3,933,991,943.14
Less: Operating cost XVII. 4 2,164,311,904.18 2,183,782,074.37
Taxes and surcharges 18,164,236.07 17,610,206.96
Selling expenses 205,919,659.54 186,518,505.25
Administrative expenses 425,917,972.99 338,338,989.17
R&D expenses 135,381,593.07 129,731,243.16
Financial expenses -7,024,536.16 -12,660,392.50
Including: Interest expenses 1,517,396.53 948,654.26
Interest income 18,306,911.40 12,582,570.87
Add: Other gains 10,610,663.43 5,782,081.23
Income from investment (“-” refers
to loss)
XVII. 5 3,153,311.04 21,470,373.55
Including: Investment income from
associates and joint ventures
-1,610,614.02 -576,595.97
Derecognition of income from
financial assets at amortized cost
Net gain on exposure hedging (“-”
refers to loss)
Gain on change in fair value (“-”
refers to loss)
28,634,739.23 3,137,261.37
Losses on credit impairment (“-”
refers to loss)
-3,408,970.51 -651,502.57
Losses on assets impairment (“-”
refers to loss)
872,454.58 -2,154,113.62
Gains from asset disposal (“-” refers
to loss)
25,621.30 190,467.53
II. Operating profits (“-” refers to loss) 1,293,128,451.57 1,118,445,884.22
Add: Non-operating profits 90,245,541.69 17,311,132.84
Less: Non-operating expenses 5,632,154.87 2,001,519.26
III. Total profits (“-” refers to total loss) 1,377,741,838.39 1,133,755,497.80
Less: Income tax expenses 205,164,355.15 173,865,695.38
IV. Net profits (“-” refers to net loss) 1,172,577,483.24 959,889,802.42
(I) Net profits from continuing activities
(“-” refers to net loss)
1,172,577,483.24 959,889,802.42
(II) Net profits from discontinuing
activities (“-” refers to net loss)
V. Net amount of other comprehensive
income after tax
2,036,137.10 292,894.11
(I) Other comprehensive income not to be
reclassified into profit or loss
2,024,062.42 309,179.93
1. Change in re-measurement of
defined benefit plans
2. Other comprehensive income that
may not be reclassified to profit or loss
under equity method
738,151.54
3. Change in fair value of investments
in other equity instruments
1,285,910.88 309,179.93
4. Change in fair value of enterprise's
own credit risk

Annual Report 2020
100 / 244
(II) Other comprehensive income to be
reclassified into profit or loss
12,074.68 -16,285.82
1. Other comprehensive income that
may be reclassified to profit or loss under
equity method
12,074.68 -16,285.82
2. Change in fair value of other debt
investments
3. Amount included in other
comprehensive income on reclassification
of financial assets
4. Credit impairment provisions of
other debt investments
5. Cash flow hedging reserve
6. Exchange differences from
translation of financial statements
7. Others
VI. Total comprehensive income 1,174,613,620.34 960,182,696.53
VII. Earnings per share:
(I) Basic earnings per share
(Yuan/share)
(II) Diluted earnings per share
(Yuan/share)
Legal Representative: Chen Huwen Accountant in charge: Quan Qiang Person in charge of
Accounting Department: Zhai Yu
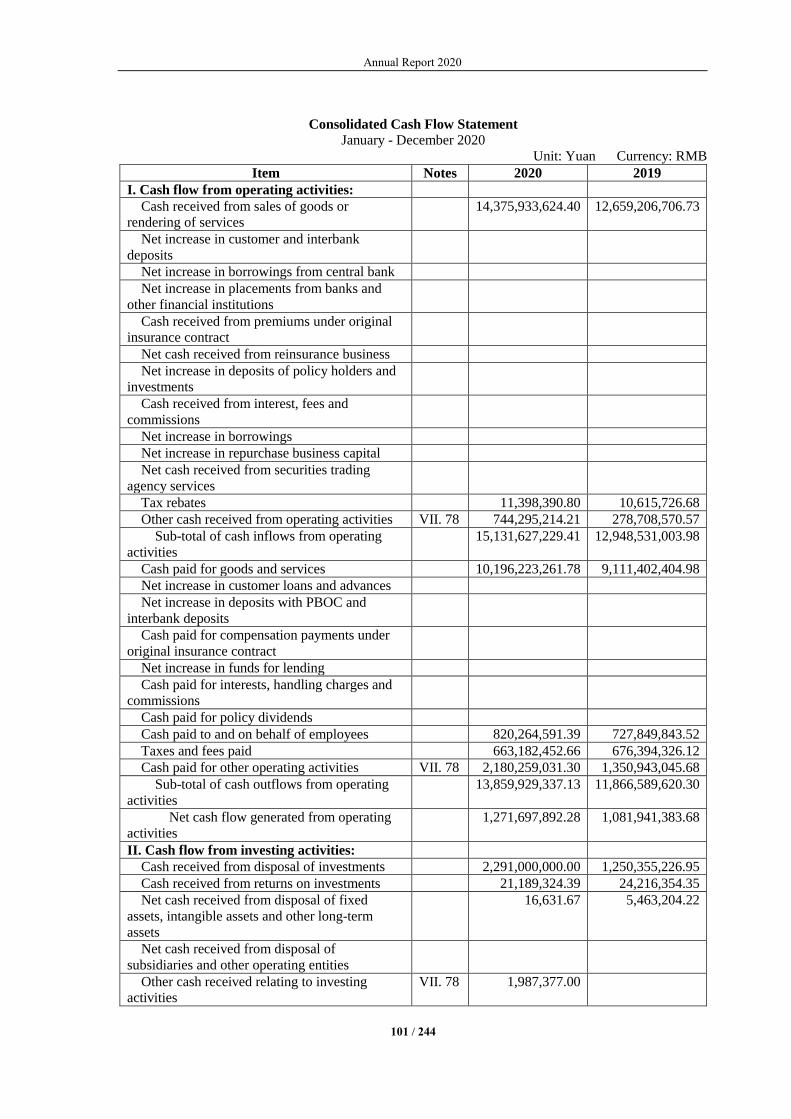
Annual Report 2020
101 / 244
Consolidated Cash Flow Statement
January - December 2020
Unit: Yuan Currency: RMB
Item Notes 2020 2019
I. Cash flow from operating activities:
Cash received from sales of goods or
rendering of services
14,375,933,624.40 12,659,206,706.73
Net increase in customer and interbank
deposits
Net increase in borrowings from central bank
Net increase in placements from banks and
other financial institutions
Cash received from premiums under original
insurance contract
Net cash received from reinsurance business
Net increase in deposits of policy holders and
investments
Cash received from interest, fees and
commissions
Net increase in borrowings
Net increase in repurchase business capital
Net cash received from securities trading
agency services
Tax rebates 11,398,390.80 10,615,726.68
Other cash received from operating activities VII. 78 744,295,214.21 278,708,570.57
Sub-total of cash inflows from operating
activities
15,131,627,229.41 12,948,531,003.98
Cash paid for goods and services 10,196,223,261.78 9,111,402,404.98
Net increase in customer loans and advances
Net increase in deposits with PBOC and
interbank deposits
Cash paid for compensation payments under
original insurance contract
Net increase in funds for lending
Cash paid for interests, handling charges and
commissions
Cash paid for policy dividends
Cash paid to and on behalf of employees 820,264,591.39 727,849,843.52
Taxes and fees paid 663,182,452.66 676,394,326.12
Cash paid for other operating activities VII. 78 2,180,259,031.30 1,350,943,045.68
Sub-total of cash outflows from operating
activities
13,859,929,337.13 11,866,589,620.30
Net cash flow generated from operating
activities
1,271,697,892.28 1,081,941,383.68
II. Cash flow from investing activities:
Cash received from disposal of investments 2,291,000,000.00 1,250,355,226.95
Cash received from returns on investments 21,189,324.39 24,216,354.35
Net cash received from disposal of fixed
assets, intangible assets and other long-term
assets
16,631.67 5,463,204.22
Net cash received from disposal of
subsidiaries and other operating entities
Other cash received relating to investing
activities
VII. 78 1,987,377.00
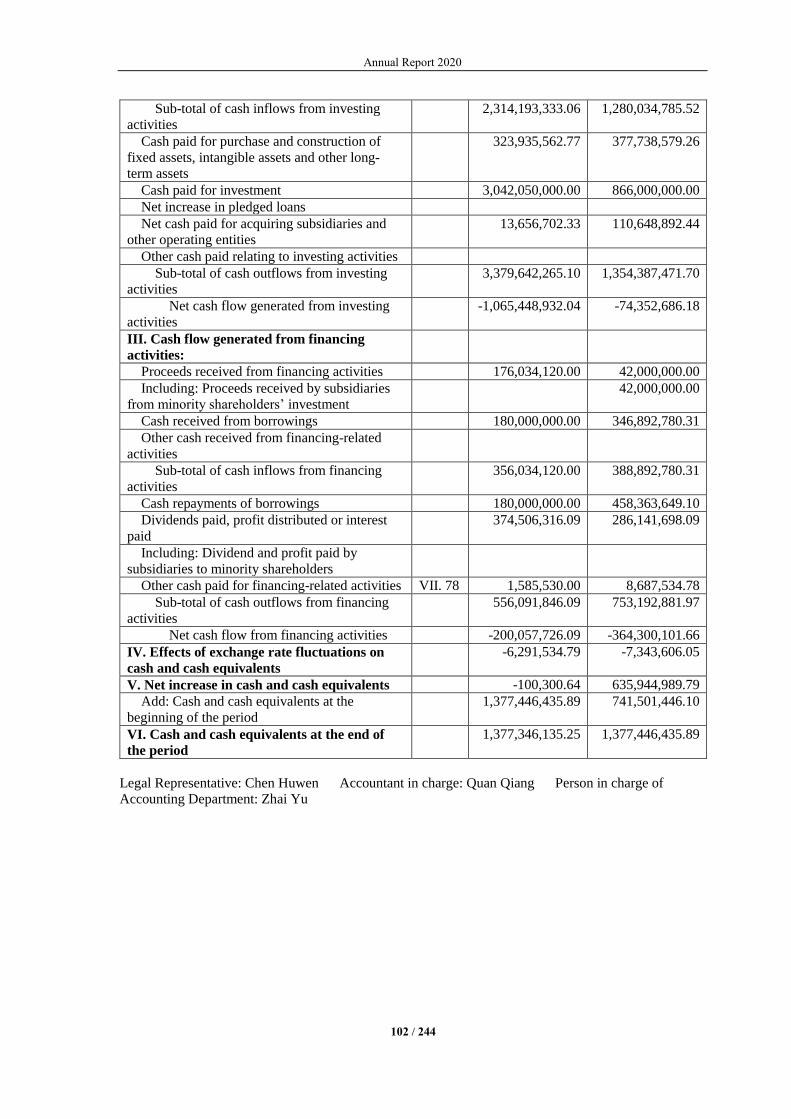
Annual Report 2020
102 / 244
Sub-total of cash inflows from investing
activities
2,314,193,333.06 1,280,034,785.52
Cash paid for purchase and construction of
fixed assets, intangible assets and other long-
term assets
323,935,562.77 377,738,579.26
Cash paid for investment 3,042,050,000.00 866,000,000.00
Net increase in pledged loans
Net cash paid for acquiring subsidiaries and
other operating entities
13,656,702.33 110,648,892.44
Other cash paid relating to investing activities
Sub-total of cash outflows from investing
activities
3,379,642,265.10 1,354,387,471.70
Net cash flow generated from investing
activities
-1,065,448,932.04 -74,352,686.18
III. Cash flow generated from financing
activities:
Proceeds received from financing activities 176,034,120.00 42,000,000.00
Including: Proceeds received by subsidiaries
from minority shareholders’ investment
42,000,000.00
Cash received from borrowings 180,000,000.00 346,892,780.31
Other cash received from financing-related
activities
Sub-total of cash inflows from financing
activities
356,034,120.00 388,892,780.31
Cash repayments of borrowings 180,000,000.00 458,363,649.10
Dividends paid, profit distributed or interest
paid
374,506,316.09 286,141,698.09
Including: Dividend and profit paid by
subsidiaries to minority shareholders
Other cash paid for financing-related activities VII. 78 1,585,530.00 8,687,534.78
Sub-total of cash outflows from financing
activities
556,091,846.09 753,192,881.97
Net cash flow from financing activities -200,057,726.09 -364,300,101.66
IV. Effects of exchange rate fluctuations on
cash and cash equivalents
-6,291,534.79 -7,343,606.05
V. Net increase in cash and cash equivalents -100,300.64 635,944,989.79
Add: Cash and cash equivalents at the
beginning of the period
1,377,446,435.89 741,501,446.10
VI. Cash and cash equivalents at the end of
the period
1,377,346,135.25 1,377,446,435.89
Legal Representative: Chen Huwen Accountant in charge: Quan Qiang Person in charge of
Accounting Department: Zhai Yu
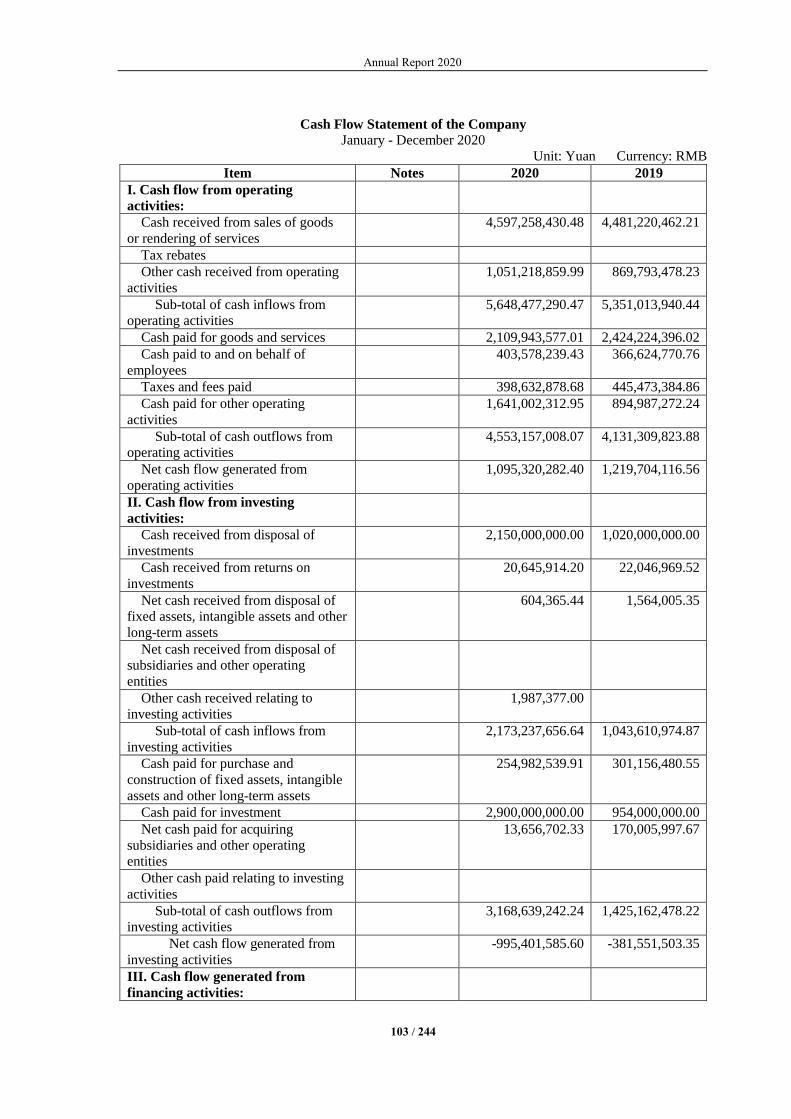
Annual Report 2020
103 / 244
Cash Flow Statement of the Company
January - December 2020
Unit: Yuan Currency: RMB
Item Notes 2020 2019
I. Cash flow from operating
activities:
Cash received from sales of goods
or rendering of services
4,597,258,430.48 4,481,220,462.21
Tax rebates
Other cash received from operating
activities
1,051,218,859.99 869,793,478.23
Sub-total of cash inflows from
operating activities
5,648,477,290.47 5,351,013,940.44
Cash paid for goods and services 2,109,943,577.01 2,424,224,396.02
Cash paid to and on behalf of
employees
403,578,239.43 366,624,770.76
Taxes and fees paid 398,632,878.68 445,473,384.86
Cash paid for other operating
activities
1,641,002,312.95 894,987,272.24
Sub-total of cash outflows from
operating activities
4,553,157,008.07 4,131,309,823.88
Net cash flow generated from
operating activities
1,095,320,282.40 1,219,704,116.56
II. Cash flow from investing
activities:
Cash received from disposal of
investments
2,150,000,000.00 1,020,000,000.00
Cash received from returns on
investments
20,645,914.20 22,046,969.52
Net cash received from disposal of
fixed assets, intangible assets and other
long-term assets
604,365.44 1,564,005.35
Net cash received from disposal of
subsidiaries and other operating
entities
Other cash received relating to
investing activities
1,987,377.00
Sub-total of cash inflows from
investing activities
2,173,237,656.64 1,043,610,974.87
Cash paid for purchase and
construction of fixed assets, intangible
assets and other long-term assets
254,982,539.91 301,156,480.55
Cash paid for investment 2,900,000,000.00 954,000,000.00
Net cash paid for acquiring
subsidiaries and other operating
entities
13,656,702.33 170,005,997.67
Other cash paid relating to investing
activities
Sub-total of cash outflows from
investing activities
3,168,639,242.24 1,425,162,478.22
Net cash flow generated from
investing activities
-995,401,585.60 -381,551,503.35
III. Cash flow generated from
financing activities:

Annual Report 2020
104 / 244
Proceeds received from financing
activities
176,034,120.00
Cash received from borrowings
Other cash received from financing-
related activities
Sub-total of cash inflows from
financing activities
176,034,120.00
Cash repayments of borrowings
Dividends paid, profit distributed or
interest paid
369,517,396.53 276,948,654.26
Other cash paid for financing-related
activities
1,585,530.00
Sub-total of cash outflows from
financing activities
371,102,926.53 276,948,654.26
Net cash flow from financing
activities
-195,068,806.53 -276,948,654.26
IV. Effects of exchange rate
fluctuations on cash and cash
equivalents
-5,972,061.74 -2,444,756.42
V. Net increase in cash and cash
equivalents
-101,122,171.47 558,759,202.53
Add: Cash and cash equivalents at
the beginning of the period
806,340,030.40 247,580,827.87
VI. Cash and cash equivalents at the
end of the period
705,217,858.93 806,340,030.40
Legal Representative: Chen Huwen Accountant in charge: Quan Qiang Person in charge of
Accounting Department: Zhai Yu
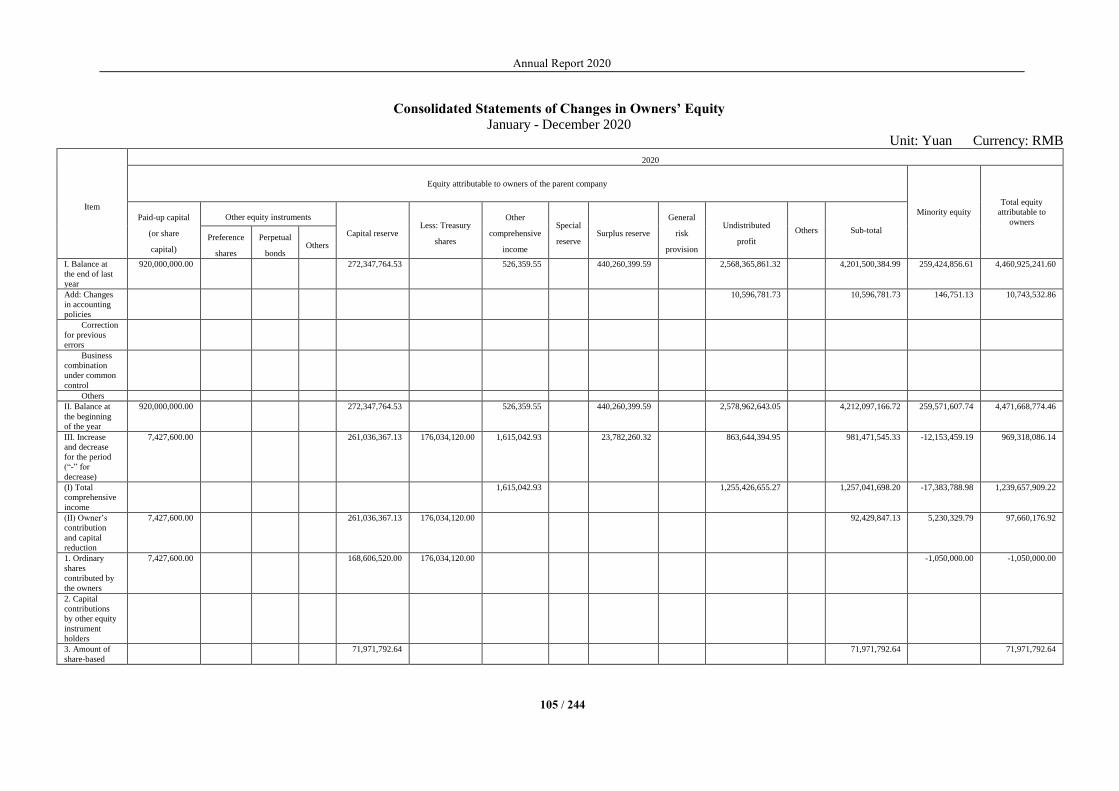
Annual Report 2020
105 / 244
Consolidated Statements of Changes in Owners’ Equity
January - December 2020
Unit: Yuan Currency: RMB
Item
2020
Equity attributable to owners of the parent company
Minority equity
Total equity
attributable to
owners Paid-up capital
(or share
capital)
Other equity instruments
Capital reserve Less: Treasury
shares
Other
comprehensive
income
Special
reserve Surplus reserve
General
risk
provision
Undistributed
profit
Others Sub-total Preference
shares
Perpetual
bonds Others
I. Balance at
the end of last
year
920,000,000.00 272,347,764.53 526,359.55 440,260,399.59 2,568,365,861.32 4,201,500,384.99 259,424,856.61 4,460,925,241.60
Add: Changes
in accounting
policies
10,596,781.73 10,596,781.73 146,751.13 10,743,532.86
Correction
for previous
errors
Business
combination
under common
control
Others
II. Balance at
the beginning
of the year
920,000,000.00 272,347,764.53 526,359.55 440,260,399.59 2,578,962,643.05 4,212,097,166.72 259,571,607.74 4,471,668,774.46
III. Increase
and decrease
for the period
(“-” for
decrease)
7,427,600.00 261,036,367.13 176,034,120.00 1,615,042.93 23,782,260.32 863,644,394.95 981,471,545.33 -12,153,459.19 969,318,086.14
(I) Total
comprehensive
income
1,615,042.93 1,255,426,655.27 1,257,041,698.20 -17,383,788.98 1,239,657,909.22
(II) Owner’s
contribution
and capital
reduction
7,427,600.00 261,036,367.13 176,034,120.00 92,429,847.13 5,230,329.79 97,660,176.92
1. Ordinary
shares
contributed by
the owners
7,427,600.00 168,606,520.00 176,034,120.00 -1,050,000.00 -1,050,000.00
2. Capital
contributions
by other equity
instrument
holders
3. Amount of
share-based
71,971,792.64 71,971,792.64 71,971,792.64

Annual Report 2020
106 / 244
payments
credited to
owners’ equity
4. Others 20,458,054.49 20,458,054.49 6,280,329.79 26,738,384.28
(III) Profit
distribution
23,782,260.32 -391,782,260.32 -368,000,000.00 -368,000,000.00
1. Withdrawal
of surplus
reserve
23,782,260.32 -23,782,260.32
2. Withdrawal
of general risk
provision
3. Distribution
to owners (or
shareholders)
-368,000,000.00 -368,000,000.00 -368,000,000.00
4. Others
(IV) Internal
carry-forward
of owners’
equity
1. Transfer of
capital reserve
to capital (or
share capital)
2. Transfer of
surplus reserve
to capital (or
share capital)
3. Surplus
reserve to cover
loss
4. Changes in
defined benefit
scheme carried
forward to
retained
earnings
5. Carry-
forward of
other
comprehensive
income to
retained
earnings
6. Others
(V) Special
reserve
1. Withdrawal
for the period
2. Utilization
for the period
(VI) Others
IV. Balance at
the end of the
period
927,427,600.00 533,384,131.66 176,034,120.00 2,141,402.48 464,042,659.91 3,442,607,038.00 5,193,568,712.05 247,418,148.55 5,440,986,860.60

Annual Report 2020
107 / 244
Item
2019
Equity attributable to owners of the parent company
Minority
equity
Total equity
attributable to
owners Paid-up capital
(or share
capital)
Other equity instruments
Capital reserve
Less:
Treasury
shares
Other
comprehensive
income
Special
reserve Surplus reserve
General
risk
provision
Undistributed
profit
Others Sub-total Preference
shares
Perpetual
bonds Others
I. Balance at the end of last
year
920,000,000.00 272,347,764.53 343,733,386.35 1,874,727,294.53 3,410,808,445.41 85,856,179.34 3,496,664,624.75
Add: Changes in accounting
policies
538,033.00 5,543,922.00 6,081,955.00 6,081,955.00
Correction for previous
errors
Business combination
under common control
Others
II. Balance at the beginning of
the year
920,000,000.00 272,347,764.53 344,271,419.35 1,880,271,216.53 3,416,890,400.41 85,856,179.34 3,502,746,579.75
III. Increase and decrease for
the period (“-” for decrease)
526,359.55 95,988,980.24 688,094,644.79 784,609,984.58 173,568,677.27 958,178,661.85
(I) Total comprehensive
income
526,359.55 1,060,083,625.03 1,060,609,984.58 16,176,655.77 1,076,786,640.35
(II) Owner’s contribution and
capital reduction
157,392,021.50 157,392,021.50
1. Ordinary shares contributed
by the owners
42,000,000.00 42,000,000.00
2. Capital contributions by
other equity instrument
holders
3. Amount of share-based
payments credited to owners’
equity
4. Others 115,392,021.50 115,392,021.50
(III) Profit distribution 95,988,980.24 -371,988,980.24 -276,000,000.00 -276,000,000.00
1. Withdrawal of surplus
reserve
95,988,980.24 -95,988,980.24
2. Withdrawal of general risk
provision
3. Distribution to owners (or
shareholders)
-276,000,000.00 -276,000,000.00 -276,000,000.00
4. Others
(IV) Internal carry-forward of
owners’ equity
1. Transfer of capital reserve
to capital (or share capital)
2. Transfer of surplus reserve
to capital (or share capital)
3. Surplus reserve to cover
loss
4. Changes in defined benefit
scheme carried forward to
retained earnings

Annual Report 2020
108 / 244
5. Carry-forward of other
comprehensive income to
retained earnings
6. Others
(V) Special reserve
1. Withdrawal for the period
2. Utilization for the period
(VI) Others
IV. Balance at the end of the
period
920,000,000.00 272,347,764.53 526,359.55 440,260,399.59 2,568,365,861.32 4,201,500,384.99 259,424,856.61 4,460,925,241.60
Legal Representative: Chen Huwen Accountant in charge: Quan Qiang Person in charge of Accounting Department: Zhai Yu
Statements of Changes in Equity of Owners of Parent Company
January - December 2020
Unit: Yuan Currency: RMB
Item
2020 Paid-up
capital (or
share
capital)
Other equity instruments Capital
reserve
Less:
Treasury
shares
Other
comprehensive
income
Special
reserve
Surplus
reserve
Undistributed
profit
Total equity
attributable
to owners Preference
shares
Perpetual
bonds Others
I. Balance at the end of last year 920,000,000.00 274,008,599.09 292,894.11 439,931,539.68 2,435,883,856.99 4,070,116,889.87
Add: Changes in accounting
policies
Correction for previous
errors
Others
II. Balance at the beginning of
the year
920,000,000.00 274,008,599.09 292,894.11 439,931,539.68 2,435,883,856.99 4,070,116,889.87
III. Increase and decrease for the
period (“-” for decrease)
7,427,600.00 264,155,071.53 176,034,120.00 2,036,137.10 23,782,260.32 780,795,222.92 902,162,171.87
(I) Total comprehensive income 2,036,137.10 1,172,577,483.24 1,174,613,620.34
(II) Owner’s contribution and
capital reduction
7,427,600.00 264,155,071.53 176,034,120.00 95,548,551.53
1. Ordinary shares contributed
by the owners
7,427,600.00 168,606,520.00 176,034,120.00
2. Capital contributions by other
equity instrument holders
3. Amount of share-based
payments credited to owners’
equity
82,199,024.88 82,199,024.88
4. Others 13,349,526.65 13,349,526.65
(III) Profit distribution 23,782,260.32 -391,782,260.32 -368,000,000.00
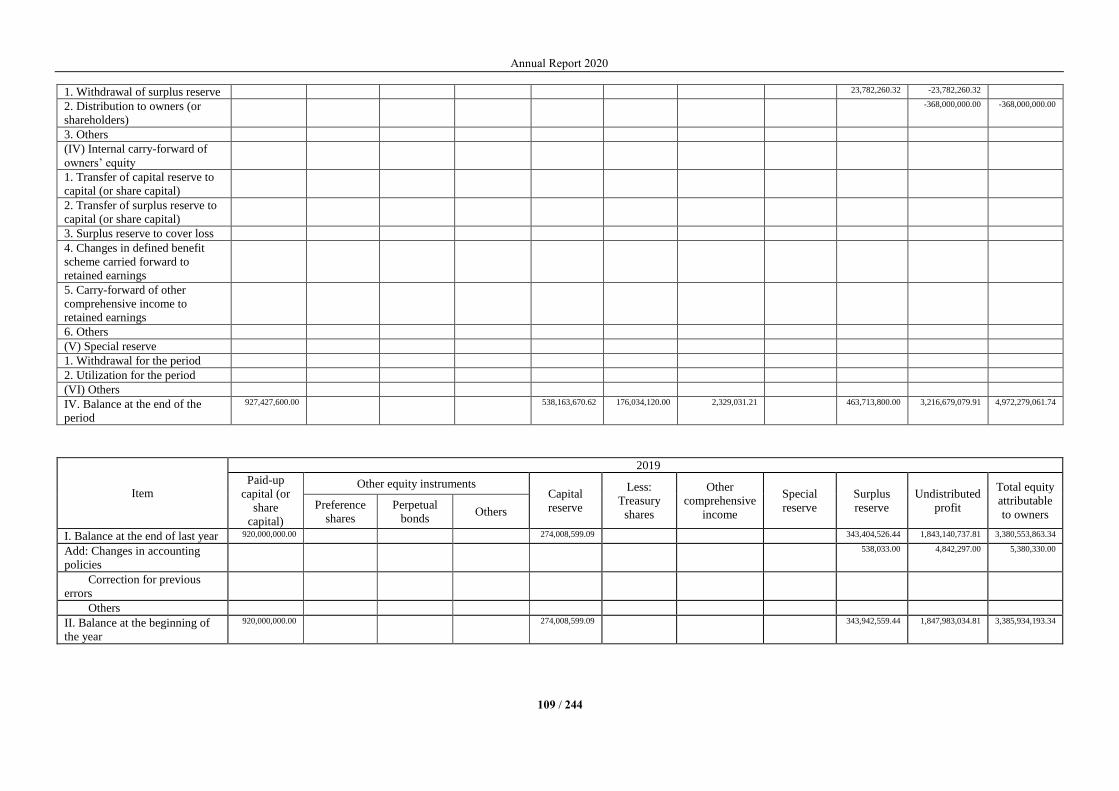
Annual Report 2020
109 / 244
1. Withdrawal of surplus reserve 23,782,260.32 -23,782,260.32
2. Distribution to owners (or
shareholders)
-368,000,000.00 -368,000,000.00
3. Others
(IV) Internal carry-forward of
owners’ equity
1. Transfer of capital reserve to
capital (or share capital)
2. Transfer of surplus reserve to
capital (or share capital)
3. Surplus reserve to cover loss
4. Changes in defined benefit
scheme carried forward to
retained earnings
5. Carry-forward of other
comprehensive income to
retained earnings
6. Others
(V) Special reserve
1. Withdrawal for the period
2. Utilization for the period
(VI) Others
IV. Balance at the end of the
period
927,427,600.00 538,163,670.62 176,034,120.00 2,329,031.21 463,713,800.00 3,216,679,079.91 4,972,279,061.74
Item
2019
Paid-up
capital (or
share
capital)
Other equity instruments Capital
reserve
Less:
Treasury
shares
Other
comprehensive
income
Special
reserve
Surplus
reserve
Undistributed
profit
Total equity
attributable
to owners Preference
shares
Perpetual
bonds Others
I. Balance at the end of last year 920,000,000.00 274,008,599.09 343,404,526.44 1,843,140,737.81 3,380,553,863.34
Add: Changes in accounting
policies
538,033.00 4,842,297.00 5,380,330.00
Correction for previous
errors
Others
II. Balance at the beginning of
the year
920,000,000.00 274,008,599.09 343,942,559.44 1,847,983,034.81 3,385,934,193.34

Annual Report 2020
110 / 244
III. Increase and decrease for
the period (“-” for decrease)
292,894.11 95,988,980.24 587,900,822.18 684,182,696.53
(I) Total comprehensive income 292,894.11 959,889,802.42 960,182,696.53
(II) Owner’s contribution and
capital reduction
1. Ordinary shares contributed
by the owners
2. Capital contributions by other
equity instrument holders
3. Amount of share-based
payments credited to owners’
equity
4. Others
(III) Profit distribution 95,988,980.24 -371,988,980.24 -276,000,000.00
1. Withdrawal of surplus
reserve
95,988,980.24 -95,988,980.24
2. Distribution to owners (or
shareholders)
-276,000,000.00 -276,000,000.00
3. Others
(IV) Internal carry-forward of
owners’ equity
1. Transfer of capital reserve to
capital (or share capital)
2. Transfer of surplus reserve to
capital (or share capital)
3. Surplus reserve to cover loss
4. Changes in defined benefit
scheme carried forward to
retained earnings
5. Carry-forward of other
comprehensive income to
retained earnings
6. Others
(V) Special reserve
1. Withdrawal for the period
2. Utilization for the period
(VI) Others
IV. Balance at the end of the
period
920,000,000.00 274,008,599.09 292,894.11 439,931,539.68 2,435,883,856.99 4,070,116,889.87
Legal Representative: Chen Huwen Accountant in charge: Quan Qiang Person in charge of Accounting Department: Zhai Yu

Annual Report 2020
111 / 244
III. General Information about the Company
1. Company profile
"√ Applicable" "□ Not applicable"
Shanghai M&G Stationery Inc. (hereinafter referred to as “Company” or the “Company”) is a company
limited by shares that was approved by the Approval for the Initial Public Offering of Shanghai M&G Stationery
Inc. in [2015] No. 15 securities regulatory license of China Securities Regulatory Commission in January 2015.
The Company’s business license No.: 91310000677833266F. In January 2015, the Company was listed on
Shanghai Stock Exchange. The industry where the Company operates is manufacturing industry in products for
stationery, arts, sports and entertainment.
As of 31 December 2020, the Company issued a total of 927,427,600 shares accumulatively, including
7,427,600 restricted shares, and its registered capital amounted to RMB927,427,600. The registered address of
the Company is Building 3, No. 3469 Jinqian Road, Fengxian District, Shanghai. The principal operations of
the Company include:
Permitted items: Food operation; printing of packaging and decoration printing products; printing of
documents, materials and other printing products; publication operation. (For items subject to approval,
operation activities are conducted after getting the approval from relevant departments. For specific operation
items, the approval documents or permits of relevant departments shall prevail)
General items: Manufacturing and sales of stationery products; wholesale and retail of digital products,
security equipment, instruments and apparatus, protective equipment in work, furniture, decorations, cosmetics,
accessories, office supplies, craft gifts (except ivory and its products), rubber and plastic products, electronic
products, household appliances, toys, molds, hardware and electric material, communication equipment,
computer software and auxiliary equipment, daily necessities, textiles, clothing and footwear, household goods,
sporting goods and equipment, disinfectants (excluding hazardous chemicals), kitchen utensils, sanitary ware
and daily sundries, daily chemical products, first-class medical equipment, second-class medical equipment,
machinery equipment, office equipment and consumables, photographic equipment, audio equipment,
decorative materials, fire-fighting equipment, hotel supplies, glass products, power and electronic components,
lubricants, plumbing pipes and accessories, ceramic pipes and accessories, automotive supplies, sanitary
products, and mother and baby supplies; import and export of goods and technology; e-commerce and enterprise
management consulting. (Except for items subject to approval according to law, operation activities are carried
out independently with business license according to law)
The parent company of the Company is M&G Holdings (Group) Co., Ltd., and the beneficial controllers
are Chen Huwen, Chen Huxiong, and Chen Xueling.
The financial statements were approved for submission by the Board of Directors on 26 March 2021.
2. Scope of consolidated financial statements
"√ Applicable" "□ Not applicable"
As of 31 December 2020, subsidiaries in the scope of the Company’s consolidated financial statements
are presented as follows:

Annual Report 2020
112 / 244
Name of subsidiaries
Shanghai M&G Zhenmei Stationery Co., Ltd.(上海晨光珍美文具有限公司)
Shanghai M&G Colipu Office Supplies Co., Ltd.
Lianyungang Colipu Office Supplies Co., Ltd.(连云港市科力普办公用品有限公司)
Shenyang M&G Colipu Office Supplies Co., Ltd.(沈阳晨光科力普办公用品有限公司)
Shanghai M&G Stationery & Gift Co., Ltd.(上海晨光文具礼品有限公司)
Shanghai M&G Stationery Sales Co., Ltd.(上海晨光文具销售有限公司)
Guangzhou M&G Stationery&Gifts Sales Co., Ltd.(广州晨光文具礼品销售有限公司)
Yiwu Chenxing Stationery Co., Ltd.(义乌市晨兴文具用品有限公司)
Harbin M&G Sanmei Stationery Co., Ltd.(哈尔滨晨光三美文具有限公司)
Zhengzhou M&G Stationery&Gifts Co., Ltd.(郑州晨光文具礼品有限责任公司)
M&G Life Enterprise Management Co., Ltd.(晨光生活馆企业管理有限公司)
M&G Life Enterprise Management (Shanghai) Co., Ltd.(晨光生活馆企业管理(上海)有限公司)
Shanghai M&G Jiamei Stationery Co., Ltd.(上海晨光佳美文具有限公司)
Jiangsu M&G Life Enterprise Management Co., Ltd.(江苏晨光生活馆企业管理有限公司)
Zhejiang New M&G Life Enterprise Management Co., Ltd.(浙江新晨光生活馆企业管理有限公司)
Jiumu M&G Store Enterprise Management Co., Ltd.(九木杂物社企业管理有限公司)
Shanghai M&G Information Technology Co., Ltd.(上海晨光信息科技有限公司)
Shenzhen Erya Creative and Cultural Development Co., Ltd.(深圳尔雅文化创意发展有限公司)
Shanghai M&G Office Supplies Co., Ltd.
Luoyang M&G Stationery Sales Co., Ltd.(洛阳晨光文具销售有限公司)
Hangzhou Sanmei M&G Stationery Co., Ltd.(杭州三美晨光文具有限公司)
Shanghai Qizhihaowan Culture and Creativity Co., Ltd.(上海奇只好玩文化创意有限公司)
Shanghai Chenxun Enterprise Management Co., Ltd.(上海晨讯企业管理有限公司)
Shanghai Colipu Information Technology Co., Ltd.(上海科力普信息科技有限公司)
Axus Stationery (Shanghai) Company Ltd.
Jiangsu Marco Pen Co., Ltd.(江苏马可笔业有限公司)
Changchun Macro Stationery Co., Ltd.(长春马可文教用品有限公司)
Yili Senlai Wood Co., Ltd.(伊犁森徕木业有限公司)
Axus Stationery (Hong Kong) Company Ltd.(安硕文教用品(香港)有限公司)
International stationery company
Details of the scope of the consolidated financial statements for the current period and its changes are set
out in “VIII. Changes in the Consolidation Scope” and “IX. Equity in Other Entities” of the notes.
IV. Preparation basis of financial statements
1. Preparation basis
the Company prepared financial statements in accordance with the Accounting Standards for Business
Enterprises - Basic Standards, and various specific account standards, application guidance for accounting
standards for business enterprises, interpretations of the accounting standards for business enterprises and other
relevant regulations (hereinafter collectively referred to as “Accounting Standards for Business Enterprises”)
promulgated by the Ministry of Finance, and the disclosure requirements in the Preparation Convention of
Annual Report 2020
113 / 244
Information Disclosure by Companies Offering Securities to the Public No.15 - General Provisions on
Financial Report issued by China Securities Regulatory Commission.
2. Going concern
"√ Applicable" "□ Not applicable"
The Company has the ability to continue as a going concern within the 12 months after the end of the
Reporting Period and there are no material events that may affect its ability to continue as a going concern.
V. Significant accounting policies and accounting estimates
Notes to specific accounting policies and accounting estimates:
"√ Applicable" "□ Not applicable"
The following disclosures cover the specific accounting policies and accounting estimates formulated by
the Company according to the characteristics of its production and operation. For details, please refer to Notes
"V (10) Financial Instruments", "V (23) Fixed Assets", "V (29) Intangible Assets", "V (31) Long-term Deferred
Expenses", "V (38) Income", and "V (40) Government Subsidies".
1. Statement of compliance of accounting standards for business enterprises
The financial statements are in compliance with the Accounting Standards for Business Enterprises
promulgated by the Ministry of Finance, and truly and completely present the consolidated and parent
company’s financial position of the Company as at 31 December 2020, as well as the consolidated and parent
company’s operating results and cash flows for the year then ended.
2. Accounting period
The accounting period of the Company is from 1 January to 31 December of each calendar year.
3. Operating cycle
"√ Applicable" "□ Not applicable"
The Company’s operating cycle is 12 months.
4. Reporting currency
RMB is adopted by the Company as the bookkeeping currency.
5. Accounting treatments for business combination under or not under common control
"√ Applicable" "□ Not applicable"
Business combination under common control: the assets and liabilities acquired by the Company in
business combination (including goodwill incurred in the acquisition of the acquiree by ultimate controlling
party) shall be measured at the carrying amount of the assets and liabilities of the acquiree in the consolidated
financial statements of the ultimate controlling party at the date of combination. The difference between the
carrying amount of the net assets obtained and the carrying amount of the consideration paid for the merger (or
total nominal value of the issued shares) is adjusted to capital premium in capital reserve. If the capital premium

Annual Report 2020
114 / 244
in capital reserve is not sufficient to offset the difference, the remaining balance is adjusted against retained
earnings.
Business combination not under common control: the cost of merger is the fair value of the assets paid by
the acquirer to obtain the control right of the acquiree, the liabilities incurred or assumed, and the equity
securities issued at the date of purchase. Where the cost of merger is higher than the fair value of the identifiable
net assets acquired from the acquiree in enterprise merger, the Company shall recognize such difference as
goodwill; where the cost of merger is less than the fair value of the identifiable net assets acquired from the
acquiree in enterprise merger, such difference shall be included in the current profit or loss. The identifiable
assets, liabilities and contingent liabilities of the acquiree obtained in the combination that meet the recognition
conditions are measured at their fair values at the date of purchase.
The direct expenses incurred in enterprise merger shall be included the current profit or loss; transaction
costs associated with the issue of equity or debt securities for the enterprise merger shall be included in the
initially recognized amounts of the equity or debt securities.
6. Preparation of consolidated financial statements
"√ Applicable" "□ Not applicable"
(1) Scope of consolidation
The consolidation scope of consolidated financial statements is determined on the basis of control,
including the Company and all of its subsidiaries. The term "control" refers to the power held by the Company
over the invested enterprise, through which the Company is capable of enjoying variable return by participating
in relevant activities of the invested enterprise, and having the ability to influence the amount of return via such
control.
(2) Consolidation procedure
The Company regards the entire enterprise group as an accounting entity and prepares the consolidated
financial statements in accordance with unified accounting policies to reflect the overall financial status,
operating results and cash flow of the enterprise group. The influence of internal transactions between the
Company and its subsidiaries and among the subsidiaries shall be offset. If internal transactions indicate that
the relevant assets have suffered impairment losses, the losses shall be fully recognized. In preparing the
consolidated financial statements, where the accounting policies and the accounting periods are inconsistent
between the Company and its subsidiaries, the financial statements of the subsidiaries are adjusted in accordance
with the accounting policies and accounting period of the Company.
The owners’ equity, the net profit or loss and the comprehensive income attributable to minority
shareholders of a subsidiary of the current period are presented separately under the owners’ equity in the
consolidated balance sheet, the net profit and the total comprehensive income in the consolidated income
statement respectively. Where losses attributable to the minority shareholders of a subsidiary exceed the
minority shareholders’ interest entitled in the shareholders’ equity of the subsidiary at the beginning of the
period, the excess is allocated against the minority equity.
① Addition of subsidiary or business
During the Reporting Period, if there is an addition of subsidiary or business due to business combination
under common control, the operating results and cash flows of the subsidiary or business combination from the
beginning of the current period to the end of the Reporting Period are included into the consolidated financial
statements, and at the same time, the amount at the end of the period of the consolidated financial statements
and the relevant items in the comparative statements are adjusted as if the reporting entity after combination
had been existing since the control of the ultimate controlling party started.
Annual Report 2020
115 / 244
Where control over the investee under common control is obtained due to reasons such as increase in
investments, for equity investment held before the control over the acquiree is obtained, profit or loss, other
comprehensive income and other changes in net assets recognized from the later of the acquisition of the original
equity interest and the date when the acquirer and the acquiree were placed under common control until the date
of combination are offset against the retained profit at the beginning of the period of the comparative statements
or the profit or loss of the current period respectively.
During the Reporting Period, if there is an addition of subsidiary or business due to business combination
not under common control, it shall be included in the consolidated financial statements on the basis of the fair
value of the identifiable assets, liabilities and contingent liabilities determined at the date of purchase.
Where control over the investee not under common control is obtained due to reasons such as increase in
investments, for the equity interest of the acquiree held before the date of purchase, the Company remeasures
the equity interest at its fair value as at the date of purchase, and any difference between the fair value and its
book value will be accounted for as investment gains of the current period. Where equity interest of the acquiree
held before the date of purchase is related to other comprehensive income that can be reclassified into profit
and loss in the future and other changes in owners’ equity under the equity method, such equity interest is
transferred to investment gains of the period to which the date of purchase belongs.
② Disposal of subsidiaries
A. General treatment for disposal
When control over the investee is lost due to the disposal of part of the equity investment or other reasons,
the Company remeasures the remaining equity investment at fair value as at the date on which control is lost.
The difference between the sum of the consideration received from equity disposal and the fair value of the
remaining equity interest and the sum of the net assets of the subsidiary proportionate to the original
shareholding accumulated from the date of purchase or combination and goodwill is included in investment
gains of the period during which the control is lost. Other comprehensive income that is related to the equity
investment in the original subsidiary and can be reclassified into profit and loss in the future and other changes
in owners’ equity under the equity method, are transferred to investment gains of the period during which the
control is lost.
B. Stepwise disposal of subsidiary
In respect of stepwise disposal of equity investment in a subsidiary through multiple transactions until
control is lost, if the terms, conditions and economic effects of the transactions of equity investment in the
subsidiary satisfy one or more of the following conditions, the transactions are normally accounted for as a
basket of transactions:
i. these transactions were entered into simultaneously or after considering the effects of each other;
ii. these transactions constituted a complete commercial result as a whole;
iii. one transaction was conditional upon at least one of the other transaction;
iv. one transaction was not economical on its own but was economical when considering together with
other transactions.
Where the transactions constitute a basket of transactions, the Company accounts for the transactions as a
transaction of disposal of a subsidiary until control is lost; the difference between the amount received each
time for disposal before control is lost and the net assets of such subsidiary corresponding to the disposal of
investment is recognized as other comprehensive income in the consolidated financial statements, and is
transferred to profit or loss of the period during which control is lost upon loss of control.

Annual Report 2020
116 / 244
Where the transactions do not constitute a basket of transactions, before the loss of control, the transactions
are accounted for using the policies related to partial disposal of equity investment in a subsidiary where no
control is lost; when control is lost, they are accounted for using the general method for disposal of subsidiaries.
③ Purchase of minority interests in subsidiary
For the difference between the long-term equity investment newly acquired due to the purchase of minority
interests by the Company and the share of net assets of the subsidiary calculated according to the new
shareholding accumulated from the date of purchase (or date of combination), share premium of the capital
reserve in the consolidated balance sheet will be adjusted; where share premium of the capital reserve is
insufficient for the write-down, retained profit will be adjusted.
④ Partial disposal of equity investment in subsidiaries without losing control
For the difference between the disposal consideration and the net assets of the subsidiary corresponding to
the disposal of long-term equity investment accumulated from the date of purchase or date of combination,
share premium of the capital reserve in the consolidated balance sheet will be adjusted; where share premium
of the capital reserve is insufficient for the write-down, retained profit will be adjusted.
7. Classification of joint arrangements and accounting of associate
"□ Applicable" "√ Not applicable"
8. Determination of cash and cash equivalents
Cash refers to the cash on hand and deposits that are available for payment of the Company. Cash
equivalents refer to investments held by the Company that are short-term, highly liquid, readily convertible to
known amounts of cash and subject to an insignificant risk of changes in value.
9. Foreign currency transactions and translation of foreign currency financial statements
"√ Applicable" "□ Not applicable"
(1) Foreign currency transactions
Foreign currency transactions shall be translated into RMB at the spot exchange rate on the day when the
transactions occur.
Balance of monetary items in foreign currency as at the balance sheet date is translated at the spot rates
prevailing at the balance sheet date, and any translation difference arising therefrom is included in profit or loss
of the period except for the translation difference arising from dedicated borrowings in foreign currency related
to the construction of assets qualified for capitalisation which is accounted for under the principle of
capitalisation of borrowing expenses.
(2) Translation of foreign currency financial statements
Asset and liability items in the balance sheet are translated at the spot rates prevailing at the balance sheet
date. Owners’ equity items other than “undistributed profit” are translated at the spot rates on the dates when
they are incurred. Income and expense items in the income statement are translated at the spot rates prevailing
at the transaction dates.
On disposal of a foreign operation, the exchange differences in the financial statements in foreign currency
relating to that foreign operation are transferred from owners’ equity to profit or loss of the period during which
the disposal occurs.
Annual Report 2020
117 / 244
10. Financial instruments
"√ Applicable" "□ Not applicable"
The Company recognizes a financial asset, a financial liability or an equity instrument when it becomes a
party to a financial instrument contract.
(1) Classification of the financial instruments
According to the business model of the Company’s management of financial assets and the contractual
cash flow characteristics of financial assets, financial assets are classified at the initial recognition as: financial
assets at amortized cost, financial assets at fair value through profit or loss, and other financial assets at fair
value through current profit or loss.
The Company classifies financial assets that simultaneously meet the following conditions and are not
designated as financial assets at fair value through current profit or loss as financial assets measured at amortized
cost:
- the business model aims at collecting contractual cash flows; and
- contractual cash flows are only the payment made based on the principal and the interest of the
outstanding principal amount.
The Company classifies financial assets that simultaneously meet the following conditions and are not
designated as financial assets at fair value through current profit or loss as financial assets (debt instruments) at
fair value through other comprehensive income:
- the business model aims at both collecting contractual cash flows and selling the financial assets; and
- contractual cash flows are only the payment made based on the principal and the interest of the
outstanding principal amount.
For non-trading equity instrument investments, the Company irrevocably designates them as financial
assets (equity instruments) at fair value through other comprehensive income at the time of initial recognition.
The designation is made on the basis of a single investment, and the related investment meets the definition of
an equity instrument from the issuer's perspective.
Except for the above-mentioned financial assets measured at amortized cost and at fair value through other
comprehensive income, the Company classifies all other financial assets as financial assets at fair value through
current profit or loss. At the time of initial recognition, if accounting mismatches can be eliminated or
significantly reduced, the Company can irrevocably designate financial assets that should be classified as
financial assets measured at amortized cost or at fair value through other comprehensive income as financial
assets at fair value through current profit or loss.
Financial liabilities at the initial recognition are classified into financial liabilities at fair value through
current profit or loss, and financial liabilities at amortized cost.
Financial liabilities at the initial recognition can be designated as financial liabilities at fair value through
current profit or loss if one of the following conditions can be met:
① Such designation can eliminate or significantly reduce accounting mismatches.
② According to the enterprise risk management or investment strategy stated in the official written
document, management and evaluation of the financial liabilities portfolio or financial assets and financial
liabilities portfolio are based on fair value which will be used as the basis for reporting to the key management
personnel.

Annual Report 2020
118 / 244
③ The financial liabilities include embedded derivatives that need to be split separately.
(2) Recognition and measurement of financial instruments
① Financial assets at amortized cost
Financial assets at amortized cost include notes receivable and accounts receivable, other receivables, long-
term receivables and debt investment, which are initially measured at fair value, and related transaction costs
are included in the initial recognition amount. The accounts receivable of major financing components and the
accounts receivable of the Company’s decision not to consider the financing component with the term less than
one year are initially measured at the contract transaction price.
Interest calculated by the effective interest method during the period of holding is included in the current
profit or loss.
Upon recovery or disposal, the difference between the acquisition price and the carrying amount of the
financial asset shall be included in the current profit or loss.
② Financial assets at fair value through other comprehensive income (debt instruments)
Financial assets (debt instruments) at fair value through other comprehensive income, including
receivables financing and other debt investments, are initially measured at fair value, and related transaction
costs are included in the initial recognition amount. The financial assets are subsequently measured at fair value.
Changes in fair value are included in other comprehensive income, except for interest, impairment losses or
gains and exchange gain or loss calculated using the effective interest method.
When the recognition is terminated, the accumulated gain or loss previously included in other
comprehensive income is transferred from other comprehensive income and included in the current profit or
loss.
③ Financial assets (equity instruments) at fair value through other comprehensive income
Financial assets (equity instruments) at fair value through other comprehensive income, including other
equity instruments, are initially measured at fair value, and related transaction costs are included in the initial
recognition amount. The financial assets are subsequently measured at fair value, and changes in fair value are
included in other comprehensive income. The dividends obtained are included in the current profit and loss.
When the recognition is terminated, the accumulated gain or loss previously included in other
comprehensive income is transferred from other comprehensive income and included in retained earnings.
④ Financial assets at fair value through the current profit or loss
Financial assets at fair value through the current profit or loss, including held-for-trading financial assets,
derivative financial assets and other non-current financial assets, are initially measured at fair value, and related
transaction costs are included in the current profit or loss. The financial assets are subsequently measured at fair
value, and changes in fair value are included in the current profit or loss.
⑤ Financial liabilities at fair value through current profit or loss
Financial liabilities at fair value through current profit or loss, including held-for-trading financial
liabilities, and derivative financial liabilities, are initially measured at fair value, and related transaction costs
are included in the current profit or loss. The financial liabilities are subsequently measured at fair value, and
changes in fair value are included in the current profit or loss.
Annual Report 2020
119 / 244
When the recognition is terminated, the difference between the carrying amount and consideration paid is
included in the current profit and loss.
⑥ Financial liabilities at amortized cost
Financial liabilities at amortized cost, including short-term borrowings, bills payable and accounts payable,
other payables, long-term borrowings, bonds payable, long-term payables, are initially measured at fair value,
and related transaction costs are included in the initial recognition amount.
Interest calculated by the effective interest method during the period of holding is included in the current
profit or loss.
When the recognition is terminated, the difference between consideration paid and the carrying amount of
the financial liabilities is included in the current profit and loss.
(3) Derecognition of financial assets and transfer of financial assets
The Company derecognizes financial assets when one of the following conditions is met:
- the contractual rights to collect the cash flows from the financial assets expire;
- the financial assets have been transferred and nearly all the risks and rewards related to the ownership of
the financial assets have been transferred to the transferee; or
- the financial assets have been transferred, and the Company have neither transferred nor retained almost
all risks and rewards related to the ownership of the financial assets, but did not retain control over the financial
assets.
Where a financial asset is transferred, it shall not be derecognized if the Company has retained nearly all
the risks and rewards related to the ownerships of the financial asset.
The substance-over-form principle shall be adopted while making a judgment on whether the transfer of
financial assets satisfies the above conditions for derecognition.
The transfer of financial assets could be classified into entire transfer and partial transfer. If the transfer of
an entire financial asset satisfies the conditions for derecognition, the difference between the two amounts below
shall be included in the current profit or loss:
① The carrying amount of the financial assets transferred;
② The consideration received as a result of the transfer, plus the accumulative amount of the change in
fair value previously included into the owners’ equity (in cases where the transferred financial assets are
financial assets (debt instruments) at fair value through other comprehensive income).
If the partial transfer of financial assets satisfies the conditions for derecognition, the overall carrying
amount of the transferred financial assets shall be apportioned according to their respective relative fair value
between the portion of derecognized part and the remaining part, and the difference between the two amounts
below shall be included in the current profit or loss:
① The carrying amount of the derecognized portion;
② The consideration of the derecognized portion, plus the corresponding derecognized portion of
accumulated change in fair value previously included in owners’ equity (in cases where the transferred financial
assets are financial assets (debt instruments) at fair value through other comprehensive income).
If the transfer of financial assets does not meet the conditions for derecognition, the financial assets
continue to be recognized and the consideration received is recognized as a financial liability.

Annual Report 2020
120 / 244
(4) Derecognition of financial liabilities
When the current obligation under a financial liability is completely or partially discharged, the whole or
relevant portion of the liability is derecognized; if an agreement is entered into between the Company and a
creditor to replace the original financial liabilities with new financial liabilities with substantially different terms,
the original financial liabilities will be derecognized and the new financial liabilities will be recognized.
If the contract terms of the original financial liabilities are substantially amended in part or in full, the
original financial liabilities will be derecognized in full or in part, and the financial liabilities whose terms have
been amended will be recognized as a new financial liability.
When financial liabilities are derecognized in full or in part, the difference between the carrying amount
of the financial liabilities derecognized and the consideration paid (including transferred non-cash assets or new
financial liability) will be included in the current profit or loss.
Where the Company repurchases part of its financial liabilities, the carrying amount of such financial
liabilities will be allocated according to the relative fair value between the continuously recognized part and
derecognized part on the repurchase date. The difference between the carrying amount of the derecognized
portion of financial liabilities and the consideration paid (including transferred non-cash assets or new financial
liability) will be included in the current profit or loss.
(5) Method of determining the fair values of financial assets and liabilities
A financial instrument with an active market determines its fair value by quoted prices in an active market.
Financial instruments that do not exist in an active market shall use valuation techniques to determine their fair
value. During the valuation process, the Company uses valuation techniques appropriate to the prevailing
circumstances with the support of sufficient data and other information available, selects inputs consistent with
the characteristics of the assets or liabilities considered in the transactions of relevant assets or liabilities by
market participants, and gives priority to relevant observable inputs. Unobservable inputs are used only when
the relevant observable inputs are not accessible or the access to which is impracticable.
(6) Impairment test method and accounting treatment for impairment of financial assets
The Company estimates the anticipated credit loss on a single or combination of financial assets measured
at amortized cost, financial assets (debt instruments) at fair value through other comprehensive income and
financial guarantee contracts.
The Company considers reasonable and evidence-based information about past events, current conditions,
and forecasts of future economic conditions, and uses the risk of default as the weight to calculate the
probability-weighted amount of the present value of the difference between the contractual cash flow receivable
and the expected cash flow, and recognizes the expected credit loss.
If the credit risk of the financial instruments has increased significantly since the initial recognition, the
Company will measure its loss provision based on the amount of anticipated credit loss for the lifetime of the
financial instruments; if the credit risk of the financial instruments has not significantly increased since the
initial recognition, the Company will measure its loss provision based on the amount of anticipated credit loss
for the financial instruments in the next 12 months. The increase or reversal of the loss provision resulting
therefrom is included in the current profit and loss as an impairment loss or gain.
the Company compares the risk of default on the balance sheet date of a financial instrument with the risk
of default on the date of initial recognition to determine the relative change in the risk of default during the
Annual Report 2020
121 / 244
expected life of the financial instrument so as to assess whether the credit risk of the financial instrument has
increased significantly since the initial recognition. Usually, after an overdue for more than 30 days, the
Company believes that the credit risk of the financial instrument has increased significantly unless there is
conclusive evidence that the credit risk of the financial instrument has not increased significantly since the initial
recognition.
If the credit risk of financial instrument at the balance sheet date is low, the Company will believe that the
credit risk of the financial instrument has not increased significantly since the initial recognition.
If there is any objective evidence indicating that some financial assets have incurred credit impairment, the
Company will make provision for impairment for the financial asset in a single financial asset manner.
Regarding the receivables and contract assets formed from transactions regulated by the Accounting
Standards for Business Enterprises No. 14 - Revenue (2017), regardless of whether they contain significant
financing components or not, the Company always measures their loss reserves in accordance with the amount
of anticipated credit losses for the entire lifetime.
For lease receivables, the Company always measures their loss reserves in accordance with the amount of
anticipated credit losses for the entire lifetime.
If the Company no longer reasonably expects that the contractual cash flow of a financial asset can be
recovered in whole or in part, it will directly write down the book balance of the financial asset.
11. Bills receivable
Determination and accounting treatment of the anticipated credit loss of notes receivable
"√ Applicable" "□ Not applicable"
For details, please refer to Note V (10) Financial Instruments.
12. Accounts receivable
Determination and accounting treatment of the anticipated credit loss of accounts receivable
"√ Applicable" "□ Not applicable"
For details, please refer to Note V (10) Financial Instruments.
13. Receivables financing
"√ Applicable" "□ Not applicable"
For details, please refer to Note V (10) Financial Instruments.
14. Other receivables
Determination and accounting treatment of the anticipated credit loss of other receivables
"√ Applicable" "□ Not applicable"
For details, please refer to Note V (10) Financial Instruments.
15. Inventories
"√ Applicable" "□ Not applicable"
(1) Classification and cost of inventories

Annual Report 2020
122 / 244
Inventories are classified into materials in transit, raw materials, turnover materials, goods-in-stock, goods
in production, goods in transit, commissioned processing materials and so forth.
Inventories are initially measured at cost. The cost of inventories includes purchase cost, processing cost
and other expenditures incurred to bring inventory to its current location and state.
(2) Determination of cost
Cost of inventories is determined using the weighted average method.
(3) Basis for the determination of net realizable value for different types of inventories
At the balance sheet date, the inventories are measured according to the cost or the net realizable value,
whichever is lower. If the cost of inventories is higher than the net realizable value, the provision for decline in
value of inventories is made. The net realizable value refers, in the ordinary course of business, to the amount
after deducting the estimated cost of completion, estimated sale expense and relevant taxes from the estimated
sale price of inventories.
Net realizable value of held-for-sale commodity stocks, such as finished goods, goods-in-stock, and held-
for-sale raw materials, during the normal course of production and operation, shall be determined by their
estimated selling price less the related selling expenses and taxes; the net realizable value of material inventories,
which need to be processed, during the normal course of production and operation, shall be determined by the
amount after deducting the estimated cost of completion, estimated selling expenses and relevant taxes from the
estimated selling price of finished goods; the net realizable value of inventories held for execution of sales
contracts or labor contracts shall be calculated on the ground of the contracted price. If an enterprise holds more
inventories than the quantity stipulated in the sales contract, the net realizable value of the exceeding part shall
be calculated on the ground of general selling price.
If the factors, which cause any value write-down of the inventories, have disappeared, thus causing the
inventories’ net realizable value to be higher than their carrying amount, the amount of write-down is reversed
from the provision for the loss on decline in value of inventories which has been made. The reversed amount is
included in the profits and losses of the current period.
(4) Inventory system
The perpetual inventory system is adopted.
(5) Amortization of low-value consumables and packaging materials
① Low-value consumables are amortized using the immediate write-off method;
② Packaging materials are amortized using the immediate write-off method.
16. Contract assets
(1). Recognition methods and standards of contract assets
"√ Applicable" "□ Not applicable"
Accounting policies from 1 January 2020
The Company presents contract assets or contract liabilities in the balance sheet based on the relationship
between performance obligations and customer payments. The Company presents the right to receive
consideration for the transfer of goods or services rendered to customers (and the right depends on other factors
other than the passage of time) as contract assets. Contract assets and contract liabilities under the same contract
are presented in net amounts. The Company's unconditional (only depending on the passage of time) right to
collect consideration from customers is separately presented as receivables.

Annual Report 2020
123 / 244
(2). Determination and accounting treatment of the anticipated credit loss of contract assets
"□ Applicable" "√ Not applicable"
17. Held for sale assets
"□ Applicable" "√ Not applicable"
18. Debt investment
(1). Determination and accounting treatment of the anticipated credit loss of debt investments
"□ Applicable" "√ Not applicable"
19. Other debt investment
(1). Determination and accounting treatment of the anticipated credit loss of other debt investments
"□ Applicable" "√ Not applicable"
20. Long-term receivables
(1). Determination and accounting treatment of the anticipated credit loss of long-term receivables
"√ Applicable" "□ Not applicable"
For details, please refer to Note V (10) Financial Instruments.
21. Long-term equity investments
"√ Applicable" "□ Not applicable"
(1) Joint control or significant influence criterion
Joint control is the contractually agreed sharing of control of an arrangement, and exists only when
decisions about the relevant activities of the arrangement require the unanimous consent of the parties sharing
control. The Company together with the other joint venture parties can jointly control over the investee, and are
entitled to the right of the net assets of the investee who is joint venture of the Company.
The term "significant influences" refers to the power to participate in making decisions on the financial
and operating policies of the invested enterprise, but not to control or do joint control together with other parties
over the formulation of these policies. Where the investor can exercise significant influence over the investee,
the investee is an associate of the Company.
(2) Determination of initial investment cost
① Long-term equity investments formed through business combination of entities
For long-term equity investments in subsidiaries formed by business combination under common control,
the initial investment cost of long-term equity investments shall be determined based on share of the book value
of the owners’ equity of the acquiree in the consolidated financial statements of the ultimate controlling party
at the date of combination. The difference between the initial investment cost of the long-term equity investment
and the carrying value of the consideration paid is adjusted to the equity premium in the capital reserve. If the
capital premium in capital reserve is not sufficient to offset the difference, the remaining balance is adjusted
against retained earnings. In connection with imposing control over the investee under joint control as a result
of additional investment and other reasons, the difference between the initial investment cost of the long-term

Annual Report 2020
124 / 244
equity investment recognized in accordance with the above principles and the carrying amount of the long term
equity investment before the combination and the sum of carrying amount of newly paid consideration for
additional shares acquired on the date of combination is adjusted to equity premium. If the capital premium in
capital reserve is not sufficient to offset the difference, the remaining balance is adjusted against retained
earnings.
For long-term equity investment in subsidiaries formed by business combination not under common
control, the cost of the combination ascertained on the date of acquisition shall be taken as the initial investment
cost of the long-term equity investments. In connection with imposing control over the investee not under joint
control as a result of additional investment and other reasons, the initial investment cost is the sum of the
carrying amount of the equity investment originally held and the newly increased initial investment cost.
② Long-term equity investments acquired by means other than business combination
The initial investment cost of a long-term equity investment obtained by the Company by cash payment
shall be the purchase cost paid actually.
The initial investment cost of a long-term equity investment obtained by the Company by means of
issuance of equity securities shall be the fair value of the equity securities issued.
(3) Subsequent measurement and recognition of profit or loss
① Long-term equity investment accounted for by cost method
Long-term equity investment in subsidiaries of the Company is accounted for by cost method, unless the
investment meets the conditions for holding for sale. Except for the actual consideration paid for the acquisition
of investment or the declared but not yet distributed cash dividends or profits which are included in the
consideration, investment gains are recognized as the Company’s shares of cash dividends or profits declared
by the investee.
② Long-term equity investment accounted for by equity method
Long-term equity investments of associates and joint ventures are accounted for by equity method. Where
the initial investment cost of a long-term equity investment exceeds the investor’s interest in the fair value of
the investee’s identifiable net assets at the date of acquisition, no adjustment is made to the initial investment
cost of long-term equity investments; where the initial investment cost is less than the investor’s interest in the
fair value of the investee’s identifiable net assets at the date of acquisition, the difference is included in the
profits or losses of the current period, and the cost of the long-term equity investment is adjusted simultaneously.
the Company recognizes the investment income and other comprehensive income according to the shares
of net profit or loss and other comprehensive income realized by the investee which it shall be entitled or shared
respectively, and simultaneously makes adjustment to the carrying amount of long-term equity investments; the
carrying amount of long-term equity investments shall be reduced by attributable share of the profit or cash
dividends for distribution declared by the investee. In relation to other changes of owners’ equity except for net
profit and loss, other comprehensive income and profit distributions of the investee (hereinafter referred to as
“other changes in owners’ equity”), the carrying amount of long-term equity investments shall be adjusted and
included in the owners’ equity.
When determining the amount of proportion of net profit or loss, other comprehensive income and other
changes in owners’ equity in the investee which it entitles, fair value of each identifiable assets of the investee
at the time when the investment is obtained shall be used as the basis, and adjustment shall be made to the net
profit and other comprehensive income of the investee according to the accounting policies and accounting
period of the Company.
Annual Report 2020
125 / 244
The unrealized profit or loss resulting from transactions between the Company and its associates or joint
ventures shall be offset in proportion to the investor’s equity interest of investee, based on which investment
income or loss shall be recognized. However, the situation that the assets invested or sold constitute business is
excluded. Any losses resulting from internal transactions, which are attributable to impairment of assets, shall
be fully recognized.
The Company shall recognize the net losses of the joint ventures or associates until the book value of the
long-term equity investment and other long-term rights and interests which substantially form the net investment
made to the invested entity are reduced to zero, unless the joint ventures or associates have the obligation to
undertake extra losses. If the joint ventures or associates realize net profits in the future, the Company resumes
recognizing its share of profits after the share of profits makes up for the share of unrecognized losses.
③ Disposal of long-term equity investments
For disposal of long-term equity investment, the difference between the carrying amount and the
consideration actually received shall be included in the current profit or loss.
For partial disposal of long-term equity investments accounted for by the equity method, if the remaining
equity is still accounted for by the equity method, the other comprehensive income calculated and recognized
by the original equity method shall be carried forward in corresponding proportion by using the same basis as
the investee used for direct disposal of relevant assets or liabilities. Other changes in owners’ equity shall be
carried forward to the profits or losses of the current period on a pro rata basis.
When the joint control or material influence over the investee is lost due to disposal of equity investment
and other reasons, other comprehensive income recognized in the original equity investment due to the use of
the equity method shall, when it is no longer calculated by the equity method, be subject to the accounting
treatment on the same basis as the investee used for direct disposal of relevant assets or liabilities. Other changes
in owners’ equity shall be all transferred into the profits or losses of the current period when they are no longer
calculated by the equity method.
When the control over the investee is lost due to partial disposal of equity investment and other reasons,
the remaining equities after disposal shall be accounted for by equity method in preparing individual financial
statements provided that joint control or material influence over the investee can be imposed, and shall be
adjusted as if such remaining equities has been accounted for by the equity method since they are obtained. The
other comprehensive income recognized before the control over the investee is obtained shall be carried forward
in proportion by using the same basis as the investee used for direct disposal of relevant assets or liabilities, and
the other changes in owners’ equity calculated and recognized using the equity method shall be carried forward
to the profits or losses of the current period on a pro rata basis. Where the remaining equities after disposal
cannot impose joint control or material influence over the investee, they shall be recognized as financial assets,
and the difference between fair value and the carrying amount on the date when control is lost shall be included
in the profits or losses of the current period. All other comprehensive income and other changes in owners’
equity recognized before the control over the investee is obtained shall be carried forward.
In respect of stepwise disposal of equity investment in a subsidiary through multiple transactions until
control is lost, where the transactions constitute a basket of transactions, the Company accounts for the
transactions as a transaction of disposal of a subsidiary until control is lost; however, the difference between the
amount received each time for disposal before control is lost and the carrying amount of long-term equity
investments corresponding to the disposal of equity is recognized as other comprehensive income in the
individual financial statements, and is transferred to the profits or losses of the current period during which
control is lost upon loss of control. Where the transactions do not constitute a basket of transactions, each
transaction shall be accounted for separately.

Annual Report 2020
126 / 244
22. Investment real estate
Not applicable
23. Fixed assets
(1). Conditions for recognition
"√ Applicable" "□ Not applicable"
Fixed assets are tangible assets that are held for use in the production or supply of goods or services, for
rental to others, or for administrative purposes; and have a useful life of more than one accounting year. Fixed
assets are recognized when they meet the following conditions:
① It is probable that the economic benefits associated with the fixed assets will flow to the enterprise;
② The cost of fixed assets can be reliably measured.
A fixed asset is initially measured at its cost (and considering the impact of expected abandonment cost
factors).
Subsequent expenditures related to fixed assets are included in the cost of fixed assets when their related
economic benefits are likely to flow in to the Company and their costs can be reliably measured; the book value
of the replaced part is derecognized; all other subsequent expenditures are included in the profits or losses of
the current period at the time of occurrence.
(2). Method for depreciation
"√ Applicable" "□ Not applicable"
Category Method for
depreciation
Useful lives of
depreciation (year) Residual value
Annual
depreciation rate
Property and
buildings
Straight-line method 20 5%
4.75%
Machinery and
equipment
Straight-line method 10 5-10%
9.5-9%
Transportation
vehicles
Straight-line method 4-10 0-10%
25-9%
Other equipment Straight-line method 2-10 0-10% 47.5-9.5%
Fixed assets are depreciated by categories using the straight-line method, and the depreciation rates are
determined by categories based upon their estimated useful lives and their estimated residual value. For fixed
assets with provision for impairment accrued, the depreciation amount shall be determined according to the
book value after deduction of the impairment provision and the remaining useful life in the future period. Where
the parts of a fixed asset have different useful lives or cause economic benefits for the enterprise in different
ways, different depreciation rates or depreciation methods shall be applied, and each part shall be depreciated
separately.
Fixed assets leased under finance lease are subject to the same depreciation policy as self-owned fixed
assets. If it can be reasonably determined that the ownership of the leased asset can be acquired upon the expiry
of the lease term, depreciation will be prepared during the remaining useful life of the leased asset. If it cannot
be reasonably determined that the ownership of the leased asset can be acquired upon the expiry of the lease
term, depreciation will be prepared during the lease term or the remaining useful life of the leased asset,
whichever is shorter.

Annual Report 2020
127 / 244
Note: physical assets newly acquired through the increase of capital by M&G Holdings (Group) Co., Ltd.
to the Company in 2010 are stated at valuation, and depreciated at the remaining useful life.
(3). Recognition basis and measurement method of fixed assets under finance lease
"√ Applicable" "□ Not applicable"
Where any one of the following conditions is provided in the lease agreement between the Company and
the lesser, assets under finance lease will be recognized:
① the ownership of the leased asset is transferred to the Company upon the expiry of lease;
② the Company has the option to purchase the leased asset, and the purchase consideration entered into
is expected to be far less than the fair value of the leased asset upon the exercise of the option;
③ the lease term accounts for the majority of the useful life of the leased asset;
④ the present value of the minimum lease payment upon the commencement of the lease is substantially
the same as the fair value of the leased asset.
⑤ Leased assets of special nature can only be used by the lessee unless major renovations are made.
On the commencement of the lease, the leased asset shall be stated at an amount equal to the fair value of
the leased asset or the present value of the minimum lease payments (whichever is lower), and the minimum
lease payments shall be stated as the carrying amount of long-term payables. The difference between the stated
amount of the leased asset and the minimum lease payments shall be accounted for as unrecognized finance
charge.
24. Construction in progress
"√ Applicable" "□ Not applicable"
Construction in progress is measured at the actual cost incurred. Actual cost includes construction cost,
installation cost, borrowing expense qualified for capitalization, and other necessary expenditures incurred
before the construction in progress reaches its intended use status. When the construction in progress reaches
the intended use status, it shall be transferred to fixed assets and its depreciation shall be accrued from the next
month.
25. Borrowing costs
"√ Applicable" "□ Not applicable"
(1) Criteria for recognition of capitalized borrowing costs
For borrowing costs incurred by the Company that are directly attributable to the acquisition, construction
or production of assets qualified for capitalization, the costs will be capitalized and included in the costs of the
related assets. Other borrowing costs shall be recognized as expense in the period in which they incur and are
included in the current profit or loss.
Assets qualified for capitalization are assets (fixed assets, investment property, inventories, etc.) that
necessarily take a substantial period of time for acquisition, construction or production to get ready for their
intended use or sale.
(2) Capitalization period of borrowing costs
The capitalization period shall refer to the period between the commencement and the cessation of
capitalization of borrowing costs, excluding the period in which capitalization of borrowing costs is temporarily
suspended.
Annual Report 2020
128 / 244
Capitalization of borrowing costs begins when the following three conditions are fully satisfied:
① expenditures for the assets (including cash paid, transferred non-currency assets or expenditure for
holding debt liability for the acquisition, construction or production of assets qualified for capitalization) have
been incurred;
② borrowing costs have been incurred;
③ acquisition, construction or production that are necessary to enable the asset reach its intended usable
or saleable condition have commenced.
Capitalization of borrowing costs shall be suspended during periods in which the qualifying asset under
acquisition and construction or production ready for the intended use or sale.
(3) Suspension of capitalization period
Capitalization of borrowing costs shall be suspended during periods in which the acquisition, construction
or production of a qualifying asset is interrupted abnormally, when the interruption is for a continuous period
of more than 3 months; if the interruption is a necessary step for making the qualifying asset under acquisition
and construction or production ready for the intended use or sale, the capitalization of the borrowing costs shall
continue. The borrowing costs incurred during such suspension period shall be recognized as the current profit
or loss. When the acquisition and construction or production of the asset resumes, the capitalization of
borrowing costs commences.
(4) Calculation of capitalization rate and amount of borrowing costs
For specific borrowings for the acquisition, construction or production of assets qualified for capitalization,
the amount of borrowing costs for capitalization is determined through borrowing costs of the specific
borrowings actually incurred in the current period minus the interest income earned on the unused borrowing
loans as a deposit in the bank or as investment income earned from temporary investment.
For general borrowings for the acquisition, construction or production of assets qualified for capitalization,
the to-be-capitalized amount of interests on the general borrowings shall be calculated and determined by
multiplying the weighted average asset disbursement of the part of the accumulative asset disbursements minus
the specifically borrowed loans by the capitalization rate of the general borrowings used. The capitalization rate
shall be calculated and determined according to the weighted average actual interest rate of the general
borrowings.
During the capitalization period, the exchange difference between the principal and interest of dedicated
borrowings in foreign currency is capitalized and included in the cost of the assets qualified for capitalization.
Exchange differences arising from the principal and interest of borrowings in foreign currency other than
dedicated borrowings in foreign currency are included in the profits or losses of the current period.
26. Biological assets
"□ Applicable" "√ Not applicable"
27. Oil and gas assets
"□ Applicable" "√ Not applicable"
28. Right-of-use assets
"□ Applicable" "√ Not applicable"

Annual Report 2020
129 / 244
29. Intangible assets
(1). Valuation method, useful life and impairment test
"√ Applicable" "□ Not applicable"
① Valuation method of intangible assets
A. Intangible assets are initially measured at cost upon acquisition by the Company;
The costs of externally purchased intangible assets include the purchase price, relevant taxes and expenses
paid, and other expenditures directly attributable to putting the asset into condition for its intended use.
B. Subsequent measurement
The useful life of intangible assets shall be analyze and judged upon acquisition.
As for intangible assets with finite useful life, they are amortized over the term in which economic benefits
are brought to the enterprise; if the term in which economic benefits are brought to the enterprise by intangible
assets cannot be estimated, the intangible assets shall be regarded as intangible assets with indefinite useful life,
and shall not be amortized.
② Estimated useful lives for the intangible assets with finite useful life
Item Estimated useful lives Basis
Land use rights 50 years Certificate of land use rights
Image identification rights 12 months to 64 months License contract
Software 3 to 10 years Expected years of benefit
Patent right 10 years Patent right certificate
Others 19 months to 120 months Expected years of benefit
Note: land use rights newly acquired through the increase of capital by M&G Holdings (Group) Co., Ltd.
to the Company in 2010 are stated at valuation, and amortized at the remaining useful life.
(2). Accounting policy regarding the expenditure on the internal research and development
"√ Applicable" "□ Not applicable"
① Specific criteria for the division of research phase and development phase
The expenses for internal research and development projects of the Company are divided into expenses in
the research phase and expenses in the development phase.
Research phase: scheduled, innovative investigations and research activities to obtain and understand
scientific or technological knowledge.
Development phase: apply the research outcomes or other knowledge to a plan or design prior to a
commercial production or use in order to produce new or essentially-improved materials, devices, products, etc.
② Specific criteria for capitalization at development phase
Expenditure in the research phase is included in the profit or loss for the current period at the time of
occurrence. Expenses in the development phase are recognized as an intangible asset when all of the following
conditions are satisfied, otherwise are included in the current profit or loss:
A. it is technically feasible to complete the intangible asset so that it will be available for use or sale;
B. there is an intention to complete the intangible asset for use or sale;
C. the intangible asset can produce economic benefits, including there is evidence that the products
produced using the intangible asset has a market or the intangible asset itself has a market; if the intangible asset
is for internal use, there is evidence that there exists usage for the intangible asset;

Annual Report 2020
130 / 244
D. there is sufficient support in terms of technology, financial resources and other resources in order to
complete the development of the intangible asset, and there is capability to use or sell the intangible asset;
E. the expenses attributable to the development stage of the intangible asset can be measured reliably.
If it is impossible to distinguish the expenses in the research phase from the expenses in the development
phase, all the incurred research and development expenses shall be included in the current profit or loss.
30. Impairment of long-term assets
"√ Applicable" "□ Not applicable"
Long-term assets, such as long-term equity investment, fixed assets, construction in progress, intangible
assets with finite useful life, and oil and gas assets are tested for impairment if there is any indication that an
asset may be impaired at the balance sheet date. If the result of the impairment test indicates that the recoverable
amount of the asset is less than its carrying amount, the difference shall be used to make impairment provision
and an impairment loss are recognized. The recoverable amount is the higher of the net amount of asset’s fair
value less costs to sell and the present value of the future cash flows expected to be derived from the asset.
Provision for asset impairment is determined and recognized on the individual asset basis. If it is not possible
to estimate the recoverable amount of an individual asset, the recoverable amount of a group of assets to which
the asset belongs to is determined. An assets group is the smallest group of assets that is able to generate cash
inflow independently.
Impairment test to goodwill formed by business combination, intangible assets with indefinite useful life
and intangible assets not ready to use shall be carried out at least at the end of each year, regardless of whether
there are any indications of impairment.
When the Company carries out impairment test to goodwill, the Company shall, as of the purchasing day,
allocate on a reasonable basis the carrying amount of the goodwill formed by enterprise merger to the relevant
asset groups, or if there is a difficulty in allocation, the Company shall allocate it to the portfolio of asset groups.
Relevant asset groups or portfolio of asset groups refer to the asset groups or portfolio of asset groups that can
benefit from the synergistic effect of business combination.
For the purpose of impairment test to the relevant asset groups or portfolio of asset groups containing
goodwill, if any evidence shows that the impairment of asset groups or portfolio of asset groups related to
goodwill exists, an impairment test will be made firstly on the asset groups or portfolio of asset groups not
containing goodwill, thus calculating the recoverable amount and comparing it with the relevant carrying
amount so as to recognize the corresponding impairment loss. Then the Company will make an impairment test
to the asset groups or portfolio of asset groups containing goodwill, and compare their carrying value with their
recoverable amount. Where the recoverable amount is lower than the carrying value thereof, the amount of
impairment loss is first deducted and allocated to the carrying value of goodwill in the asset groups or portfolio
of asset groups, and then the carrying value of other assets other than goodwill in the asset groups or portfolio
of asset groups is deducted according to the percentages of the carrying value of such other assets.
Once the above asset impairment loss is recognized, it will not be reversed in the subsequent accounting
periods.
31. Long-term prepaid expenses
"√ Applicable" "□ Not applicable"
Long-term prepaid expenses are expenses which have occurred with amortization period over 1 year and
shall be borne by the current period and subsequent periods.
Annual Report 2020
131 / 244
Amortization periods and amortization methods of various expenses are as follows:
Item Estimated useful lives Basis
Decoration fee 3 to 5 years Expected years of benefit
Others 2 years Expected years of benefit
32. Contract liabilities
(1). Recognition methods of contract liabilities
"√ Applicable" "□ Not applicable"
Accounting policies from 1 January 2020
The Company presents contract assets or contract liabilities in the balance sheet based on the relationship
between performance obligations and customer payments. The Company's obligation to transfer goods or
provide services to customers for consideration received or receivable from customers is presented as contract
liabilities. Contract assets and contract liabilities under the same contract are presented in net amounts.
33. Employee remuneration
(1). Method of accounting treatment for short-term remuneration
"√ Applicable" "□ Not applicable"
During the accounting period when employees provide service, the Company will recognize the short-term
remuneration actually incurred as liabilities, and the liabilities will be included in the current profit or loss or
relevant costs of assets.
The Company will pay social insurance and housing funds for the employees, and will make provision of
trade union funds and employee education costs in accordance with the requirements. During the accounting
period when employees provide service, the Company will determine relevant amount of employee
remuneration in accordance with the required provision basis and provision ratios.
The employee welfare expenses incurred by the Company are included in the current profit or loss or
related asset costs based on the actual amounts when they actually occur. Among them, non-monetary benefits
are measured at fair value.
(2). Method of accounting treatment for post-employment benefits
"√ Applicable" "□ Not applicable"
① Defined contribution scheme
The Company will pay basic pension insurance and unemployment insurance in accordance with the
relevant provisions of the local government for the employees. During the accounting period when employees
provide service, the Company will calculate the amount payable which will be recognized as liabilities in
accordance with the local stipulated basis and proportions, and the liabilities will be included in the current
profit or loss or costs of related assets. In addition, the Company also participates in the enterprise annuity
scheme/supplementary pension insurance fund approved by the relevant state departments. The Company
makes payment to the annuity scheme/local social insurance agencies based on a certain proportion of total
employee remuneration. Corresponding expense is included in the current profit or loss or costs of related assets.
② Defined benefit scheme

Annual Report 2020
132 / 244
The welfare responsibilities generated from defined benefit scheme based on the formula determined by
projected unit credit method will be vested to the service period of employees and included into the current
profit or costs of related assets.
The deficit or surplus generated from the present value of obligations of the defined benefit scheme minus
the fair value of the assets of defined benefit scheme is recognized as net liabilities or net assets. When the
defined benefit scheme has surplus, the Company will measure the net assets of the defined benefit scheme at
the lower of the surplus of defined benefit scheme and the upper limit of the assets.
All obligations of the defined benefit plan, including the expected duty of payment within 12 months after
the end of annual reporting period during which employees provide service, shall be discounted based on the
bond market yield of sovereign bond matching the term of obligations of the defined benefit plan and currency
or corporate bonds of high quality in the active market on the balance sheet date.
The service cost incurred by defined benefit scheme and the net interest of the net liabilities and net assets
of the defined benefit scheme will be included in the current profit or loss or costs of relevant assets. The changes
as a result of re-measurement of the net defined benefit liabilities or assets shall be recognized in other
comprehensive income and shall not be reversed to profit or loss at subsequent accounting period. When the
original defined benefit plan is terminated, amount originally included in other comprehensive income shall be
transferred to undistributed profit in the scope of equity.
When the defined benefit scheme is settled, the gain or loss is confirmed based on the difference between
the present value of obligations and the settlement price of the defined benefit scheme as at the balance sheet
date.
(3). Accounting method for termination benefits
"√ Applicable" "□ Not applicable"
Where the Company provides termination benefits to its employees, the employee benefits liabilities
resulting from termination benefits are recognized on the following date (whichever is earlier) and are included
in the current profit or loss: when the Company cannot unilaterally withdraw the termination benefits provided
due to the cancellation of the labor relationship with the employees or the layoff proposal; or when the Company
recognizes the costs or expenses of reorganization relating to payment of termination benefits.
(4). Accounting treatment of other long-term employees’ benefits
"□ Applicable" "√ Not applicable"
34. Lease liabilities
"□ Applicable" "√ Not applicable"
35. Estimated liabilities
"√ Applicable" "□ Not applicable"
The Company shall recognize the obligations related to contingencies when all of the following conditions
are satisfied:
(1) obligation is a present obligation of the Company;
(2) it is probable that an outflow of economic benefits of the Company will be required to settle the
obligation; and
(3) the amount of the obligation can be measured reliably.

Annual Report 2020
133 / 244
Estimated liabilities shall be initially measured at the best estimate of the expenses required to settle the
related present obligation.
Factors pertaining to a contingency such as risk, uncertainties, and time value of money shall be taken into
account as a whole in getting the best estimate. Where the effect of the time value of money is material, the best
estimate shall be determined by discounting the related future cash outflow.
Where the expenses required have a successive range and the possibilities of occurrence of each result are
the same in the range, the best estimate shall be determined according to the median value within the range; in
other cases, the best estimate shall be determined as below:
• If contingencies involve a single item, the best estimate shall be determined according to the most possible
occurrence amount.
• If contingencies involve multiple items, the best estimate shall be calculated and determined in
accordance with various possible outcomes and related possibilities.
Where some or all of the expenses required to settle an estimated liability are expected to be reimbursed
by a third party, the reimbursement is separately recognized as an asset when it is virtually certain that the
reimbursement will be received. The amount recognized for the reimbursement is limited to the carrying amount
of the liability recognized.
The Company reviews the carrying value of the estimated liabilities at the balance sheet date. If there is
any exact evidence indicating that the carrying value cannot really reflect the current best estimate, the carrying
value shall be adjusted in accordance with the current best estimate.
36. Share-based payments
"√ Applicable" "□ Not applicable"
Share-based payments are transactions that grant equity instruments or assume equity-instrument based
liabilities for receiving services rendered by employees or other parties. The Company’s share-based payments
included equity-settled share-based payments and cash-settled share-based payments.
(1) Equity-settled share-based payments and equity instruments
Equity-settled share-based payments made in exchange for services rendered by employees are measured
at the fair value of equity instruments granted to employees. Share-based payment transactions vested
immediately after the date of grant shall be included in the relevant cost or expense based on the fair value of
equity instruments at the date of grant, and the capital reserve shall be increased accordingly. For share-based
payment transactions vested only when the services during the waiting period are completed or the specified
performance conditions are satisfied after the grant, the Company shall, at each balance sheet date during the
waiting period, include the services obtained during the period in relevant cost or expense at the fair value of
the date of grant, according to the best estimate of the number of vested equity instruments, and the capital
reserve shall be increased accordingly.
If the terms of the equity-settled share-based payments are amended, the Company shall recognize the
services received at least based on the situation before the amendment is made. In addition, any amendment
resulting in the increase of the fair value of the equity instrument granted or changes that are beneficial to
employees on the amendment date, will be recognized as an increase in the service received.
During the waiting period, if the granted equity instrument is cancelled, the Company will accelerate the
vesting thereof, immediately include the remaining amount that should be recognized in the waiting period in
the current profit or loss, and recognize the capital reserve. However, if new equity instruments are vested and

Annual Report 2020
134 / 244
they are verified at the vesting date of new equity instrument as alternatives vested to cancel equity instruments,
the treatment on the new equity instrument is in conformity with the modified treatment on disposal of equity
instrument.
(2) Cash-settled share-based payments and equity instruments
Cash-settled share-based payments are measured at the fair value of the liabilities calculated and
determined on the basis of shares or other equity instruments undertaken by the Company. Share-based payment
transactions vested immediately after the date of grant shall be included in the relevant cost or expense based
on the fair value of liabilities undertook at the date of grant, and the liabilities shall be increased accordingly.
For share-based payment transactions vested only when the services during the waiting period are completed or
the specified performance conditions are satisfied after the grant, the Company shall include the services
obtained during the period in relevant cost or expense at the fair value of the liabilities undertook by the
Company based on the best estimate of the vesting situation, and the liabilities shall be included accordingly.
At each balance sheet date before the settlement and the settlement date of relevant liabilities, the fair value of
the liabilities is remeasured, and its changes are included in the current profit or loss.
37. Preference shares, perpetual bonds and other financial instruments
"□ Applicable" "√ Not applicable"
38. Revenue
(1). Accounting policies used in recognition and measurement of revenue
"√ Applicable" "□ Not applicable"
Accounting policies from 1 January 2020
The Company recognizes revenue when its performance obligations in the contract are fulfilled, that is,
the control over the relevant goods or services is obtained by the customer. Obtaining control over related goods
or services means being able to lead the use of the goods or services and obtain almost all of the economic
benefits from the goods or services.
If the contract contains two or more performance obligations, the Company will, at the date of the contract,
allocate the transaction price to each individual performance obligation in accordance with the relative
proportion of the stand-alone selling price of the goods or services promised by each individual performance
obligation. The Company measures revenue based on the transaction price allocated to each individual
performance obligation.
Transaction price refers to the amount of consideration that the Company expects to be entitled to receive
due to the transfer of goods or services to customers, excluding amounts collected on behalf of third parties and
amounts expected to be returned to customers. The Company determines the transaction price in accordance
with the terms of the contract and combined with its past customary practices. When determining the transaction
price, the Company considers the impact of variable consideration, major financing components in the contract,
non-cash consideration, consideration payable to customers and other factors. The Company determines the
transaction price that includes variable consideration at an amount that does not exceed the amount of
accumulated recognized revenue that is unlikely to be significantly reversed when the relevant uncertainty is
eliminated. If there is a major financing component in the contract, the Company determines the transaction
price based on the amount payable in cash when the customer obtains control over the goods or services, and
Annual Report 2020
135 / 244
amortizes the difference between the transaction price and the contract consideration with the actual interest
rate method during the contract period.
The performance obligation is fulfilled during a certain period of time if one of the following conditions is
satisfied, otherwise, the performance obligation is fulfilled at a certain point in time:
• the customer obtains and consumes the economic benefits brought by the Company's performance at the
same time as the Company's performance.
• the customer can control the products under construction during the Company's performance.
• the goods produced during the Company's performance have irreplaceable uses, and the Company has
the right to collect payment for the cumulative performance part that has been completed so far during the entire
contract period.
For performance obligations performed within a certain period of time, the Company recognizes revenue
in accordance with the performance progress during that period, except where the performance progress cannot
be reasonably determined. The Company considers the nature of the goods or services and adopts the output
method or the input method to determine the performance progress. When the performance progress cannot be
reasonably determined, and the cost incurred is expected to be compensated, the Company recognizes the
revenue according to the amount of the cost incurred until the performance progress can be reasonably
determined.
For performance obligations performed at a certain point in time, the Company recognizes revenue at the
point when the customer obtains control over the relevant goods or services. When judging whether the
customer has obtained control over goods or services, the Company considers the following signs:
• the Company has the current right to receive payment for the goods or services, that is, the customer has
the current payment obligation for the goods or services;
• the Company has transferred the legal ownership of the goods to the customer, that is, the customer has
the legal ownership of the goods;
• the Company has transferred the goods to the customer in kind, that is, the customer has taken possession
of the goods in kind;
• the Company has transferred the main risks and rewards of the ownership of the goods to the customer,
that is, the customer has obtained the main risks and rewards of the ownership of the goods;
• the customer has accepted the goods or services.
Accounting policies before 1 January 2020
① General principle of recognition of revenue from sales of goods
A. All the significant risks and rewards of ownership of the goods have been transferred to the buyer;
B. the Company does not retain either continuing managerial involvement to the degree usually associated
with ownership or effective control over the goods sold;
C. The amount of revenue can be reliably measured;
D. It is probable that relevant economic benefits will flow to the Company;
E. The relevant amount of costs incurred or to be incurred can be measured reliably.
② Specific principles
A. Timing of revenue recognition for regional sales and overseas sale (export agent): Shanghai: sales
revenue is recognized after goods are delivered; regions other than Shanghai: sales revenue is recognized after
goods are delivered and delivery documents are confirmed with signature from the logistic companies;

Annual Report 2020
136 / 244
B. Timing of revenue recognition for KA sales: sales revenue is recognized after goods are delivered and
delivery documents are confirmed with signature from the logistic companies;
C. Timing of revenue recognition for self-managing and export business: revenue is recognized when the
goods pass the ship’s rail in the port of shipment under the term of FOB;
D. Timing of revenue recognition for direct sales of office supplies: sales revenue is recognized after goods
are delivered and confirmed by customers;
E. Timing of revenue recognition for direct sales large flagship store: sales revenue is recognized after
goods are delivered and confirmed by customers.
(2). Differences in accounting policies for revenue recognition caused by the adoption of different
operation models for similar businesses
"□ Applicable" "√ Not applicable"
39. Contract cost
"√ Applicable" "□ Not applicable"
Accounting policies from 1 January 2020
Contract cost includes contract performance cost and contract acquisition cost.
If the cost incurred by the Company for the performance of the contract does not fall within the scope of
relevant standards and regulations for inventories, fixed assets or intangible assets, it shall be recognized as an
asset as the contract performance cost when the following conditions are met:
• the cost is directly related to a current or expected contract;
• the cost increases the Company's future resources for fulfilling its performance obligations;
• the cost is expected to be recovered.
If the incremental cost incurred by the Company to obtain the contract is expected to be recovered, it will
be recognized as an asset as the cost of obtaining the contract.
Assets related to contract costs are amortized on the same basis as the revenue recognition of goods or services
related to the assets; however, if the amortization period of cost of obtaining the contract does not exceed
one year, the Company will include it in the current profit or loss when it occurs.
If the carrying value of the assets related to the contract cost is higher than the difference between the
following two items, the Company will make provision for impairment of the excess part and recognize it as an
asset impairment loss:
(1) the remaining consideration expected to be obtained due to the transfer of goods or services related to
the assets; and
(2) the costs expected to be incurred due to the transfer of the related goods or services.
If the depreciation factors in the previous period change later, causing the aforementioned difference to be
higher than the carrying value of the assets, the Company will reverse the previously-made provision for
impairment and include it in the current profit or loss, but the carrying value of the assets after the reversal
cannot exceed the carrying value of the assets at the date of reversal under the assumption that no provision is
made for the impairment.
40. Government subsidies
"√ Applicable" "□ Not applicable"
(1) Types

Annual Report 2020
137 / 244
Government subsidies are monetary or non-monetary assets obtained by the Company from the
government free of charge. They are divided into government subsidies related to assets and government
subsidies related to income.
Government subsidies related to assets refers to government subsidies obtained by the Company that are
used to purchase or construct or otherwise form long-term assets. Government subsidies related to income refer
to the government subsidies other than government subsidies related to assets.
The specific standards for the Company to classify government subsidies into asset-related government
subsidies are as follows:
If obtained subsidies are used to purchase, construct or otherwise form fixed assets, intangible assets and
other long-term assets as expressly stipulated in government documents, then such subsidies are deemed as
asset-related government subsidies.
The specific standards for the Company to classify government subsidies into income-related government
subsidies are as follows:
If the government subsidies (excluding asset-related subsidies) are used to compensate relevant costs or
losses of the Company that have been already incurred or to be incurred in subsequent periods, then such
subsidies are deemed as income-related government subsidies.
Where there is no express regulation on the grant object in government documents, then the Company will
classify government subsidies as assets related or as income related depending on the specific purpose that the
subsidies are used for.
(2) Timing of recognition
Government subsidies are recognized when the subsidies are received actually or when the rights to get
government subsidies are obtained and it is basically certain that the subsidies can be received.
(3) Accounting treatment
Government subsidies related to assets shall offset the carrying amount of relevant assets or be recognized
as deferred income. If it is recognized as deferred income, it shall be included in the current profit and loss in a
reasonable and systematic way within the useful life of the relevant assets (if it is related to the daily activities
of the Company, it shall be included in other income; otherwise, it shall be included in the non-operating
income);
Government subsidies related to income that are used for compensation for the relevant costs or losses of
the Company in subsequent periods are recognized as deferred income and are included in the current profit or
loss in the period in which the relevant costs, expenses or losses are recognized (if it is related to the daily
activities of the Company, it shall be included in other income; otherwise, it shall be included in the non-
operating income) or offset the relevant costs or losses; government subsidies related to income that are used
for compensation for the relevant costs or losses that the Company has already incurred shall be directly
included in the current profit or loss (if it is related to the daily activities of the Company, it shall be included
in other income; otherwise, it shall be included in the non-operating income) or offset the relevant costs or
losses.
The Company's policy-based concessional loans are classified into the following two conditions and are
accounted for respectively:
① If the lending bank provides loans to the Company at a policy-based preferential interest rate after the
Ministry of Finance allocates the interest-grant funds to the lending bank, the actual borrowing amount received

Annual Report 2020
138 / 244
is recognized as the entry value of the borrowing and the relevant borrowing expenses are measured in
accordance with the principal amount of the borrowing and policy-based preferential interest rate.
② When the government directly distributes the interest-grant funds to the Company, the corresponding
discount will offset the relevant borrowing costs.
41. Deferred income tax assets and liabilities
"√ Applicable" "□ Not applicable"
Income taxes include current income tax and deferred income tax. Except for income tax arising from
business combination and transactions or events that are directly included in owners' equity (including other
comprehensive income), the Company includes current income tax and deferred income tax in the current profit
or loss.
Deferred income tax assets and deferred income tax liabilities are calculated and recognized based on the
difference (temporary difference) between the tax base of assets and liabilities and their carrying value.
Deferred tax assets are recognized to the extent that it is probable that future taxable profits will be available
against which deductible temporary differences can be offset. For deductible losses and tax credits that can be
reversed in the future period, deferred tax assets shall be recognized to the extent that it is probable that taxable
profit will be available in the future to offset the deductible losses and tax credits.
Save as the exceptions, deferred tax liabilities shall be recognized for the taxable temporary difference.
The exceptions for not recognizing deferred tax assets and liabilities include:
the initial recognition of the goodwill;
other transactions or matters other than enterprise merger in which neither profit nor taxable income (or
deductible loss) will be affected when transactions occur.
Deferred income tax liabilities are recognized for all taxable temporary differences arising from the
investments in subsidiaries, joint ventures and associates, except to the extent that both of the following
conditions are satisfied: the Company is able to control the timing of the reversal of the temporary differences;
and it is likely that the temporary difference will not reverse in the foreseeable future. Deferred income tax
assets are recognized for all deductible temporary differences associated with investments in subsidiaries, joint
ventures and associates if all of the following conditions are satisfied: It is likely that the deductible temporary
difference will reverse in the foreseeable future and it is likely that taxable profit in the future will be available
against which the deductible temporary difference can be offset.
At the balance sheet date, deferred income tax assets and liabilities are measured at tax rates expected to
be applied to the period when the assets are recovered or the liabilities are settled according to the tax law.
At the balance sheet date, the Company reviews the carrying value of deferred income tax assets. The
carrying value of the deferred income tax assets are reduced if it is unlikely to obtain sufficient taxable income
to offset the benefit of the deferred income tax assets in the future. When it is likely that sufficient taxable
income will be available, the amount of write-down is reversed.
When the Group has a legal right to settle on a net basis and intends either to settle on a net basis or to
realize the assets and settle the liabilities simultaneously, current tax assets and current tax liabilities are offset
and presented on a net basis.
At the balance sheet date, the deferred income tax assets and the deferred income tax liabilities are offset
and presented on a net basis when all of the following conditions are satisfied:
• the taxable entity has a legal right to settle current income tax assets and liabilities on a net basis; and
• deferred income tax assets and deferred income tax liabilities relate to income taxes levied by the same
taxation authority on either the same taxable entity or different taxable entities which intend either to settle

Annual Report 2020
139 / 244
current tax assets and liabilities on a net basis or to realize the assets and liabilities simultaneously, in each
future period in which significant amounts of deferred tax assets or liabilities are expected to be reversed.
42. Lease
(1). Accounting treatment method of operating lease
"√ Applicable" "□ Not applicable"
① the Company's rental expenses paid for leased assets shall be amortized at straight-line method over
the whole lease period (including rent-free period) and will be included in the current expenses. Initial direct
expenses related to lease transactions paid by the Company shall be included in current expenses.
When the lessor of assets bears expenses related to the lease which shall be borne by the Company, the Company
shall deduct the part of expenses from the total rents and amortize the rents after deduction over the lease term
and include them in current expenses.
② the Company's rental expenses collected for leased assets shall be amortized at straight-line method
over the whole lease period (including rent-free period) and recognized as the relevant rental income. Initial
direct costs related to lease transactions and paid by the Company are included in current expenses; in case of a
large amount, such costs shall be capitalized and then included in the current revenue by stages at the same base
as the recognition of rental income over the whole lease term.
When the Company bears expenses related to the lease which shall be borne by the lessee, the Company
shall deduct the part of expenses from the total rental income and amortize the rents after deduction over the
lease term.
(2). Accounting treatment method of financing lease
"√ Applicable" "□ Not applicable"
① Assets acquired under financing leases: At the commencement of the lease term, assets acquired under
financing leases shall be recorded at the lower of their fair values and the present values of the minimum lease
payments, and the Company shall recognize the long-term payables at amounts equal to the minimum lease
payments,and shall record the differences between book value of the leased assets and the long-term payables
as unrecognized financing expenses. The Company adopts the effective interest rate method for unrecognized
financing expenses, which shall be amortized over the lease terms and included in financial expenses. Initial
direct expenses incurred to the Company shall be included in the value of the leased assets.
② Assets leased out under financing leases: On the lease beginning date, the Company recognizes the
difference between the sum of financing lease receivable and the unguaranteed residual value, and the present
value thereof as unrealized financing income, and recognizes them as rental income over the periods when the
rents are received in the future. Initial direct expenses related to the rental transactions incurred to the Company
shall be included in the initial measurement of the financing lease receivables and the amount of income
recognized in the lease term will be reduced.
(3). Determination method and accounting treatment method of lease under new lease standards
"□ Applicable" "√ Not applicable"
43. Other significant accounting policies and accounting estimates
"√ Applicable" "□ Not applicable"

Annual Report 2020
140 / 244
Discontinued operation is a component that satisfies one of the following conditions and is separately
identifiable, and has been disposed of by the Company or is classified by the Company as held for sale:
(1) It represents a separate major line of business or geographical area of operations;
(2) It is part of a single coordinated plan to dispose of a separate major line of business or geographical
area of operations; or
(3) It is a subsidiary acquired exclusively with a view to resale.
The profit and loss from continuing operations and the profit and loss from discontinued operations are
separately presented in the income statement. Operational gains and losses such as impairment losses and
reversal amounts and disposal gains and losses from discontinued operations are reported as gains and losses
from discontinued operations. For the discontinued operations reported in the current period, the Company re-
reports the information previously reported as profits and losses from continuing operations as the profits and
losses from discontinued operations for the comparable accounting period in the current financial statements.
44. Changes in significant accounting policies and accounting estimates
(1). Changes in significant accounting policies
"√ Applicable" "□ Not applicable"
Contents and reasons of changes in accounting
policies
Review and approval
procedure
Remarks (name and amount
of report items affected
materially)
Implementation of the Notice of the Ministry of
Finance on Revising and Issuing the Accounting
Standards for Business Enterprises No. 14 -
Revenue (Cai Kuai [2017] No. 22)
The 20th meeting of the
fourth Board of Directors
See Other description l
Other descriptions
1. Implementation of the Accounting Standards for Business Enterprises No. 14 - Revenue (revised in
2017)
The Ministry of Finance revised the Accounting Standards for Business Enterprises No. 14 - Revenue
(hereinafter referred to as the "New Revenue Standards") in 2017. The revised standards stipulate that for the
first implementation of the standards, the amounts of retained earnings and other related items in the financial
statements at the beginning of the year should be adjusted according to the cumulative impact, and the
information for the comparable period should not be adjusted.
The Company implements the new revenue standards from 1 January 2020. According to the provisions
of the new revenue standards, the Company only adjusted the amounts of retained earnings and other related
items in the financial statements at the beginning of 2020 for the cumulative impact of contracts that have not
been completed on the date of first implementation, and did not make adjustments to the comparative financial
statements. The main impacts of the implementation of the standards are as follows:
Contents and reasons of changes in
accounting policies
Review and
approval
procedure
Affected item in
statement
Effect on balance at 1 January 2020
Consolidation Parent company
(1) The original revenue from the e-
commerce platform business is
The 20th
meeting of
Accounts receivable 47,244,304.93
Inventories -35,291,780.35

Annual Report 2020
141 / 244
recognized at the time of the receipt of
the platform statement. Due to the
implementation of the new revenue
standards, the revenue is recognized at
the time of the transfer of control,
namely it is recognized when the e-
commerce platform actually accepts and
warehouses the products.
the fourth
Board of
Directors
Deferred income tax
assets -1,208,991.72
Undistributed profit 10,596,781.73
Minority equity 146,751.13
(2) Reclassification of accounts received
in advance arising from sales contracts to
contract liabilities
The 20th
meeting of
the fourth
Board of
Directors
Contract liabilities 182,975,481.36 103,292,286.89
Other current
liabilities 23,786,812.58 13,427,997.30
Accounts received in
advance -206,762,293.94 -116,720,284.19
Compared with the original revenue standards, the impacts of the implementation of the new revenue
standards on the relevant items of the 2020 financial statements are as follows (increase/decrease):
Affected item in balance sheet Effect on balance at 31 December 2020
Consolidation Parent company
Accounts receivable 71,949,017.96
Inventories -52,850,926.86
Deferred income tax assets -619,504.51
Accounts received in advance -127,846,125.32 -86,209,335.15
Contract liabilities 114,100,035.35 76,291,447.04
Taxes payable 9,092,049.66
Other current liabilities 13,746,089.97 9,917,888.11
Undistributed profit 9,156,410.72
Minority equity 230,126.21
Affected item in income statement Effect on amount incurred in 2020
Consolidation Parent company
Revenue 22,717,752.44
Operation cost 126,244,555.60 23,728,733.05
Selling expenses -77,637,937.98 7,318,738.06
Administrative expenses -31,047,471.11 -31,047,471.11
Credit impairment losses -1,269,284.91

Annual Report 2020
142 / 244
Income tax expenses -210,406.66
Net profit -1,356,995.93
2. Implementation of the Interpretation of Accounting Standards for Business Enterprises No. 13
The Ministry of Finance issued the Interpretation of Accounting Standards for Business Enterprises No.
13 (Cai Kuai [2019] No. 21, hereinafter referred to as "Interpretation No. 13") on 10 December 2019, which
comes into force on 1 January 2020. No retrospective adjustment is required.
(1) Determination of related parties
Interpretation No. 13 clarifies that the following circumstances constitute a related party: a joint venture or
associate between an enterprise and other member units (including parent companies and subsidiaries) of the
enterprise group to which it belongs; a joint venture of an enterprise and other joint ventures or associates of
the enterprise. In addition, Interpretation No. 13 clarifies that two or more companies that are only significantly
affected by one party do not constitute related parties. It also adds that associates include associates and their
subsidiaries, and joint ventures include joint ventures and their subsidiaries.
(2) Definition of business
Interpretation No. 13 completes the three elements of business composition, refines the judgment
conditions of the business composition, and introduces the "concentration test" option to simplify to a certain
extent the judgment of whether a combination obtained not under common control constitutes a business.
The Company implements Interpretation No. 13 from 1 January 2020, and the comparative financial
statements are not adjusted. The implementation of Interpretation No. 13 had no significant impact on the
Company's financial status and operating results.
3. Implementation of the Interim Provisions on the Accounting Treatment of Carbon Emission Permit
Trading
On 16 December 2019, the Ministry of Finance issued the Interim Provisions on the Accounting Treatment
of Carbon Emission Permit Trading (Cai Kuai [2019] No. 22), which is applicable to related companies in the
key emission units engaged in the trading business of carbon emission rights in accordance with the Interim
Measures for the Administration of Carbon Emission Permit Trading and other relevant regulations (hereinafter
referred to as "key emission companies"). The Provisions come into effect on 1 January 2020, and key emission
companies should adopt the future applicable law to apply the Provisions.
The Company implements the Provisions from 1 January 2020, and the comparative financial statements
are not adjusted. The implementation of the Provisions had no significant impact on the Company's financial
status and operating results.
4. Implementation of the Provisions on the Accounting Treatment of the COVID-19 Pandemic-related
Rental Concessions
On 19 June 2020, the Ministry of Finance issued the Provisions on the Accounting Treatment of the
COVID-19 Pandemic-related Rental Concessions (Caikuai (2020) No. 10) with immediate effect, allowing
companies to adjust relevant rental concessions incurred between 1 January 2020 and the implementation date
of the Provisions. According to the Provisions, companies can resort to a simplified method for accounting
treatment for rental reductions, deferred rent payment and other rental concessions relating to COVID-19
pandemic that meet the stipulations of the Provisions.

Annual Report 2020
143 / 244
The Company used the simplified method for accounting treatment for all rental concessions that fall
within the scope of the Provisions, and adjusted the relevant rent concessions incurred between 1 January 2020
and the effective date of the Provisions accordingly.
As the lessee, the Company adopted a simplified method to deal with related rental concessions to offset
the current operating costs, management expenses and sales expenses totaling RMB 12,799,186.64.
(2). Changes in significant accounting estimates
"□ Applicable" "√ Not applicable"
(3). Particulars on adjustment to the financial statements for the year due to the first implementation of
new standards for revenues or new standards for lease from 2020
"√ Applicable" "□ Not applicable"
Consolidated Balance Sheet
Unit: Yuan Currency: RMB
Item 31 December 2019 1 January 2020 Adjustment amount
Current assets:
Cash and equivalents 1,935,600,694.35 1,935,600,694.35
Transaction settlement funds
Lending funds
Held-for-trading financial assets 661,878,587.24 661,878,587.24
Derivative financial assets
Bills receivable
Accounts receivable 1,026,094,724.15 1,073,339,029.08 47,244,304.93
Receivables financing 29,549,924.83 29,549,924.83
Prepayment 85,371,444.73 85,371,444.73
Premium receivable
Reinsurance premium receivable
Reserves for reinsurance contract
receivable
Other receivables 117,647,039.93 117,647,039.93
Including: Interest receivable
Dividend receivable
Financial assets purchased under
agreements to resell
Inventories 1,378,108,759.85 1,342,816,979.50 -35,291,780.35
Contract assets
Held for sale assets
Non-current assets due within one
year
Other current assets 29,280,925.29 29,280,925.29
Total current assets 5,263,532,100.37 5,275,484,624.95 11,952,524.58
Non-current assets:
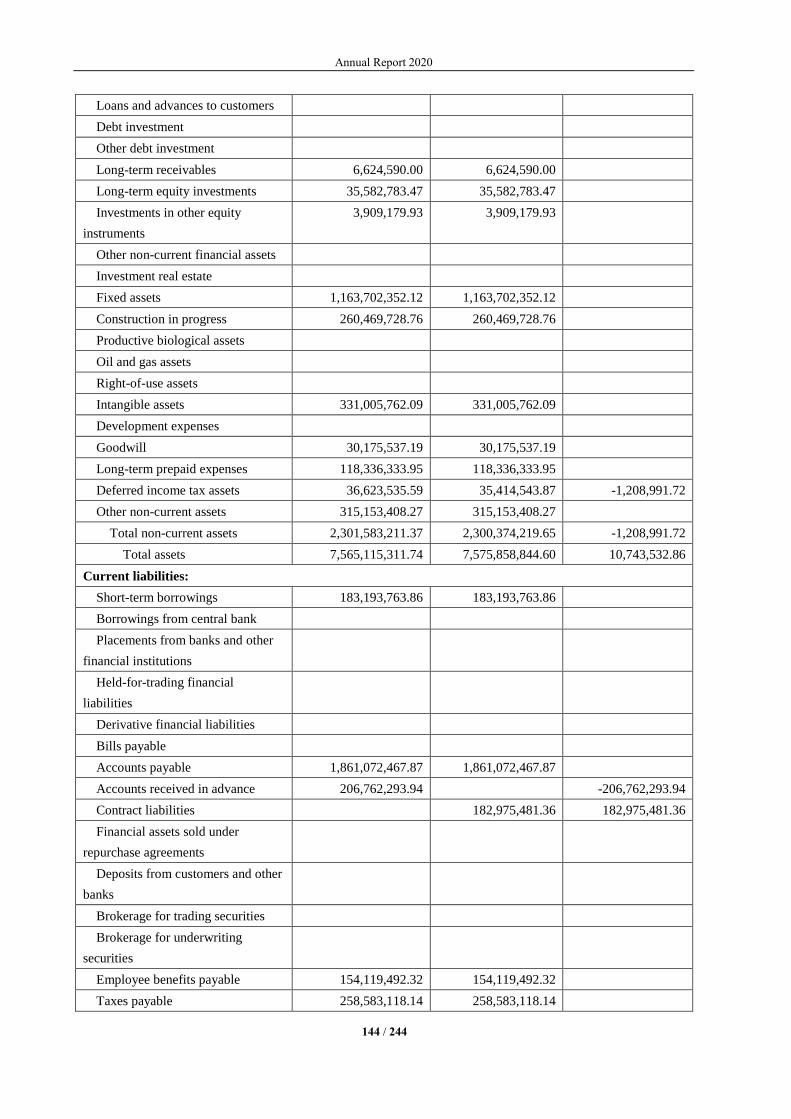
Annual Report 2020
144 / 244
Loans and advances to customers
Debt investment
Other debt investment
Long-term receivables 6,624,590.00 6,624,590.00
Long-term equity investments 35,582,783.47 35,582,783.47
Investments in other equity
instruments
3,909,179.93 3,909,179.93
Other non-current financial assets
Investment real estate
Fixed assets 1,163,702,352.12 1,163,702,352.12
Construction in progress 260,469,728.76 260,469,728.76
Productive biological assets
Oil and gas assets
Right-of-use assets
Intangible assets 331,005,762.09 331,005,762.09
Development expenses
Goodwill 30,175,537.19 30,175,537.19
Long-term prepaid expenses 118,336,333.95 118,336,333.95
Deferred income tax assets 36,623,535.59 35,414,543.87 -1,208,991.72
Other non-current assets 315,153,408.27 315,153,408.27
Total non-current assets 2,301,583,211.37 2,300,374,219.65 -1,208,991.72
Total assets 7,565,115,311.74 7,575,858,844.60 10,743,532.86
Current liabilities:
Short-term borrowings 183,193,763.86 183,193,763.86
Borrowings from central bank
Placements from banks and other
financial institutions
Held-for-trading financial
liabilities
Derivative financial liabilities
Bills payable
Accounts payable 1,861,072,467.87 1,861,072,467.87
Accounts received in advance 206,762,293.94 -206,762,293.94
Contract liabilities 182,975,481.36 182,975,481.36
Financial assets sold under
repurchase agreements
Deposits from customers and other
banks
Brokerage for trading securities
Brokerage for underwriting
securities
Employee benefits payable 154,119,492.32 154,119,492.32
Taxes payable 258,583,118.14 258,583,118.14

Annual Report 2020
145 / 244
Other payables 331,438,976.35 331,438,976.35
Including: Interest payable
Dividend payable
Fees and commissions payable
Reinsured accounts payable
Held-for-sale liabilities
Non-current liabilities due within
one year
Other current liabilities 23,786,812.58 23,786,812.58
Total current liabilities 2,995,170,112.48 2,995,170,112.48
Non-current liabilities:
Reserves for insurance contracts
Long-term borrowings
Bonds payable
Including: Preference shares
Perpetual bonds
Lease liabilities
Long-term payables 6,620,000.00 6,620,000.00
Long-term employee benefits
payable
Estimated liabilities
Deferred income 65,823,213.11 65,823,213.11
Deferred income tax liabilities 36,576,744.55 36,576,744.55
Other non-current liabilities
Total non-current liabilities 109,019,957.66 109,019,957.66
Total liabilities 3,104,190,070.14 3,104,190,070.14
Owner’s equity (or shareholders’ equity):
Share capital 920,000,000.00 920,000,000.00
Other equity instruments
Including: Preference shares
Perpetual bonds
Capital reserve 272,347,764.53 272,347,764.53
Less: Treasury shares
Other comprehensive income 526,359.55 526,359.55
Special reserve
Surplus reserve 440,260,399.59 440,260,399.59
General risk provision
Undistributed profit 2,568,365,861.32 2,578,962,643.05 10,596,781.73
Total equity attributable to the
owners of the parent company
4,201,500,384.99 4,212,097,166.72 10,596,781.73
Minority equity 259,424,856.61 259,571,607.74 146,751.13
Total owners’ equity (or
shareholders’ equity)
4,460,925,241.60 4,471,668,774.46 10,743,532.86

Annual Report 2020
146 / 244
Total liabilities and owner's
equity (or shareholders’ equity)
7,565,115,311.74 7,575,858,844.60 10,743,532.86
Description on adjustment to relevant items:
"□ Applicable" "√ Not applicable"
Parent Company’s Balance Sheet
Unit: Yuan Currency: RMB
Item 31 December 2019 1 January 2020 Adjustment
amount
Current assets:
Cash and equivalents 1,358,805,872.56 1,358,805,872.56
Held-for-trading financial assets 509,467,061.37 509,467,061.37
Derivative financial assets
Bills receivable
Accounts receivable 82,949,224.65 82,949,224.65
Receivables financing
Prepayment 9,630,209.45 9,630,209.45
Other receivables 285,036,794.54 285,036,794.54
Including: Interest receivable 192,500.00 192,500.00
Dividend receivable
Inventories 448,245,658.48 448,245,658.48
Contract assets
Held for sale assets
Non-current assets due within
one year
Other current assets 150,047,540.99 150,047,540.99
Total current assets 2,844,182,362.04 2,844,182,362.04
Non-current assets:
Debt investment
Other debt investment
Long-term receivables 6,624,590.00 6,624,590.00
Long-term equity investments 1,089,168,192.56 1,089,168,192.56
Investments in other equity
instruments
3,909,179.93 3,909,179.93
Other non-current financial assets
Investment real estate
Fixed assets 749,415,024.84 749,415,024.84
Construction in progress 258,864,834.00 258,864,834.00
Productive biological assets
Oil and gas assets
Right-of-use assets
Intangible assets 182,268,368.82 182,268,368.82

Annual Report 2020
147 / 244
Development expenses
Goodwill
Long-term prepaid expenses 10,106,589.01 10,106,589.01
Deferred income tax assets 5,469,359.66 5,469,359.66
Other non-current assets 311,929,028.24 311,929,028.24
Total non-current assets 2,617,755,167.06 2,617,755,167.06
Total assets 5,461,937,529.10 5,461,937,529.10
Current liabilities:
Short-term borrowings
Held-for-trading financial
liabilities
Derivative financial liabilities
Bills payable
Accounts payable 225,831,712.59 225,831,712.59
Accounts received in advance 116,720,284.19 -116,720,284.19
Contract liabilities 103,292,286.89 103,292,286.89
Employee benefits payable 87,609,891.62 87,609,891.62
Taxes payable 160,129,252.33 160,129,252.33
Other payables 513,035,659.92 513,035,659.92
Including: Interest payable
Dividend payable
Held-for-sale liabilities
Non-current liabilities due within
one year
Other current liabilities 13,427,997.30 13,427,997.30
Total current liabilities 1,103,326,800.65 1,103,326,800.65
Non-current liabilities:
Long-term borrowings
Bonds payable
Including: Preference shares
Perpetual bonds
Lease liabilities
Long-term payables 258,620,000.00 258,620,000.00
Long-term employee benefits
payable
Estimated liabilities
Deferred income 28,453,779.37 28,453,779.37
Deferred income tax liabilities 1,420,059.21 1,420,059.21
Other non-current liabilities
Total non-current liabilities 288,493,838.58 288,493,838.58
Total liabilities 1,391,820,639.23 1,391,820,639.23
Owner’s equity (or shareholders’ equity):
Share capital 920,000,000.00 920,000,000.00
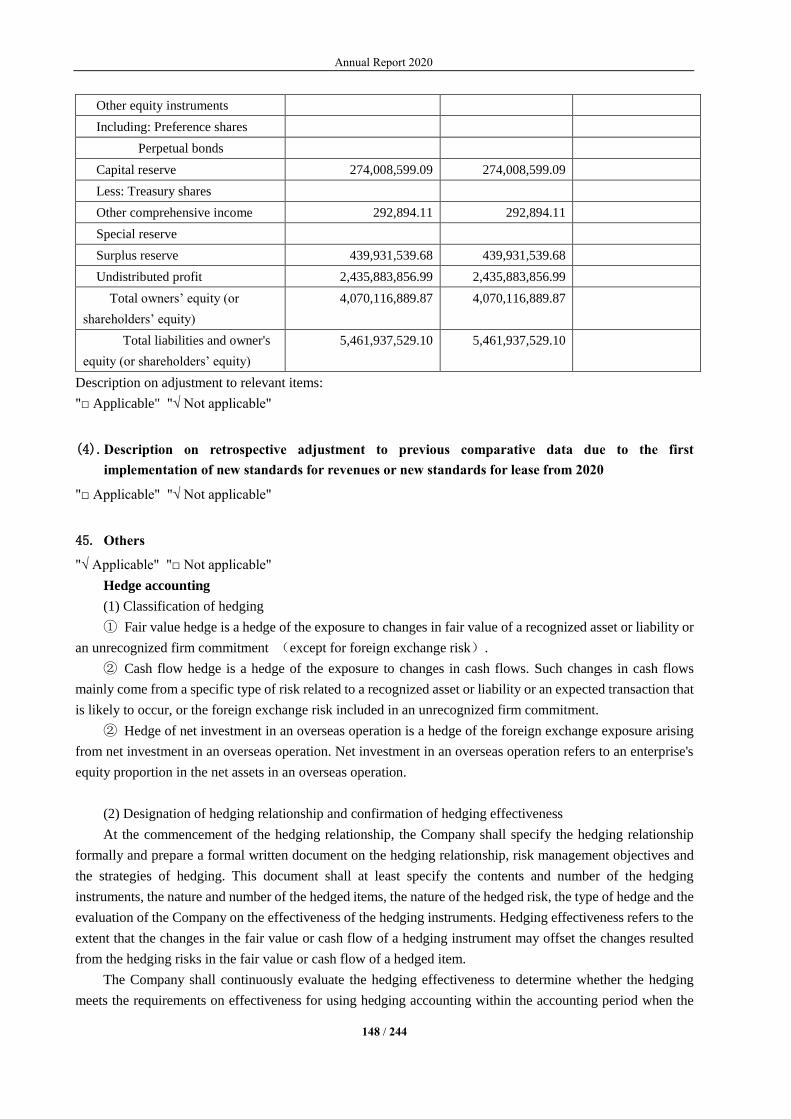
Annual Report 2020
148 / 244
Other equity instruments
Including: Preference shares
Perpetual bonds
Capital reserve 274,008,599.09 274,008,599.09
Less: Treasury shares
Other comprehensive income 292,894.11 292,894.11
Special reserve
Surplus reserve 439,931,539.68 439,931,539.68
Undistributed profit 2,435,883,856.99 2,435,883,856.99
Total owners’ equity (or
shareholders’ equity)
4,070,116,889.87 4,070,116,889.87
Total liabilities and owner's
equity (or shareholders’ equity)
5,461,937,529.10 5,461,937,529.10
Description on adjustment to relevant items:
"□ Applicable" "√ Not applicable"
(4). Description on retrospective adjustment to previous comparative data due to the first
implementation of new standards for revenues or new standards for lease from 2020
"□ Applicable" "√ Not applicable"
45. Others
"√ Applicable" "□ Not applicable"
Hedge accounting
(1) Classification of hedging
① Fair value hedge is a hedge of the exposure to changes in fair value of a recognized asset or liability or
an unrecognized firm commitment (except for foreign exchange risk).
② Cash flow hedge is a hedge of the exposure to changes in cash flows. Such changes in cash flows
mainly come from a specific type of risk related to a recognized asset or liability or an expected transaction that
is likely to occur, or the foreign exchange risk included in an unrecognized firm commitment.
② Hedge of net investment in an overseas operation is a hedge of the foreign exchange exposure arising
from net investment in an overseas operation. Net investment in an overseas operation refers to an enterprise's
equity proportion in the net assets in an overseas operation.
(2) Designation of hedging relationship and confirmation of hedging effectiveness
At the commencement of the hedging relationship, the Company shall specify the hedging relationship
formally and prepare a formal written document on the hedging relationship, risk management objectives and
the strategies of hedging. This document shall at least specify the contents and number of the hedging
instruments, the nature and number of the hedged items, the nature of the hedged risk, the type of hedge and the
evaluation of the Company on the effectiveness of the hedging instruments. Hedging effectiveness refers to the
extent that the changes in the fair value or cash flow of a hedging instrument may offset the changes resulted
from the hedging risks in the fair value or cash flow of a hedged item.
The Company shall continuously evaluate the hedging effectiveness to determine whether the hedging
meets the requirements on effectiveness for using hedging accounting within the accounting period when the

Annual Report 2020
149 / 244
hedging relationship is specified. If the hedging fails to meet the requirements, the use of hedging relationship
shall be terminated.
The use of hedge accounting shall meet the following requirements for the hedging effectiveness:
① There is an economic relationship between the hedged item and the hedging instrument.
② In the value change caused by the economic relationship between the hedged item and the hedging
instrument, the influence of credit risk is not dominant.
③ An appropriate hedging ratio is adopted, and this ratio will not form an imbalance in the relative weight
of the hedged item and the hedging instrument, thereby generating accounting results that are inconsistent with
the hedge accounting objectives. If the hedging ratio is no longer appropriate, but the hedging risk management
objectives have not changed, the number of hedged items or hedging instruments shall be adjusted so that the
hedging ratio meets the requirements on effectiveness again.
(3) Accounting treatment method of hedge
① Fair value hedge
Changes in the fair value of hedging derivatives are included in the current profit and loss. Changes in the
fair value of a hedged item due to hedging risk are included in the current profit and loss, while adjusting the
book value of the hedged item.
For fair value hedges related to financial instruments measured at amortized cost, adjustments to the
carrying value of the hedged item are amortized in the remaining period between the adjustment date and the
maturity date and are included in the current profit and loss. Amortization carried out in accordance with the
effective interest rate method can begin immediately after the adjustment of the carrying value, and shall not be
later than the adjustment made due to the changes in the fair values caused by the hedging risk after the hedged
item is terminated.
If the hedged item is derecognized, the un-amortized fair value is recognized as current profit or loss.
If the hedged item is a unrecognized firm commitment, the accumulated changes in the fair value of the
firm commitment caused due to the hedged risk is recognized as an asset or liability, and the related gains or
losses are included in the current profit and loss. Changes in the fair value of hedging instruments are also
included in the current profit and loss.
② Cash flow hedge
The portion of the gains or losses from hedging instruments, which belongs to the effective hedge, shall be
directly recognized as other comprehensive income, and the portion which belongs to the ineffective hedge shall
be included in the current profit and loss.
If the hedged transaction affects the current profit or loss, for example, when the hedged financial income
or financial expense is confirmed or the expected sale occurs, the amount recognized in other comprehensive
income will be transferred to the current profit and loss. If the hedged item is the cost of a non-financial asset
or liability, the amount originally recognized in other comprehensive income is transferred out and included in
the initial recognition amount of the non-financial asset or liability (or the amount originally recognized in other
comprehensive income is transferred out in the same period in which the non-financial asset or liability affects
the profit and loss, and included in the current profit and loss).
If the expected transaction or firm commitment is not expected to occur, the cumulative gains or losses of
hedging instruments previously included in other comprehensive income are transferred out and included in the
current profit or loss. If the hedging instrument expires, is sold, terminated or exercised (but has not been
replaced or extended), or the designation of the hedging relationship is revoked, the amount previously included

Annual Report 2020
150 / 244
in other comprehensive income will not be transferred out until the expected transaction or firm commitment
affects the current profit and loss.
③ Hedge of net investment in an overseas operation
Hedge of net investment in an overseas operation, including hedge of monetary items as part of net
investment, is handled similarly to cash flow hedge. The portion of the gains or losses from hedging instruments,
which is recognized as effective hedge, shall be recorded in other comprehensive income, and the portion which
is recognized as ineffective hedge shall be included in the current profit and loss. When disposing of overseas
operations, any accumulated gains or losses included in other comprehensive income are transferred out and
included in the current profit or loss.
Segment Report
The Company determines the operating segment based on the internal organizational structure,
management requirements, and internal reporting system, and determines the reporting segment based on the
operating segment and discloses segment information.
Operating segment refers to the component of the Company that meets the following conditions
simultaneously: (1) the component can generate income and incur expenses in daily activities; (2) the
management of the Company can regularly evaluate the operating results of the component to decide to allocate
resources to it and evaluate its performance; and (3) the Company can obtain relevant accounting information
such as the financial status, operating results and cash flow of the component. If two or more operating segments
have similar economic characteristics and meet certain conditions, they can be combined into one operating
segment.
VI. Taxes
1. Major tax types and tax rates
Particulars on major tax types and tax rates
"√ Applicable" "□ Not applicable"
Tax type Taxing basis Tax rate
Value added tax (“VAT”) The output tax is calculated on the basis of the income from
sales of products and taxable income from rendering of services
calculated according to the provisions of the tax law. The
difference between the output tax and the input tax which is
allowed to be deductible in the current period is the payable
VAT.
13%、10%、
9%、6%、5%
Consumption tax
Business tax
Urban maintenance and
construction tax
Calculated and paid according to the actually-paid VAT and
consumption tax 7%、1%
Enterprise income tax Calculated and paid according to the taxable income 15%、20%、
25%
If there are taxpayers with different enterprise income tax rates, the disclosure will be made for description
"√ Applicable" "□ Not applicable"

Annual Report 2020
151 / 244
Name of taxpayer Income tax rate
(%)
Shanghai M&G Zhenmei Stationery Co., Ltd.(上海晨光珍美文具有限公司) 25
Shanghai M&G Colipu Office Supplies Co., Ltd. 25
Lianyungang Colipu Office Supplies Co., Ltd.(连云港市科力普办公用品有限公司) 20
Shenyang M&G Colipu Office Supplies Co., Ltd.(沈阳晨光科力普办公用品有限公司) 25
Shanghai M&G Stationery & Gift Co., Ltd.(上海晨光文具礼品有限公司) 25
Shanghai M&G Stationery Sales Co., Ltd.(上海晨光文具销售有限公司) 25
Guangzhou M&G Stationery&Gifts Sales Co., Ltd.(广州晨光文具礼品销售有限公司) 25
Yiwu Chenxing Stationery Co., Ltd.(义乌市晨兴文具用品有限公司) 25
Harbin M&G Sanmei Stationery Co., Ltd.(哈尔滨晨光三美文具有限公司) 25
Zhengzhou M&G Stationery&Gifts Co., Ltd.(郑州晨光文具礼品有限责任公司) 25
M&G Life Enterprise Management Co., Ltd.(晨光生活馆企业管理有限公司) 25
M&G Life Enterprise Management (Shanghai) Co., Ltd.(晨光生活馆企业管理(上海)有
限公司)
25
Shanghai M&G Jiamei Stationery Co., Ltd.(上海晨光佳美文具有限公司) 25
Jiangsu M&G Life Enterprise Management Co., Ltd.(江苏晨光生活馆企业管理有限公
司)
25
Zhejiang New M&G Life Enterprise Management Co., Ltd.(浙江新晨光生活馆企业管理
有限公司)
25
Jiumu M&G Store Enterprise Management Co., Ltd.(九木杂物社企业管理有限公司) 25
Shanghai M&G Information Technology Co., Ltd.(上海晨光信息科技有限公司) 25
Shenzhen Erya Creative and Cultural Development Co., Ltd.(深圳尔雅文化创意发展有限
公司)
25
Shanghai M&G Office Supplies Co., Ltd. 25
Luoyang M&G Stationery Sales Co., Ltd.(洛阳晨光文具销售有限公司) 20
Hangzhou Sanmei M&G Stationery Co., Ltd.(杭州三美晨光文具有限公司) 25
Shanghai Qizhihaowan Culture and Creativity Co., Ltd.(上海奇只好玩文化创意有限公
司)
25
Shanghai Chenxun Enterprise Management Co., Ltd.(上海晨讯企业管理有限公司) 25
Shanghai Colipu Information Technology Co., Ltd.(上海科力普信息科技有限公司) 25
Jiangsu Marco Pen Co., Ltd.(江苏马可笔业有限公司) 25
Changchun Macro Stationery Co., Ltd.(长春马可文教用品有限公司) 25
Yili Senlai Wood Co., Ltd.(伊犁森徕木业有限公司) 25
Axus Stationery (Hong Kong) Company Ltd.(安硕文教用品(香港)有限公司) 16.5
International stationery company 20
2. Tax preference
"√ Applicable" "□ Not applicable"
On 28 October 2019, the Company obtained High- and New-tech Enterprise Certificate (certificate number
GR201931001046, valid for 3 years) issued jointly by Shanghai Municipal Science and Technology
Commission, Shanghai Finance Bureau and Shanghai Municipal Tax Service, State Taxation Administration.

Annual Report 2020
152 / 244
On 2 November 2018, the subsidiary Axus Stationery (Shanghai) Company Ltd. (“Axus Stationery”)
obtained High- and New-tech Enterprise Certificate (certificate number GR201831003575, valid for 3 years)
issued jointly by Shanghai Municipal Science and Technology Commission, Shanghai Finance Bureau and
Shanghai Municipal Tax Service, State Taxation Administration.
The Company and the subsidiary Axus Stationery paid the enterprise income tax at the rate of 15% this
year.
The subsidiaries Luoyang M&G Stationery Sales Co., Ltd. and Lianyungang Colipu Office Supplies Co.,
Ltd. paid the enterprise income tax according to the Enterprise Income Tax Law of the People's Republic of
China and the Notice of the Ministry of Finance and the State Administration of Taxation on the Implementation
of Inclusive Tax Relief Policy for Small and Micro Enterprises (Cai Shui [2019] No. 13), namely, starting from
1 January 2019 to 31 December 2021, for SMEs with annual taxable income not exceeding RMB 1 million, the
enterprise income tax at 20% shall apply based on 25% of the taxable income; for SMEs with annual taxable
income between RMB 1 million and RMB 3 million, the enterprise income tax at 20% shall apply based on 50%
of the taxable income.
In accordance with the Notice of the Ministry of Finance and the State Administration of Taxation on
Value-Added Tax Policies for Software Products (Cai Shui [2011] No. 100), the subsidiary Shanghai Colipu
Information Technology Co., Ltd. was granted the tax incentive regarding the refund upon payment of VAT by
Shanghai Xuhui District Tax Service, State Taxation Administration on software products on 9 June 2020, with
a valid period from 1 April 2020 to 31 March 2070.
3. Others
"□ Applicable" "√ Not applicable"
VII. Notes to the Items in Consolidated Financial Statements
1. Cash and equivalents
"√ Applicable" "□ Not applicable"
Unit: Yuan Currency: RMB
Item Closing balance Opening balance
Cash on hand 1,134,204.63 503,222.44
Cash at bank 2,551,360,452.36 1,922,791,232.44
Other cash and equivalents 9,664,269.12 12,306,239.47
Total 2,562,158,926.11 1,935,600,694.35
Including: Total cash deposited outside China 3,490,810.78 3,541,107.84
Other descriptions
Details of the cash and equivalents that are restricted for use due to mortgage, pledge or freeze and which
are deposited overseas and of which the remittance is restricted were as follows:
Item Closing balance Balance at the end of the year
Letter of credit (“L/C”) deposit 2,137,865.56 5,079,343.94
Performance bond 2,674,925.30 230,000.00
Time deposits over three months 1,180,000,000.00 550,000,000.00
Fund of restricted use 2,844,914.52
Total 1,184,812,790.86 558,154,258.46
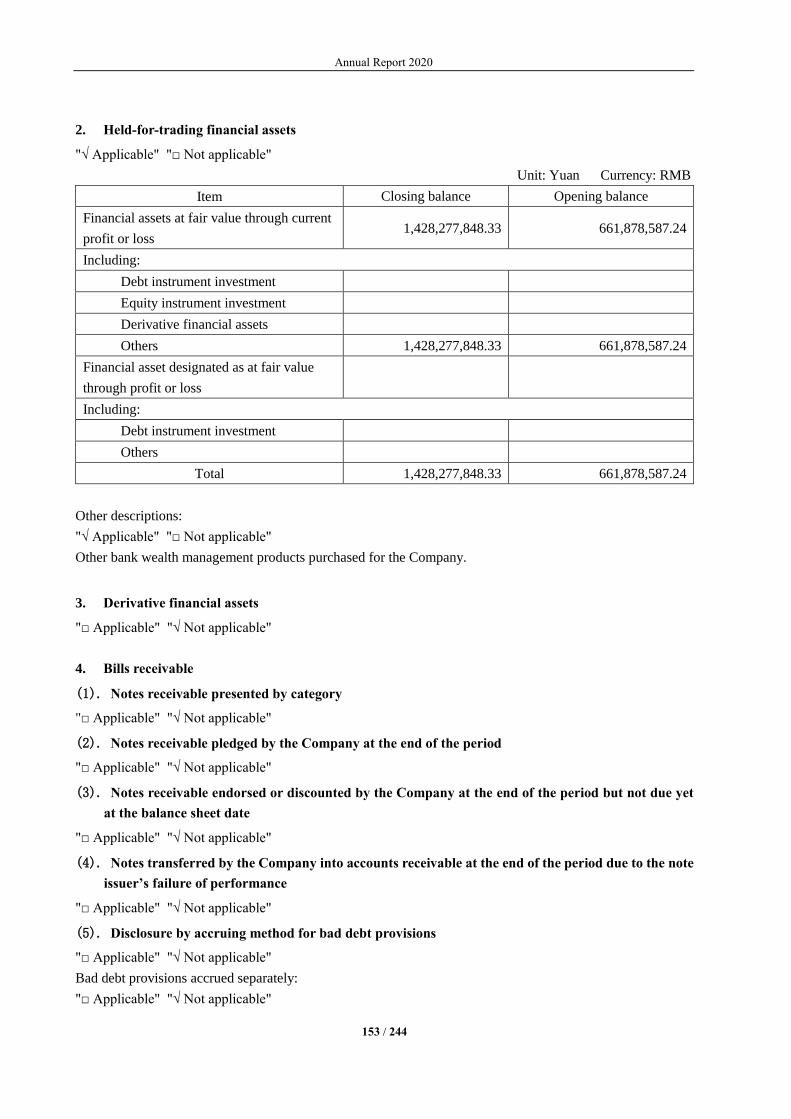
Annual Report 2020
153 / 244
2. Held-for-trading financial assets
"√ Applicable" "□ Not applicable"
Unit: Yuan Currency: RMB
Item Closing balance Opening balance
Financial assets at fair value through current
profit or loss 1,428,277,848.33 661,878,587.24
Including:
Debt instrument investment
Equity instrument investment
Derivative financial assets
Others 1,428,277,848.33 661,878,587.24
Financial asset designated as at fair value
through profit or loss
Including:
Debt instrument investment
Others
Total 1,428,277,848.33 661,878,587.24
Other descriptions:
"√ Applicable" "□ Not applicable"
Other bank wealth management products purchased for the Company.
3. Derivative financial assets
"□ Applicable" "√ Not applicable"
4. Bills receivable
(1). Notes receivable presented by category
"□ Applicable" "√ Not applicable"
(2). Notes receivable pledged by the Company at the end of the period
"□ Applicable" "√ Not applicable"
(3). Notes receivable endorsed or discounted by the Company at the end of the period but not due yet
at the balance sheet date
"□ Applicable" "√ Not applicable"
(4). Notes transferred by the Company into accounts receivable at the end of the period due to the note
issuer’s failure of performance
"□ Applicable" "√ Not applicable"
(5). Disclosure by accruing method for bad debt provisions
"□ Applicable" "√ Not applicable"
Bad debt provisions accrued separately:
"□ Applicable" "√ Not applicable"
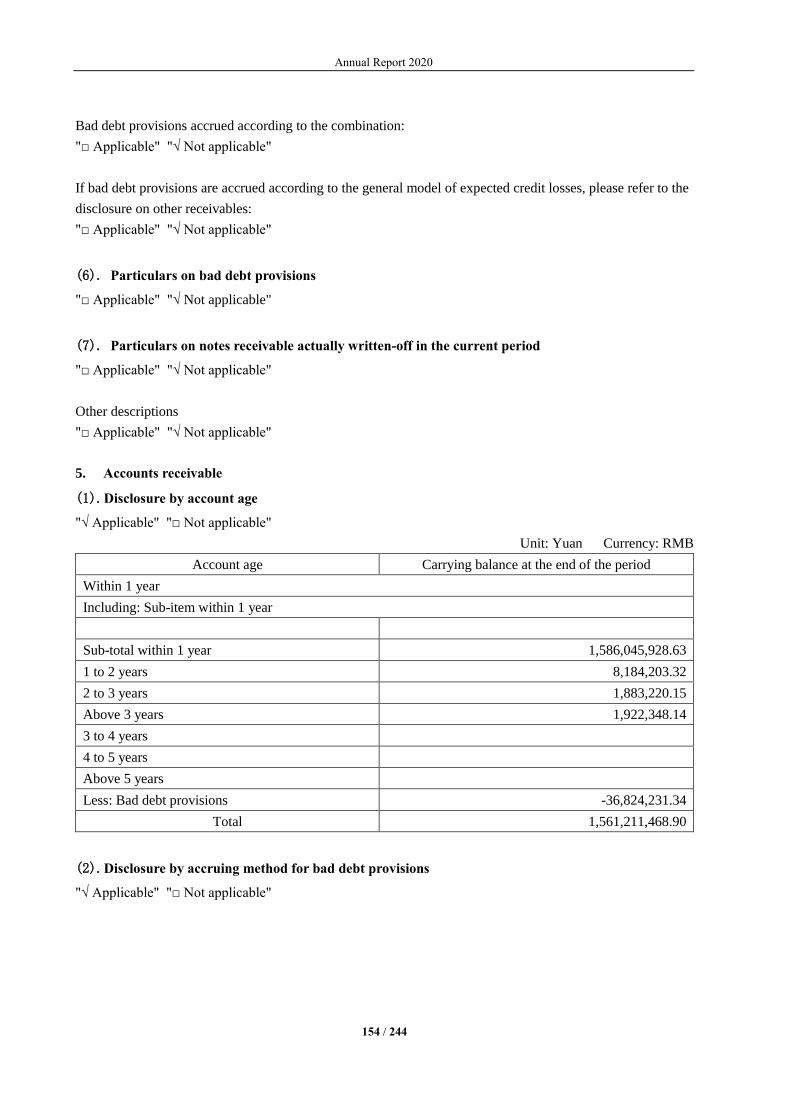
Annual Report 2020
154 / 244
Bad debt provisions accrued according to the combination:
"□ Applicable" "√ Not applicable"
If bad debt provisions are accrued according to the general model of expected credit losses, please refer to the
disclosure on other receivables:
"□ Applicable" "√ Not applicable"
(6). Particulars on bad debt provisions
"□ Applicable" "√ Not applicable"
(7). Particulars on notes receivable actually written-off in the current period
"□ Applicable" "√ Not applicable"
Other descriptions
"□ Applicable" "√ Not applicable"
5. Accounts receivable
(1). Disclosure by account age
"√ Applicable" "□ Not applicable"
Unit: Yuan Currency: RMB
Account age Carrying balance at the end of the period
Within 1 year
Including: Sub-item within 1 year
Sub-total within 1 year 1,586,045,928.63
1 to 2 years 8,184,203.32
2 to 3 years 1,883,220.15
Above 3 years 1,922,348.14
3 to 4 years
4 to 5 years
Above 5 years
Less: Bad debt provisions -36,824,231.34
Total 1,561,211,468.90
(2). Disclosure by accruing method for bad debt provisions
"√ Applicable" "□ Not applicable"
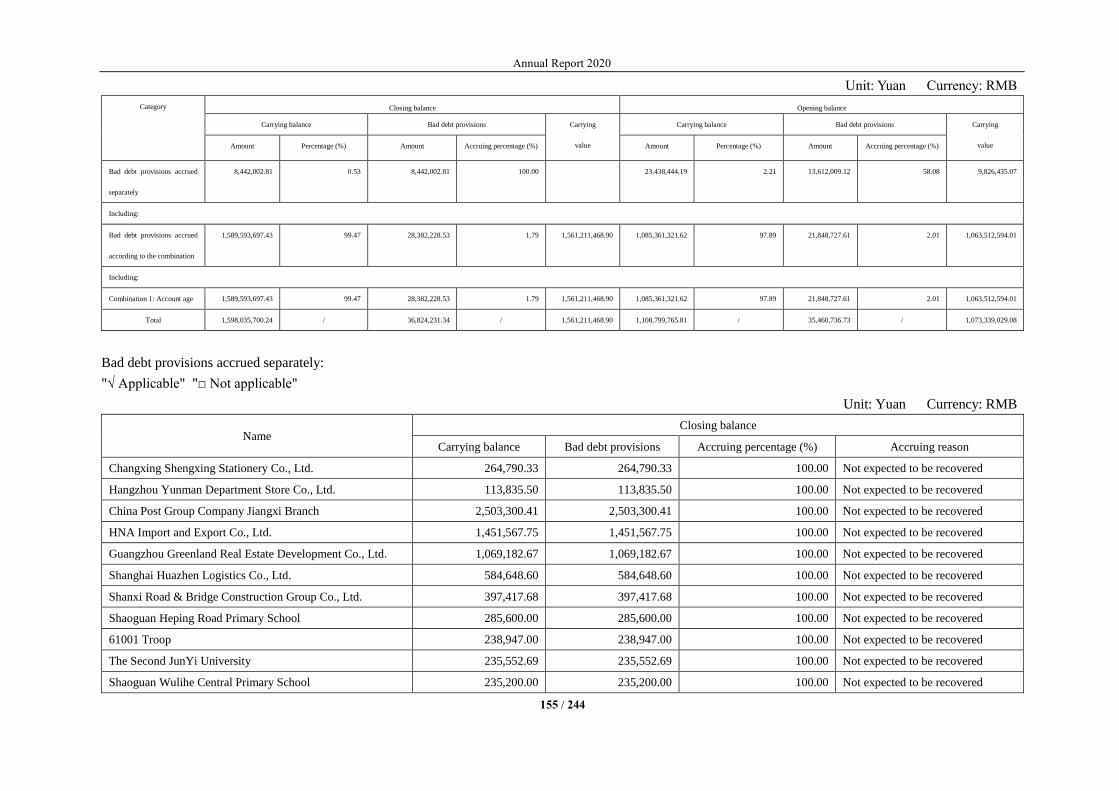
Annual Report 2020
155 / 244
Unit: Yuan Currency: RMB
Category Closing balance Opening balance
Carrying balance Bad debt provisions Carrying
value
Carrying balance Bad debt provisions Carrying
value Amount Percentage (%) Amount Accruing percentage (%) Amount Percentage (%) Amount Accruing percentage (%)
Bad debt provisions accrued
separately
8,442,002.81 0.53 8,442,002.81 100.00 23,438,444.19 2.21 13,612,009.12 58.08 9,826,435.07
Including:
Bad debt provisions accrued
according to the combination
1,589,593,697.43 99.47 28,382,228.53 1.79 1,561,211,468.90 1,085,361,321.62 97.89 21,848,727.61 2.01 1,063,512,594.01
Including:
Combination 1: Account age 1,589,593,697.43 99.47 28,382,228.53 1.79 1,561,211,468.90 1,085,361,321.62 97.89 21,848,727.61 2.01 1,063,512,594.01
Total 1,598,035,700.24 / 36,824,231.34 / 1,561,211,468.90 1,108,799,765.81 / 35,460,736.73 / 1,073,339,029.08
Bad debt provisions accrued separately:
"√ Applicable" "□ Not applicable"
Unit: Yuan Currency: RMB
Name Closing balance
Carrying balance Bad debt provisions Accruing percentage (%) Accruing reason
Changxing Shengxing Stationery Co., Ltd. 264,790.33 264,790.33 100.00 Not expected to be recovered
Hangzhou Yunman Department Store Co., Ltd. 113,835.50 113,835.50 100.00 Not expected to be recovered
China Post Group Company Jiangxi Branch 2,503,300.41 2,503,300.41 100.00 Not expected to be recovered
HNA Import and Export Co., Ltd. 1,451,567.75 1,451,567.75 100.00 Not expected to be recovered
Guangzhou Greenland Real Estate Development Co., Ltd. 1,069,182.67 1,069,182.67 100.00 Not expected to be recovered
Shanghai Huazhen Logistics Co., Ltd. 584,648.60 584,648.60 100.00 Not expected to be recovered
Shanxi Road & Bridge Construction Group Co., Ltd. 397,417.68 397,417.68 100.00 Not expected to be recovered
Shaoguan Heping Road Primary School 285,600.00 285,600.00 100.00 Not expected to be recovered
61001 Troop 238,947.00 238,947.00 100.00 Not expected to be recovered
The Second JunYi University 235,552.69 235,552.69 100.00 Not expected to be recovered
Shaoguan Wulihe Central Primary School 235,200.00 235,200.00 100.00 Not expected to be recovered
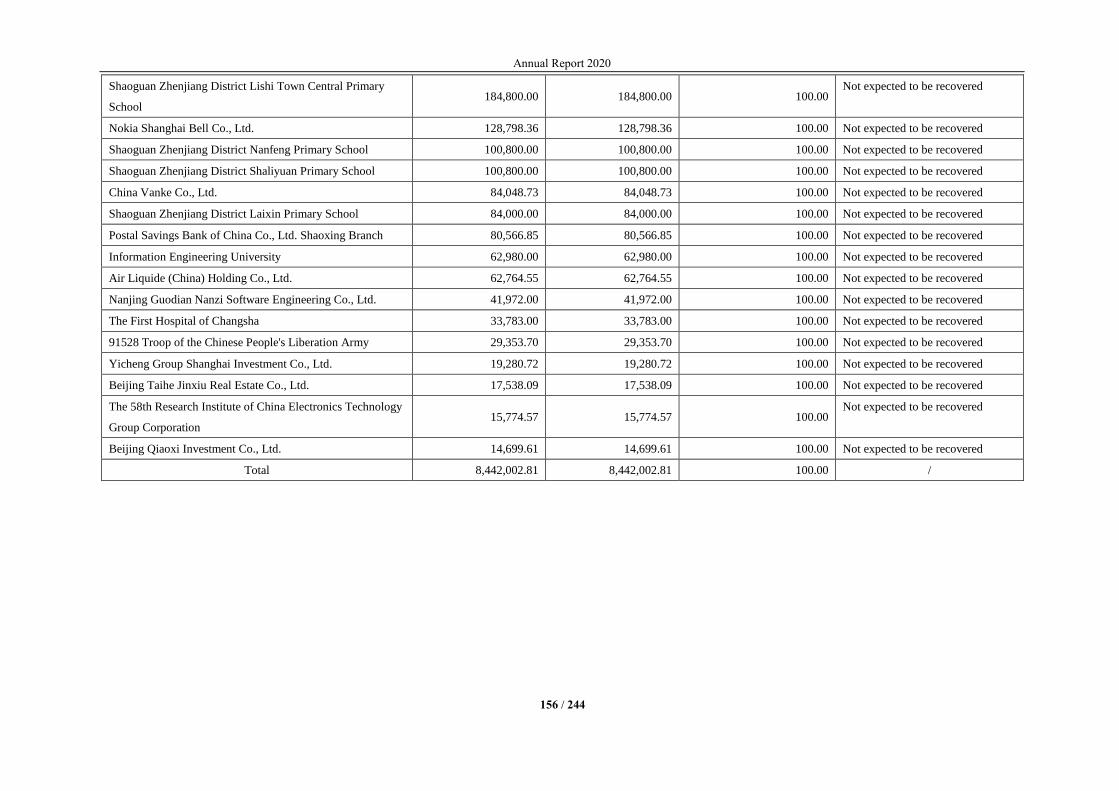
Annual Report 2020
156 / 244
Shaoguan Zhenjiang District Lishi Town Central Primary
School 184,800.00 184,800.00 100.00
Not expected to be recovered
Nokia Shanghai Bell Co., Ltd. 128,798.36 128,798.36 100.00 Not expected to be recovered
Shaoguan Zhenjiang District Nanfeng Primary School 100,800.00 100,800.00 100.00 Not expected to be recovered
Shaoguan Zhenjiang District Shaliyuan Primary School 100,800.00 100,800.00 100.00 Not expected to be recovered
China Vanke Co., Ltd. 84,048.73 84,048.73 100.00 Not expected to be recovered
Shaoguan Zhenjiang District Laixin Primary School 84,000.00 84,000.00 100.00 Not expected to be recovered
Postal Savings Bank of China Co., Ltd. Shaoxing Branch 80,566.85 80,566.85 100.00 Not expected to be recovered
Information Engineering University 62,980.00 62,980.00 100.00 Not expected to be recovered
Air Liquide (China) Holding Co., Ltd. 62,764.55 62,764.55 100.00 Not expected to be recovered
Nanjing Guodian Nanzi Software Engineering Co., Ltd. 41,972.00 41,972.00 100.00 Not expected to be recovered
The First Hospital of Changsha 33,783.00 33,783.00 100.00 Not expected to be recovered
91528 Troop of the Chinese People's Liberation Army 29,353.70 29,353.70 100.00 Not expected to be recovered
Yicheng Group Shanghai Investment Co., Ltd. 19,280.72 19,280.72 100.00 Not expected to be recovered
Beijing Taihe Jinxiu Real Estate Co., Ltd. 17,538.09 17,538.09 100.00 Not expected to be recovered
The 58th Research Institute of China Electronics Technology
Group Corporation 15,774.57 15,774.57 100.00
Not expected to be recovered
Beijing Qiaoxi Investment Co., Ltd. 14,699.61 14,699.61 100.00 Not expected to be recovered
Total 8,442,002.81 8,442,002.81 100.00 /
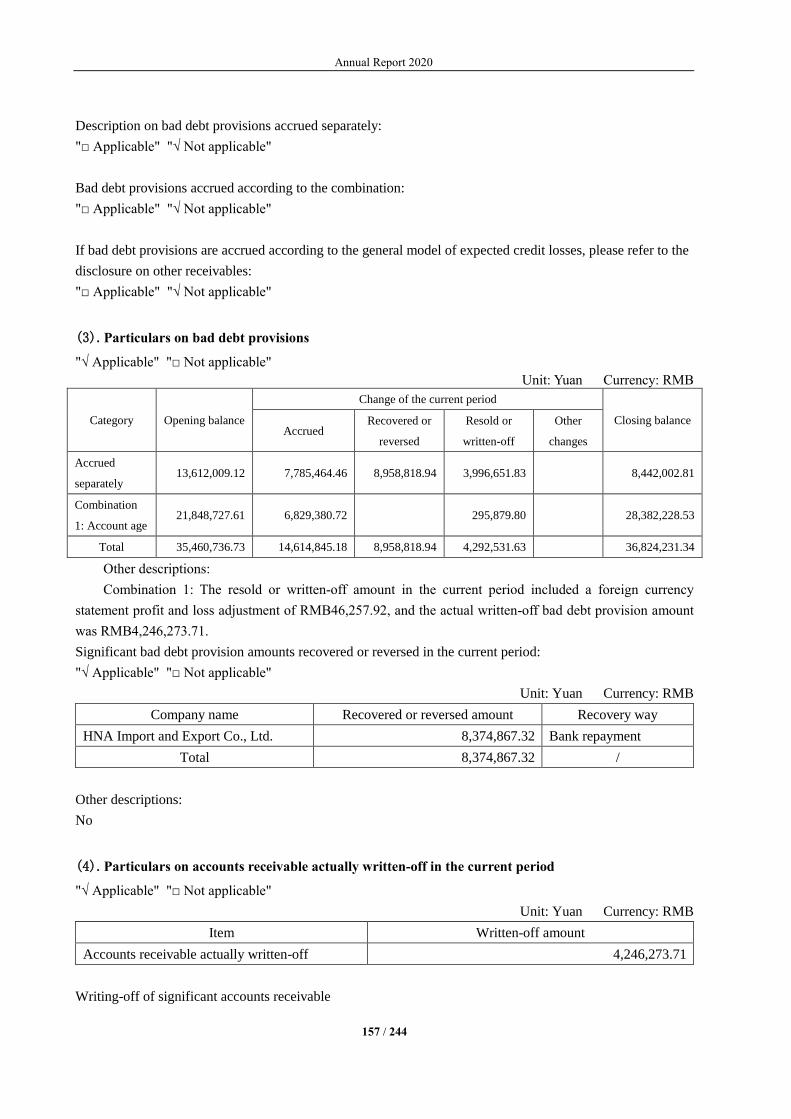
Annual Report 2020
157 / 244
Description on bad debt provisions accrued separately:
"□ Applicable" "√ Not applicable"
Bad debt provisions accrued according to the combination:
"□ Applicable" "√ Not applicable"
If bad debt provisions are accrued according to the general model of expected credit losses, please refer to the
disclosure on other receivables:
"□ Applicable" "√ Not applicable"
(3). Particulars on bad debt provisions
"√ Applicable" "□ Not applicable"
Unit: Yuan Currency: RMB
Category Opening balance
Change of the current period
Closing balance Accrued
Recovered or
reversed
Resold or
written-off
Other
changes
Accrued
separately 13,612,009.12 7,785,464.46 8,958,818.94 3,996,651.83
8,442,002.81
Combination
1: Account age 21,848,727.61 6,829,380.72 295,879.80
28,382,228.53
Total 35,460,736.73 14,614,845.18 8,958,818.94 4,292,531.63 36,824,231.34
Other descriptions:
Combination 1: The resold or written-off amount in the current period included a foreign currency
statement profit and loss adjustment of RMB46,257.92, and the actual written-off bad debt provision amount
was RMB4,246,273.71.
Significant bad debt provision amounts recovered or reversed in the current period:
"√ Applicable" "□ Not applicable"
Unit: Yuan Currency: RMB
Company name Recovered or reversed amount Recovery way
HNA Import and Export Co., Ltd. 8,374,867.32 Bank repayment
Total 8,374,867.32 /
Other descriptions:
No
(4). Particulars on accounts receivable actually written-off in the current period
"√ Applicable" "□ Not applicable"
Unit: Yuan Currency: RMB
Item Written-off amount
Accounts receivable actually written-off 4,246,273.71
Writing-off of significant accounts receivable

Annual Report 2020
158 / 244
"□ Applicable" "√ Not applicable"
Description on writing-off of accounts receivable:
"□ Applicable" "√ Not applicable"
(5). Particulars on top 5 accounts receivable in terms of the balance at the end of the period based on
debtors
"√ Applicable" "□ Not applicable"
Company name
Closing balance
Accounts receivable
Percentage (%) of the
total accounts
receivable
Bad debt provisions
First 267,682,145.37 16.75 1,818,616.11
Second 172,150,746.16 10.77 3,353,683.96
Third 97,355,830.97 6.09 486,779.15
Fourth 64,459,459.89 4.03 576,915.52
Fifth 61,451,947.79 3.85 3,072,597.39
Total 663,100,130.18 41.49 9,308,592.13
(6). Accounts receivable derecognized due to the transfer of financial assets
"□ Applicable" "√ Not applicable"
(7). Assets and liabilities formed due to the transfer and continuous involvement of accounts receivable
"□ Applicable" "√ Not applicable"
Other descriptions:
"□ Applicable" "√ Not applicable"
6. Receivables financing
"√ Applicable" "□ Not applicable"
Unit: Yuan Currency: RMB
Item Closing balance Opening balance
Bills receivable 61,412,976.46 24,262,204.08
Factoring of accounts receivable 5,287,720.75
Total 61,412,976.46 29,549,924.83
Changes in receivables financing during the current period and changes in fair value:
"√ Applicable" "□ Not applicable"
Unit: Yuan Currency: RMB
Item
Balance at
the beginning
of the year
Increase of the
current period
Derecognition
of the current
period
Other
changes
Closing
balance
Accumulated
loss provisions
recognized in
other
comprehensive
income
Bills
receivable 24,262,204.08 100,038,314.02 62,887,541.64 61,412,976.46
Factoring
of 5,287,720.75 5,287,720.75
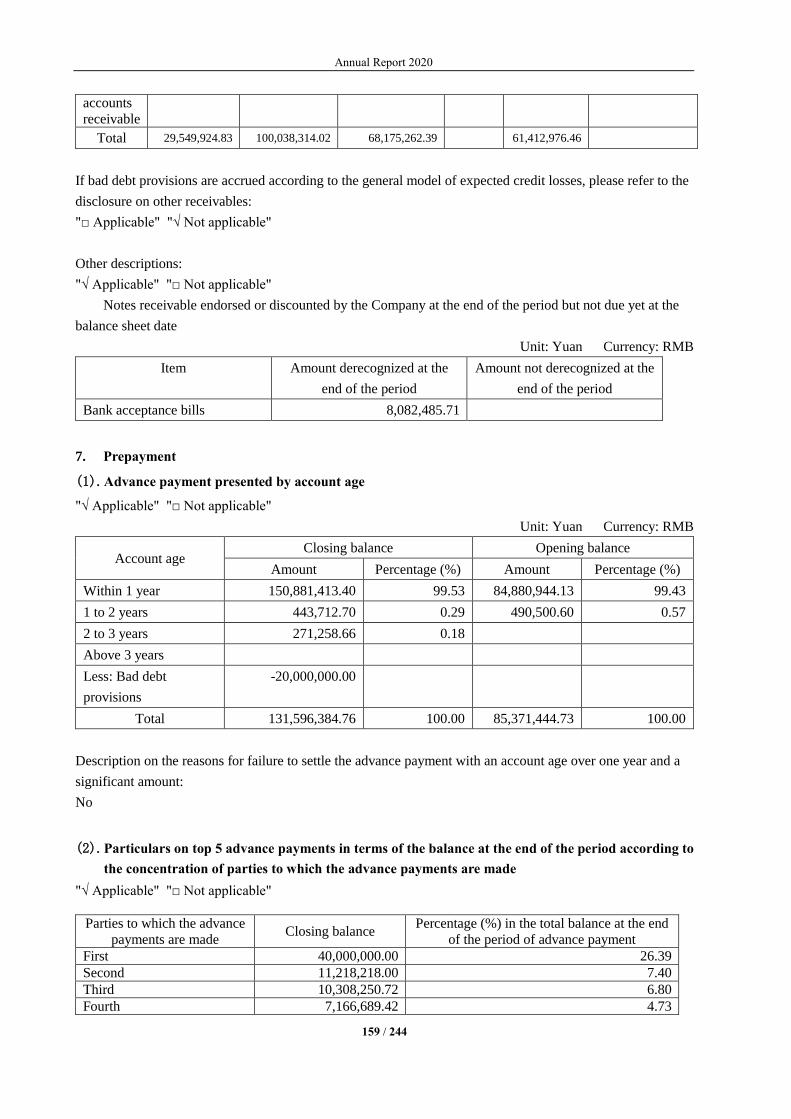
Annual Report 2020
159 / 244
accounts
receivable
Total 29,549,924.83 100,038,314.02 68,175,262.39 61,412,976.46
If bad debt provisions are accrued according to the general model of expected credit losses, please refer to the
disclosure on other receivables:
"□ Applicable" "√ Not applicable"
Other descriptions:
"√ Applicable" "□ Not applicable"
Notes receivable endorsed or discounted by the Company at the end of the period but not due yet at the
balance sheet date
Unit: Yuan Currency: RMB
Item Amount derecognized at the
end of the period
Amount not derecognized at the
end of the period
Bank acceptance bills 8,082,485.71
7. Prepayment
(1). Advance payment presented by account age
"√ Applicable" "□ Not applicable"
Unit: Yuan Currency: RMB
Account age Closing balance Opening balance
Amount Percentage (%) Amount Percentage (%)
Within 1 year 150,881,413.40 99.53 84,880,944.13 99.43
1 to 2 years 443,712.70 0.29 490,500.60 0.57
2 to 3 years 271,258.66 0.18
Above 3 years
Less: Bad debt
provisions
-20,000,000.00
Total 131,596,384.76 100.00 85,371,444.73 100.00
Description on the reasons for failure to settle the advance payment with an account age over one year and a
significant amount:
No
(2). Particulars on top 5 advance payments in terms of the balance at the end of the period according to
the concentration of parties to which the advance payments are made
"√ Applicable" "□ Not applicable"
Parties to which the advance
payments are made Closing balance
Percentage (%) in the total balance at the end
of the period of advance payment
First 40,000,000.00 26.39
Second 11,218,218.00 7.40
Third 10,308,250.72 6.80
Fourth 7,166,689.42 4.73
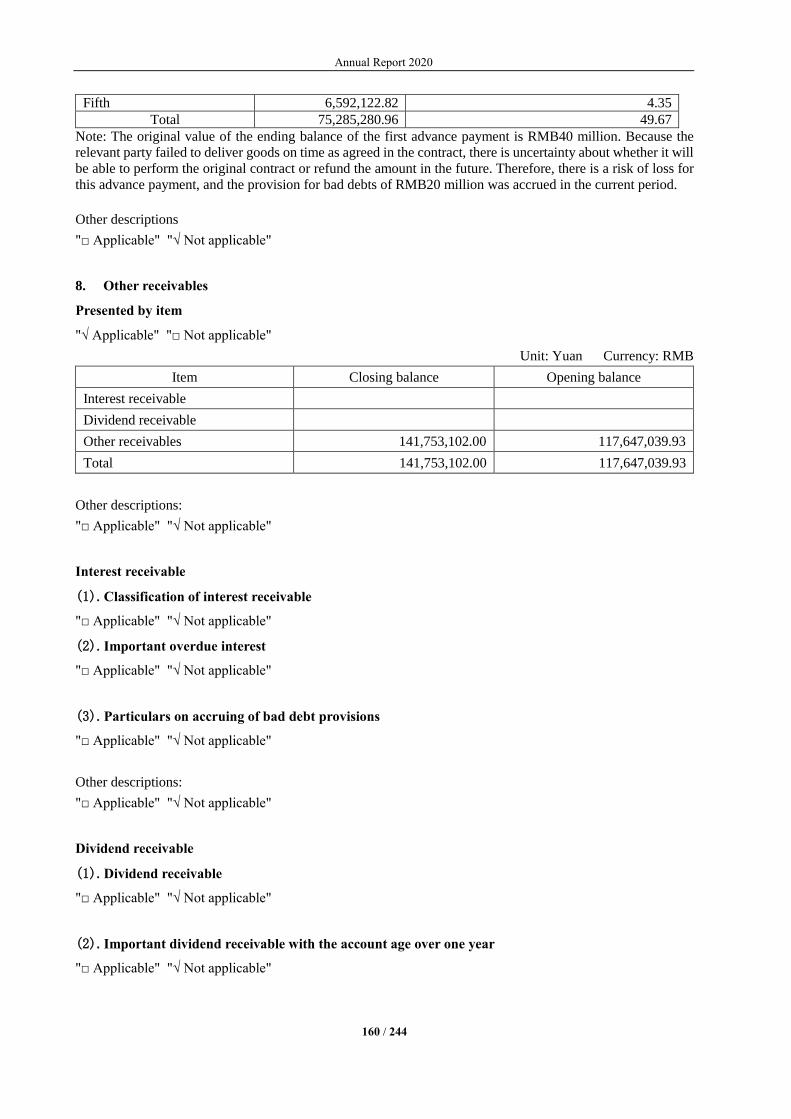
Annual Report 2020
160 / 244
Fifth 6,592,122.82 4.35
Total 75,285,280.96 49.67
Note: The original value of the ending balance of the first advance payment is RMB40 million. Because the
relevant party failed to deliver goods on time as agreed in the contract, there is uncertainty about whether it will
be able to perform the original contract or refund the amount in the future. Therefore, there is a risk of loss for
this advance payment, and the provision for bad debts of RMB20 million was accrued in the current period.
Other descriptions
"□ Applicable" "√ Not applicable"
8. Other receivables
Presented by item
"√ Applicable" "□ Not applicable"
Unit: Yuan Currency: RMB
Item Closing balance Opening balance
Interest receivable
Dividend receivable
Other receivables 141,753,102.00 117,647,039.93
Total 141,753,102.00 117,647,039.93
Other descriptions:
"□ Applicable" "√ Not applicable"
Interest receivable
(1). Classification of interest receivable
"□ Applicable" "√ Not applicable"
(2). Important overdue interest
"□ Applicable" "√ Not applicable"
(3). Particulars on accruing of bad debt provisions
"□ Applicable" "√ Not applicable"
Other descriptions:
"□ Applicable" "√ Not applicable"
Dividend receivable
(1). Dividend receivable
"□ Applicable" "√ Not applicable"
(2). Important dividend receivable with the account age over one year
"□ Applicable" "√ Not applicable"
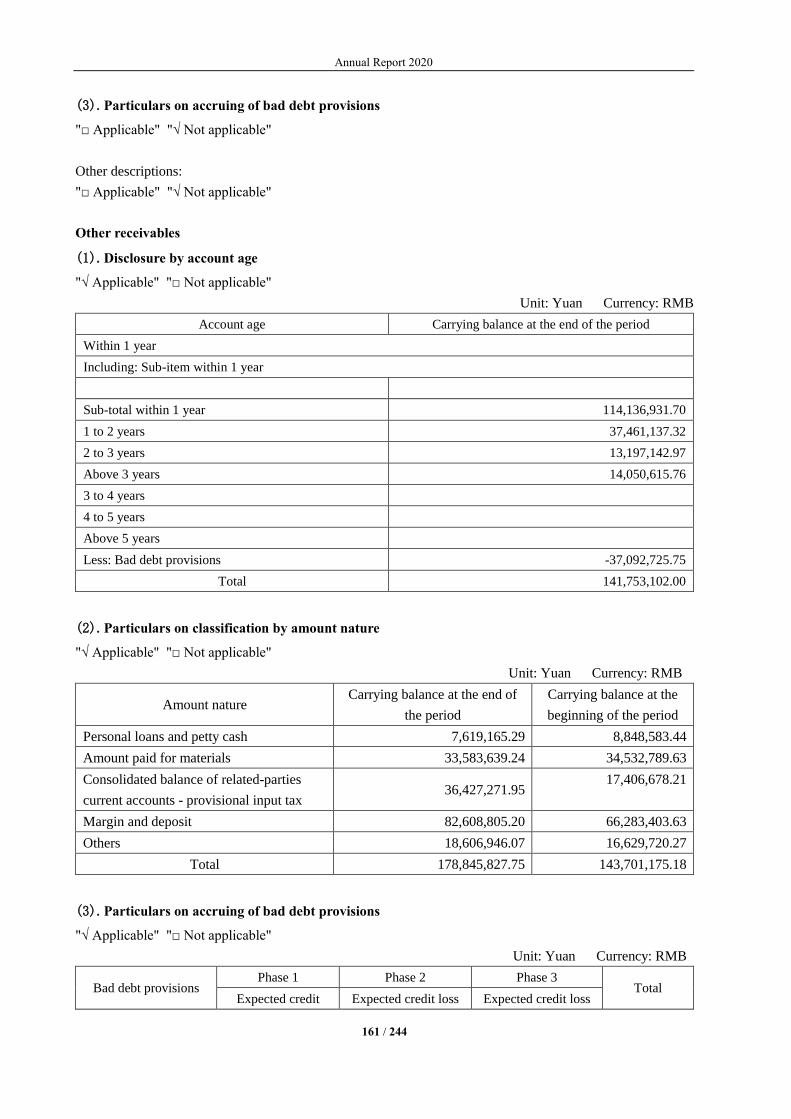
Annual Report 2020
161 / 244
(3). Particulars on accruing of bad debt provisions
"□ Applicable" "√ Not applicable"
Other descriptions:
"□ Applicable" "√ Not applicable"
Other receivables
(1). Disclosure by account age
"√ Applicable" "□ Not applicable"
Unit: Yuan Currency: RMB
Account age Carrying balance at the end of the period
Within 1 year
Including: Sub-item within 1 year
Sub-total within 1 year 114,136,931.70
1 to 2 years 37,461,137.32
2 to 3 years 13,197,142.97
Above 3 years 14,050,615.76
3 to 4 years
4 to 5 years
Above 5 years
Less: Bad debt provisions -37,092,725.75
Total 141,753,102.00
(2). Particulars on classification by amount nature
"√ Applicable" "□ Not applicable"
Unit: Yuan Currency: RMB
Amount nature Carrying balance at the end of
the period
Carrying balance at the
beginning of the period
Personal loans and petty cash 7,619,165.29 8,848,583.44
Amount paid for materials 33,583,639.24 34,532,789.63
Consolidated balance of related-parties
current accounts - provisional input tax 36,427,271.95
17,406,678.21
Margin and deposit 82,608,805.20 66,283,403.63
Others 18,606,946.07 16,629,720.27
Total 178,845,827.75 143,701,175.18
(3). Particulars on accruing of bad debt provisions
"√ Applicable" "□ Not applicable"
Unit: Yuan Currency: RMB
Bad debt provisions Phase 1 Phase 2 Phase 3
Total Expected credit Expected credit loss Expected credit loss
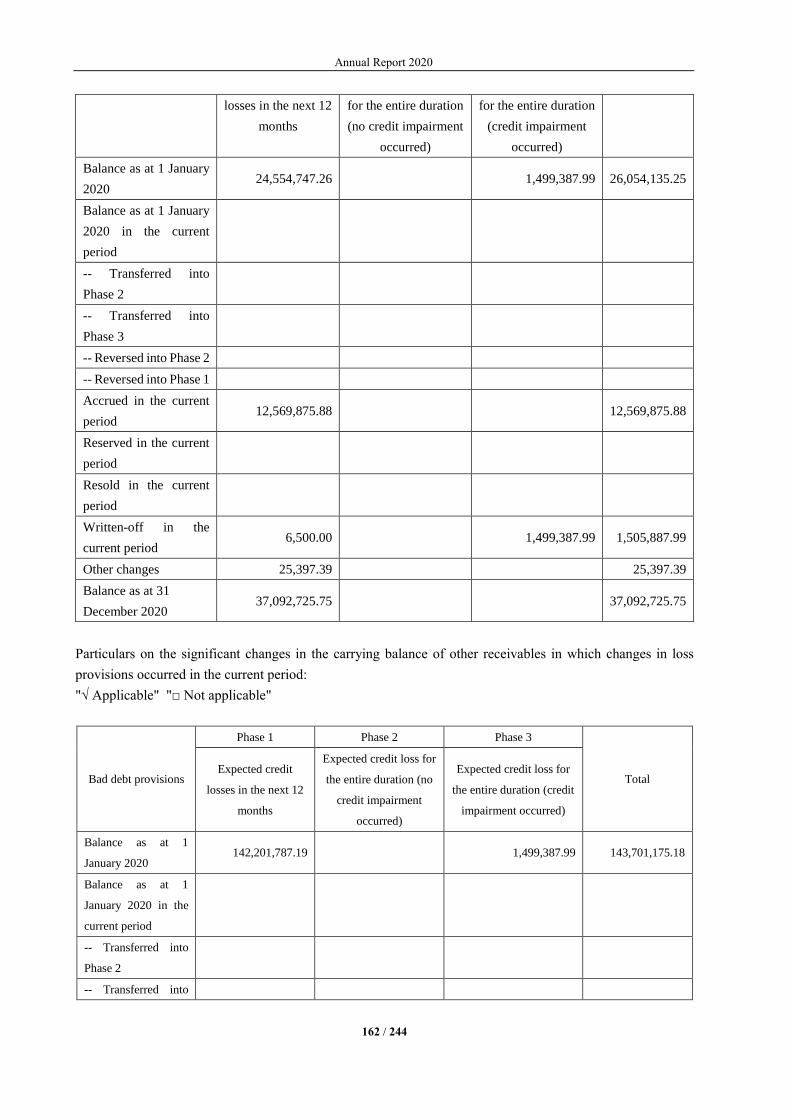
Annual Report 2020
162 / 244
losses in the next 12
months
for the entire duration
(no credit impairment
occurred)
for the entire duration
(credit impairment
occurred)
Balance as at 1 January
2020 24,554,747.26 1,499,387.99 26,054,135.25
Balance as at 1 January
2020 in the current
period
-- Transferred into
Phase 2
-- Transferred into
Phase 3
-- Reversed into Phase 2
-- Reversed into Phase 1
Accrued in the current
period 12,569,875.88 12,569,875.88
Reserved in the current
period
Resold in the current
period
Written-off in the
current period 6,500.00 1,499,387.99 1,505,887.99
Other changes 25,397.39 25,397.39
Balance as at 31
December 2020 37,092,725.75 37,092,725.75
Particulars on the significant changes in the carrying balance of other receivables in which changes in loss
provisions occurred in the current period:
"√ Applicable" "□ Not applicable"
Bad debt provisions
Phase 1 Phase 2 Phase 3
Total Expected credit
losses in the next 12
months
Expected credit loss for
the entire duration (no
credit impairment
occurred)
Expected credit loss for
the entire duration (credit
impairment occurred)
Balance as at 1
January 2020 142,201,787.19 1,499,387.99 143,701,175.18
Balance as at 1
January 2020 in the
current period
-- Transferred into
Phase 2
-- Transferred into

Annual Report 2020
163 / 244
Phase 3
-- Reversed into
Phase 2
-- Reversed into
Phase 1
Increase of the
current period 709,959,479.04 709,959,479.04
Derecognition of the
current period 673,315,438.48 1,499,387.99 674,814,826.47
Other changes
Balance as at 31
December 2020 178,845,827.75 178,845,827.75
The basis for adopting the amount of bad debt provisions accrued for the current period and the assessment on
whether the credit risk of financial instruments increased significantly:
"□ Applicable" "√ Not applicable"
(4). Particulars on bad debt provisions
"√ Applicable" "□ Not applicable"
Unit: Yuan Currency: RMB
Category Opening balance
Change of the current period Closing
balance Accrued Recovered
or reversed
Resold or
written-off
Other
changes
Bad debt
provisions accrued
separately
1,499,387.99 1,499,387.99
Combination 1:
Account age 24,554,747.26 12,569,875.88 31,897.38
37,092,725.75
Total 26,054,135.25 12,569,875.88 1,531,285.37 37,092,725.75
Other descriptions:
Combination 1: The resold or written-off amount in the current period included a foreign currency
statement profit and loss adjustment of RMB25,397.38, and the actual written-off bad debt provision amount
was RMB1,505,887.99.
Significant bad debt provision amounts reversed or recovered in the current period:
"□ Applicable" "√ Not applicable"
(5). Particulars on other receivables actually written-off in the current period
"√ Applicable" "□ Not applicable"
Unit: Yuan Currency: RMB
Item Written-off amount
Other receivables actually written-off 1,505,887.99
Significant writing-off of other receivables:
"□ Applicable" "√ Not applicable"
Description on writing-off of other receivables:
"□ Applicable" "√ Not applicable"

Annual Report 2020
164 / 244
(6). Particulars on top 5 other receivables in terms of the balance at the end of the period based on
debtors
"√ Applicable" "□ Not applicable"
Unit: Yuan Currency: RMB
Company
name Amount nature Closing balance Account age
Percentage (%) in
the total balance at
the end of the
period of other
receivables
Bad debt
provisions
Closing balance
First Consolidated
balance of
related-parties
current accounts
- provisional
input tax
36,427,271.95 Within 1
year 20.37
Second Amount paid for
materials 7,705,462.64 1-2 years 4.31 2,311,638.79
Third Others 5,576,436.30
Within 1
year 3.12 278,821.82
Fourth Margin and
deposit 4,000,000.00
Within 1
year 2.24 200,000.00
Fifth Margin and
deposit 3,821,857.88
Above 3
years 2.14 3,821,857.88
Total / 57,531,028.77 / 32.18 6,612,318.49
(7). Receivables involving government subsidies
"√ Applicable" "□ Not applicable"
Unit: Yuan Currency: RMB
Company name Government
subsidies Closing balance
Account age at
the end of the
period
Estimated time,
amount and basis of
receipt
Shanghai Xuhui District
Tax Service, State
Taxation
Administration
Refund upon
payment of VAT
on software
enterprises
5,576,436.30 Within 1 year
Refund upon
payment of VAT on
software enterprises
Total 5,576,436.30
Other descriptions
No
(8). Other receivables derecognized due to the transfer of financial assets
"□ Applicable" "√ Not applicable"

Annual Report 2020
165 / 244
(9). Assets and liabilities formed due to the transfer and continuous involvement of other receivables
"□ Applicable" "√ Not applicable"
Other descriptions:
"□ Applicable" "√ Not applicable"
9. Inventories
(1). Classification of inventories
"√ Applicable" "□ Not applicable"
Unit: Yuan Currency: RMB
Item
Closing balance Opening balance
Carrying balance
Provision for the
loss on decline in
value of
inventories/provision
for the impairment
of contract
performance cost
Carrying value Carrying balance
Provision for the
loss on decline in
value of
inventories/provision
for the impairment
of contract
performance cost
Carrying value
Raw
materials 171,682,717.53 503,028.26 171,179,689.27 230,583,859.11 1,418,134.61 229,165,724.50
Work-in-
process 67,576,697.07 90,168.22 67,486,528.85 55,336,578.58 91,431.46 55,245,147.12
Finished
products 1,065,016,694.84 45,926,598.58 1,019,090,096.26 1,035,510,579.55 35,434,374.53 1,000,076,205.02
Revolving
materials 16,274,211.14 1,514,799.76 14,759,411.38 17,933,897.04 1,035,002.57 16,898,894.47
Expendable
biological
assets
14,814,590.65 14,814,590.65 14,937,710.39 14,937,710.39
Contract
performance
cost
Materials in
transit 4,146,657.42 39,054.79 4,107,602.63 4,258,709.42 4,258,709.42
Consigned
processing
materials
13,713,637.94 13,713,637.94 14,249,868.76 14,249,868.76
Shipped
goods 17,661,289.85 17,661,289.85 7,984,719.82 7,984,719.82
Total 1,370,886,496.44 48,073,649.61 1,322,812,846.83 1,380,795,922.67 37,978,943.17 1,342,816,979.50
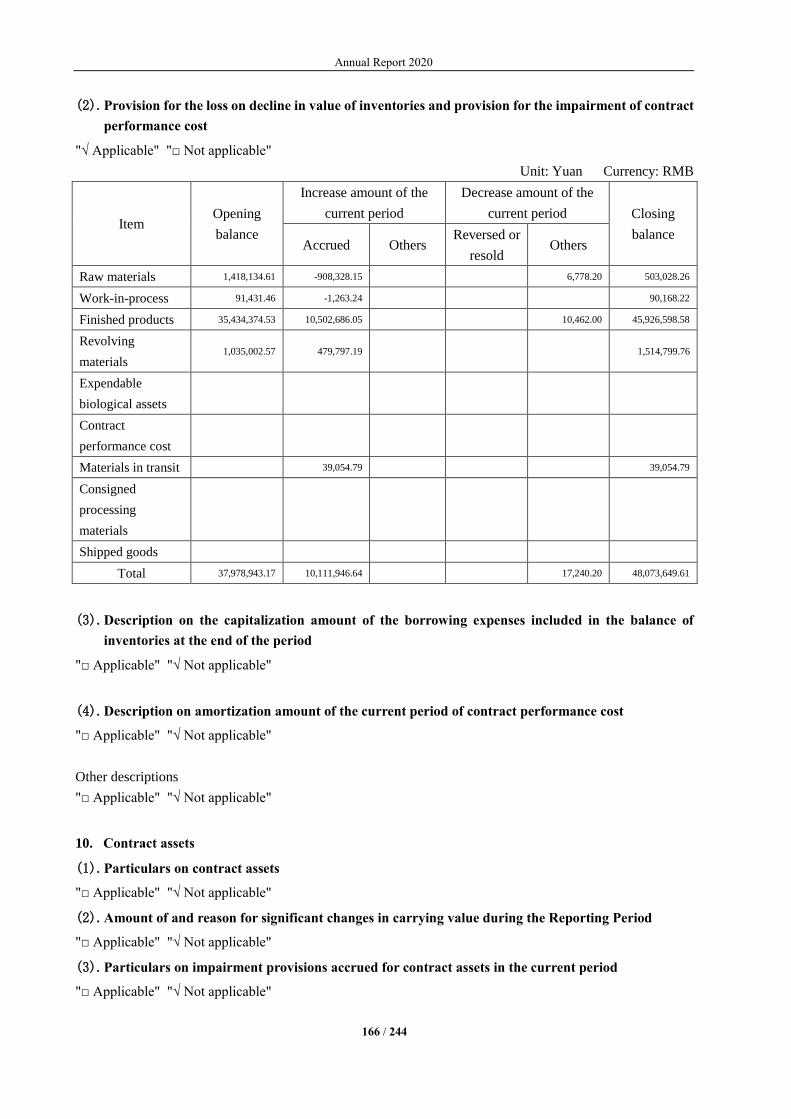
Annual Report 2020
166 / 244
(2). Provision for the loss on decline in value of inventories and provision for the impairment of contract
performance cost
"√ Applicable" "□ Not applicable"
Unit: Yuan Currency: RMB
Item Opening
balance
Increase amount of the
current period
Decrease amount of the
current period Closing
balance Accrued Others
Reversed or
resold Others
Raw materials 1,418,134.61 -908,328.15 6,778.20 503,028.26
Work-in-process 91,431.46 -1,263.24 90,168.22
Finished products 35,434,374.53 10,502,686.05 10,462.00 45,926,598.58
Revolving
materials 1,035,002.57 479,797.19 1,514,799.76
Expendable
biological assets
Contract
performance cost
Materials in transit 39,054.79 39,054.79
Consigned
processing
materials
Shipped goods
Total 37,978,943.17 10,111,946.64 17,240.20 48,073,649.61
(3). Description on the capitalization amount of the borrowing expenses included in the balance of
inventories at the end of the period
"□ Applicable" "√ Not applicable"
(4). Description on amortization amount of the current period of contract performance cost
"□ Applicable" "√ Not applicable"
Other descriptions
"□ Applicable" "√ Not applicable"
10. Contract assets
(1). Particulars on contract assets
"□ Applicable" "√ Not applicable"
(2). Amount of and reason for significant changes in carrying value during the Reporting Period
"□ Applicable" "√ Not applicable"
(3). Particulars on impairment provisions accrued for contract assets in the current period
"□ Applicable" "√ Not applicable"
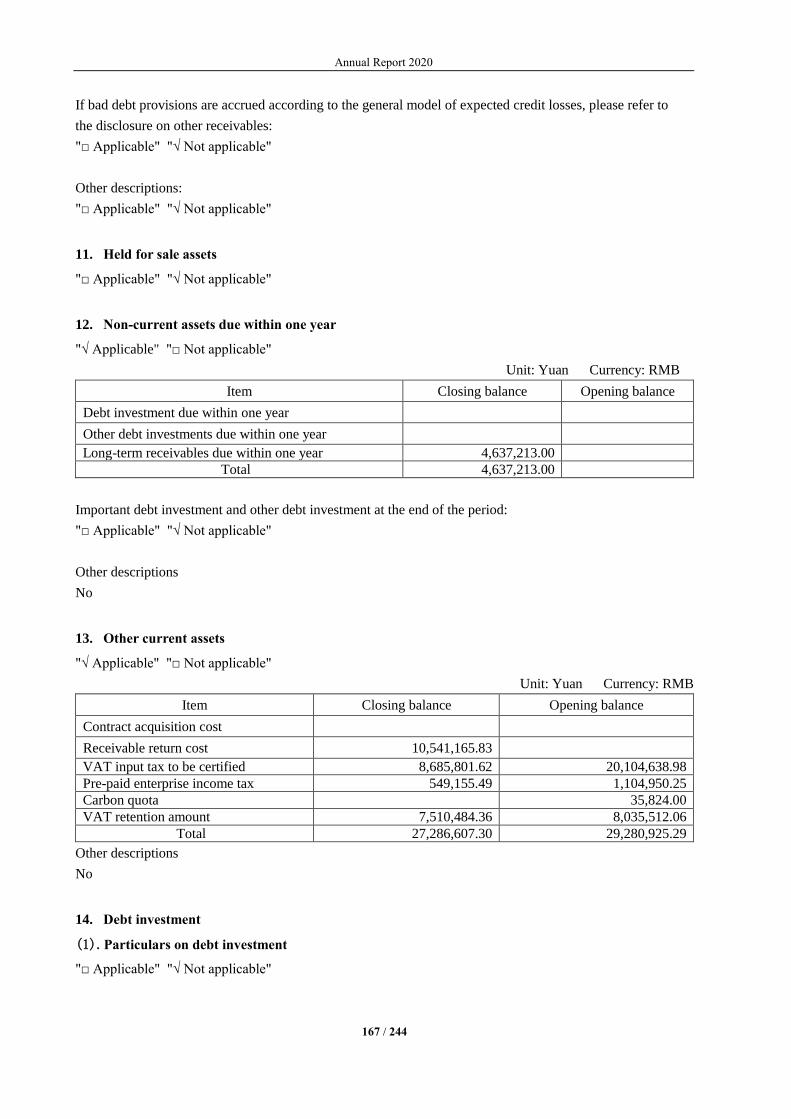
Annual Report 2020
167 / 244
If bad debt provisions are accrued according to the general model of expected credit losses, please refer to
the disclosure on other receivables:
"□ Applicable" "√ Not applicable"
Other descriptions:
"□ Applicable" "√ Not applicable"
11. Held for sale assets
"□ Applicable" "√ Not applicable"
12. Non-current assets due within one year
"√ Applicable" "□ Not applicable"
Unit: Yuan Currency: RMB
Item Closing balance Opening balance
Debt investment due within one year
Other debt investments due within one year
Long-term receivables due within one year 4,637,213.00
Total 4,637,213.00
Important debt investment and other debt investment at the end of the period:
"□ Applicable" "√ Not applicable"
Other descriptions
No
13. Other current assets
"√ Applicable" "□ Not applicable"
Unit: Yuan Currency: RMB
Item Closing balance Opening balance
Contract acquisition cost
Receivable return cost 10,541,165.83
VAT input tax to be certified 8,685,801.62 20,104,638.98
Pre-paid enterprise income tax 549,155.49 1,104,950.25
Carbon quota 35,824.00
VAT retention amount 7,510,484.36 8,035,512.06
Total 27,286,607.30 29,280,925.29
Other descriptions
No
14. Debt investment
(1). Particulars on debt investment
"□ Applicable" "√ Not applicable"

Annual Report 2020
168 / 244
(2). Important debt investment at the end of the period
"□ Applicable" "√ Not applicable"
(3). Particulars on accruing of impairment provisions
"□ Applicable" "√ Not applicable"
The basis for adopting the amount of impairment provisions accrued for the current period and the assessment
on whether the credit risk of financial instruments increased significantly:
"□ Applicable" "√ Not applicable"
Other descriptions
"□ Applicable" "√ Not applicable"
15. Other debt investment
(1). Particulars on other debt investments
"□ Applicable" "√ Not applicable"
(2). Important other debt investments at the end of the period
"□ Applicable" "√ Not applicable"
(3). Particulars on accruing of impairment provisions
"□ Applicable" "√ Not applicable"
The basis for adopting the amount of impairment provisions accrued for the current period and the assessment
on whether the credit risk of financial instruments increased significantly:
"□ Applicable" "√ Not applicable"
Other descriptions:
"□ Applicable" "√ Not applicable"
16. Long-term receivables
(1). Long-term receivables
"√ Applicable" "□ Not applicable"
Unit: Yuan Currency: RMB
Item
Closing balance Opening balance Discount
rate
range
Carrying
balance
Bad debt
provisions
Carrying
value
Carrying
balance
Bad debt
provisions
Carrying
value
Financing lease
receivables
Including:
Unrealized financing
income
Installment sales of
goods
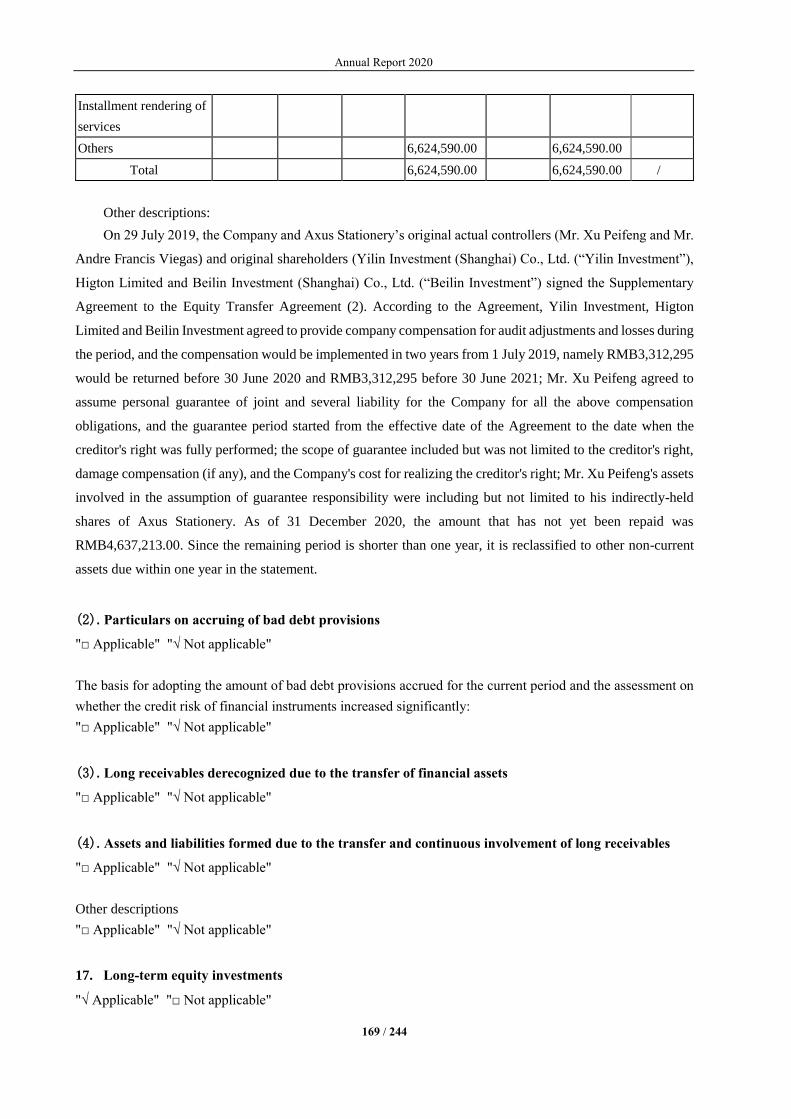
Annual Report 2020
169 / 244
Installment rendering of
services
Others 6,624,590.00 6,624,590.00
Total 6,624,590.00 6,624,590.00 /
Other descriptions:
On 29 July 2019, the Company and Axus Stationery’s original actual controllers (Mr. Xu Peifeng and Mr.
Andre Francis Viegas) and original shareholders (Yilin Investment (Shanghai) Co., Ltd. (“Yilin Investment”),
Higton Limited and Beilin Investment (Shanghai) Co., Ltd. (“Beilin Investment”) signed the Supplementary
Agreement to the Equity Transfer Agreement (2). According to the Agreement, Yilin Investment, Higton
Limited and Beilin Investment agreed to provide company compensation for audit adjustments and losses during
the period, and the compensation would be implemented in two years from 1 July 2019, namely RMB3,312,295
would be returned before 30 June 2020 and RMB3,312,295 before 30 June 2021; Mr. Xu Peifeng agreed to
assume personal guarantee of joint and several liability for the Company for all the above compensation
obligations, and the guarantee period started from the effective date of the Agreement to the date when the
creditor's right was fully performed; the scope of guarantee included but was not limited to the creditor's right,
damage compensation (if any), and the Company's cost for realizing the creditor's right; Mr. Xu Peifeng's assets
involved in the assumption of guarantee responsibility were including but not limited to his indirectly-held
shares of Axus Stationery. As of 31 December 2020, the amount that has not yet been repaid was
RMB4,637,213.00. Since the remaining period is shorter than one year, it is reclassified to other non-current
assets due within one year in the statement.
(2). Particulars on accruing of bad debt provisions
"□ Applicable" "√ Not applicable"
The basis for adopting the amount of bad debt provisions accrued for the current period and the assessment on
whether the credit risk of financial instruments increased significantly:
"□ Applicable" "√ Not applicable"
(3). Long receivables derecognized due to the transfer of financial assets
"□ Applicable" "√ Not applicable"
(4). Assets and liabilities formed due to the transfer and continuous involvement of long receivables
"□ Applicable" "√ Not applicable"
Other descriptions
"□ Applicable" "√ Not applicable"
17. Long-term equity investments
"√ Applicable" "□ Not applicable"
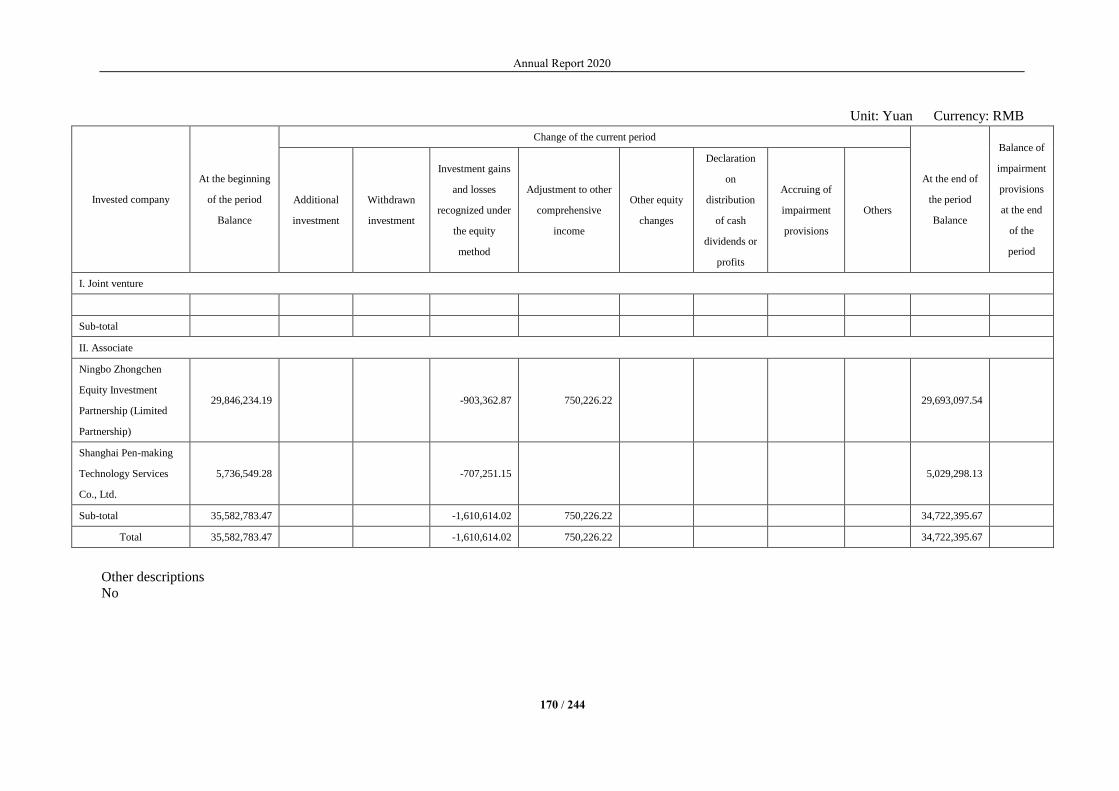
Annual Report 2020
170 / 244
Unit: Yuan Currency: RMB
Invested company
At the beginning
of the period
Balance
Change of the current period
At the end of
the period
Balance
Balance of
impairment
provisions
at the end
of the
period
Additional
investment
Withdrawn
investment
Investment gains
and losses
recognized under
the equity
method
Adjustment to other
comprehensive
income
Other equity
changes
Declaration
on
distribution
of cash
dividends or
profits
Accruing of
impairment
provisions
Others
I. Joint venture
Sub-total
II. Associate
Ningbo Zhongchen
Equity Investment
Partnership (Limited
Partnership)
29,846,234.19 -903,362.87 750,226.22
29,693,097.54
Shanghai Pen-making
Technology Services
Co., Ltd.
5,736,549.28 -707,251.15
5,029,298.13
Sub-total 35,582,783.47 -1,610,614.02 750,226.22 34,722,395.67
Total 35,582,783.47 -1,610,614.02 750,226.22 34,722,395.67
Other descriptions
No

Annual Report 2020
171 / 244
18. Investments in other equity instruments
(1). Particulars on other equity instrument investments
"√ Applicable" "□ Not applicable"
Unit: Yuan Currency: RMB
Item Closing balance Opening balance
Shanghai M&G Culture and Creativity Co., Ltd. 5,476,577.42 3,909,179.93
Total 5,476,577.42 3,909,179.93
(2). Particulars on non-trading equity instrument investment
"√ Applicable" "□ Not applicable"
Unit: Yuan Currency: RMB
Item
Dividend
income
recognized in
the current
period
Accumulated
gains
Accumulated
losses
Amount
transferred from
other
comprehensive
income into
retained earnings
Reason for
designation as at
fair value through
other
comprehensive
income
Reason for
transfer from
other
comprehensive
income into
retained earnings
Shanghai
M&G Culture
and Creativity
Co., Ltd.
1,876,577.42 the Company held
the investment for
non-trading
purposes
Other descriptions:
"□ Applicable" "√ Not applicable"
19. Other non-current financial assets
"□ Applicable" "√ Not applicable"
Other descriptions:
"□ Applicable" "√ Not applicable"
20. Investment real estate
Measurement model of investment real estate
Not applicable
21. Fixed assets
Presented by item
"√ Applicable" "□ Not applicable"
Unit: Yuan Currency: RMB
Item Closing balance Opening balance
Fixed assets 1,847,635,724.45 1,163,702,352.12
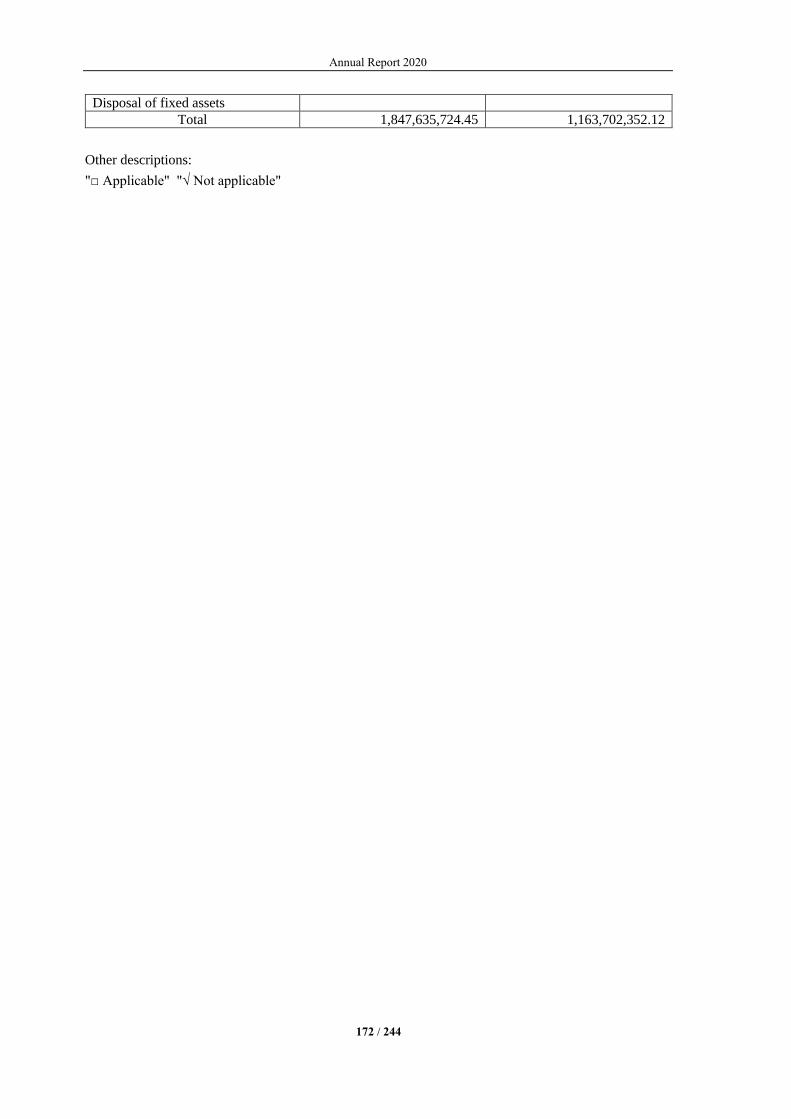
Annual Report 2020
172 / 244
Disposal of fixed assets
Total 1,847,635,724.45 1,163,702,352.12
Other descriptions:
"□ Applicable" "√ Not applicable"

Annual Report 2020
173 / 244
Fixed assets
(1). Particulars on fixed assets
"√ Applicable" "□ Not applicable"
Unit: Yuan Currency: RMB
Item Property and buildings Machinery and equipment Means of transportation Other equipment Total
I. Original carrying value:
1. Balance at the beginning of the period 941,980,900.93 726,180,721.46 57,391,043.68 304,599,519.14 2,030,152,185.21
2. Increase amount of the current period 773,201,860.29 54,512,057.80 3,260,151.82 40,532,487.22 871,506,557.13
(1) Acquisition 413,350,966.04 1,598,780.42 2,402,056.10 7,741,673.34 425,093,475.90
(2) Transfer-in from construction in
progress 359,850,894.25 52,913,277.38 858,095.72 32,790,813.88 446,413,081.23
(3) Increase for business combination
3. Decrease amount of the current period 698,967.97 7,391,483.22 3,096,448.52 22,038,233.42 33,225,133.13
(1) Disposal or scraping 10,950.18 6,202,686.37 3,079,876.82 21,730,278.32 31,023,791.69
(2) Translation difference of foreign-
currency statements 688,017.79 1,188,796.85 16,571.70 307,955.10 2,201,341.44
4. Balance at the end of the period 1,714,483,793.25 773,301,296.04 57,554,746.98 323,093,772.94 2,868,433,609.21
II. Accumulative depreciation
1. Balance at the beginning of the period 254,107,049.63 339,490,427.89 45,715,724.10 226,902,482.77 866,215,684.39
2. Increase amount of the current period 55,887,900.79 70,603,850.06 3,300,571.59 49,455,842.59 179,248,165.03
(1) Accruing 55,887,900.79 70,603,850.06 3,300,571.59 49,455,842.59 179,248,165.03
3. Decrease amount of the current period 76,324.60 5,426,153.45 2,345,248.30 17,052,387.01 24,900,113.36
(1) Disposal or scraping 4,203.65 4,578,385.00 2,337,313.66 16,874,764.92 23,794,667.23
(2) Translation difference of foreign-
currency statements
72,120.95 847,768.45 7,934.64 177,622.09 1,105,446.13
4. Balance at the end of the period 309,918,625.82 404,668,124.50 46,671,047.39 259,305,938.35 1,020,563,736.06
III. Impairment provisions
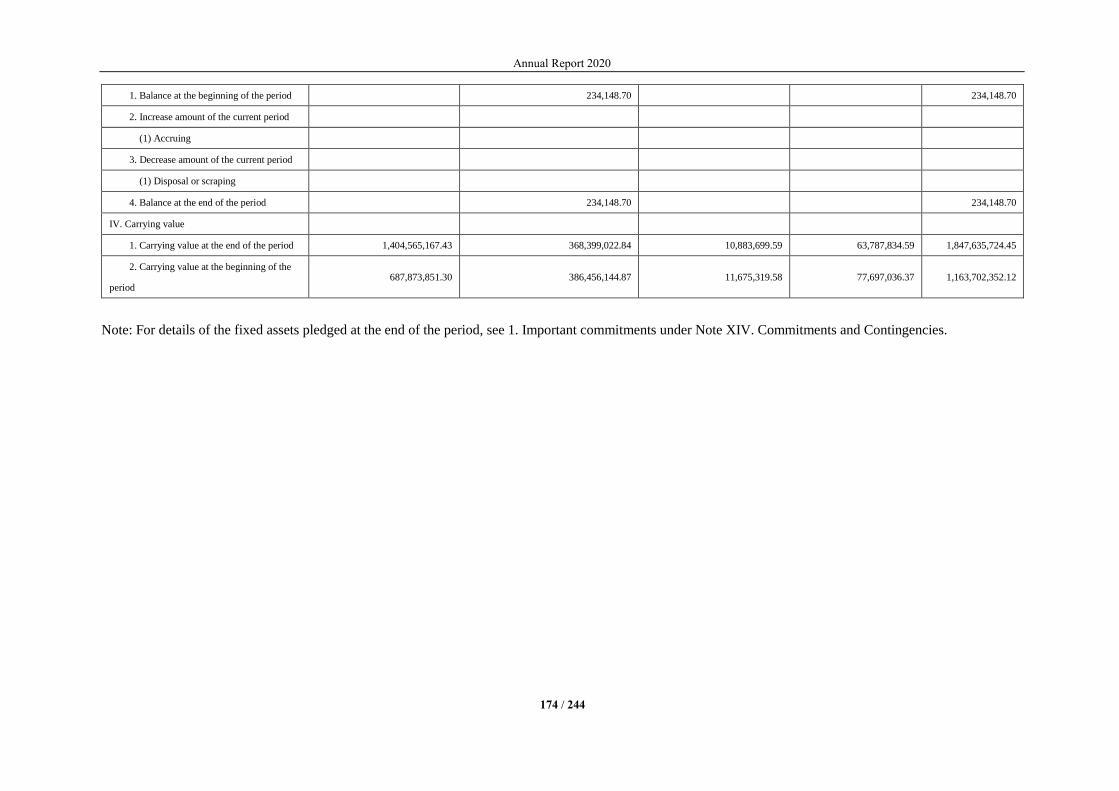
Annual Report 2020
174 / 244
1. Balance at the beginning of the period 234,148.70 234,148.70
2. Increase amount of the current period
(1) Accruing
3. Decrease amount of the current period
(1) Disposal or scraping
4. Balance at the end of the period 234,148.70 234,148.70
IV. Carrying value
1. Carrying value at the end of the period 1,404,565,167.43 368,399,022.84 10,883,699.59 63,787,834.59 1,847,635,724.45
2. Carrying value at the beginning of the
period 687,873,851.30 386,456,144.87 11,675,319.58 77,697,036.37 1,163,702,352.12
Note: For details of the fixed assets pledged at the end of the period, see 1. Important commitments under Note XIV. Commitments and Contingencies.
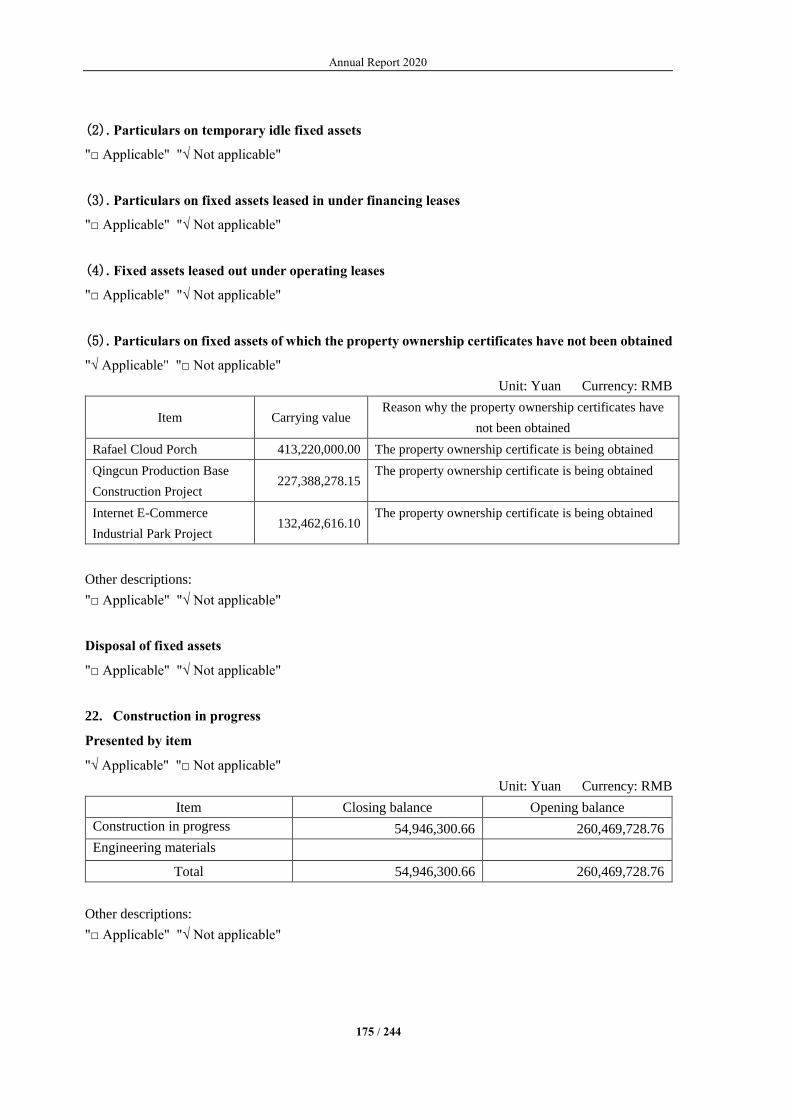
Annual Report 2020
175 / 244
(2). Particulars on temporary idle fixed assets
"□ Applicable" "√ Not applicable"
(3). Particulars on fixed assets leased in under financing leases
"□ Applicable" "√ Not applicable"
(4). Fixed assets leased out under operating leases
"□ Applicable" "√ Not applicable"
(5). Particulars on fixed assets of which the property ownership certificates have not been obtained
"√ Applicable" "□ Not applicable"
Unit: Yuan Currency: RMB
Item Carrying value Reason why the property ownership certificates have
not been obtained
Rafael Cloud Porch 413,220,000.00 The property ownership certificate is being obtained
Qingcun Production Base
Construction Project 227,388,278.15
The property ownership certificate is being obtained
Internet E-Commerce
Industrial Park Project 132,462,616.10
The property ownership certificate is being obtained
Other descriptions:
"□ Applicable" "√ Not applicable"
Disposal of fixed assets
"□ Applicable" "√ Not applicable"
22. Construction in progress
Presented by item
"√ Applicable" "□ Not applicable"
Unit: Yuan Currency: RMB
Item Closing balance Opening balance
Construction in progress 54,946,300.66 260,469,728.76
Engineering materials
Total 54,946,300.66 260,469,728.76
Other descriptions:
"□ Applicable" "√ Not applicable"

Annual Report 2020
176 / 244
Construction in progress
(1). Particulars on construction in progress
"√ Applicable" "□ Not applicable"
Unit: Yuan Currency: RMB
Item
Closing balance Opening balance
Carrying
balance
Impairment
provisions
Carrying
value
Carrying
balance
Impairment
provisions
Carrying
value
Qingcun
Production Base
Construction
Project
158,942,138.30
158,942,138.30
Internet E-
Commerce
Industrial Park
Project
82,259,438.98
82,259,438.98
Fixed assets not
yet installed and
put into use
23,771,536.87 23,771,536.87 8,824,754.04
8,824,754.04
Others 31,174,763.79 31,174,763.79 10,443,397.44 10,443,397.44
Total 54,946,300.66 54,946,300.66 260,469,728.76 260,469,728.76
(2). Changes in important construction in progress projects in the current period
"√ Applicable" "□ Not applicable"
Unit: Yuan Currency: RMB
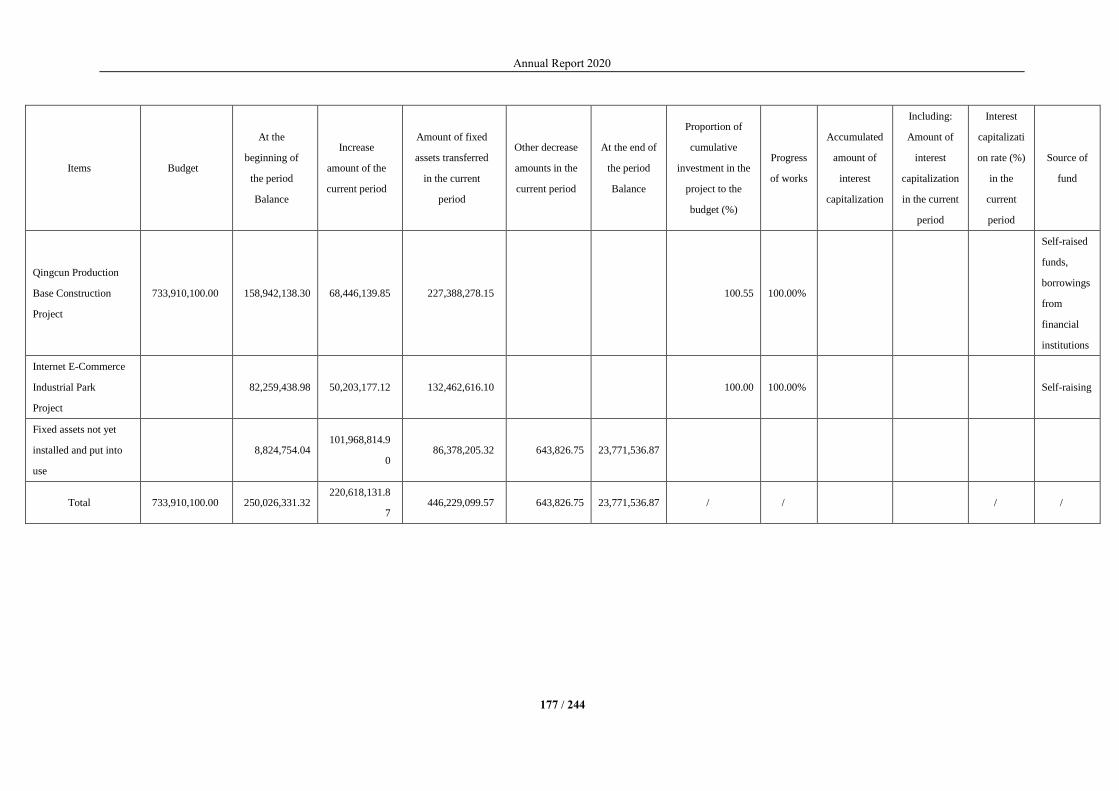
Annual Report 2020
177 / 244
Items Budget
At the
beginning of
the period
Balance
Increase
amount of the
current period
Amount of fixed
assets transferred
in the current
period
Other decrease
amounts in the
current period
At the end of
the period
Balance
Proportion of
cumulative
investment in the
project to the
budget (%)
Progress
of works
Accumulated
amount of
interest
capitalization
Including:
Amount of
interest
capitalization
in the current
period
Interest
capitalizati
on rate (%)
in the
current
period
Source of
fund
Qingcun Production
Base Construction
Project
733,910,100.00 158,942,138.30 68,446,139.85 227,388,278.15 100.55 100.00%
Self-raised
funds,
borrowings
from
financial
institutions
Internet E-Commerce
Industrial Park
Project
82,259,438.98 50,203,177.12 132,462,616.10 100.00 100.00% Self-raising
Fixed assets not yet
installed and put into
use
8,824,754.04 101,968,814.9
0 86,378,205.32 643,826.75 23,771,536.87
Total 733,910,100.00 250,026,331.32 220,618,131.8
7 446,229,099.57 643,826.75 23,771,536.87 / / / /
Annual Report 2020
178 / 244
(3). Particulars on impairment provisions accrued for construction in progress in the current
period
"□ Applicable" "√ Not applicable"
Other descriptions
"□ Applicable" "√ Not applicable"
Engineering materials
(1). Particulars on engineering materials
"□ Applicable" "√ Not applicable"
23. Productive biological assets
(1). Productive biological assets using cost measurement model
"□ Applicable" "√ Not applicable"
(2). Productive biological assets using fair value measurement model
"□ Applicable" "√ Not applicable"
Other descriptions
"□ Applicable" "√ Not applicable"
24. Oil and gas assets
"□ Applicable" "√ Not applicable"
25. Right-of-use assets
"□ Applicable" "√ Not applicable"
26. Intangible assets
(1). Particulars on intangible assets
"√ Applicable" "□ Not applicable"

Annual Report 2020
179 / 244
Unit: Yuan Currency: RMB
Item Land use rights Patent right Unpatented
technology
Image identification
rights Software Others Total
I. Original carrying value
1. Balance at the beginning of the period 340,017,339.10 12,645,665.79 93,989.00 33,251,616.77 1,682,622.64 387,691,233.30
2. Increase amount of the current period 529,481.27 2,937,777.45 853,144.87 4,320,403.59
(1) Acquisition 529,481.27 2,937,777.45 853,144.87 4,320,403.59
(2) R&D
(3) Increase for business combination
3. Decrease amount of the current period 1,097,401.49 445,051.37 1,542,452.86
(1) Disposal 445,051.37 445,051.37
(2) Difference of exchange gains and
losses 1,097,401.49 1,097,401.49
4. Balance at the end of the period 338,919,937.61 13,175,147.06 93,989.00 36,189,394.22 2,090,716.14 390,469,184.03
2. Cumulative amortization
1. Balance at the beginning of the period 35,113,467.03 3,302,094.44 93,989.00 17,093,298.26 1,082,622.48 56,685,471.21
2. Increase amount of the current period 8,034,173.16 830,531.47 3,813,640.96 437,995.23 13,116,340.82
(1) Accruing 8,034,173.16 830,531.47 3,813,640.96 437,995.23 13,116,340.82
(2) Difference of exchange gains and
losses
3. Decrease amount of the current period 78,956.60 78,956.60

Annual Report 2020
180 / 244
(1) Disposal
(2) Invalid and derecognized portion
4. Balance at the end of the period 43,068,683.59 4,132,625.91 93,989.00 20,906,939.22 1,520,617.71 69,722,855.43
III. Impairment provisions
1. Balance at the beginning of the period
2. Increase amount of the current period
(1) Accruing
3. Decrease amount of the current period
(1) Disposal
4. Balance at the end of the period
IV. Carrying value
1. Carrying value at the end of the period 295,851,254.02 9,042,521.15 15,282,455.00 570,098.43 320,746,328.60
2. Carrying value at the beginning of the
period 304,903,872.07 9,343,571.35 16,158,318.51 600,000.16 331,005,762.09
The proportion of intangible assets formed by the Company's internal R&D at the end of the current period in the balance of intangible assets was 0
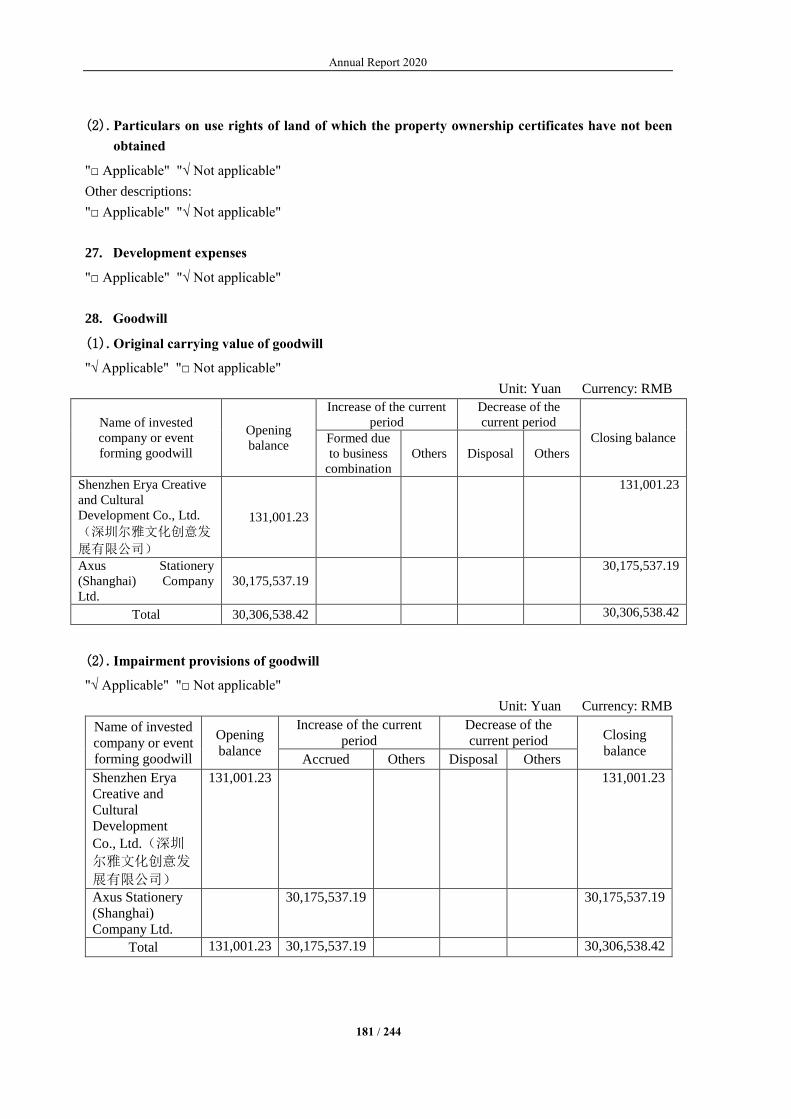
Annual Report 2020
181 / 244
(2). Particulars on use rights of land of which the property ownership certificates have not been
obtained
"□ Applicable" "√ Not applicable"
Other descriptions:
"□ Applicable" "√ Not applicable"
27. Development expenses
"□ Applicable" "√ Not applicable"
28. Goodwill
(1). Original carrying value of goodwill
"√ Applicable" "□ Not applicable"
Unit: Yuan Currency: RMB
Name of invested
company or event
forming goodwill
Opening
balance
Increase of the current
period
Decrease of the
current period
Closing balance Formed due
to business
combination
Others Disposal Others
Shenzhen Erya Creative
and Cultural
Development Co., Ltd.
(深圳尔雅文化创意发
展有限公司)
131,001.23
131,001.23
Axus Stationery
(Shanghai) Company
Ltd.
30,175,537.19
30,175,537.19
Total 30,306,538.42 30,306,538.42
(2). Impairment provisions of goodwill
"√ Applicable" "□ Not applicable"
Unit: Yuan Currency: RMB
Name of invested
company or event
forming goodwill
Opening
balance
Increase of the current
period
Decrease of the
current period Closing
balance Accrued Others Disposal Others
Shenzhen Erya
Creative and
Cultural
Development
Co., Ltd.(深圳
尔雅文化创意发
展有限公司)
131,001.23 131,001.23
Axus Stationery
(Shanghai)
Company Ltd.
30,175,537.19 30,175,537.19
Total 131,001.23 30,175,537.19 30,306,538.42

Annual Report 2020
182 / 244
(3). Information regarding the asset group or the combination of asset groups to which goodwill
belongs
"√ Applicable" "□ Not applicable"
Name of
asset group
Carrying
value of
goodwill
attributable to
shareholders
of the parent
company
Carrying
value of
goodwill
attributable to
minority
shareholders
Total carrying
value of
goodwill
Carrying value
of other assets
in the asset
group or the
combination of
asset groups
Carrying value
of the asset
group or the
combination of
asset groups
including
goodwill
Whether
the asset
group
has
changed
Shenzhen
Erya
Creative and
Cultural
Development
Co., Ltd.(深
圳尔雅文化
创意发展有
限公司)
131,001.23 125,863.93 256,865.16 1,000,251.34 1,257,116.50 No
Axus
Stationery
(Shanghai)
Company
Ltd.
30,175,537.19 23,709,350.65 53,884,887.84 397,174,874.58 451,059,762.42 No
(4). Describe the goodwill impairment test process, key parameters (such as growth rate in the
forecast period, growth rate in the stable period, profit margin, discount rate, forecast period,
etc. when estimating the present value of the estimated future cash flow, if applicable) and the
recognition method for impairment losses of goodwill
"√ Applicable" "□ Not applicable"
Name of
asset group
Key parameter Present
value of
estimated
future cash
flow
Amount of
goodwill
impairment
provisions
Forecast
period
Growth
rate in
the
steady
period
Profit margin
Discount rate
(weighted average
cost of capital
WACC)
Axus
Stationery
(Shanghai)
Company
Ltd.
2021-2026 Flat
Calculated
according to
predicted
income, costs,
expenses, etc.
12.30% 399,000,000.00 30,175,537.19

Annual Report 2020
183 / 244
(5). Effect of goodwill impairment test
"√ Applicable" "□ Not applicable"
For the current year, the Company hired Shanghai Lixin Appraisal Co., Ltd. to issue the Asset
Appraisal Report on the Recoverable Amount of Relevant Asset Groups of Axus Stationery (Shanghai)
Company Ltd. involved in the Goodwill Impairment Test Carried out by Shanghai M&G Stationery Inc.
for the Purpose of Financial Reporting with the report number of Xin Zi Ping Bao Zi [2021] No.090009
on 26 March 2021. According to the appraisal results, as of 31 December 2020, the carrying value of the
asst group or the combination of asset groups including goodwill of Axus Stationery acquired by the
Company was RMB451,059,800, and the recoverable amount was RMB399,000,000; after the test, the
full provision for impairment was accrued for the goodwill formed by the Company's acquisition of Axus
Stationery.
Other descriptions
"□ Applicable" "√ Not applicable"
29. Long-term prepaid expenses
"√ Applicable" "□ Not applicable"
Unit: Yuan Currency: RMB
Item Opening
balance
Increase
amount of the
current period
Amortization
amount of the
current period
Other decrease
amounts
Closing balance
Decoration fee 116,266,913.64 42,992,088.15 61,611,508.84 478,493.84 97,168,999.11
Others 2,069,420.31 2,384,191.57 2,579,056.33 7,701.88 1,866,853.67
Total 118,336,333.95 45,376,279.72 64,190,565.17 486,195.72 99,035,852.78
Other descriptions:
No
30. Deferred income tax assets/Deferred income tax liabilities
(1). Unoffset deferred income tax assets
"√ Applicable" "□ Not applicable"
Unit: Yuan Currency: RMB
Item
Closing balance Opening balance
Deductible
temporary
differences
Deferred income
tax
Assets
Deductible
temporary
differences
Deferred income
tax
Assets
Impairment provisions
of assets 62,830,410.42 15,736,764.19 57,383,899.78
12,974,482.56
Unrealized profits from
internal transactions 128,331,275.32 19,493,583.59 105,422,678.59 17,734,494.35
Deductible losses 15,475,765.74 3,868,941.44 1,394,984.07 348,746.02
Deferred income 43,408,616.60 8,510,440.37 28,808,795.45 4,356,820.94
Depreciation or
amortization difference 88,272,113.20 22,068,028.30
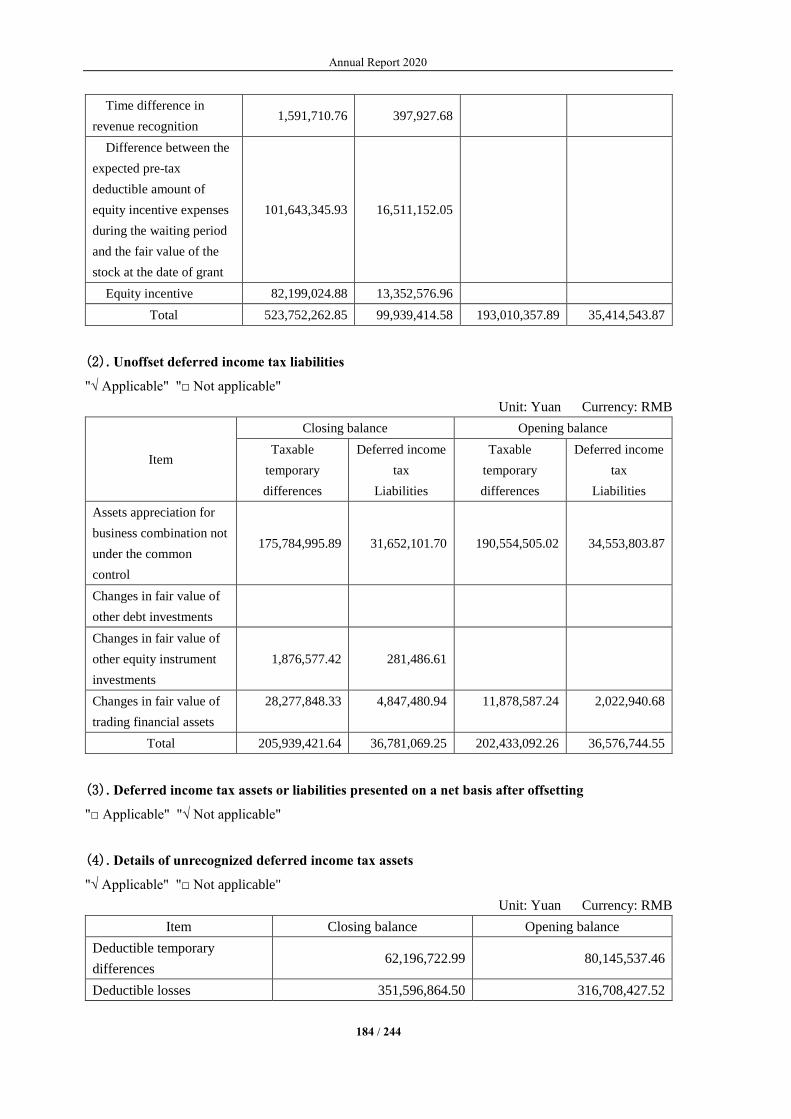
Annual Report 2020
184 / 244
Time difference in
revenue recognition 1,591,710.76 397,927.68
Difference between the
expected pre-tax
deductible amount of
equity incentive expenses
during the waiting period
and the fair value of the
stock at the date of grant
101,643,345.93 16,511,152.05
Equity incentive 82,199,024.88 13,352,576.96
Total 523,752,262.85 99,939,414.58 193,010,357.89 35,414,543.87
(2). Unoffset deferred income tax liabilities
"√ Applicable" "□ Not applicable"
Unit: Yuan Currency: RMB
Item
Closing balance Opening balance
Taxable
temporary
differences
Deferred income
tax
Liabilities
Taxable
temporary
differences
Deferred income
tax
Liabilities
Assets appreciation for
business combination not
under the common
control
175,784,995.89 31,652,101.70 190,554,505.02 34,553,803.87
Changes in fair value of
other debt investments
Changes in fair value of
other equity instrument
investments
1,876,577.42 281,486.61
Changes in fair value of
trading financial assets
28,277,848.33 4,847,480.94 11,878,587.24 2,022,940.68
Total 205,939,421.64 36,781,069.25 202,433,092.26 36,576,744.55
(3). Deferred income tax assets or liabilities presented on a net basis after offsetting
"□ Applicable" "√ Not applicable"
(4). Details of unrecognized deferred income tax assets
"√ Applicable" "□ Not applicable"
Unit: Yuan Currency: RMB
Item Closing balance Opening balance
Deductible temporary
differences 62,196,722.99 80,145,537.46
Deductible losses 351,596,864.50 316,708,427.52
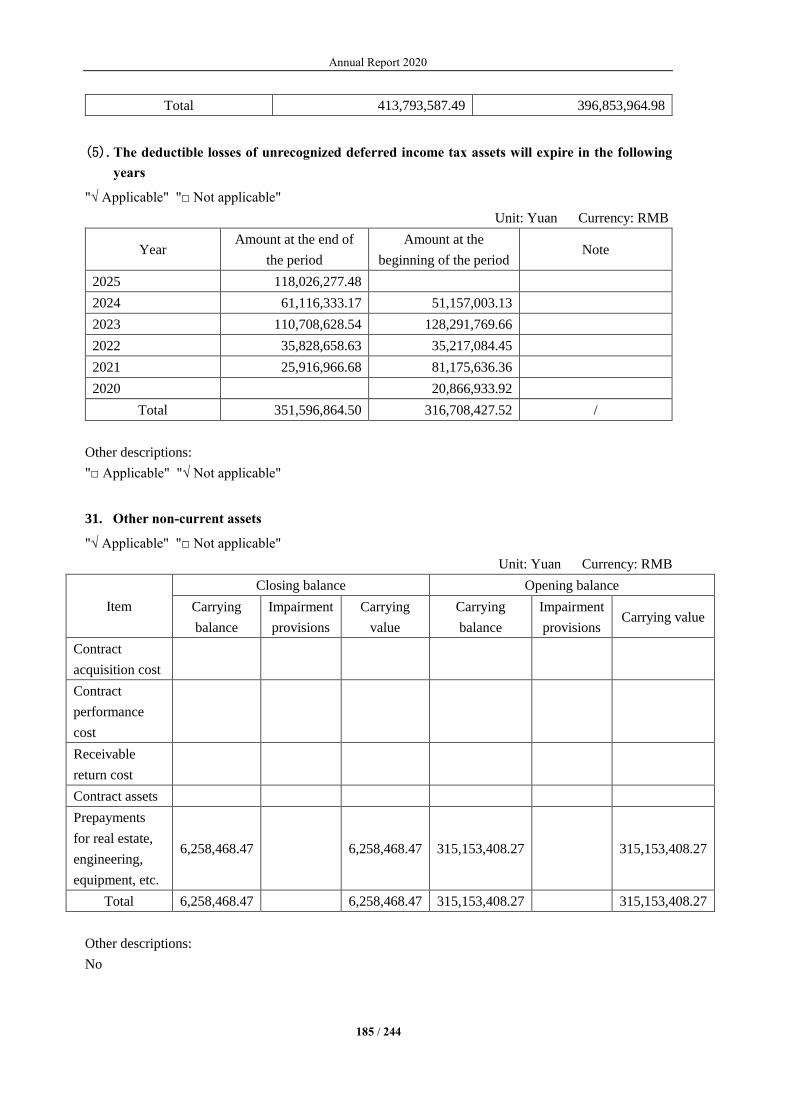
Annual Report 2020
185 / 244
Total 413,793,587.49 396,853,964.98
(5). The deductible losses of unrecognized deferred income tax assets will expire in the following
years
"√ Applicable" "□ Not applicable"
Unit: Yuan Currency: RMB
Year Amount at the end of
the period
Amount at the
beginning of the period Note
2025 118,026,277.48
2024 61,116,333.17 51,157,003.13
2023 110,708,628.54 128,291,769.66
2022 35,828,658.63 35,217,084.45
2021 25,916,966.68 81,175,636.36
2020 20,866,933.92
Total 351,596,864.50 316,708,427.52 /
Other descriptions:
"□ Applicable" "√ Not applicable"
31. Other non-current assets
"√ Applicable" "□ Not applicable"
Unit: Yuan Currency: RMB
Item
Closing balance Opening balance
Carrying
balance
Impairment
provisions
Carrying
value
Carrying
balance
Impairment
provisions Carrying value
Contract
acquisition cost
Contract
performance
cost
Receivable
return cost
Contract assets
Prepayments
for real estate,
engineering,
equipment, etc.
6,258,468.47 6,258,468.47 315,153,408.27 315,153,408.27
Total 6,258,468.47 6,258,468.47 315,153,408.27 315,153,408.27
Other descriptions:
No
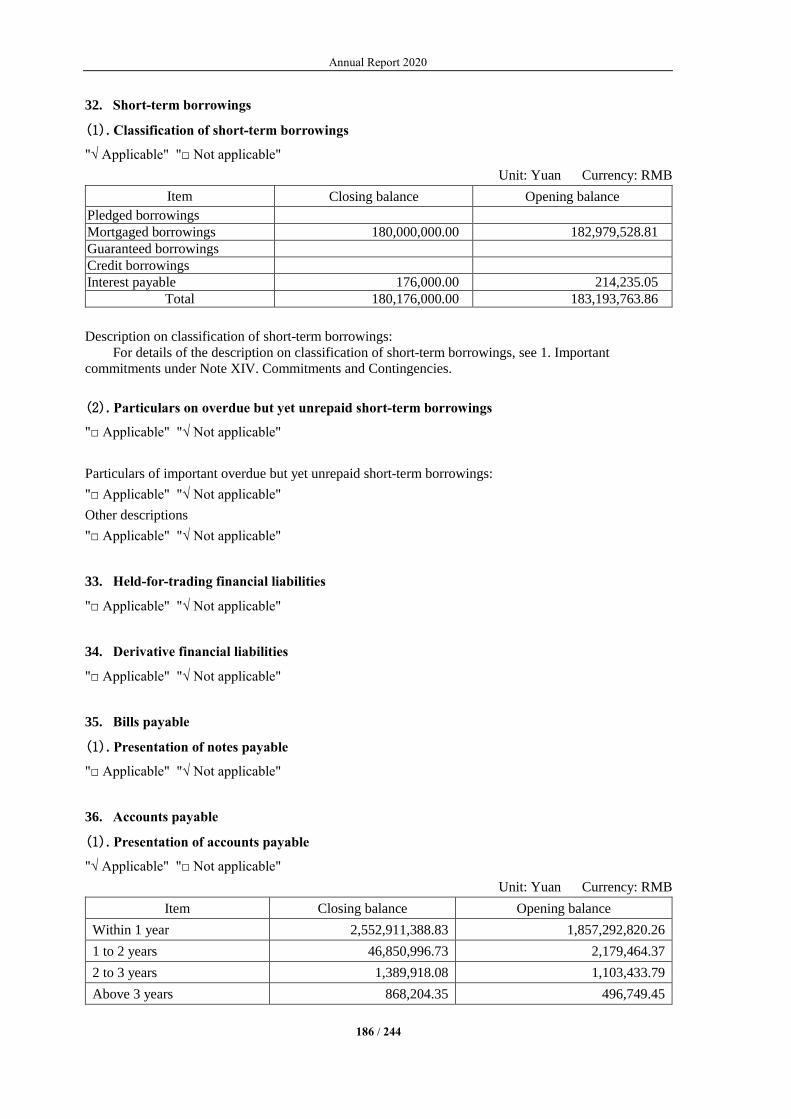
Annual Report 2020
186 / 244
32. Short-term borrowings
(1). Classification of short-term borrowings
"√ Applicable" "□ Not applicable"
Unit: Yuan Currency: RMB
Item Closing balance Opening balance
Pledged borrowings
Mortgaged borrowings 180,000,000.00 182,979,528.81
Guaranteed borrowings
Credit borrowings
Interest payable 176,000.00 214,235.05
Total 180,176,000.00 183,193,763.86
Description on classification of short-term borrowings:
For details of the description on classification of short-term borrowings, see 1. Important
commitments under Note XIV. Commitments and Contingencies.
(2). Particulars on overdue but yet unrepaid short-term borrowings
"□ Applicable" "√ Not applicable"
Particulars of important overdue but yet unrepaid short-term borrowings:
"□ Applicable" "√ Not applicable"
Other descriptions
"□ Applicable" "√ Not applicable"
33. Held-for-trading financial liabilities
"□ Applicable" "√ Not applicable"
34. Derivative financial liabilities
"□ Applicable" "√ Not applicable"
35. Bills payable
(1). Presentation of notes payable
"□ Applicable" "√ Not applicable"
36. Accounts payable
(1). Presentation of accounts payable
"√ Applicable" "□ Not applicable"
Unit: Yuan Currency: RMB
Item Closing balance Opening balance
Within 1 year 2,552,911,388.83 1,857,292,820.26
1 to 2 years 46,850,996.73 2,179,464.37
2 to 3 years 1,389,918.08 1,103,433.79
Above 3 years 868,204.35 496,749.45
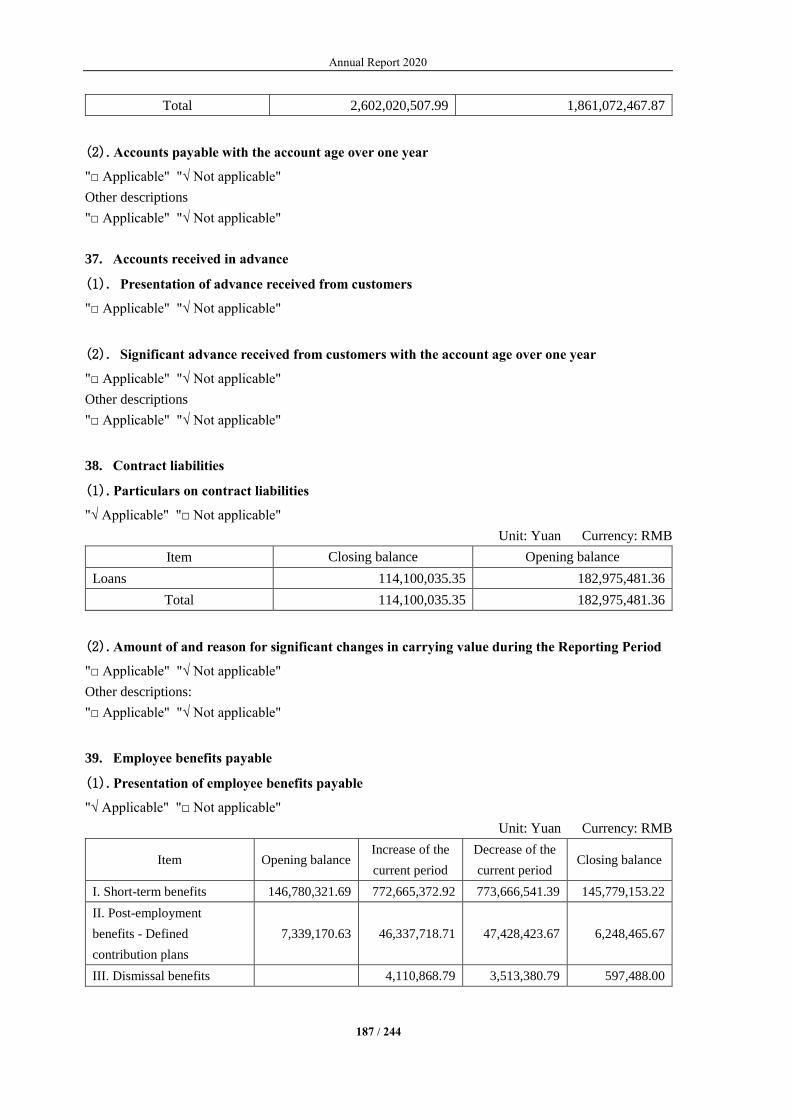
Annual Report 2020
187 / 244
Total 2,602,020,507.99 1,861,072,467.87
(2). Accounts payable with the account age over one year
"□ Applicable" "√ Not applicable"
Other descriptions
"□ Applicable" "√ Not applicable"
37. Accounts received in advance
(1). Presentation of advance received from customers
"□ Applicable" "√ Not applicable"
(2). Significant advance received from customers with the account age over one year
"□ Applicable" "√ Not applicable"
Other descriptions
"□ Applicable" "√ Not applicable"
38. Contract liabilities
(1). Particulars on contract liabilities
"√ Applicable" "□ Not applicable"
Unit: Yuan Currency: RMB
Item Closing balance Opening balance
Loans 114,100,035.35 182,975,481.36
Total 114,100,035.35 182,975,481.36
(2). Amount of and reason for significant changes in carrying value during the Reporting Period
"□ Applicable" "√ Not applicable"
Other descriptions:
"□ Applicable" "√ Not applicable"
39. Employee benefits payable
(1). Presentation of employee benefits payable
"√ Applicable" "□ Not applicable"
Unit: Yuan Currency: RMB
Item Opening balance Increase of the
current period
Decrease of the
current period Closing balance
I. Short-term benefits 146,780,321.69 772,665,372.92 773,666,541.39 145,779,153.22
II. Post-employment
benefits - Defined
contribution plans
7,339,170.63 46,337,718.71 47,428,423.67 6,248,465.67
III. Dismissal benefits 4,110,868.79 3,513,380.79 597,488.00

Annual Report 2020
188 / 244
IV. Other benefits due
within one year
Total 154,119,492.32 823,113,960.42 824,608,345.85 152,625,106.89
(2). Presentation of short-term benefits
"√ Applicable" "□ Not applicable"
Unit: Yuan Currency: RMB
Item Opening balance Increase of the
current period
Decrease of the
current period Closing balance
I. Salary, bonus,
allowance and subsidy 136,748,768.51 681,595,603.59 680,957,347.72 137,387,024.38
II. Employee benefits 393.33 19,919,866.58 19,887,526.58 32,733.33
III. Social insurance 3,827,119.22 41,736,224.16 41,822,820.28 3,740,523.10
Including: Medical
insurance 3,337,870.76 37,403,336.63 37,122,847.35 3,618,360.04
Work-related
injury insurance 145,404.67 3,080,065.03 3,113,015.83 112,453.87
Maternity
insurance 343,843.79 1,252,822.50 1,586,957.10 9,709.19
IV. Housing provident
fund 2,599,231.67 24,852,031.82 24,688,470.60 2,762,792.89
V. Labor union and
employee education
funds
3,322,429.95 459,468.67 1,927,978.56 1,853,920.06
VI. Short-term
compensated absences 279,975.38 4,101,706.10 4,381,681.48
VII. Short-term profit
sharing plan
VIII. Other short-term
benefits 2,403.63 472.00 716.17
2,159.46
Total 146,780,321.69 772,665,372.92 773,666,541.39 145,779,153.22
(3). Presentation of defined contribution plans
"√ Applicable" "□ Not applicable"
Unit: Yuan Currency: RMB
Item Opening
balance
Increase of the
current period
Decrease of the
current period Closing balance
1. Basic pension 7,155,776.88 44,812,116.60 45,853,551.82 6,114,341.66
2. Unemployment
insurance 183,393.75 1,525,602.11 1,574,871.85 134,124.01
3. Enterprise annuity
payment

Annual Report 2020
189 / 244
Total 7,339,170.63 46,337,718.71 47,428,423.67 6,248,465.67
Other descriptions:
"□ Applicable" "√ Not applicable"
40. Taxes payable
"√ Applicable" "□ Not applicable"
Unit: Yuan Currency: RMB
Item Closing balance Opening balance
Value added tax (“VAT”) 223,026,940.44 104,412,244.02
Consumption tax
Business tax
Enterprise income tax 217,311,562.20 130,486,171.57
Personnel income tax 9,161,957.00 8,228,966.18
Urban maintenance and
construction tax 7,416,779.26
3,975,132.04
Property tax 290,044.29 476,707.70
Education surcharge 10,972,177.74 5,857,154.52
Land use tax 1,539,806.37 1,492,046.98
Stamp duty 7,505,424.40 3,439,030.61
Others 15,527.40 215,664.52
Total 477,240,219.10 258,583,118.14
Other descriptions:
No
41. Other payables
Presented by item
"√ Applicable" "□ Not applicable"
Unit: Yuan Currency: RMB
Item Closing balance Opening balance
Interest payable
Dividend payable
Other payables 625,468,675.97 331,438,976.35
Total 625,468,675.97 331,438,976.35
Other descriptions:
"□ Applicable" "√ Not applicable"
Interest payable
(1). Presentation by category
"□ Applicable" "√ Not applicable"

Annual Report 2020
190 / 244
Dividend payable
(1). Presentation by category
"□ Applicable" "√ Not applicable"
Other payables
(1). Other payables presented by amount nature
"√ Applicable" "□ Not applicable"
Unit: Yuan Currency: RMB
Item Closing balance Opening balance
Margin and deposit 161,138,624.45 153,783,801.10
Repurchase obligations of restricted stocks 176,034,120.00
Product license fee 1,860,000.00 1,051,890.00
Estimated fees 189,127,390.60 126,261,415.65
Engineering and decoration fund 75,577,971.07 28,482,632.65
Others 21,730,569.85 21,859,236.95
Total 625,468,675.97 331,438,976.35
(2). Other payables with the account age over one year
"□ Applicable" "√ Not applicable"
Other descriptions:
"□ Applicable" "√ Not applicable"
42. Held-for-sale liabilities
"□ Applicable" "√ Not applicable"
43. Non-current liabilities due within one year
"□ Applicable" "√ Not applicable"
44. Other current liabilities
Particulars on other current liabilities
"√ Applicable" "□ Not applicable"
Unit: Yuan Currency: RMB
Item Closing balance Opening balance
Short-term bonds payable
Return amount payable
Output tax to be written off 13,746,089.97 23,786,812.58
Total 13,746,089.97 23,786,812.58
Changes in short-term bonds payable:
"□ Applicable" "√ Not applicable"

Annual Report 2020
191 / 244
Other descriptions:
"□ Applicable" "√ Not applicable"
45. Long-term borrowings
(1). Classification of long-term borrowings
"□ Applicable" "√ Not applicable"
Other descriptions, including interest rate ranges:
"□ Applicable" "√ Not applicable"
46. Bonds payable
(1). Bonds payable
"□ Applicable" "√ Not applicable"
(2). Changes in bonds payable: (excluding other financial instruments such as preferred shares
classified as financial liabilities and perpetual bonds)
"□ Applicable" "√ Not applicable"
(3). Description on the conversion conditions and conversion time of convertible corporate bonds
"□ Applicable" "√ Not applicable"
(4). Description on other financial instruments classified as financial liabilities
Basic information on other financial instruments such as outstanding preferred shares and perpetual
bonds at the end of the period
"□ Applicable" "√ Not applicable"
Form of changes in financial instruments such as outstanding preferred shares and perpetual bonds at the
end of the period
"□ Applicable" "√ Not applicable"
Description of the basis for other financial instruments classified as financial liabilities:
"□ Applicable" "√ Not applicable"
Other descriptions:
"□ Applicable" "√ Not applicable"
47. Lease liabilities
"□ Applicable" "√ Not applicable"
48. Long-term payables
Presented by item
"√ Applicable" "□ Not applicable"
Unit: Yuan Currency: RMB
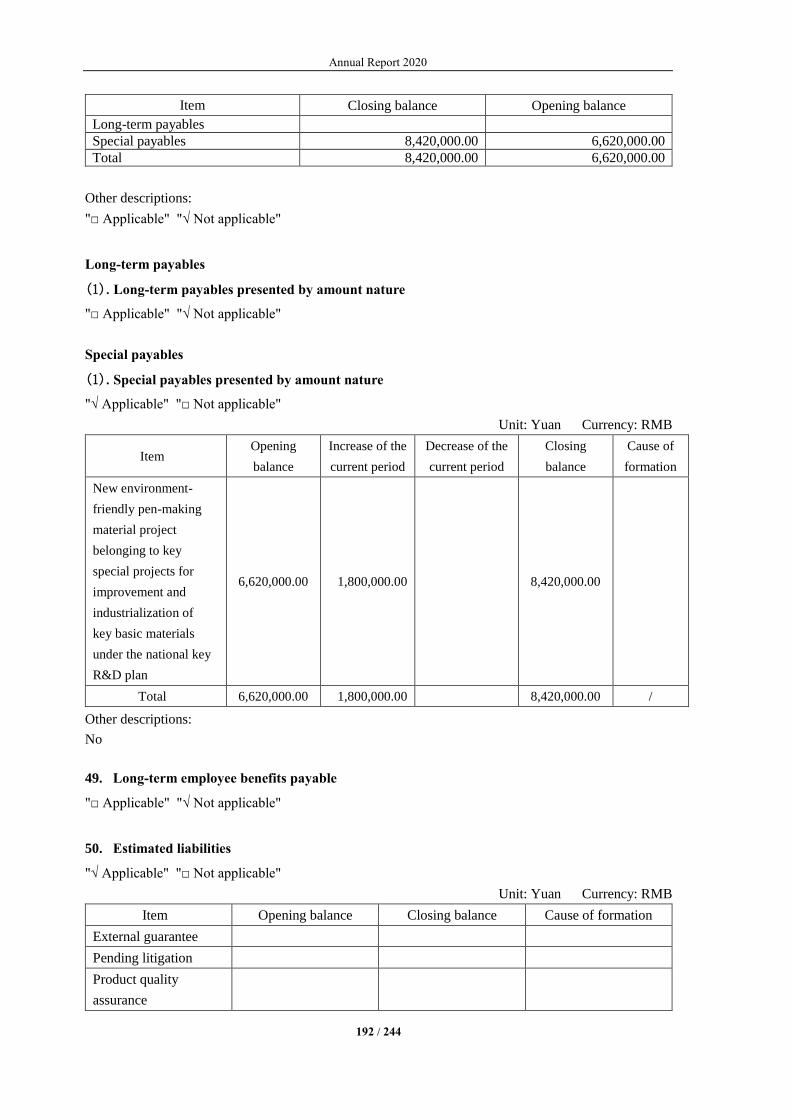
Annual Report 2020
192 / 244
Item Closing balance Opening balance
Long-term payables
Special payables 8,420,000.00 6,620,000.00
Total 8,420,000.00 6,620,000.00
Other descriptions:
"□ Applicable" "√ Not applicable"
Long-term payables
(1). Long-term payables presented by amount nature
"□ Applicable" "√ Not applicable"
Special payables
(1). Special payables presented by amount nature
"√ Applicable" "□ Not applicable"
Unit: Yuan Currency: RMB
Item Opening
balance
Increase of the
current period
Decrease of the
current period
Closing
balance
Cause of
formation
New environment-
friendly pen-making
material project
belonging to key
special projects for
improvement and
industrialization of
key basic materials
under the national key
R&D plan
6,620,000.00 1,800,000.00 8,420,000.00
Total 6,620,000.00 1,800,000.00 8,420,000.00 /
Other descriptions:
No
49. Long-term employee benefits payable
"□ Applicable" "√ Not applicable"
50. Estimated liabilities
"√ Applicable" "□ Not applicable"
Unit: Yuan Currency: RMB
Item Opening balance Closing balance Cause of formation
External guarantee
Pending litigation
Product quality
assurance
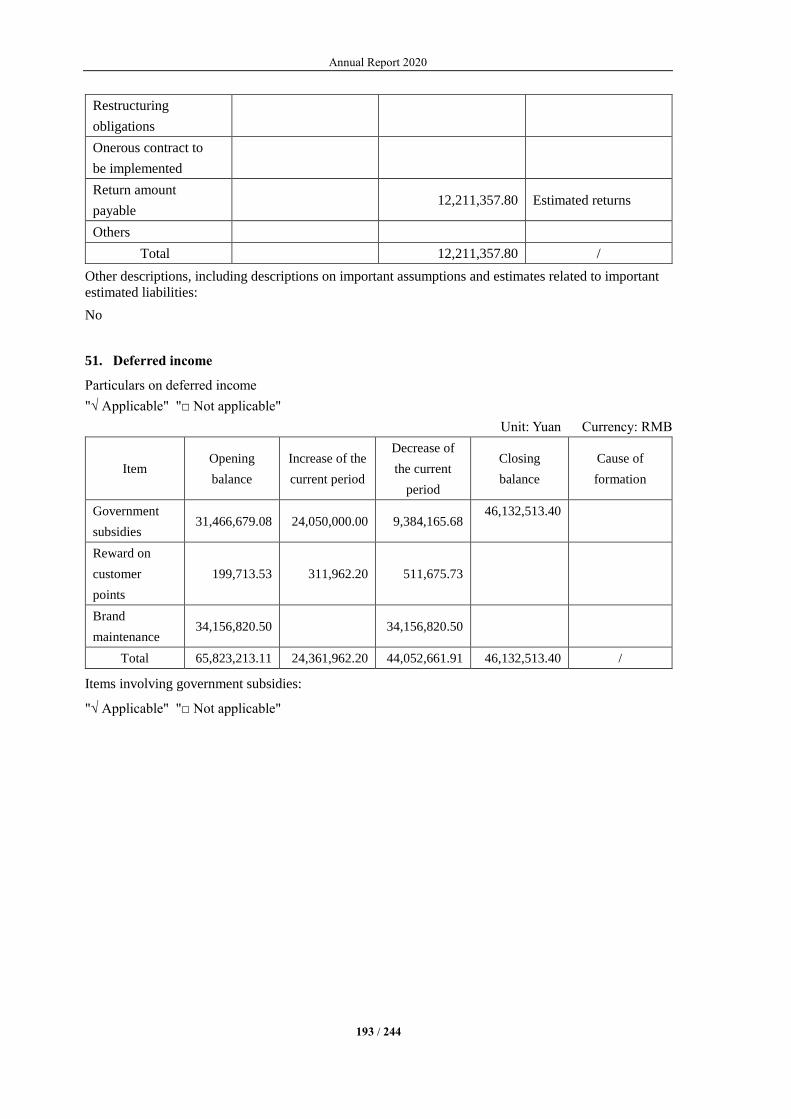
Annual Report 2020
193 / 244
Restructuring
obligations
Onerous contract to
be implemented
Return amount
payable 12,211,357.80 Estimated returns
Others
Total 12,211,357.80 /
Other descriptions, including descriptions on important assumptions and estimates related to important
estimated liabilities:
No
51. Deferred income
Particulars on deferred income
"√ Applicable" "□ Not applicable"
Unit: Yuan Currency: RMB
Item Opening
balance
Increase of the
current period
Decrease of
the current
period
Closing
balance
Cause of
formation
Government
subsidies 31,466,679.08 24,050,000.00 9,384,165.68
46,132,513.40
Reward on
customer
points
199,713.53 311,962.20 511,675.73
Brand
maintenance 34,156,820.50 34,156,820.50
Total 65,823,213.11 24,361,962.20 44,052,661.91 46,132,513.40 /
Items involving government subsidies:
"√ Applicable" "□ Not applicable"

Annual Report 2020
194 / 244
Unit: Yuan Currency: RMB
Liability items Opening
balance
Subsidy amount
increased in the
current period
Amount included in
non-operating income
of the current period
Amount included
in other income of
the current period
Other
changes
Closing
balance
Pertinent to
assets/income
Special Fund for Shanghai
Modern Service Industry - Three-
dimensional Warehouse
9,408,249.39 672,017.88 8,736,231.51
Pertinent to
assets
Shanghai's second batch special
fund for encouraging enterprises
to purchase international R&D
equipment in 2014
609,000.00 174,000.00 435,000.00
Pertinent to
assets
R&D and industrialization of key
materials and preparation
technologies in the pen-making
industry
721,963.45 244,646.88 477,316.57
Pertinent to
assets
Subsidies for the second batch of
key technological transformation
projects in 2013
2,197,889.67 586,104.12 1,611,785.55
Pertinent to
assets
Subsidies for absorption and
innovation projects in 2014 529,773.99 90,443.52 439,330.47
Pertinent to
assets
Service industry guidance funds
in 2014 1,794,639.53 328,891.68 1,465,747.85
Pertinent to
assets
Key technological transformation
projects of Shanghai in 2015 3,699,032.61 561,878.28 3,137,154.33
Pertinent to
assets
Inbound Marketing - Internet +
product development project 579,718.88 107,310.24 472,408.64
Pertinent to
assets

Annual Report 2020
195 / 244
Special fund for Shanghai
informatization development 1,594,912.40 194,331.20 1,400,581.20
Pertinent to
assets
Special funds for technology
R&D projects 131,619.38 105,943.09 25,676.29
Pertinent to
assets
Special funds for industrial
transformation and upgrade
development of Shanghai in 2016
979,120.90 1,000,000.00 271,637.22 1,707,483.68
Pertinent to
assets
High-value-added product
creative development project 167,859.17 29,437.44 138,421.73
Pertinent to
assets
Industrial foundation
consolidation project in 2016 3,770,000.00
-
3,770,000.00
Pertinent to
assets
Funds for improvement of
capacities of Shanghai
Engineering Research Center in
2017
1,000,000.00 1,000,000.00
Pertinent to
assets
Cultural and creative project in
2019 700,000.00 700,000.00
Pertinent to
assets
Special funds for Shanghai
research center of writing
instrument engineering
technology
1,000,000.00 1,000,000.00
Pertinent to
assets
Academician Expert Workstation 100,000.00 100,000.00 Pertinent to
assets
Subsidies for injection molding
machine intelligent equipment 570,000.00 570,000.00
Pertinent to
assets
Zhangjiang Special Development
Fund in 2017 - Achievement 1,362,696.61 174,080.64 1,188,615.97
Pertinent to
assets

Annual Report 2020
196 / 244
Transformation of “Green Design
- Innovative R&D” by Marco
Colorful Painting Pen C1085
Special fund plan for key
technological renovation projects
in Qingpu District in 2012
396,333.30 116,000.04 280,333.26
Pertinent to
assets
Construction Project of "Marco-
Color-Source" Creative
Experience Center
362,370.95 50,000.04 312,370.91
Pertinent to
assets
Special funds for central foreign
economic and trade development 736,196.30 73,619.64 662,576.66
Pertinent to
assets
Subsidies for boiler retrofit 350,000.00 70,000.00 280,000.00 Pertinent to
assets
Special funds for development of
SMEs in Shanghai in 2016 155,302.55 78,831.89 76,470.66
Pertinent to
assets
Special development funds for
enterprises 18,260,000.00 18,260,000.00
Pertinent to
assets
Subsidies for Internet projects 2,590,000.00 1,684,991.88 905,008.12 Pertinent to
assets
Special funds for development of
modern service industry 750,000.00 750,000.00
Pertinent to
assets
Total 31,466,679.08 24,050,000.00 5,614,165.68 -
3,770,000.00
46,132,513.40
Other descriptions:
"□ Applicable" "√ Not applicable"

Annual Report 2020
197 / 244
52. Other non-current liabilities
"□ Applicable" "√ Not applicable"
53. Share capital
"√ Applicable" "□ Not applicable"
Unit: Yuan Currency: RMB
Opening
balance
Increase or decrease (+ or -) due to this change
Closing
balance Issue
New shares
Bonus
shares
Provident
funds
Transferred
shares
Others Sub-total
Total
shares 920,000,000.00 7,427,600.00 7,427,600.00 927,427,600.00
Other descriptions:
In accordance with the relevant resolutions of the Company, the restricted stock incentive plan was
implemented in the current year, granting 7,441,200 shares for 335 incentive objects at a price of
RMB23.70 per share; one of the incentive objects resigned and gave up the equity incentive plan before
paying the subscription amount, so the number of incentive objects was changed to 334, and 7,427,600
shares were granted. The actual capital increase received from the incentive objects was
RMB176,034,120.00, of which the share capital increased by RMB7,427,600.00 and the capital reserve
increased by RMB168,606,520.00.
54. Other equity instruments
(1). Basic information on other financial instruments such as outstanding preferred shares and
perpetual bonds at the end of the period
"□ Applicable" "√ Not applicable"
(2). Form of changes in financial instruments such as outstanding preferred shares and perpetual
bonds at the end of the period
"□ Applicable" "√ Not applicable"
Changes in other equity instruments of the current period, reasons for changes, and basis for relevant
accounting treatment:
"□ Applicable" "√ Not applicable"
Other descriptions:
"□ Applicable" "√ Not applicable"
55. Capital reserve
"√ Applicable" "□ Not applicable"
Unit: Yuan Currency: RMB

Annual Report 2020
198 / 244
Item Opening balance Increase of the
current period
Decrease of the
current period Closing balance
Capital premium
(Share premium) 272,347,764.53 168,606,520.00 440,954,284.53
Other capital
reserve 92,429,847.13 92,429,847.13
Total 272,347,764.53 261,036,367.13 533,384,131.66
Other descriptions, including descriptions on changes of the current period and reasons for changes:
Other description l: For the explanation on capital premium, refer to Note 7 (53) Share Capital.
Other description 2: The reasons for other changes in capital reserve were as follows:
(1) the equity incentive fee for the waiting period was recognized to be RMB71,971,792.64 as the
restricted stock incentive plan was implemented during the current year in accordance with the relevant
resolutions of the Company;
(2) the capital reserve increased by RMB7,159,062.56 due to the subsidiary's recognition of the equity
incentive expenses for the waiting period for the implementation of the restricted stock incentive plan
during the current year in accordance with the relevant resolutions of the Company;
(3) the capital reserve increased by RMB15,562,664.43 due to the recognition of the difference between
the estimated pre-tax deductible amount of equity incentive expenses during the waiting period and the
fair value of the stock on the date of grant as deferred income tax assets for the implementation of the
restricted stock incentive plan during the current year in accordance with the relevant resolutions of the
Company;
(4) the capital reserve decreased by RMB2,263,672.50 due to the further acquisition of minority
shareholders' equity of Jiangsu M&G Life Enterprise Management Co., Ltd. as a subsidiary.
56. Treasury shares
"√ Applicable" "□ Not applicable"
Unit: Yuan Currency: RMB
Item Opening balance Increase of the
current period
Decrease of the
current period Closing balance
Equity incentive
repurchase
176,034,120.00 176,034,120.00
Total 176,034,120.00 176,034,120.00
Other descriptions, including descriptions on changes of the current period and reasons for changes:
No
57. Other comprehensive income
"√ Applicable" "□ Not applicable"

Annual Report 2020
199 / 244
Unit: Yuan Currency: RMB
Item
At the
beginning of the
period
Balance
Amount accounted for in the current period
At the end of
the period
Balance
Amount incurred
before income tax
for the current
period
Less: Included in
other
comprehensive
income in the
previous period and
transferred to profit
or loss in the
current period
Less: Included in
other
comprehensive
income in the
previous period and
transferred to
retained earnings in
the current period
Less: Income
tax expenses
Attributable to the
parent company after
the tax
Attributable to minority
shareholders after the tax
I. Other comprehensive income
not to be reclassified into profit
or loss
309,179.93 2,305,549.03 281,486.61 2,024,062.42 2,333,242.35
Including: Change in re-
measurement of defined benefit
plans
Other comprehensive income
that may not be reclassified to
profit or loss under equity
method
738,151.54 738,151.54 738,151.54
Changes in fair value of
other equity instrument
investments
309,179.93 1,567,397.49 281,486.61 1,285,910.88 1,595,090.81
Change in fair value of
enterprise's own credit risk
II. Other comprehensive
income to be reclassified into
profit or loss
217,179.62 -739,879.20 -409,019.49 -330,859.71 -191,839.87

Annual Report 2020
200 / 244
Including: Other
comprehensive income that
may be reclassified to profit or
loss under equity method
-16,285.82 12,074.68 12,074.68 -4,211.14
Changes in fair value of
other debt investments
Amount included in other
comprehensive income on
reclassification of financial
assets
Credit impairment provisions
of other debt investments
Cash flow hedging reserve
Exchange differences from
translation of financial
statements
233,465.44 -751,953.88 -421,094.17 -330,859.71 -187,628.73
Total other comprehensive
income 526,359.55 1,565,669.83 281,486.61 1,615,042.93 -330,859.71 2,141,402.48
Other descriptions, including the adjustment of the effective portion of cash flow hedging profit or loss transferred to the initial recognition amount of the hedged
item:
No
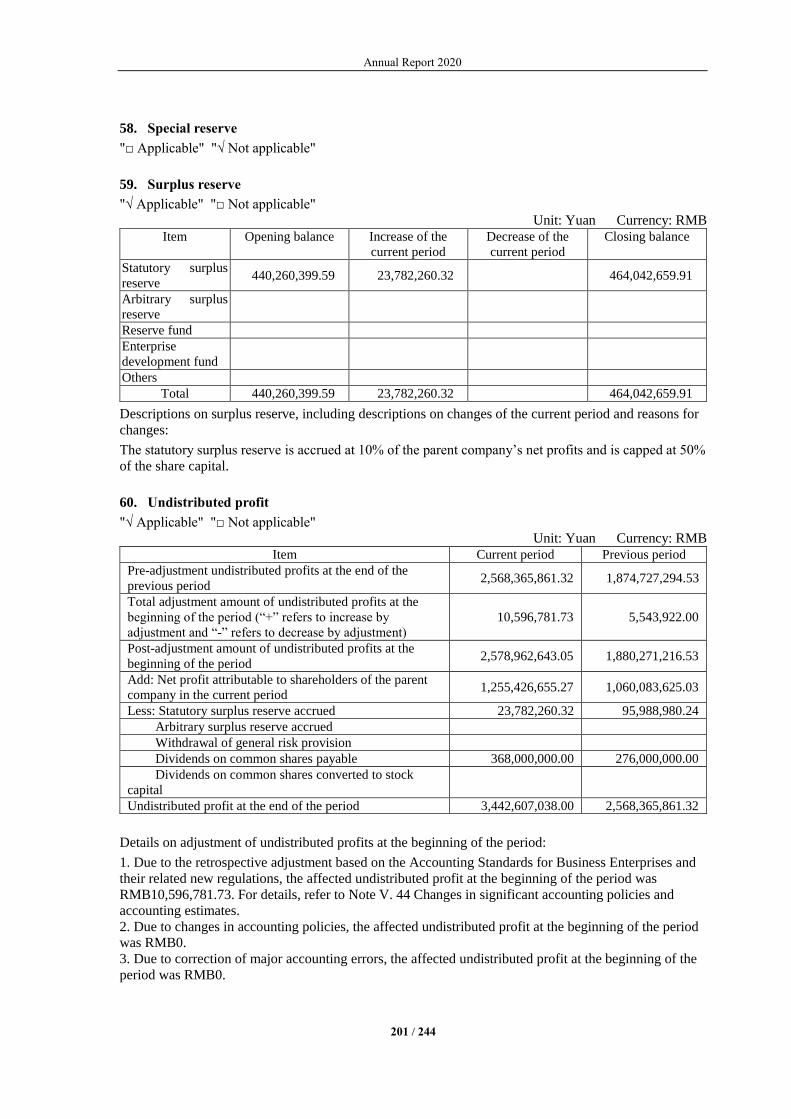
Annual Report 2020
201 / 244
58. Special reserve
"□ Applicable" "√ Not applicable"
59. Surplus reserve
"√ Applicable" "□ Not applicable"
Unit: Yuan Currency: RMB
Item Opening balance Increase of the
current period
Decrease of the
current period
Closing balance
Statutory surplus
reserve 440,260,399.59 23,782,260.32 464,042,659.91
Arbitrary surplus
reserve
Reserve fund
Enterprise
development fund
Others
Total 440,260,399.59 23,782,260.32 464,042,659.91
Descriptions on surplus reserve, including descriptions on changes of the current period and reasons for
changes:
The statutory surplus reserve is accrued at 10% of the parent company’s net profits and is capped at 50%
of the share capital.
60. Undistributed profit
"√ Applicable" "□ Not applicable"
Unit: Yuan Currency: RMB
Item Current period Previous period
Pre-adjustment undistributed profits at the end of the
previous period 2,568,365,861.32 1,874,727,294.53
Total adjustment amount of undistributed profits at the
beginning of the period (“+” refers to increase by
adjustment and “-” refers to decrease by adjustment)
10,596,781.73 5,543,922.00
Post-adjustment amount of undistributed profits at the
beginning of the period 2,578,962,643.05 1,880,271,216.53
Add: Net profit attributable to shareholders of the parent
company in the current period 1,255,426,655.27 1,060,083,625.03
Less: Statutory surplus reserve accrued 23,782,260.32 95,988,980.24
Arbitrary surplus reserve accrued
Withdrawal of general risk provision
Dividends on common shares payable 368,000,000.00 276,000,000.00
Dividends on common shares converted to stock
capital
Undistributed profit at the end of the period 3,442,607,038.00 2,568,365,861.32
Details on adjustment of undistributed profits at the beginning of the period:
1. Due to the retrospective adjustment based on the Accounting Standards for Business Enterprises and
their related new regulations, the affected undistributed profit at the beginning of the period was
RMB10,596,781.73. For details, refer to Note V. 44 Changes in significant accounting policies and
accounting estimates.
2. Due to changes in accounting policies, the affected undistributed profit at the beginning of the period
was RMB0.
3. Due to correction of major accounting errors, the affected undistributed profit at the beginning of the
period was RMB0.

Annual Report 2020
202 / 244
4. Due to changes in the scope of the consolidated financial statements caused by the business
combination under common control, the affected undistributed profit at the beginning of the period was
RMB0.
5. Due to other adjustments, the affected undistributed profit at the beginning of the period was RMB0.
61. Revenue and operating costs
(1). Revenue and operating costs
"√ Applicable" "□ Not applicable"
Unit: Yuan Currency: RMB
Item
Amount accounted for in the current
period
Amount accounted for in the previous
period
Revenue Costs Revenue Costs
Main
operations
13,133,546,117.73 9,806,354,519.82 11,139,921,640.93 8,229,332,367.02
Other
operations
4,199,609.45 255,479.66 1,179,723.51 504,901.84
Total 13,137,745,727.18 9,806,609,999.48 11,141,101,364.44 8,229,837,268.86
(2). Particulars on revenue from contracts
"√ Applicable" "□ Not applicable"
Unit: Yuan Currency: RMB
Classification of contracts Total
Types of goods
1. Sales of goods 13,126,820,058.35
2. Management fee for franchising 2,368,196.45
3. Hardware and software 4,357,862.93
4. Material income 1,099,644.09
5. Others 2,483,821.51
Classification by operation territory
1. China 12,774,182,203.97
2. Other countries 362,947,379.36
Total 13,137,129,583.33
Description on revenue from contracts:
"□ Applicable" "√ Not applicable"
(3). Description on performance obligations
"□ Applicable" "√ Not applicable"
(4). Description on allocation to remaining performance obligations
"□ Applicable" "√ Not applicable"
Other descriptions:
Details on revenue:
Item Amount in the current period Amount in the last period
Description on revenue from customer
contracts
13,137,129,583.33 11,141,037,489.07
Rental income 616,143.85 63,875.37
Total 13,137,745,727.18 11,141,101,364.44
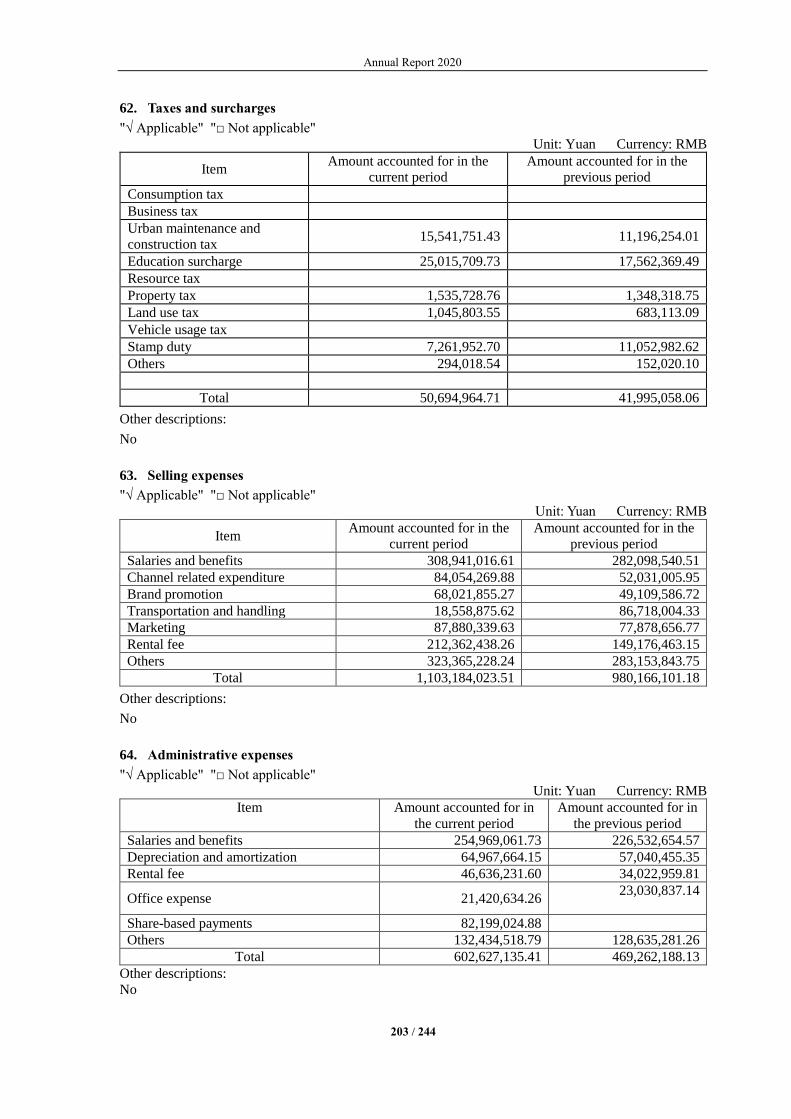
Annual Report 2020
203 / 244
62. Taxes and surcharges
"√ Applicable" "□ Not applicable"
Unit: Yuan Currency: RMB
Item Amount accounted for in the
current period
Amount accounted for in the
previous period
Consumption tax
Business tax
Urban maintenance and
construction tax 15,541,751.43 11,196,254.01
Education surcharge 25,015,709.73 17,562,369.49
Resource tax
Property tax 1,535,728.76 1,348,318.75
Land use tax 1,045,803.55 683,113.09
Vehicle usage tax
Stamp duty 7,261,952.70 11,052,982.62
Others 294,018.54 152,020.10
Total 50,694,964.71 41,995,058.06
Other descriptions:
No
63. Selling expenses
"√ Applicable" "□ Not applicable"
Unit: Yuan Currency: RMB
Item Amount accounted for in the
current period
Amount accounted for in the
previous period
Salaries and benefits 308,941,016.61 282,098,540.51
Channel related expenditure 84,054,269.88 52,031,005.95
Brand promotion 68,021,855.27 49,109,586.72
Transportation and handling 18,558,875.62 86,718,004.33
Marketing 87,880,339.63 77,878,656.77
Rental fee 212,362,438.26 149,176,463.15
Others 323,365,228.24 283,153,843.75
Total 1,103,184,023.51 980,166,101.18
Other descriptions:
No
64. Administrative expenses
"√ Applicable" "□ Not applicable"
Unit: Yuan Currency: RMB
Item Amount accounted for in
the current period
Amount accounted for in
the previous period
Salaries and benefits 254,969,061.73 226,532,654.57
Depreciation and amortization 64,967,664.15 57,040,455.35
Rental fee 46,636,231.60 34,022,959.81
Office expense 21,420,634.26 23,030,837.14
Share-based payments 82,199,024.88
Others 132,434,518.79 128,635,281.26
Total 602,627,135.41 469,262,188.13
Other descriptions:
No

Annual Report 2020
204 / 244
65. R&D expenses
"√ Applicable" "□ Not applicable"
Unit: Yuan Currency: RMB
Item Amount accounted for in the
current period
Amount accounted for in
the previous period
Salaries and benefits 66,828,400.15 74,850,775.54
Inventory consumption 54,757,593.65 56,560,157.03
Others 38,592,948.09 28,992,430.40
Total 160,178,941.89 160,403,362.97
Other descriptions:
No
66. Financial expenses
"√ Applicable" "□ Not applicable"
Unit: Yuan Currency: RMB
Item Amount accounted for in the
current period
Amount accounted for in
the previous period
Interest expense 6,948,206.51 8,386,182.80
Less: Interest income -13,415,173.15 -20,872,167.57
Exchange gains and losses 12,089,237.27 566,099.52
Others 3,437,905.72 3,522,607.60
Total 9,060,176.35 -8,397,277.65
Other descriptions:
No
67. Other income
"√ Applicable" "□ Not applicable"
Unit: Yuan Currency: RMB
Item Amount accounted for in the
current period
Amount accounted for in the
previous period
Government subsidies 44,472,282.85 26,355,003.29
Handling charge on withholding
personnel income tax 1,193,126.92
149,878.17
Total 45,665,409.77 26,504,881.46
Other descriptions:
Government subsidies included in other income
Subsidy projects Amount in the
current period
Amount in the
last period
Pertinent to
assets/income
Special Fund for Shanghai Modern Service
Industry - Three-dimensional Warehouse 672,017.88 672,017.88 Pertinent to assets
Shanghai's second batch special fund for
encouraging enterprises to purchase
international R&D equipment in 2014
174,000.00 174,000.00 Pertinent to assets
R&D and industrialization of key materials
and preparation technologies in the pen-
making industry
244,646.88 244,646.88 Pertinent to assets
Subsidies for the second batch of key
technological transformation projects in 2013 586,104.12 586,104.12 Pertinent to assets
Subsidies for absorption and innovation
projects in 2014 90,443.52 90,443.52 Pertinent to assets
Service industry guidance funds in 2014 328,891.68 328,891.68 Pertinent to assets
Key technological transformation projects of
Shanghai in 2015 561,878.28 561,878.28 Pertinent to assets
Inbound Marketing - Internet + product
development project 107,310.24 107,310.24 Pertinent to assets
Special fund for Shanghai informatization 194,331.20 325,087.60 Pertinent to assets
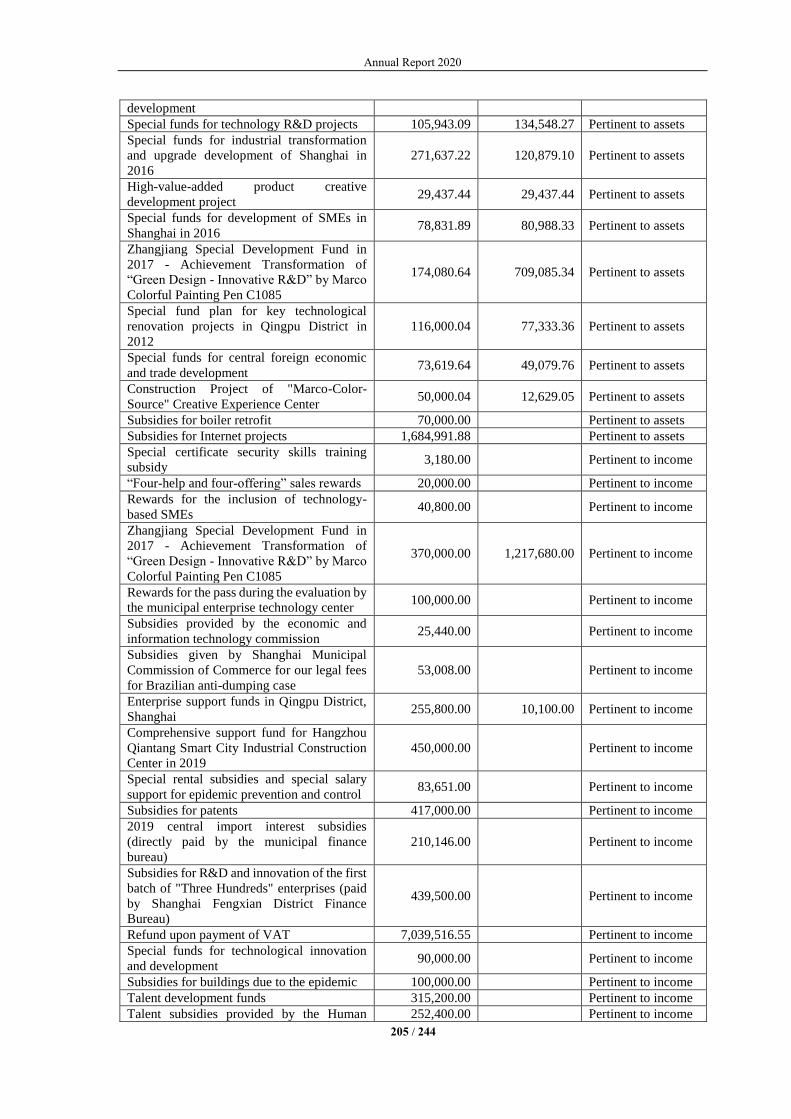
Annual Report 2020
205 / 244
development
Special funds for technology R&D projects 105,943.09 134,548.27 Pertinent to assets
Special funds for industrial transformation
and upgrade development of Shanghai in
2016
271,637.22 120,879.10 Pertinent to assets
High-value-added product creative
development project 29,437.44 29,437.44 Pertinent to assets
Special funds for development of SMEs in
Shanghai in 2016 78,831.89 80,988.33 Pertinent to assets
Zhangjiang Special Development Fund in
2017 - Achievement Transformation of
“Green Design - Innovative R&D” by Marco
Colorful Painting Pen C1085
174,080.64 709,085.34 Pertinent to assets
Special fund plan for key technological
renovation projects in Qingpu District in
2012
116,000.04 77,333.36 Pertinent to assets
Special funds for central foreign economic
and trade development 73,619.64 49,079.76 Pertinent to assets
Construction Project of "Marco-Color-
Source" Creative Experience Center 50,000.04 12,629.05 Pertinent to assets
Subsidies for boiler retrofit 70,000.00 Pertinent to assets
Subsidies for Internet projects 1,684,991.88 Pertinent to assets
Special certificate security skills training
subsidy 3,180.00 Pertinent to income
“Four-help and four-offering” sales rewards 20,000.00 Pertinent to income
Rewards for the inclusion of technology-
based SMEs 40,800.00 Pertinent to income
Zhangjiang Special Development Fund in
2017 - Achievement Transformation of
“Green Design - Innovative R&D” by Marco
Colorful Painting Pen C1085
370,000.00 1,217,680.00 Pertinent to income
Rewards for the pass during the evaluation by
the municipal enterprise technology center 100,000.00 Pertinent to income
Subsidies provided by the economic and
information technology commission 25,440.00 Pertinent to income
Subsidies given by Shanghai Municipal
Commission of Commerce for our legal fees
for Brazilian anti-dumping case
53,008.00 Pertinent to income
Enterprise support funds in Qingpu District,
Shanghai 255,800.00 10,100.00 Pertinent to income
Comprehensive support fund for Hangzhou
Qiantang Smart City Industrial Construction
Center in 2019
450,000.00 Pertinent to income
Special rental subsidies and special salary
support for epidemic prevention and control 83,651.00 Pertinent to income
Subsidies for patents 417,000.00 Pertinent to income
2019 central import interest subsidies
(directly paid by the municipal finance
bureau)
210,146.00 Pertinent to income
Subsidies for R&D and innovation of the first
batch of "Three Hundreds" enterprises (paid
by Shanghai Fengxian District Finance
Bureau)
439,500.00 Pertinent to income
Refund upon payment of VAT 7,039,516.55 Pertinent to income
Special funds for technological innovation
and development 90,000.00 Pertinent to income
Subsidies for buildings due to the epidemic 100,000.00 Pertinent to income
Talent development funds 315,200.00 Pertinent to income
Talent subsidies provided by the Human 252,400.00 Pertinent to income
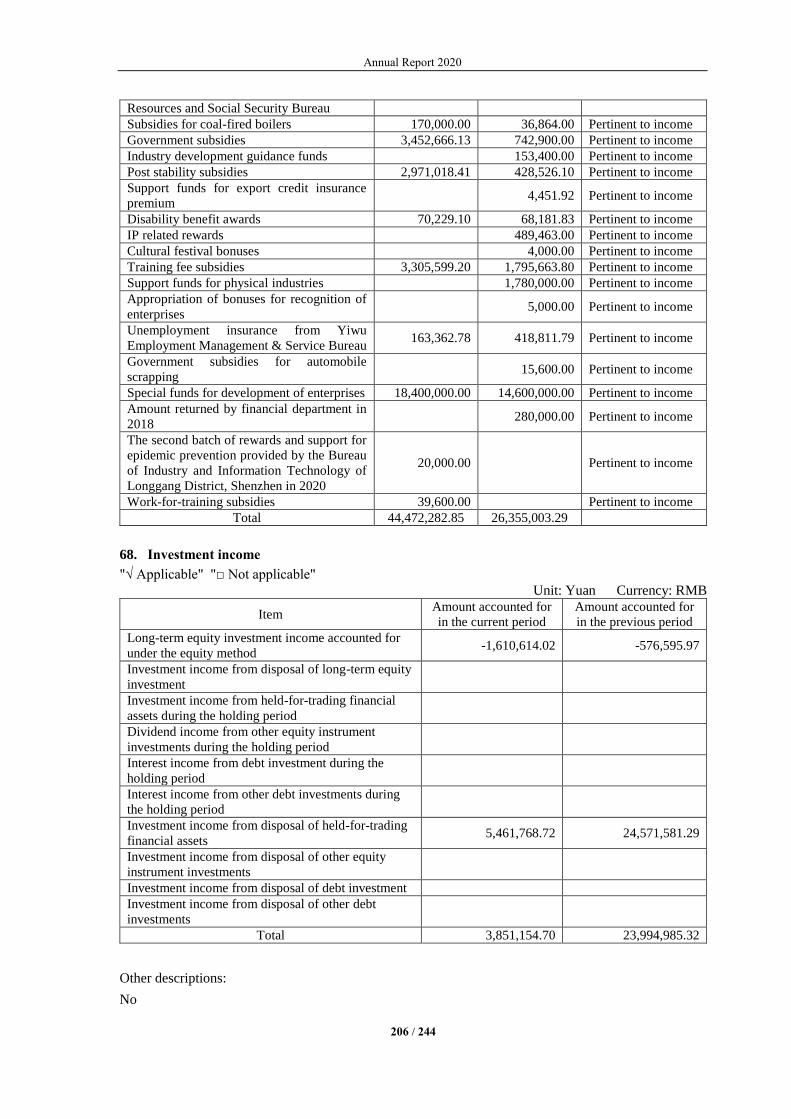
Annual Report 2020
206 / 244
Resources and Social Security Bureau
Subsidies for coal-fired boilers 170,000.00 36,864.00 Pertinent to income
Government subsidies 3,452,666.13 742,900.00 Pertinent to income
Industry development guidance funds 153,400.00 Pertinent to income
Post stability subsidies 2,971,018.41 428,526.10 Pertinent to income
Support funds for export credit insurance
premium 4,451.92 Pertinent to income
Disability benefit awards 70,229.10 68,181.83 Pertinent to income
IP related rewards 489,463.00 Pertinent to income
Cultural festival bonuses 4,000.00 Pertinent to income
Training fee subsidies 3,305,599.20 1,795,663.80 Pertinent to income
Support funds for physical industries 1,780,000.00 Pertinent to income
Appropriation of bonuses for recognition of
enterprises 5,000.00 Pertinent to income
Unemployment insurance from Yiwu
Employment Management & Service Bureau 163,362.78 418,811.79 Pertinent to income
Government subsidies for automobile
scrapping 15,600.00 Pertinent to income
Special funds for development of enterprises 18,400,000.00 14,600,000.00 Pertinent to income
Amount returned by financial department in
2018 280,000.00 Pertinent to income
The second batch of rewards and support for
epidemic prevention provided by the Bureau
of Industry and Information Technology of
Longgang District, Shenzhen in 2020
20,000.00 Pertinent to income
Work-for-training subsidies 39,600.00 Pertinent to income
Total 44,472,282.85 26,355,003.29
68. Investment income
"√ Applicable" "□ Not applicable"
Unit: Yuan Currency: RMB
Item Amount accounted for
in the current period
Amount accounted for
in the previous period
Long-term equity investment income accounted for
under the equity method -1,610,614.02 -576,595.97
Investment income from disposal of long-term equity
investment
Investment income from held-for-trading financial
assets during the holding period
Dividend income from other equity instrument
investments during the holding period
Interest income from debt investment during the
holding period
Interest income from other debt investments during
the holding period
Investment income from disposal of held-for-trading
financial assets 5,461,768.72 24,571,581.29
Investment income from disposal of other equity
instrument investments
Investment income from disposal of debt investment
Investment income from disposal of other debt
investments
Total 3,851,154.70 23,994,985.32
Other descriptions:
No
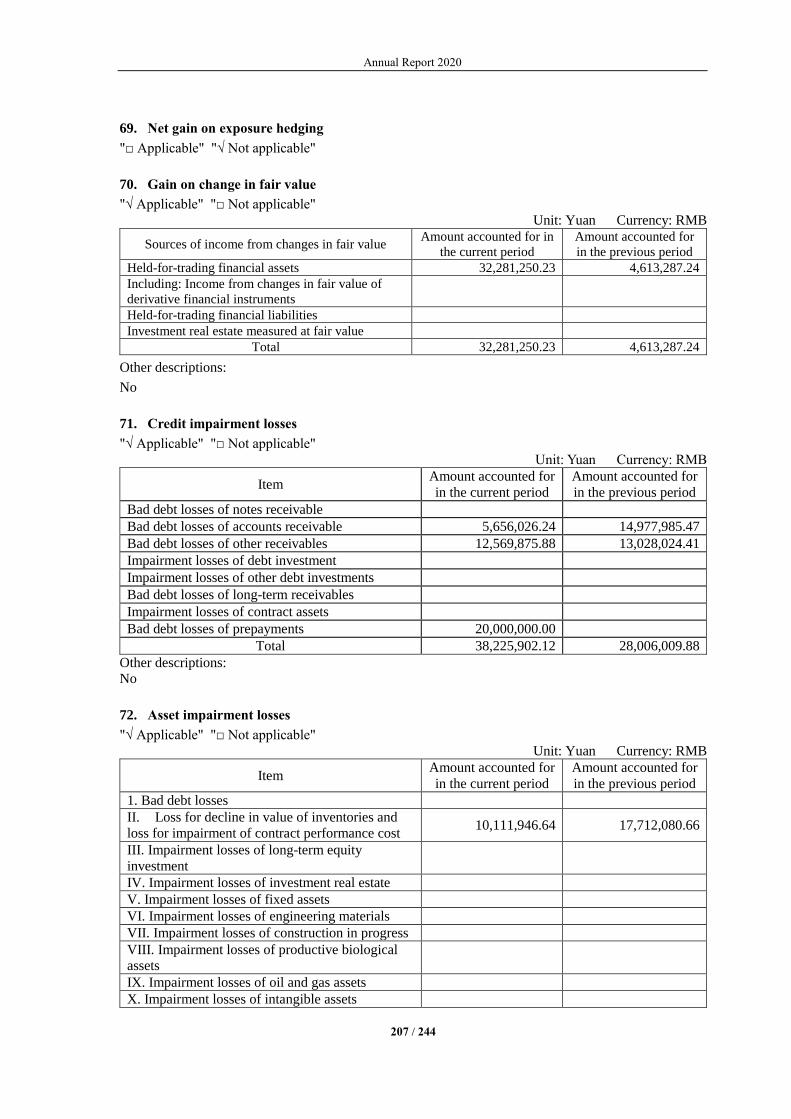
Annual Report 2020
207 / 244
69. Net gain on exposure hedging
"□ Applicable" "√ Not applicable"
70. Gain on change in fair value
"√ Applicable" "□ Not applicable"
Unit: Yuan Currency: RMB
Sources of income from changes in fair value Amount accounted for in
the current period
Amount accounted for
in the previous period
Held-for-trading financial assets 32,281,250.23 4,613,287.24
Including: Income from changes in fair value of
derivative financial instruments
Held-for-trading financial liabilities
Investment real estate measured at fair value
Total 32,281,250.23 4,613,287.24
Other descriptions:
No
71. Credit impairment losses
"√ Applicable" "□ Not applicable"
Unit: Yuan Currency: RMB
Item Amount accounted for
in the current period
Amount accounted for
in the previous period
Bad debt losses of notes receivable
Bad debt losses of accounts receivable 5,656,026.24 14,977,985.47
Bad debt losses of other receivables 12,569,875.88 13,028,024.41
Impairment losses of debt investment
Impairment losses of other debt investments
Bad debt losses of long-term receivables
Impairment losses of contract assets
Bad debt losses of prepayments 20,000,000.00
Total 38,225,902.12 28,006,009.88
Other descriptions:
No
72. Asset impairment losses
"√ Applicable" "□ Not applicable"
Unit: Yuan Currency: RMB
Item Amount accounted for
in the current period
Amount accounted for
in the previous period
1. Bad debt losses
II. Loss for decline in value of inventories and
loss for impairment of contract performance cost 10,111,946.64 17,712,080.66
III. Impairment losses of long-term equity
investment
IV. Impairment losses of investment real estate
V. Impairment losses of fixed assets
VI. Impairment losses of engineering materials
VII. Impairment losses of construction in progress
VIII. Impairment losses of productive biological
assets
IX. Impairment losses of oil and gas assets
X. Impairment losses of intangible assets

Annual Report 2020
208 / 244
XI. Impairment losses of goodwill 30,175,537.19 131,001.23
XII. Others
Total 40,287,483.83 17,843,081.89
Other descriptions:
No
73. Gains from asset disposal
"√ Applicable" "□ Not applicable"
Unit: Yuan Currency: RMB
Item Amount accounted for in
the current period
Amount accounted for
in the previous period
Gaines or losses from disposal of fixed assets 169,704.92 6,081,606.95
Total 169,704.92 6,081,606.95
Other descriptions:
No
74. Non-operating profits
Non-operating profits
"√ Applicable" "□ Not applicable"
Unit: Yuan Currency: RMB
Item Amount accounted for
in the current period
Amount accounted for
in the previous period
Amount included in the
current non-recurring
gains and losses
Total gains from
disposal of non-
current assets
Including: Gains
from disposal of
fixed assets
Gains from
disposal of intangible
assets
Gains from
restructuring of debts
Gains from exchange
of non-currency
assets
Acceptance of
donations
Government
subsidies 89,557,520.24 16,242,800.00
89,557,520.24
Inventory profit 36,601.59 36,601.59
Brand maintenance 34,156,820.50 34,156,820.50
Liquidated damages
and fine income 1,790,210.19 922,677.94
1,790,210.19
Others 3,234,345.57 12,193,177.10 3,234,345.57
Total 128,775,498.09 29,358,655.04 128,775,498.09
Government subsidies included in current profit and loss
"√ Applicable" "□ Not applicable"
Unit: Yuan Currency: RMB
Subsidy projects Amount accounted for
in the current period
Amount accounted for
in the previous period
Pertinent to
assets/income
Financial support 89,557,520.24 16,242,800.00 Pertinent to income

Annual Report 2020
209 / 244
Total 89,557,520.24 16,242,800.00
Other descriptions:
"□ Applicable" "√ Not applicable"
75. Non-operating expenses
"√ Applicable" "□ Not applicable"
Unit: Yuan Currency: RMB
Item Amount accounted for
in the current period
Amount accounted for
in the previous period
Amount included in the
current non-recurring
gains and losses
Total losses from disposal
of non-current assets
Including: Losses from
disposal of fixed assets
Losses from
disposal of intangible
assets
Losses from restructuring
of debts
Losses from exchange of
non-currency assets
Offering of donations 8,044,041.60 4,456,387.80 8,044,041.60
Abnormal loss 11,579.27
Inventory losses 180,639.72 25,692.24 180,639.72
Loss from damage and
retirement of non-current
assets
2,596,461.69 3,153,550.20 2,596,461.69
Fine late payment 1,042,177.33 19,532.73 1,042,177.33
Compensation expenses 3,191,899.75 657,935.89 3,191,899.75
Others 5,416,086.34 10,534,564.93 5,416,086.34
Total 20,471,306.43 18,859,243.06 20,471,306.43
Other descriptions:
No
76. Income tax expenses
(1). Table of income tax expenses
"√ Applicable" "□ Not applicable"
Unit: Yuan Currency: RMB
Item Amount accounted for in the
current period
Amount accounted for in the
previous period
Current income tax expenses 326,704,216.12 229,869,239.88
Deferred income tax expenses -47,929,130.96 -12,266,339.47
Total 278,775,085.16 217,602,900.41
(2). Adjustment process of accounting profits and income tax expenses
"√ Applicable" "□ Not applicable"
Unit: Yuan Currency: RMB
Item Amount accounted for in the current period
Total profits 1,517,148,811.16
Income tax expenses calculated at statutory/applicable
tax rate 227,572,321.67
Effect of applying different tax rates to subsidiaries 24,972,662.61
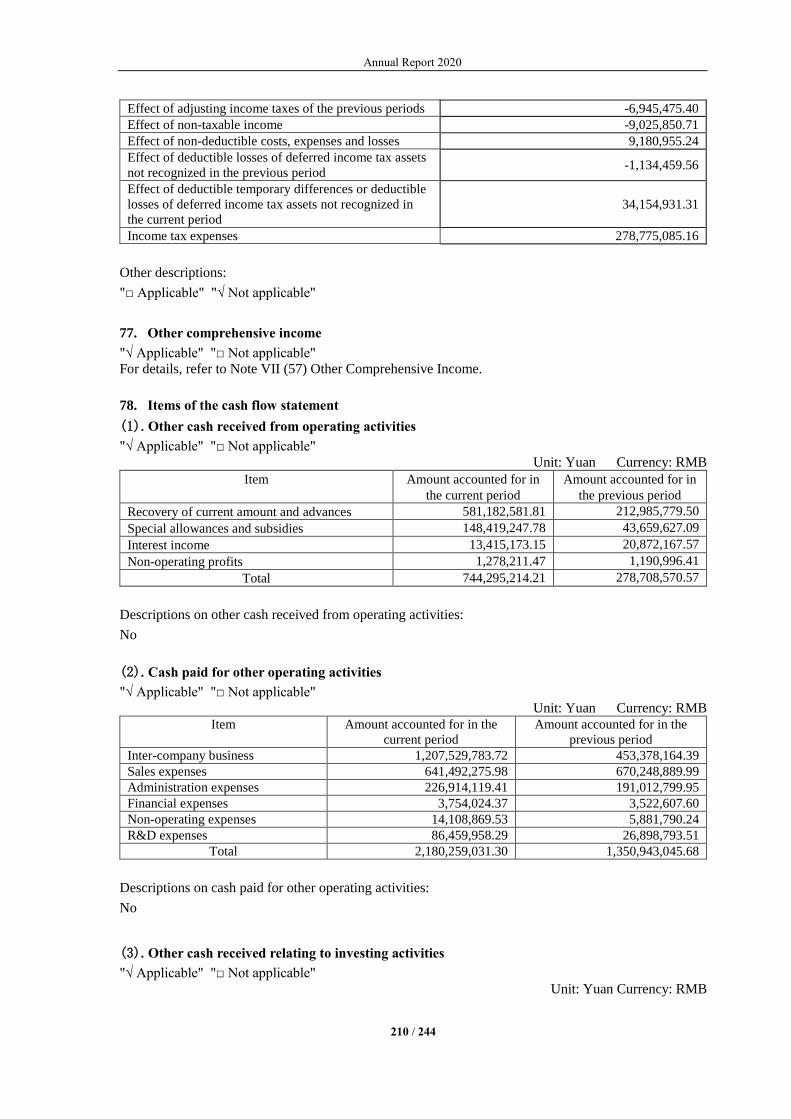
Annual Report 2020
210 / 244
Effect of adjusting income taxes of the previous periods -6,945,475.40
Effect of non-taxable income -9,025,850.71
Effect of non-deductible costs, expenses and losses 9,180,955.24
Effect of deductible losses of deferred income tax assets
not recognized in the previous period -1,134,459.56
Effect of deductible temporary differences or deductible
losses of deferred income tax assets not recognized in
the current period
34,154,931.31
Income tax expenses 278,775,085.16
Other descriptions:
"□ Applicable" "√ Not applicable"
77. Other comprehensive income
"√ Applicable" "□ Not applicable"
For details, refer to Note VII (57) Other Comprehensive Income.
78. Items of the cash flow statement
(1). Other cash received from operating activities
"√ Applicable" "□ Not applicable"
Unit: Yuan Currency: RMB
Item Amount accounted for in
the current period
Amount accounted for in
the previous period
Recovery of current amount and advances 581,182,581.81 212,985,779.50
Special allowances and subsidies 148,419,247.78 43,659,627.09
Interest income 13,415,173.15 20,872,167.57
Non-operating profits 1,278,211.47 1,190,996.41
Total 744,295,214.21 278,708,570.57
Descriptions on other cash received from operating activities:
No
(2). Cash paid for other operating activities
"√ Applicable" "□ Not applicable"
Unit: Yuan Currency: RMB
Item Amount accounted for in the
current period
Amount accounted for in the
previous period
Inter-company business 1,207,529,783.72 453,378,164.39
Sales expenses 641,492,275.98 670,248,889.99
Administration expenses 226,914,119.41 191,012,799.95
Financial expenses 3,754,024.37 3,522,607.60
Non-operating expenses 14,108,869.53 5,881,790.24
R&D expenses 86,459,958.29 26,898,793.51
Total 2,180,259,031.30 1,350,943,045.68
Descriptions on cash paid for other operating activities:
No
(3). Other cash received relating to investing activities
"√ Applicable" "□ Not applicable"
Unit: Yuan Currency: RMB
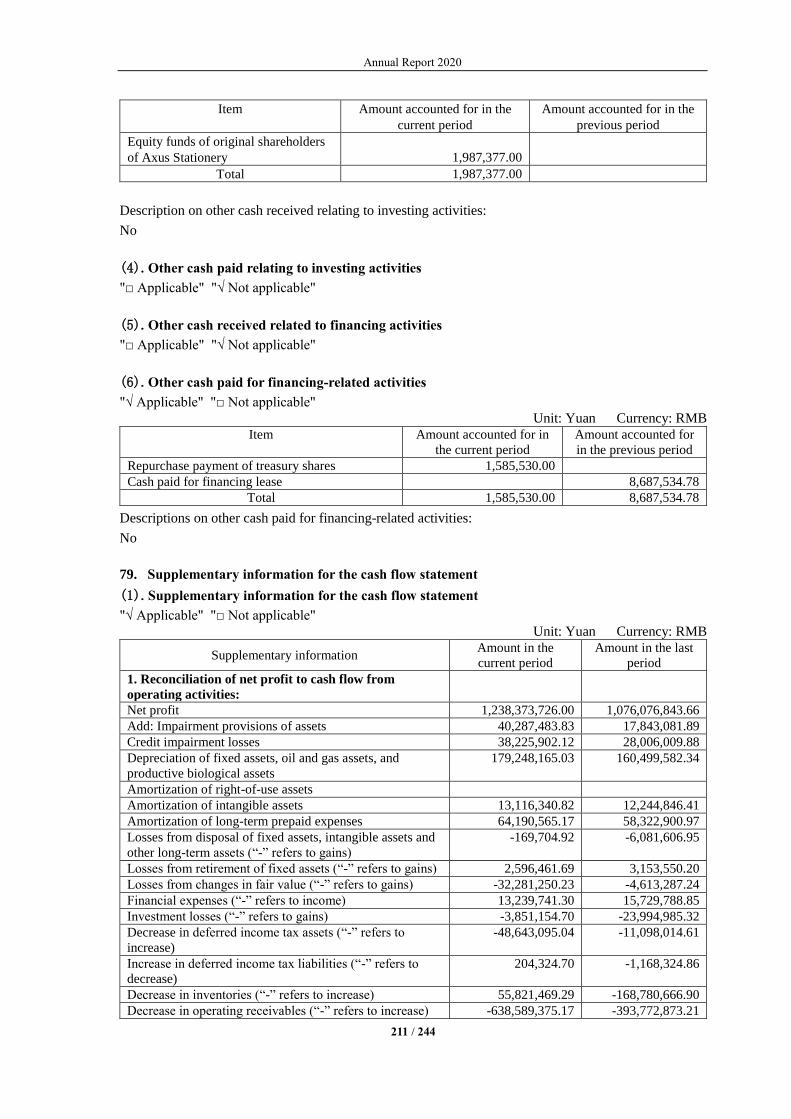
Annual Report 2020
211 / 244
Item Amount accounted for in the
current period
Amount accounted for in the
previous period
Equity funds of original shareholders
of Axus Stationery 1,987,377.00
Total 1,987,377.00
Description on other cash received relating to investing activities:
No
(4). Other cash paid relating to investing activities
"□ Applicable" "√ Not applicable"
(5). Other cash received related to financing activities
"□ Applicable" "√ Not applicable"
(6). Other cash paid for financing-related activities
"√ Applicable" "□ Not applicable"
Unit: Yuan Currency: RMB
Item Amount accounted for in
the current period
Amount accounted for
in the previous period
Repurchase payment of treasury shares 1,585,530.00
Cash paid for financing lease 8,687,534.78
Total 1,585,530.00 8,687,534.78
Descriptions on other cash paid for financing-related activities:
No
79. Supplementary information for the cash flow statement
(1). Supplementary information for the cash flow statement
"√ Applicable" "□ Not applicable"
Unit: Yuan Currency: RMB
Supplementary information Amount in the
current period
Amount in the last
period
1. Reconciliation of net profit to cash flow from
operating activities:
Net profit 1,238,373,726.00 1,076,076,843.66
Add: Impairment provisions of assets 40,287,483.83 17,843,081.89
Credit impairment losses 38,225,902.12 28,006,009.88
Depreciation of fixed assets, oil and gas assets, and
productive biological assets
179,248,165.03 160,499,582.34
Amortization of right-of-use assets
Amortization of intangible assets 13,116,340.82 12,244,846.41
Amortization of long-term prepaid expenses 64,190,565.17 58,322,900.97
Losses from disposal of fixed assets, intangible assets and
other long-term assets (“-” refers to gains)
-169,704.92 -6,081,606.95
Losses from retirement of fixed assets (“-” refers to gains) 2,596,461.69 3,153,550.20
Losses from changes in fair value (“-” refers to gains) -32,281,250.23 -4,613,287.24
Financial expenses (“-” refers to income) 13,239,741.30 15,729,788.85
Investment losses (“-” refers to gains) -3,851,154.70 -23,994,985.32
Decrease in deferred income tax assets (“-” refers to
increase)
-48,643,095.04 -11,098,014.61
Increase in deferred income tax liabilities (“-” refers to
decrease)
204,324.70 -1,168,324.86
Decrease in inventories (“-” refers to increase) 55,821,469.29 -168,780,666.90
Decrease in operating receivables (“-” refers to increase) -638,589,375.17 -393,772,873.21

Annual Report 2020
212 / 244
Increase in operating payables (“-” refers to decrease) 349,928,292.39 319,574,538.57
Others
Net cash flow generated from operating activities 1,271,697,892.28 1,081,941,383.68
2. Major investing and financing activities not
involving cash payment and receipts:
Debts converted to capital
Convertible company bonds due within one year
Fixed assets acquired under financing leases
3. Net changes in cash and cash equivalents:
Closing balance of cash 1,377,346,135.25 1,377,446,435.89
Less: Opening balance of cash 1,377,446,435.89 741,501,446.10
Add: Closing balance of cash equivalents
Less: Opening balance of cash equivalents
Net increase in cash and cash equivalents -100,300.64 635,944,989.79
(2). Net cash amount paid for the acquisition of subsidiaries in the current period
"□ Applicable" "√ Not applicable"
(3). Net cash amount received from the disposal of subsidiaries in the current period
"□ Applicable" "√ Not applicable"
(4). Composition of cash and cash equivalents
"√ Applicable" "□ Not applicable"
Unit: Yuan Currency: RMB
Item Closing balance Opening balance
I. Cash 1,377,346,135.25 1,377,446,435.89
Including: Cash on hand 1,134,204.63 503,222.44
Bank deposits readily available for payment 1,371,360,452.36 1,372,791,232.44
Other cash and equivalents readily available for
payment at any time 4,851,478.26 4,151,981.01
Due from central bank available for payment
Due from placements with banks and other financial
institutions
Call loan to banks and other financial institutions
II. Cash equivalents
Including: Bond investments due within three months
III. Closing balance of cash and cash equivalents 1,377,346,135.25 1,377,446,435.89
Including: Cash and cash equivalents of which the use is
restricted for the parent company or subsidiaries within the
group
Other descriptions:
"□ Applicable" "√ Not applicable"
80. Notes to items of the statement of changes in owners’ equity
Description on “other” item name and adjustment amount adjusted for balance at the end of the previous
year:
"□ Applicable" "√ Not applicable"
81. Assets with restricted ownership or use rights
"√ Applicable" "□ Not applicable"
Unit: Yuan Currency: RMB

Annual Report 2020
213 / 244
Item Carrying value at the end
of the period
Reason for restriction
Cash and equivalents 1,184,812,790.86 Letter of credit deposit and fixed deposit with
restricted use and over three months, etc.
Bills receivable
Inventories
Fixed assets 86,306,229.62 Loan mortgage
Intangible assets
Total 1,271,119,020.48 /
Other descriptions:
No
82. Foreign currency monetary items
(1). Foreign currency monetary items
"√ Applicable" "□ Not applicable"
Unit: RMB Yuan
Item
Foreign currency
balance at the end of
the period
Translation foreign
exchange rate
RMB translated at the
end of the period
Balance
Cash and equivalents - - 85,165,095.66
Including: USD 12,652,630.01 6.5249 82,557,145.55
EURO 229,387.82 8.0250 1,840,837.26
JPY 1,121.00 0.0632 70.85
HKD 79,523.02 0.8416 66,926.57
VND 2,333,718,087.78 0.0003 700,115.43
Accounts receivable - - 31,687,341.28
Including: USD 4,827,758.50 6.5249 31,500,641.44
EURO 22,896.07 8.0250 183,740.96
HKD 3,515.78 0.8416 2,958.88
Accounts payable - - 5,746,409.23
Including: USD 608,161.27 6.5249 3,968,191.47
JPY 4,525,212.00 0.0632 285,993.40
CHF 3,128.00 7.4006 23,149.08
VND 4,896,917,616.40 0.0003 1,469,075.28
Other receivables - - 427,463.91
Including: VND 1,424,879,696.12 0.0003 427,463.91
Other payables - - 282,014.95
Including: VND 940,049,816.99 0.0003 282,014.95
Long-term borrowings - -
Including: USD
Other descriptions:
No
(2). Descriptions on overseas operating entities, including: for important overseas business entities,
their main overseas business locations, bookkeeping currency and selection basis shall be
disclosed; in case of any change in the bookkeeping currency, the reasons for such change shall
be also disclosed
"□ Applicable" "√ Not applicable"
83. Hedging
"□ Applicable" "√ Not applicable"
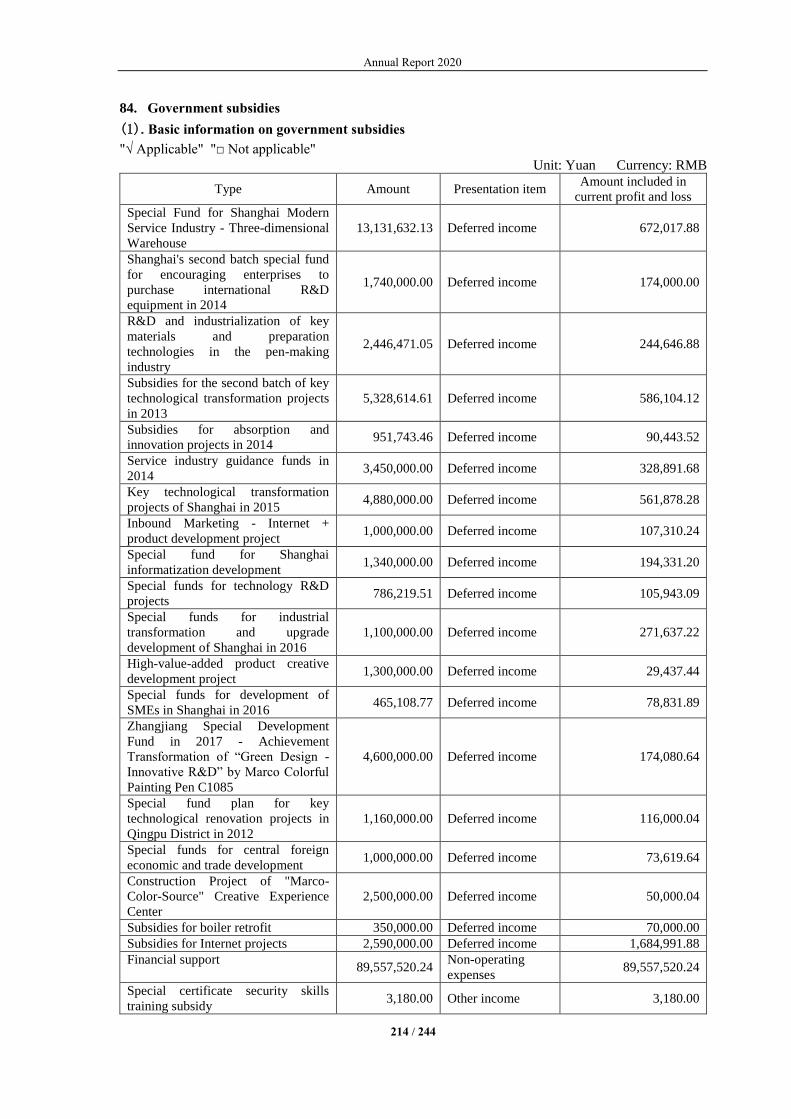
Annual Report 2020
214 / 244
84. Government subsidies
(1). Basic information on government subsidies
"√ Applicable" "□ Not applicable"
Unit: Yuan Currency: RMB
Type Amount Presentation item Amount included in
current profit and loss
Special Fund for Shanghai Modern
Service Industry - Three-dimensional
Warehouse
13,131,632.13 Deferred income 672,017.88
Shanghai's second batch special fund
for encouraging enterprises to
purchase international R&D
equipment in 2014
1,740,000.00 Deferred income 174,000.00
R&D and industrialization of key
materials and preparation
technologies in the pen-making
industry
2,446,471.05 Deferred income 244,646.88
Subsidies for the second batch of key
technological transformation projects
in 2013
5,328,614.61 Deferred income 586,104.12
Subsidies for absorption and
innovation projects in 2014 951,743.46 Deferred income 90,443.52
Service industry guidance funds in
2014 3,450,000.00 Deferred income 328,891.68
Key technological transformation
projects of Shanghai in 2015 4,880,000.00 Deferred income 561,878.28
Inbound Marketing - Internet +
product development project 1,000,000.00 Deferred income 107,310.24
Special fund for Shanghai
informatization development 1,340,000.00 Deferred income 194,331.20
Special funds for technology R&D
projects 786,219.51 Deferred income 105,943.09
Special funds for industrial
transformation and upgrade
development of Shanghai in 2016
1,100,000.00 Deferred income 271,637.22
High-value-added product creative
development project 1,300,000.00 Deferred income 29,437.44
Special funds for development of
SMEs in Shanghai in 2016 465,108.77 Deferred income 78,831.89
Zhangjiang Special Development
Fund in 2017 - Achievement
Transformation of “Green Design -
Innovative R&D” by Marco Colorful
Painting Pen C1085
4,600,000.00 Deferred income 174,080.64
Special fund plan for key
technological renovation projects in
Qingpu District in 2012
1,160,000.00 Deferred income 116,000.04
Special funds for central foreign
economic and trade development 1,000,000.00 Deferred income 73,619.64
Construction Project of "Marco-
Color-Source" Creative Experience
Center
2,500,000.00 Deferred income 50,000.04
Subsidies for boiler retrofit 350,000.00 Deferred income 70,000.00
Subsidies for Internet projects 2,590,000.00 Deferred income 1,684,991.88
Financial support 89,557,520.24
Non-operating
expenses 89,557,520.24
Special certificate security skills
training subsidy 3,180.00 Other income 3,180.00
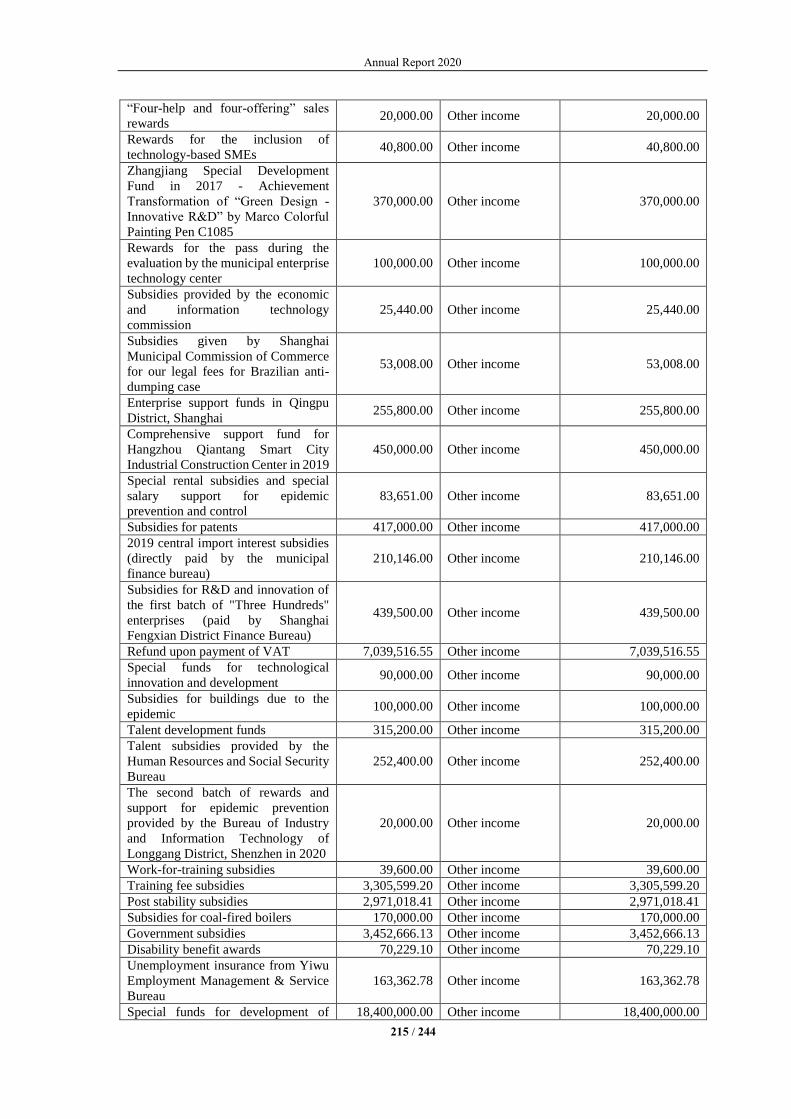
Annual Report 2020
215 / 244
“Four-help and four-offering” sales
rewards 20,000.00 Other income 20,000.00
Rewards for the inclusion of
technology-based SMEs 40,800.00 Other income 40,800.00
Zhangjiang Special Development
Fund in 2017 - Achievement
Transformation of “Green Design -
Innovative R&D” by Marco Colorful
Painting Pen C1085
370,000.00 Other income 370,000.00
Rewards for the pass during the
evaluation by the municipal enterprise
technology center
100,000.00 Other income 100,000.00
Subsidies provided by the economic
and information technology
commission
25,440.00 Other income 25,440.00
Subsidies given by Shanghai
Municipal Commission of Commerce
for our legal fees for Brazilian anti-
dumping case
53,008.00 Other income 53,008.00
Enterprise support funds in Qingpu
District, Shanghai 255,800.00 Other income 255,800.00
Comprehensive support fund for
Hangzhou Qiantang Smart City
Industrial Construction Center in 2019
450,000.00 Other income 450,000.00
Special rental subsidies and special
salary support for epidemic
prevention and control
83,651.00 Other income 83,651.00
Subsidies for patents 417,000.00 Other income 417,000.00
2019 central import interest subsidies
(directly paid by the municipal
finance bureau)
210,146.00 Other income 210,146.00
Subsidies for R&D and innovation of
the first batch of "Three Hundreds"
enterprises (paid by Shanghai
Fengxian District Finance Bureau)
439,500.00 Other income 439,500.00
Refund upon payment of VAT 7,039,516.55 Other income 7,039,516.55
Special funds for technological
innovation and development 90,000.00 Other income 90,000.00
Subsidies for buildings due to the
epidemic 100,000.00 Other income 100,000.00
Talent development funds 315,200.00 Other income 315,200.00
Talent subsidies provided by the
Human Resources and Social Security
Bureau
252,400.00 Other income 252,400.00
The second batch of rewards and
support for epidemic prevention
provided by the Bureau of Industry
and Information Technology of
Longgang District, Shenzhen in 2020
20,000.00 Other income 20,000.00
Work-for-training subsidies 39,600.00 Other income 39,600.00
Training fee subsidies 3,305,599.20 Other income 3,305,599.20
Post stability subsidies 2,971,018.41 Other income 2,971,018.41
Subsidies for coal-fired boilers 170,000.00 Other income 170,000.00
Government subsidies 3,452,666.13 Other income 3,452,666.13
Disability benefit awards 70,229.10 Other income 70,229.10
Unemployment insurance from Yiwu
Employment Management & Service
Bureau
163,362.78 Other income 163,362.78
Special funds for development of 18,400,000.00 Other income 18,400,000.00

Annual Report 2020
216 / 244
enterprises
(2). Return of government subsidies
"□ Applicable" "√ Not applicable"
Other descriptions:
No
85. Others
"□ Applicable" "√ Not applicable"
VIII. Change in consolidation scope
1、 Business combinations not under common control
"□ Applicable" "√ Not applicable"
2、 Business combination under common control
"□ Applicable" "√ Not applicable"
3、 Reverse acquisition
"□ Applicable" "√ Not applicable" Disposal of subsidiaries
Whether there is a loss of control upon a single disposal of investment to subsidiaries
"□ Applicable" "√ Not applicable"
Other descriptions:
"□ Applicable" "√ Not applicable"
4、 Changes in scope of consolidated financial statements for other reasons
Descriptions on changes in the scope of consolidated financial statements for other reasons (e.g,
establishing subsidiaries, clearing subsidiaries, etc.) and their related circumstances:
"√ Applicable" "□ Not applicable"
(1) Three subsidiaries were incorporated into the scope of consolidation through new
establishments for the current year, among which, Shanghai Chenxun Enterprise Management Co., Ltd.
has a registered capital of RMB70 million, with an investment ratio of 100%; Shanghai Qizhihaowan
Culture and Creativity Co., Ltd. has a registered capital of RMB100 million, with an investment ratio of
57%; Shanghai Colipu Information Technology Co., Ltd. has a registered capital of RMB5 million, with
an investment ratio of 100%.
(2) The subsidiary Office Depot Network Technology Co., Ltd. was deregistered for the current
year.
5、 Others
"□ Applicable" "√ Not applicable"
IX. Equity in Other Entities
1、 Equity in subsidiaries
(1). Composition of the corporate group
"√ Applicable" "□ Not applicable"
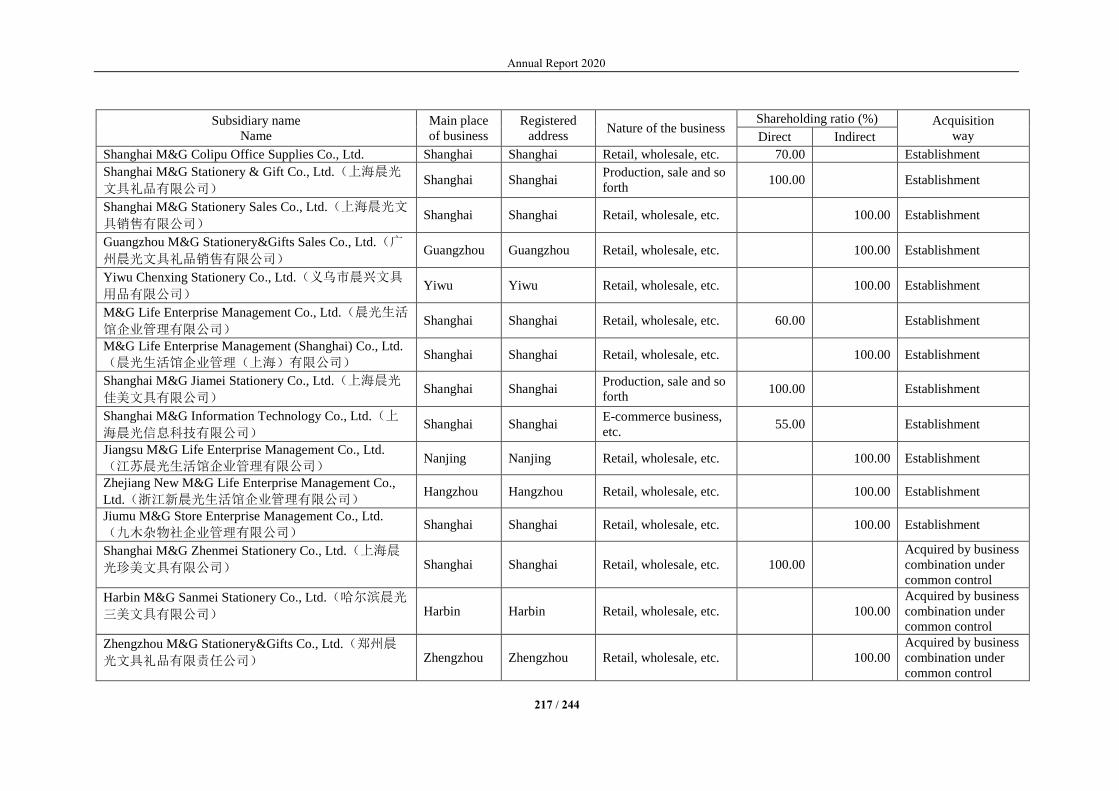
Annual Report 2020
217 / 244
Subsidiary name
Name
Main place
of business
Registered
address Nature of the business
Shareholding ratio (%) Acquisition
way Direct Indirect
Shanghai M&G Colipu Office Supplies Co., Ltd. Shanghai Shanghai Retail, wholesale, etc. 70.00 Establishment
Shanghai M&G Stationery & Gift Co., Ltd.(上海晨光
文具礼品有限公司) Shanghai Shanghai
Production, sale and so
forth 100.00 Establishment
Shanghai M&G Stationery Sales Co., Ltd.(上海晨光文
具销售有限公司) Shanghai Shanghai Retail, wholesale, etc. 100.00 Establishment
Guangzhou M&G Stationery&Gifts Sales Co., Ltd.(广
州晨光文具礼品销售有限公司) Guangzhou Guangzhou Retail, wholesale, etc. 100.00 Establishment
Yiwu Chenxing Stationery Co., Ltd.(义乌市晨兴文具
用品有限公司) Yiwu Yiwu Retail, wholesale, etc. 100.00 Establishment
M&G Life Enterprise Management Co., Ltd.(晨光生活
馆企业管理有限公司) Shanghai Shanghai Retail, wholesale, etc. 60.00 Establishment
M&G Life Enterprise Management (Shanghai) Co., Ltd.
(晨光生活馆企业管理(上海)有限公司) Shanghai Shanghai Retail, wholesale, etc. 100.00 Establishment
Shanghai M&G Jiamei Stationery Co., Ltd.(上海晨光
佳美文具有限公司) Shanghai Shanghai
Production, sale and so
forth 100.00 Establishment
Shanghai M&G Information Technology Co., Ltd.(上
海晨光信息科技有限公司) Shanghai Shanghai
E-commerce business,
etc. 55.00 Establishment
Jiangsu M&G Life Enterprise Management Co., Ltd.
(江苏晨光生活馆企业管理有限公司) Nanjing Nanjing Retail, wholesale, etc. 100.00 Establishment
Zhejiang New M&G Life Enterprise Management Co.,
Ltd.(浙江新晨光生活馆企业管理有限公司) Hangzhou Hangzhou Retail, wholesale, etc. 100.00 Establishment
Jiumu M&G Store Enterprise Management Co., Ltd.
(九木杂物社企业管理有限公司) Shanghai Shanghai Retail, wholesale, etc. 100.00 Establishment
Shanghai M&G Zhenmei Stationery Co., Ltd.(上海晨
光珍美文具有限公司) Shanghai Shanghai Retail, wholesale, etc. 100.00
Acquired by business
combination under
common control
Harbin M&G Sanmei Stationery Co., Ltd.(哈尔滨晨光
三美文具有限公司) Harbin Harbin Retail, wholesale, etc. 100.00
Acquired by business
combination under
common control
Zhengzhou M&G Stationery&Gifts Co., Ltd.(郑州晨
光文具礼品有限责任公司) Zhengzhou Zhengzhou Retail, wholesale, etc. 100.00
Acquired by business
combination under
common control
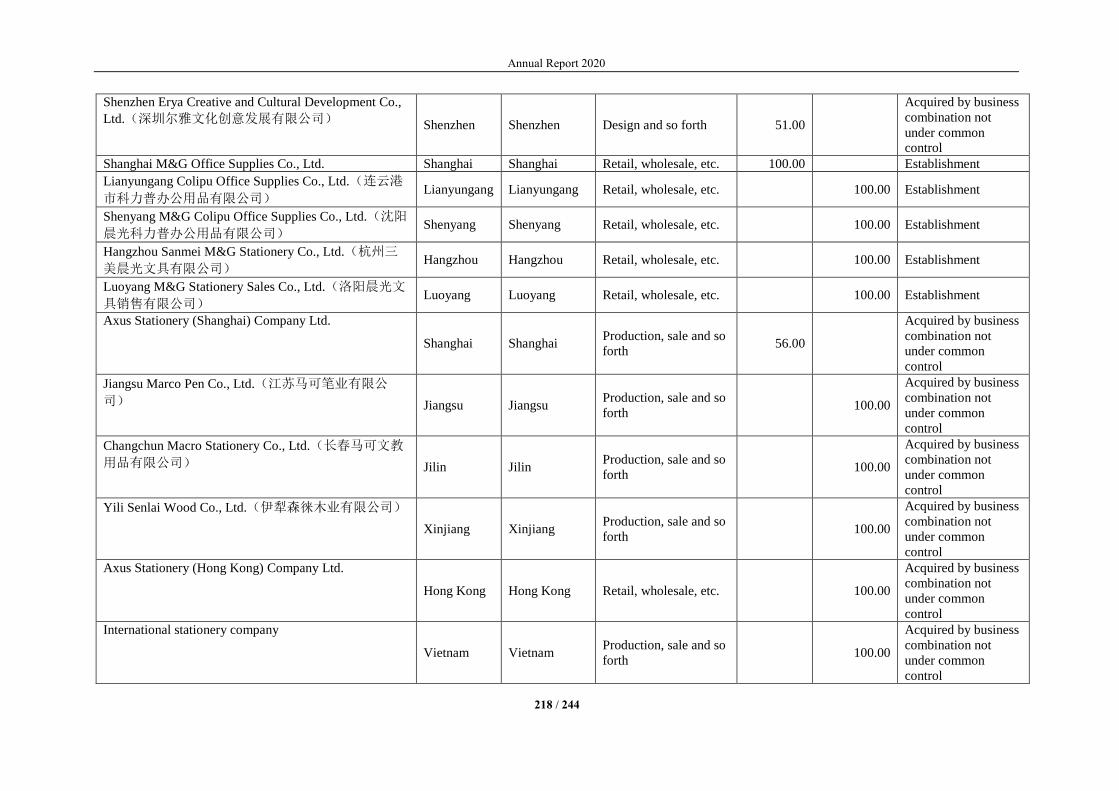
Annual Report 2020
218 / 244
Shenzhen Erya Creative and Cultural Development Co.,
Ltd.(深圳尔雅文化创意发展有限公司) Shenzhen Shenzhen Design and so forth 51.00
Acquired by business
combination not
under common
control
Shanghai M&G Office Supplies Co., Ltd. Shanghai Shanghai Retail, wholesale, etc. 100.00 Establishment
Lianyungang Colipu Office Supplies Co., Ltd.(连云港
市科力普办公用品有限公司) Lianyungang Lianyungang Retail, wholesale, etc. 100.00 Establishment
Shenyang M&G Colipu Office Supplies Co., Ltd.(沈阳
晨光科力普办公用品有限公司) Shenyang Shenyang Retail, wholesale, etc. 100.00 Establishment
Hangzhou Sanmei M&G Stationery Co., Ltd.(杭州三
美晨光文具有限公司) Hangzhou Hangzhou Retail, wholesale, etc. 100.00 Establishment
Luoyang M&G Stationery Sales Co., Ltd.(洛阳晨光文
具销售有限公司) Luoyang Luoyang Retail, wholesale, etc. 100.00 Establishment
Axus Stationery (Shanghai) Company Ltd.
Shanghai Shanghai Production, sale and so
forth 56.00
Acquired by business
combination not
under common
control
Jiangsu Marco Pen Co., Ltd.(江苏马可笔业有限公
司) Jiangsu Jiangsu Production, sale and so
forth 100.00
Acquired by business
combination not
under common
control
Changchun Macro Stationery Co., Ltd.(长春马可文教
用品有限公司) Jilin Jilin Production, sale and so
forth 100.00
Acquired by business
combination not
under common
control
Yili Senlai Wood Co., Ltd.(伊犁森徕木业有限公司)
Xinjiang Xinjiang Production, sale and so
forth 100.00
Acquired by business
combination not
under common
control
Axus Stationery (Hong Kong) Company Ltd.
Hong Kong Hong Kong Retail, wholesale, etc. 100.00
Acquired by business
combination not
under common
control
International stationery company
Vietnam Vietnam Production, sale and so
forth 100.00
Acquired by business
combination not
under common
control
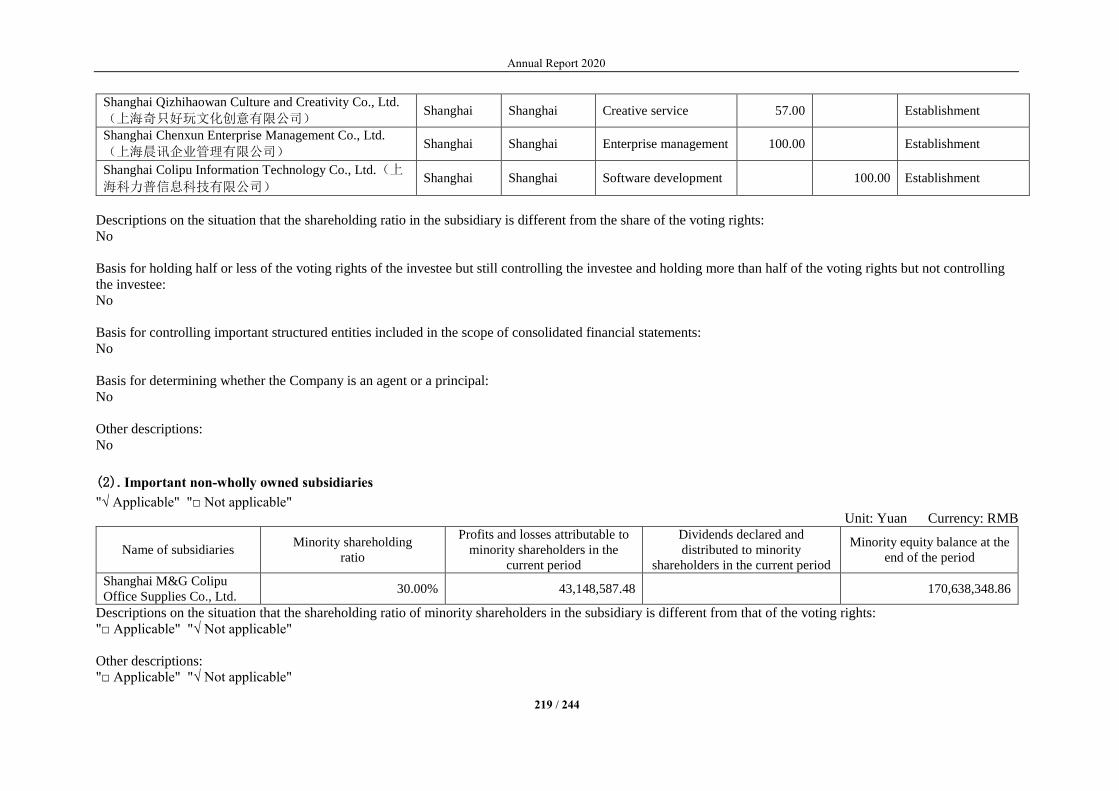
Annual Report 2020
219 / 244
Shanghai Qizhihaowan Culture and Creativity Co., Ltd.
(上海奇只好玩文化创意有限公司) Shanghai Shanghai Creative service 57.00 Establishment
Shanghai Chenxun Enterprise Management Co., Ltd.
(上海晨讯企业管理有限公司) Shanghai Shanghai Enterprise management 100.00 Establishment
Shanghai Colipu Information Technology Co., Ltd.(上
海科力普信息科技有限公司) Shanghai Shanghai Software development 100.00 Establishment
Descriptions on the situation that the shareholding ratio in the subsidiary is different from the share of the voting rights:
No
Basis for holding half or less of the voting rights of the investee but still controlling the investee and holding more than half of the voting rights but not controlling
the investee:
No
Basis for controlling important structured entities included in the scope of consolidated financial statements:
No
Basis for determining whether the Company is an agent or a principal:
No
Other descriptions:
No
(2). Important non-wholly owned subsidiaries
"√ Applicable" "□ Not applicable"
Unit: Yuan Currency: RMB
Name of subsidiaries Minority shareholding
ratio
Profits and losses attributable to
minority shareholders in the
current period
Dividends declared and
distributed to minority
shareholders in the current period
Minority equity balance at the
end of the period
Shanghai M&G Colipu
Office Supplies Co., Ltd. 30.00% 43,148,587.48 170,638,348.86
Descriptions on the situation that the shareholding ratio of minority shareholders in the subsidiary is different from that of the voting rights:
"□ Applicable" "√ Not applicable"
Other descriptions:
"□ Applicable" "√ Not applicable"

Annual Report 2020
220 / 244
(3). Major financial information of important non-wholly owned subsidiaries
"√ Applicable" "□ Not applicable"
Unit: 0’000 Currency: RMB
Name of
subsidiaries
Closing balance Opening balance
Current
assets
Non-
current
assets
Total
assets
Current
liabilities
Non-
current
liabilities
Total
liabilities
Current
assets
Non-
current
assets
Total
assets
Current
liabilities
Non-
current
liabilities
Total
liabilities
Shanghai
M&G
Colipu
Office
Supplies
Co., Ltd.
237,271.61 6,474.92 243,746.53 184,145.14 2,721.93 186,867.07 163,996.71 3,579.48 167,576.19 122,907.02 3,511.47 126,418.49
Name of subsidiaries
Amount accounted for in the current period Amount accounted for in the previous period
Revenue Net profit
Total
comprehensive
income
Cash flow
from operating
activities
Revenue Net profit
Total
comprehensive
income
Cash flow
from operating
activities
Shanghai M&G Colipu
Office Supplies Co.,
Ltd.
500,027.59 14,382.86 14,382.86 22,586.95 365,806.17 7,580.35 7,580.35 14,880.10
Other descriptions:
No

Annual Report 2020
221 / 244
(4). Significant restrictions on the use of corporate group assets and the liquidation of corporate
group debts
"□ Applicable" "√ Not applicable"
(5). Financial support or other support provided to structured entities included in the scope of
consolidated financial statements
"□ Applicable" "√ Not applicable"
Other descriptions:
"□ Applicable" "√ Not applicable"
2、 Transactions which result in a change in the share of owners’ equity in the subsidiary but the
Company still controls the subsidiary
"□ Applicable" "√ Not applicable"
3、 Equity in joint ventures or associates
"√ Applicable" "□ Not applicable"
(1). Important joint ventures or associates
"□ Applicable" "√ Not applicable"
(2). Major financial information of important joint ventures
"□ Applicable" "√ Not applicable"
(3). Major financial information of important associates
"□ Applicable" "√ Not applicable"
(4). Summary financial information of unimportant joint ventures and associates
"√ Applicable" "□ Not applicable"
Unit: Yuan Currency: RMB
Balance at the end of the
period/Amount accounted for in
the current period
Balance at the beginning of the
period/Amount accounted for in
the previous period
Joint ventures:
Total carrying value of
investments
Total of the following items calculated according to the shareholding ratio
--Net profits
--Other comprehensive income
--Total comprehensive income
Associates:
Total carrying value of
investments 34,722,395.67 35,582,783.47
Total of the following items calculated according to the shareholding ratio
--Net profits -1,610,614.02 -576,595.97
--Other comprehensive income 750,226.22 -16,285.82
--Total comprehensive income -860,387.80 -592,881.79
Other descriptions
No
Annual Report 2020
222 / 244
(5). Descriptions on significant limitation of the ability of a joint venture or associate to transfer
funds to the Company
"□ Applicable" "√ Not applicable"
(6). Excess losses incurred by a joint venture or associate
"□ Applicable" "√ Not applicable"
(7). Unrecognized commitments related to joint venture investment
"□ Applicable" "√ Not applicable"
(8). Contingent liabilities related to joint venture or associate investment
"□ Applicable" "√ Not applicable"
4、 Important joint operations
"□ Applicable" "√ Not applicable"
5、 Equity in structured entities not included in the consolidated financial statements
Descriptions on structured entities not included in the consolidated financial statements:
"□ Applicable" "√ Not applicable"
6、 Others
"□ Applicable" "√ Not applicable"
X. Risks associated with financial instruments
"√ Applicable" "□ Not applicable"
The Company faces various financial risks in its business operations: credit risk, liquidity risk and
market risk (including exchange rate risk, interest rate risk and other price risk). The above financial risks
and the risk management policies adopted by the Company to reduce these risks are as follows:
The Board of Directors is responsible for planning and establishing the Company's risk management
structure, formulating the Company's risk management policies and related guidelines, and supervising
the implementation of risk management measures. The Company has formulated risk management policies
to identify and analyze the risks faced by the Company. These risk management policies clearly stipulate
specific risks, covering many aspects in the management of market risk, credit risk and liquidity risk. The
Company regularly evaluates the market environment and changes in the Company's business activities to
determine whether to update the risk management policies and systems. The Company's risk management
is carried out by the Risk Management Committee in accordance with the policies approved by the Board
of Directors. The Risk Management Committee works closely with other business departments of the
Company to identify, evaluate and avoid related risks. The Internal Audit Department of the Company
conducts regular audits on risk management control and procedures, and reports the audit results to the
Audit Committee of the Company.
The Company diversifies the risk of financial instruments through appropriate diversified investment
and business portfolios, and reduces the risks relating to concentration in a single industry, specific region
or specific counterparty through formulation of corresponding risk management policies.
(I) Credit risk
Credit risk refers to the risk of the Company's financial losses due to the failure of the counterparty
to perform its contractual obligations.
the Company’s credit risk mainly arises from monetary funds, notes receivable, accounts receivable,
accounts receivable financing, other receivables, debt investments, other debt investments and financial
guarantee contracts, etc., and debt instruments and derivative financial assets at fair value through current

Annual Report 2020
223 / 244
profit or loss that are not included in the scope of impairment assessment. At the balance sheet date, the
carrying value of the Company's financial assets represented its maximum credit risk exposure.
The Company’s monetary funds are mainly bank deposits deposited in reputable state-owned banks
and other large and medium-sized listed banks with high credit ratings, thus the Company believes that
there are no significant credit risks and almost no major losses caused by bank defaults.
In addition, for notes receivable, accounts receivable, financing receivables and other receivables,
the Company sets relevant policies to control credit risk exposure. The Company evaluates the customer's
credit qualifications and sets the corresponding credit period based on the customer's financial status,
possibility of obtaining guarantees from a third party, credit history and other factors such as current
market conditions. The Company regularly monitors customer credit records. For customers with poor
credit records, the Company uses written dunning and shortens or cancels the credit period, etc., to ensure
that the Company's overall credit risk is within the controllable range.
(II) Liquidity risk
Liquidity risk is the risk of a shortage of funds of the Company when the Company is performing its
obligation to settle in the form of delivery of cash or other financial assets.
The Company's policy is to ensure that there is sufficient cash to pay off the debts due. Liquidity risk
is centrally controlled by the Company's Finance Department. Finance Department ensures that the
Company has sufficient funds to repay debts under all reasonable forecasts by monitoring cash balances,
marketable securities at any time, and rolling forecasts of the cash flows in the coming 12 months. Finance
Department also continuously monitors whether the Company complies with the provisions of the loan
agreement and obtains commitments from major financial institutions to provide sufficient reserve funds
so as to meet short- and long-term funding needs.
Financial liabilities of the Company are presented as unrealized contractual cash flows on the maturity
date as follows:
Item Closing balance
Immediate repayment Within 1 year 1-2 years 2-5 years Above 5 years Total
Short-term
borrowings
176,000.00 180,000,000.00 180,176,000.00
Total 176,000.00 180,000,000.00 180,176,000.00
Item Balance at the end of the year
Immediate repayment Within 1 year 1-2 years 2-5 years Above 5 years Total
Short-term
borrowings
214,235.05 182,979,528.81 183,193,763.86
Total 214,235.05 182,979,528.81 183,193,763.86
(III) Market risk
Market risk of financial instruments is the risk that the fair value or future cash flows of financial
instruments will fluctuate due to changes in market prices including exchange rate risk, interest rate risk
and other price risks.
1. Interest rate risk
Interest rate risk is the risk that the fair value or future cash flows of a financial instrument will
fluctuate due to changes in market rates.
2. Exchange rate risk
Exchange rate risk is the risk that the fair value or future cash flows of a financial instrument will
fluctuate due to changes in foreign exchange rates.
The Company continuously monitors the scale of foreign-currency transactions and foreign-currency
assets and liabilities to minimize foreign exchange risks. In addition, the Company may also sign forward
foreign exchange contracts or currency swap contracts to avoid exchange rate risk. During the current
period and the previous period, the Company did not sign any forward foreign exchange contracts or
currency swap contracts.

Annual Report 2020
224 / 244
Foreign exchange risk faced by the Company mainly comes from financial assets and liabilities denominated in USD, and the amounts of foreign currency
financial assets and liabilities converted into RMB are shown below:
Item Closing balance Balance at the end of the year
USD Other foreign currencies Total USD Other foreign currencies Total
Cash and equivalents 82,557,145.55 2,607,950.11 85,165,095.66 118,934,500.87 3,553,801.91 122,488,302.78
Accounts receivable 31,500,641.44 186,699.84 31,687,341.28 3,162,321.09 20,981,217.43 24,143,538.52
Other receivables 427,463.91 427,463.91 497,820.40 497,820.40
Total foreign currency financial
assets
114,057,786.99 3,222,113.86 117,279,900.85 122,096,821.96 25,032,839.74 147,129,661.70
Short-term borrowings 427,099.11 427,099.11
Accounts payable 3,968,191.47 1,778,217.76 5,746,409.23 2,620,359.64 73,402,088.01 76,022,447.65
Other payables 282,014.95 282,014.95 1,091,367.20 1,091,367.20
Total foreign currency financial
liabilities
3,968,191.47 2,060,232.71 6,028,424.18 3,047,458.75 74,493,455.21 77,540,913.96
XI. Disclosure of fair value
1. Closing fair value of assets and liabilities measured at fair value
"√ Applicable" "□ Not applicable"
Unit: Yuan Currency: RMB
Item
Closing fair value
Level-1 fair value
measurement
Level-2 fair value
measurement
Level-3 fair value
measurement Total
I. Continuous fair value measurement
(I) Held-for-trading financial assets
1. Financial assets at fair value through profit or loss

Annual Report 2020
225 / 244
(1) Debt instrument investment
(2) Equity instrument investment
(3) Derivative financial assets
(4) Others 1,428,277,848.33 1,428,277,848.33
2. Financial assets designated as at fair value through profit or loss
(1) Debt instrument investment
(2) Equity instrument investment
(II) Other debt investments
(III) Other equity instrument investments 5,476,577.42 5,476,577.42
(IV) Investment real estate
1. Land use rights used for rent
2. Rental buildings
3. Land use rights held and ready to be transferred after appreciation
(V) Biological assets
1. Consumable biological assets
2. Productive biological assets
(VI) Receivables financing 61,412,976.46 61,412,976.46
Total assets continuously measured at fair value 1,428,277,848.33 66,889,553.88 1,495,167,402.21
(VI) Held-for-trading financial liabilities
1. Financial liabilities at fair value through profit or loss
Including: Trading bonds issued
Derivative financial liabilities
Others
2. Financial liabilities designated as at fair value through profit or loss
Total liabilities continuously measured at fair value
II. Non-continuous fair value measurement
(I) Assets held for sale
Total assets not continuously measured at fair value
Total liabilities not continuously measured at fair value

Annual Report 2020
226 / 244
2. Basis for determining market prices of items continuously and not continuously measured at
the first-level fair value
"√ Applicable" "□ Not applicable"
The input value of the first level is the unadjusted quotation of the same asset or liability that can be
obtained on the measurement date in the active market.
3. Qualitative and quantitative information on valuation techniques and important parameters
adopted by items continuously and not continuously measured at the second-level fair value
"√ Applicable" "□ Not applicable"
The input value of the second level is the directly or indirectly observable input value of related assets or
liabilities except the input value of the first level.
4. Qualitative and quantitative information on valuation techniques and important parameters
adopted by items continuously and not continuously measured at the third-level fair value
"√ Applicable" "□ Not applicable"
The input value of the third level is the unobservable input value of the related asset or liability.
5. Information on adjustment between the beginning carrying value and the closing carrying
value of items continuously measured at the third-level fair value and sensitivity analysis on
unobservable parameters
"□ Applicable" "√ Not applicable"
6. For items continuously measured at fair value, in case of any conversion between various levels
during the period, reasons for the conversion and policies to determine the conversion time
should be provided
"□ Applicable" "√ Not applicable"
7. Changes in valuation techniques and reasons for changes during the period
"□ Applicable" "√ Not applicable"
8. Particulars on fair value of financial assets and liabilities which are not measured at fair value
"□ Applicable" "√ Not applicable"
9. Others
"□ Applicable" "√ Not applicable"
XII. Related Parties and Related-Party Transactions
1. Particulars on the parent company of the Company
"√ Applicable" "□ Not applicable"
Unit: 0’000 Currency: RMB
Name of the
parent
company
Registered
address
Nature of
the business
Registered
capital
The parent company's
shareholding ratio in
the Company (%)
The parent company's
voting right ratio in
the Company (%)
M&G
Holdings
(Group) Co.,
Ltd.
Shanghai Industrial
Investment
RMB300
million
57.79 57.79
Descriptions on the parent company of the Company
No
The ultimate controlling party of the Company is Chen Huwen, Chen Huxiong and Chen Xueling.
Other descriptions:
Annual Report 2020
227 / 244
No
2. Particulars on subsidiaries of the Company
Particulars on subsidiaries of the Company are shown in the relevant notes
"√ Applicable" "□ Not applicable"
For particulars on subsidiaries of the Company, see Note IX. Equity in Other Entities for details.
3. Particulars on joint ventures and associates of the Company
For important joint ventures and associates of the Company, see the Notes for details
"√ Applicable" "□ Not applicable"
For particulars on subsidiaries of the Company, see Note IX. Equity in Other Entities for details.
Particulars on other joint ventures and associates which have related-party transactions with the
Company in the current period or had related-party transactions with the Company in the previous
period and form balances are as follows
"√ Applicable" "□ Not applicable"
Name of joint venture and associate Relationship with the
Company
Ningbo Zhongchen Equity Investment Partnership (Limited Partnership) Associates
Shanghai Pen-making Technology Services Co., Ltd. Associates
Other descriptions
"□ Applicable" "√ Not applicable"
4. Particulars on other related parties
"√ Applicable" "□ Not applicable"
Name of other related parties Relationship between other related
parties and the Company
Shanghai Jiekui Investment Management Firm (L.P.) Share-participation shareholders
Shanghai Keying Investment Management Office (L.P.) Share-participation shareholders
PELEG DESIGN Ltd Others
Guo Weilong Others
Wuxi Creative M&G Trading Co., Ltd. Others
Nanjing Zhaochen Stationery Sales Co., Ltd. Others
Nanjing Youchen Stationery Sales Co., Ltd. Others
Nanjing Chenri Stationery Sales Co., Ltd. Others
Other descriptions
No
5. Particulars on related-party transactions
(1). Related-party transactions for the purchase and sales of goods and the rendering and receipt
of services
Table of information on the purchase of goods/the receipt of services
"√ Applicable" "□ Not applicable"
Unit: Yuan Currency: RMB
Related party Related-party
transaction content
Amount accounted for
in the current period
Amount accounted for
in the previous period
PELEG DESIGN Ltd Purchase of goods 702,355.15
Table of information on the sale of goods/the rendering of services
"√ Applicable" "□ Not applicable"
Unit: Yuan Currency: RMB

Annual Report 2020
228 / 244
Related party Related-party
transaction content
Amount accounted for
in the current period
Amount accounted for
in the previous period
Sales entities controlled by
Guo Weilong
Sale of goods 439,535,408.86 387,821,087.67
Particulars on related-party transactions for the purchase and sales of goods and the rendering and
receipt of services
"□ Applicable" "√ Not applicable"
(2). Particulars on related-party entrusted management/contracting and entrusting
management/outsourcing
Table of information on the Company's entrusted management/contracting:
"□ Applicable" "√ Not applicable"
Particulars on related-party entrusting/contracting
"□ Applicable" "√ Not applicable"
Table of information on the Company's entrusting management/outsourcing
"□ Applicable" "√ Not applicable"
Particulars on related-party management/outsourcing
"□ Applicable" "√ Not applicable"
(3). Particulars on related-party leases
The Company as the lessor:
"√ Applicable" "□ Not applicable"
Unit: Yuan Currency: RMB
Name of lessee Types of leased assets
Rental income
recognized in the
current period
Rental income
recognized in the
previous period
Shanghai Jiekui Investment
Management Firm (L.P.)
Self-owned office building
Shanghai Keying Investment
Management Office (L.P.)
Self-owned office building
The Company as the lessee:
"√ Applicable" "□ Not applicable"
Unit: Yuan Currency: RMB
Name of lessor Types of leased assets Rental fee recognized
in the current period
Rental fee recognized
in the previous period
M&G Holdings
(Group) Co., Ltd.
Self-owned houses (including
office buildings, workshops,
parking spaces, warehouses,
dormitory buildings, etc.)
4,620,952.38 3,622,857.14
M&G Holdings
(Group) Co., Ltd.
Self-owned office buildings
and parking spaces
18,693,105.31 20,368,751.26
M&G Holdings
(Group) Co., Ltd.
Utilities 5,164,795.80 5,283,878.50
Descriptions on related-party leases
"□ Applicable" "√ Not applicable"
(4). Particulars on related-party guarantees
The Company as a guarantor
"□ Applicable" "√ Not applicable"
The Company as a guaranteed party
"□ Applicable" "√ Not applicable"
Descriptions on related-party guarantees

Annual Report 2020
229 / 244
"□ Applicable" "√ Not applicable"
(5). Related-party fund lending
"□ Applicable" "√ Not applicable"
(6). Related-party asset transfer and debt restructuring
"□ Applicable" "√ Not applicable"
(7). Compensation of key management personnel
"□ Applicable" "√ Not applicable"
(8). Other related-party transactions
"□ Applicable" "√ Not applicable"
6. Receivables from and payables to related parties
(1). Receivables
"√ Applicable" "□ Not applicable"
Unit: Yuan Currency: RMB
Items Related party
Closing balance Opening balance
Carrying
balance
Bad debt
provisions
Carrying
balance
Bad debt
provisions
Prepayment M&G Holdings
(Group) Co., Ltd. 5,301,834.70 3,419,063.44
Other
receivables
Sales entities
controlled by Guo
Weilong
12.93 0.65
(2). Payables
"√ Applicable" "□ Not applicable"
Unit: Yuan Currency: RMB
Items Related party Carrying balance at the
end of the period
Carrying balance at the
beginning of the period
Accounts payable Sales entities controlled
by Guo Weilong 87,891.05 9,576.58
Accounts payable PELEG DESIGN Ltd 660,345.39
Other payables Sales entities controlled
by Guo Weilong 1,485,000.00 1,310,000.00
Other payables M&G Holdings (Group)
Co., Ltd. 1,144,105.84 6,234,878.32
Accounts received in
advance
Sales entities controlled
by Guo Weilong 38,198,477.81
Contract liabilities Sales entities controlled
by Guo Weilong 21,037,129.41
7. Related-party commitments
"□ Applicable" "√ Not applicable"
8. Others
"□ Applicable" "√ Not applicable"
Annual Report 2020
230 / 244
XIII. Share-based payments
1. Overall situation of share-based payment
"√ Applicable" "□ Not applicable"
Unit: Share Currency: RMB
Total amount of equity instruments granted by the
Company in the current period
7,427,600
Total amount of equity instruments vested by the
Company in the current period
0
Total amount of equity instruments of the Company
expired in the current period
138,600
Scope of the vesting price of the outstanding stock options
of the Company at the end of the period and the remaining
period of the contract
Restricted stocks are granted at a price of
RMB23.7/share and are valid for 3 years
from the date of grant; the remaining validity
period is 2.67 years
Scope of the vesting price of other outstanding equity
instruments of the Company at the end of the period and
the remaining period of the contract
Other descriptions
No
2. Particulars on equity-settled share-based payment
"√ Applicable" "□ Not applicable"
Unit: Yuan Currency: RMB
Determination method of the fair value of equity
instruments at the date of grant
The closing price of the stocks on the date of
grant was RMB58.70/share
Determination basis for the number of vesting equity
instruments
At each balance sheet date during the waiting
period, the Company will make the best estimate
based on the latest obtained follow-up
information such as changes in the number of
vesting employees, and revise the expected
number of vesting equity instruments
Reasons for the significant difference between the
current estimate and the previous estimate
No
Cumulative amount of equity-settled share-based
payments included in the capital reserve
79,130,855.20
Total amount of expenses recognized by equity-settled
share-based payments in the current period
82,199,024.88
Other descriptions
According to the 2020 Restricted Stock Incentive Plan of Shanghai M&G Stationery Inc. (Draft)
considered and approved at the 20th meeting of the fourth Board of Directors of the Company on 10 April
2020, for the first grant, the Company intended to grant a total of 9,180,600 restricted stocks to 343
incentive objects at a price of RMB24.1/share.
On 8 May 2020, the Company held the 2019 Annual General Meeting of Shareholders, which
considered and approved the Proposal on the Company's 2020 Restricted Stock Incentive Plan (Draft) and
Its Summary, the Proposal on the Management Measures for the Implementation of the Company's 2020
Restricted Stock Incentive Plan, and the Proposal on Requesting the General Meeting of Shareholders to
Authorize the Board of Directors to Deal with Matters Related to Restricted Stock Incentives.
On 8 May 2020, the Company held the 1st meeting of the fifth Board of Directors and the 1st meeting
of the fifth Board of Supervisors, which considered and approved the Proposal on Adjusting the 2020
Restricted Stock Incentive Plan and the Proposal on Granting Restricted Stocks to Incentive Objects in
2020. Pursuant to the proposals, the Company intended to grant 7,441,200 restricted stocks to 335
incentive objects at a price of RMB23.7/share.
According to the Proposal on Adjusting the 2020 Restricted Stock Incentive Plan considered and
approved at the 1st meeting of the fifth Board of Directors and the 1st meeting of the fifth Board of

Annual Report 2020
231 / 244
Supervisors held by the Company on 8 May 2020, the first grant price of restricted stocks was adjusted
from RMB24.1/share to RMB23.7/share, the first grant number of incentive objects from 343 to 335, and
the first grant number of restricted stocks from 7,583,000 to 7,441,200, while the total number of restricted
stocks to be granted according to this equity incentive plan was adjusted from 9,180,600 to 9,038,700.
After the date of grant of the restricted stock incentive plan was determined, 6 incentive objects
resigned and abandoned the equity incentive plan. As of 31 December 2020, the number of incentive
objects actually granted by the stock incentive plan was 329, and the number of restricted stocks actually
granted was 7,289,000 shares.
The incentive plan evaluates the Company's operating performance annually, and takes the
achievement of the performance evaluation target as one of the conditions for releasing the sales
restrictions for the incentive objects in the current year. The performance evaluation objectives of the
incentive plan are shown in the following table:
Date of releasing the sales
restrictions
Performance evaluation objective
The first period of releasing
the sales restrictions
Based on 2019, the growth rate of operating income in 2020 will not be less
than 15%, and the growth rate of net profit in 2020 will not be less than
10%;
The second period of
releasing the sales restrictions
Based on 2019, the growth rate of operating income in 2021 will not be less
than 45%, and the growth rate of net profit in 2021 will not be less than
34%;
The third period of releasing
the sales restrictions
Based on 2019, the growth rate of operating income in 2022 will not be less
than 75%, and the growth rate of net profit in 2022 will not be less than
66%.
Note: the above-mentioned “net profit” refers to the audited net profit attributable to shareholders of
the parent company.
During the period of releasing the sales restrictions, the Company handles the matter related to
releasing the sales restrictions for the incentive objects that meet the conditions for releasing the sales
restrictions. If the Company's current performance level fails to meet the performance evaluation target
conditions during each period of releasing the sales restrictions, the restricted stocks of all the incentive
objects that meet conditions for release during the corresponding year, cannot be released from sales
restrictions, but shall be repurchased and cancelled by the Company at the grant price.
3. Particulars on cash-settled share-based payment
"□ Applicable" "√ Not applicable"
4. Particulars on modification and termination of share-based payment
"□ Applicable" "√ Not applicable"
5. Others
"□ Applicable" "√ Not applicable"
XIV. Commitments and Contingencies
1. Important commitments
"√ Applicable" "□ Not applicable"
Important external commitments, nature, and amount existing on the balance sheet date
On 24 September 2020, Axus Stationery and Industrial Bank Co., Ltd. Shanghai Zhangyang Branch
entered into the Line Credit Contract numbered Zhang Yang SXAS2020 with the credit line of
RMB250,000,000.00 for 12 months from 24 September 2020 to 23 September 2021. The specific types
of line business include, but are not limited to, working capital loans, bank notes, and letters of credit.

Annual Report 2020
232 / 244
On 24 September 2020, Axus Stationery and Industrial Bank Co., Ltd. Shanghai Zhangyang Branch
entered into the Maximum Mortgage Contract numbered Zhang Yang DYAS2020. This contract is a
sub-contract of the Line Credit Contract. The maximum principal limit of the mortgage under this
contract is RMB200,000,000.00, and the mortgage limit is valid from 24 September 2020 to 23
September 2021.
The mortgage term runs from the effective date of the mortgage contract to the termination of
litigation for facility credit. The collaterals for mortgage include:
Name of collateral Ownership No. Original value Accumulated
depreciation Net value
No. 111 Xuezi South
Road, Xianghuaqiao
Street, Qingpu District
HFDQ Zi (2013)
No. 015437 47,061,453.52 24,976,111.47 22,085,342.05
No. 233 Xuezi South
Road, Xianghuaqiao
Street, Qingpu District
HFDQ Zi (2013)
No. 013396 32,156,238.78 12,856,455.39 19,299,783.39
No. 333 Xuezi South
Road, Xianghuaqiao
Street, Qingpu District
HFDQ Zi (2015)
No. 015718 60,230,210.97 15,309,106.79 44,921,104.18
Total 139,447,903.27 53,141,673.65 86,306,229.62
Under the framework of the above-mentioned Line Credit Contract and Maximum Mortgage
Contract, on 24 September 2020, Axus Stationery and Industrial Bank Co., Ltd. Shanghai Zhangyang
Branch signed the Working Capital Loans Contract numbered Zhang Yang LDAS2020, with the
contractual loan amount of RMB180,000,000.00, the loan period of 12 months from 25 September 2020
to 24 September 2021, and the loan interest rate of one-year term LPR.
As of 31 December 2020, the outstanding loan of Axus Stationery was RMB180,000,000.00.
2. Contingencies
(1). Important contingencies on the balance sheet date
"□ Applicable" "√ Not applicable"
(2). If the Company has no important contingent issues that need to be disclosed, it should also be
explained:
"□ Applicable" "√ Not applicable"
3. Others
"□ Applicable" "√ Not applicable"
XV. Post-balance sheet date events
1. Important non-adjustment matters
"□ Applicable" "√ Not applicable"
2. Profit distribution
"√ Applicable" "□ Not applicable"
Unit: Yuan Currency: RMB
Profits or dividends proposed to be distributed 463,713,800
Profits or dividends reviewed and approved to be declared for distribution
According to the Profit Distribution Plan for 2020 reviewed and approved by the 5th meeting of the
fifth session of Board of Directors of the Company on 26 March 2021, based on the total sock capital
registered on the registration date for the implementation of the equity distribution, the Company intends
to distribute the dividend in cash at RMB5 every 10 shares (tax inclusive) to all shareholders. The
remaining distributable profits in 2020 will be carried forward to the following year.
Annual Report 2020
233 / 244
3. Sales return
"□ Applicable" "√ Not applicable"
4. Explanations on other post-balance-sheet-date events
"□ Applicable" "√ Not applicable"
XVI. Other Important Issues
1. Correction of previous-period accounting errors
(1). Retrospective restatement method
"□ Applicable" "√ Not applicable"
(2). Future application method
"□ Applicable" "√ Not applicable"
2. Debt restructuring
"□ Applicable" "√ Not applicable"
3. Asset replacement
(1). Non-monetary asset exchange
"□ Applicable" "√ Not applicable"
(2). Other asset replacement
"□ Applicable" "√ Not applicable"
4. Annuity plan
"□ Applicable" "√ Not applicable"
5. Discontinued operations
"□ Applicable" "√ Not applicable"
6. Segment information
(1). Basis for determining reporting segments and accounting policies
"√ Applicable" "□ Not applicable"
According to the Company's internal organizational structure, management requirements and internal
reporting system, two reporting segments are identified, namely: office direct-selling business and
traditional core business. The Company's reporting segments provide different services. Since each
segment requires different technical or marketing strategies, the management of the Company separately
manages the operating activities of each reporting segment and regularly evaluates the operating results
of these reporting segments to determine the allocation of resources to them and the evaluation of their
performance.
The transfer price between segments is determined on the basis of the actual transaction price, and
the expenses indirectly attributable to each segment are grouped according to the actual share of each
segment. Assets are allocated according to the operation of the segment and the location of the asset.
Segment liabilities include liabilities that can be attributed to the segment formed by the segment's
operating activities. If the expenses associated with liabilities shared by multiple operating segments are
allocated to these operating segments, the jointly assumed liabilities are also allocated to these operating
segments.
(2). Financial information of reporting segments
"√ Applicable" "□ Not applicable"

Annual Report 2020
234 / 244
Unit: Yuan Currency: RMB
Item Office direct-selling
business
Traditional core
business
Inter-segment
elimination
Total
Revenue from
foreign
transactions
4,989,638,214.67 8,241,591,422.03 93,483,909.52 13,137,745,727.18
Revenue from
inter-segment
transactions
10,637,701.39 82,846,208.13 93,483,909.52
Income from
investments in
associates and
joint ventures
-1,610,614.02 -1,610,614.02
Credit impairment
losses
-22,065,328.47 -16,160,573.65 -38,225,902.12
Asset impairment
losses
-137,304.43 -40,150,179.40 -40,287,483.83
Depreciation and
amortization
charges
9,763,350.25 246,791,720.77 256,555,071.02
Total profits (total
losses)
184,529,940.14 1,332,315,470.25 -303,400.77 1,517,148,811.16
Income tax
expenses
40,701,315.22 237,997,919.75 -75,850.19 278,775,085.16
Net profits (net
losses)
143,828,624.92 1,094,317,550.50 -227,550.58 1,238,373,726.00
Total assets 2,437,465,217.49 7,343,718,965.00 71,275,746.17 9,709,908,436.32
Total liabilities 1,868,670,721.29 2,471,299,050.02 71,048,195.59 4,268,921,575.72
(3). If the Company does not have a reporting segment, or if it cannot disclose the total assets and
total liabilities of each reporting segment, the reason should be explained
"□ Applicable" "√ Not applicable"
(4). Other descriptions
"□ Applicable" "√ Not applicable"
7. Other important transactions and matters that have an impact on investors’ decisions
"□ Applicable" "√ Not applicable"
8. Others
"□ Applicable" "√ Not applicable"
XVII. Notes on the main items of the parent company's financial statements
1. Accounts receivable
(1). Disclosure by account age
"√ Applicable" "□ Not applicable"
Unit: Yuan Currency: RMB
Account age Carrying balance at the end of the period
Within 1 year
Including: Sub-item within 1 year
Sub-total within 1 year 181,133,866.23
1 to 2 years
2 to 3 years

Annual Report 2020
235 / 244
Above 3 years
3 to 4 years
4 to 5 years
Above 5 years
Less: Bad debt provisions -3,485,066.58
Total 177,648,799.65
(2). Disclosure by accruing method for bad debt provisions
"√ Applicable" "□ Not applicable"
Unit: Yuan Currency: RMB
Category
Closing balance Opening balance
Carrying balance Bad debt provisions
Carrying
value
Carrying balance Bad debt provisions
Carrying
value Amount
Percentage
(%) Amount
Accruing
percentage
(%)
Amount Percentage
(%) Amount
Accruing
percentage
(%)
Bad debt provisions
accrued
separately
Including:
Bad debt
provisions
accrued
according to the combination
181,133,866.23 100.00 3,485,066.58 1.92 177,648,799.65 83,763,307.23 100.00 814,082.58 0.97 82,949,224.65
Including:
Combination 1:
Account age 69,701,331.66 38.48 3,485,066.58 5.00 66,216,265.08 16,281,651.67 19.44 814,082.58 5.00 15,467,569.09
Combination III: Related parties in
the scope of the
consolidated financial
statements
111,432,534.57 61.52 111,432,534.57 67,481,655.56 80.56 67,481,655.56
Total 181,133,866.23 / 3,485,066.58 / 177,648,799.65 83,763,307.23 / 814,082.58 / 82,949,224.65
Bad debt provisions accrued separately:
"□ Applicable" "√ Not applicable"
Bad debt provisions accrued according to the combination:
"□ Applicable" "√ Not applicable"
If bad debt provisions are accrued according to the general model of expected credit losses, please refer
to the disclosure on other receivables:
"□ Applicable" "√ Not applicable"
(3). Particulars on bad debt provisions
"√ Applicable" "□ Not applicable"
Unit: Yuan Currency: RMB
Category Opening
balance
Change of the current period Closing
balance Accrued Recovered
or reversed
Resold or
written-off
Other
changes
Combination
1: Account
age
814,082.58 2,670,984.00
3,485,066.58
Total 814,082.58 2,670,984.00 3,485,066.58
Significant bad debt provision amounts recovered or reversed in the current period:
"□ Applicable" "√ Not applicable"
(4). Particulars on accounts receivable actually written-off in the current period
"□ Applicable" "√ Not applicable"
Writing-off of significant accounts receivable "□ Applicable" "√ Not applicable"
Annual Report 2020
236 / 244
(5). Particulars on top 5 accounts receivable in terms of the balance at the end of the period based
on debtors
"√ Applicable" "□ Not applicable"
Company name
Closing balance
Accounts receivable
Percentage (%) of the
total accounts
receivable
Bad debt provisions
First 80,989,689.63 44.71
Second 10,313,022.70 5.69
Third 10,203,557.98 5.63 510,177.90
Fourth 8,663,866.66 4.78
Fifth 5,050,958.23 2.79 252,547.91
Total 115,221,095.20 63.61 762,725.81
(6). Accounts receivable derecognized due to the transfer of financial assets
"□ Applicable" "√ Not applicable"
(7). Assets and liabilities formed due to the transfer and continuous involvement of accounts
receivable
"□ Applicable" "√ Not applicable"
Other descriptions:
"□ Applicable" "√ Not applicable"
2. Other receivables
Presented by item
"√ Applicable" "□ Not applicable"
Unit: Yuan Currency: RMB
Item Closing balance Opening balance
Interest receivable 35,000.00 192,500.00
Dividend receivable
Other receivables 399,643,347.22 284,844,294.54
Total 399,678,347.22 285,036,794.54
Other descriptions:
"□ Applicable" "√ Not applicable"
Interest receivable
(1). Classification of interest receivable
"√ Applicable" "□ Not applicable"
Unit: Yuan Currency: RMB
Item Closing balance Opening balance
Time deposits
Entrusted loans 35,000.00 192,500.00
Bond investment
Total 35,000.00 192,500.00
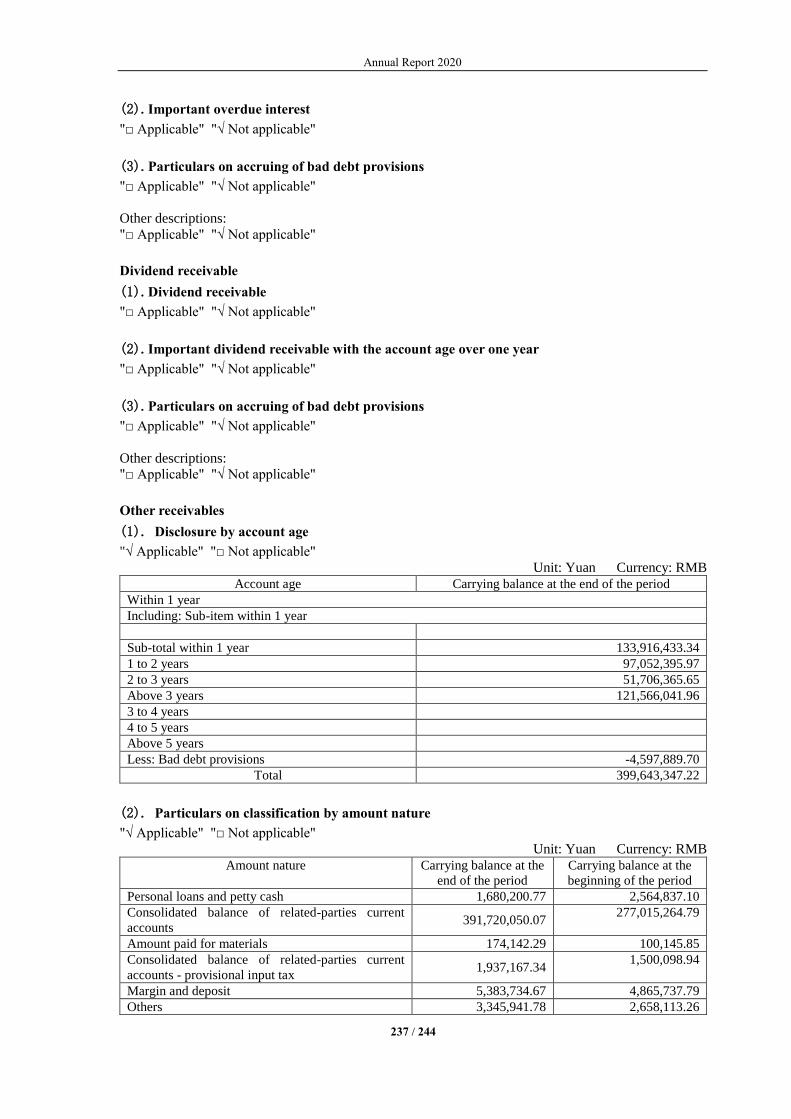
Annual Report 2020
237 / 244
(2). Important overdue interest
"□ Applicable" "√ Not applicable"
(3). Particulars on accruing of bad debt provisions
"□ Applicable" "√ Not applicable"
Other descriptions:
"□ Applicable" "√ Not applicable"
Dividend receivable
(1). Dividend receivable
"□ Applicable" "√ Not applicable"
(2). Important dividend receivable with the account age over one year
"□ Applicable" "√ Not applicable"
(3). Particulars on accruing of bad debt provisions
"□ Applicable" "√ Not applicable"
Other descriptions:
"□ Applicable" "√ Not applicable"
Other receivables
(1). Disclosure by account age
"√ Applicable" "□ Not applicable"
Unit: Yuan Currency: RMB
Account age Carrying balance at the end of the period
Within 1 year
Including: Sub-item within 1 year
Sub-total within 1 year 133,916,433.34
1 to 2 years 97,052,395.97
2 to 3 years 51,706,365.65
Above 3 years 121,566,041.96
3 to 4 years
4 to 5 years
Above 5 years
Less: Bad debt provisions -4,597,889.70
Total 399,643,347.22
(2). Particulars on classification by amount nature
"√ Applicable" "□ Not applicable"
Unit: Yuan Currency: RMB
Amount nature Carrying balance at the
end of the period
Carrying balance at the
beginning of the period
Personal loans and petty cash 1,680,200.77 2,564,837.10
Consolidated balance of related-parties current
accounts 391,720,050.07
277,015,264.79
Amount paid for materials 174,142.29 100,145.85
Consolidated balance of related-parties current
accounts - provisional input tax 1,937,167.34
1,500,098.94
Margin and deposit 5,383,734.67 4,865,737.79
Others 3,345,941.78 2,658,113.26

Annual Report 2020
238 / 244
Total 404,241,236.92 288,704,197.73
(3). Particulars on accruing of bad debt provisions
"√ Applicable" "□ Not applicable"
Unit: Yuan Currency: RMB
Bad debt provisions
Phase 1 Phase 2 Phase 3
Total Expected credit
losses in the
next 12 months
Expected credit loss
for the entire duration
(no credit impairment
occurred)
Expected credit loss
for the entire
duration (credit
impairment
occurred)
Balance as at 1
January 2020
3,859,903.19 3,859,903.19
Balance as at 1
January 2020 in the
current period
-- Transferred into
Phase 2
-- Transferred into
Phase 3
-- Reversed into
Phase 2
-- Reversed into
Phase 1
Accrued in the current
period 737,986.51
737,986.51
Reserved in the
current period
Resold in the current
period
Written-off in the
current period
Other changes
Balance as at 31
December 2020 4,597,889.70
4,597,889.70
Particulars on the significant changes in the carrying balance of other receivables in which changes in loss
provisions occurred in the current period:
"√ Applicable" "□ Not applicable"
Bad debt
provisions
Phase 1 Phase 2 Phase 3
Total Expected credit
losses in the next
12 months
Expected credit
loss for the entire
duration (no
credit impairment
occurred)
Expected credit loss
for the entire duration
(credit impairment
occurred)
Balance as at 1
January 2020 288,704,197.73 288,704,197.73
Balance as at 1
January 2020 in
the current period
-- Transferred into
Phase 2
-- Transferred into
Phase 3
-- Reversed into

Annual Report 2020
239 / 244
Phase 2
-- Reversed into
Phase 1
Increase of the
current period 278,377,461.18 278,377,461.18
Derecognition of
the current period 162,840,421.99 162,840,421.99
Other changes
Balance as at 31
December 2020 404,241,236.92 404,241,236.92
The basis for adopting the amount of bad debt provisions accrued for the current period and the
assessment on whether the credit risk of financial instruments increased significantly:
"□ Applicable" "√ Not applicable"
(4). Particulars on bad debt provisions
"√ Applicable" "□ Not applicable"
Unit: Yuan Currency: RMB
Category Opening
balance
Change of the current period Closing
balance Accrued Recovered
or reversed
Resold or
written-off
Other
changes
Combination
1: Account
age
3,859,903.19 737,986.51 4,597,889.70
Total 3,859,903.19 737,986.51 4,597,889.70
Significant bad debt provision amounts reversed or recovered in the current period:
"□ Applicable" "√ Not applicable"
(5). Particulars on other receivables actually written-off in the current period
"□ Applicable" "√ Not applicable"
(6). Particulars on top 5 other receivables in terms of the balance at the end of the period based
on debtors
"√ Applicable" "□ Not applicable"
Unit: Yuan Currency: RMB
Company
name Amount nature Closing balance Account age
Percentage
(%) in the
total balance
at the end of
the period of
other
receivables
Bad debt
provisions
Closing
balance
First Consolidated
balance of
related-parties
current accounts 187,488,553.15
Within 1 year:
RMB77,068,400
1-2 years:
RMB70,274,700
2-3 years:
RMB40,145,500
46.38
Second Consolidated
balance of
related-parties
current accounts 117,173,454.80
Within 1 year:
RMB1,843,400
1-2 years:
RMB3,264,100
Above 3 years:
RMB112,066,000
28.99

Annual Report 2020
240 / 244
Third Consolidated
balance of
related-parties
current accounts
56,998,819.58
Within 1 year:
RMB33,477,500
1-2 years:
RMB23,521,300
14.10
Fourth Consolidated
balance of
related-parties
current accounts
21,750,000.00
2-3 years:
RMB13,750,000
Above 3 years:
RMB8,000,000
5.38
Fifth Margin and
deposit 3,821,857.88
Above 3 years 0.95 3,821,857.88
Total / 387,232,685.41 / 95.80 3,821,857.88
(7). Receivables involving government subsidies
"□ Applicable" "√ Not applicable"
(8). Other receivables derecognized due to the transfer of financial assets
"□ Applicable" "√ Not applicable"
(9). Assets and liabilities formed due to the transfer and continuous involvement of other
receivables
"□ Applicable" "√ Not applicable"
Other descriptions:
"□ Applicable" "√ Not applicable"
3. Long-term equity investments
"√ Applicable" "□ Not applicable"
Unit: Yuan Currency: RMB
Item
Closing balance Opening balance
Carrying
balance
Impairment
provisions
Carrying
value
Carrying
balance
Impairment
provisions
Carrying
value
Investment to
subsidiaries 1,063,812,641.33 1,063,812,641.33 1,053,585,409.09
1,053,585,409.09
Investments
to associates
and joint
ventures
34,722,395.67 34,722,395.67 35,582,783.47
35,582,783.47
Total 1,098,535,037.00 1,098,535,037.00 1,089,168,192.56 1,089,168,192.56
(1). Investment to subsidiaries
"√ Applicable" "□ Not applicable"
Unit: Yuan Currency: RMB
Invested
company
Opening
balance
Increase of
the current
period
Decrease
of the
current
period
Closing
balance
Impairment
provisions
accrued in
the current
period
Balance of
impairment
provisions
at the end
of the
period Shanghai M&G
Colipu Office
Supplies Co., Ltd.
490,000,000.00 10,227,232.24 500,227,232.24
Shanghai M&G
Zhenmei Stationery
Co., Ltd.(上海晨13,288,599.09 13,288,599.09
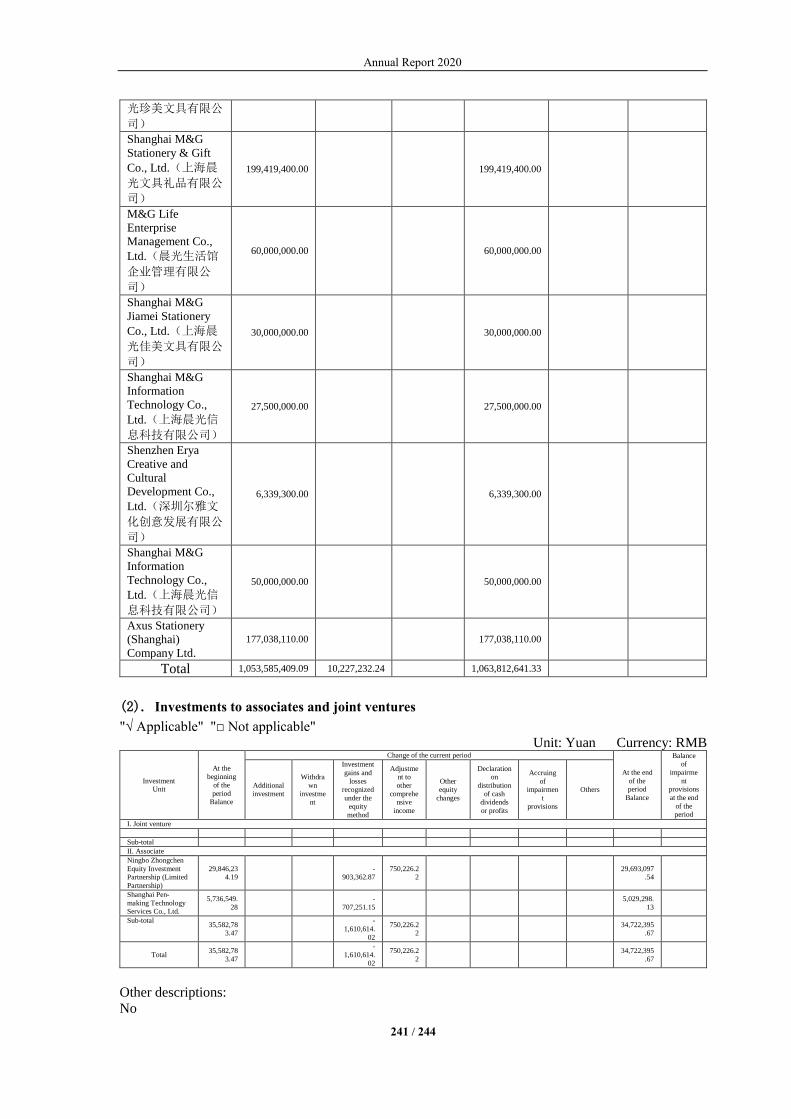
Annual Report 2020
241 / 244
光珍美文具有限公
司)
Shanghai M&G
Stationery & Gift
Co., Ltd.(上海晨
光文具礼品有限公
司)
199,419,400.00 199,419,400.00
M&G Life
Enterprise
Management Co.,
Ltd.(晨光生活馆
企业管理有限公
司)
60,000,000.00 60,000,000.00
Shanghai M&G
Jiamei Stationery
Co., Ltd.(上海晨
光佳美文具有限公
司)
30,000,000.00 30,000,000.00
Shanghai M&G
Information
Technology Co.,
Ltd.(上海晨光信
息科技有限公司)
27,500,000.00 27,500,000.00
Shenzhen Erya
Creative and
Cultural
Development Co.,
Ltd.(深圳尔雅文
化创意发展有限公
司)
6,339,300.00 6,339,300.00
Shanghai M&G
Information
Technology Co.,
Ltd.(上海晨光信
息科技有限公司)
50,000,000.00 50,000,000.00
Axus Stationery
(Shanghai)
Company Ltd.
177,038,110.00 177,038,110.00
Total 1,053,585,409.09 10,227,232.24 1,063,812,641.33
(2). Investments to associates and joint ventures
"√ Applicable" "□ Not applicable"
Unit: Yuan Currency: RMB
Investment Unit
At the beginning
of the
period Balance
Change of the current period
At the end
of the period
Balance
Balance of
impairme
nt provisions
at the end
of the period
Additional
investment
Withdra
wn
investment
Investment
gains and
losses recognized
under the
equity
method
Adjustment to
other
comprehensive
income
Other equity
changes
Declaration on
distribution
of cash dividends
or profits
Accruing
of impairmen
t
provisions
Others
I. Joint venture
Sub-total
II. Associate
Ningbo Zhongchen
Equity Investment Partnership (Limited
Partnership)
29,846,234.19
-
903,362.87 750,226.2
2
29,693,097.54
Shanghai Pen-
making Technology Services Co., Ltd.
5,736,549.
28
-
707,251.15
5,029,298.
13
Sub-total 35,582,78
3.47
-
1,610,614.
02
750,226.22
34,722,395
.67
Total 35,582,78
3.47
-
1,610,614.
02
750,226.2
2
34,722,395
.67
Other descriptions:
No

Annual Report 2020
242 / 244
4. Revenue and operating costs
(1). Revenue and operating costs
"√ Applicable" "□ Not applicable"
Unit: Yuan Currency: RMB
Item Amount accounted for in the current period
Amount accounted for in the previous
period
Revenue Costs Revenue Costs
Main
operations 4,130,671,233.32 2,164,311,904.18 3,888,768,953.18
2,183,782,074.37
Other
operations 65,240,228.87 45,222,989.96
Total 4,195,911,462.19 2,164,311,904.18 3,933,991,943.14 2,183,782,074.37
(2). Particulars on revenue from contracts
"√ Applicable" "□ Not applicable"
Unit: Yuan Currency: RMB
Classification of contracts Total
Types of goods
1. Sales of goods 4,130,671,233.32
2. Others 59,678,695.90
Classification by operation territory
1. China 4,066,533,445.41
2. Other countries 123,816,483.81
Total 4,195,911,462.19
Description on revenue from contracts:
"□ Applicable" "√ Not applicable"
(3). Description on performance obligations
"□ Applicable" "√ Not applicable"
(4). Description on allocation to remaining performance obligations
"□ Applicable" "√ Not applicable"
Other descriptions:
Details on revenue:
Item Amount in the current period Amount in the last period
Description on revenue from customer
contracts
4,190,349,929.22 3,929,363,561.24
Rental income 5,561,532.97 4,628,381.90
Total 4,195,911,462.19 3,933,991,943.14
5. Investment income
"√ Applicable" "□ Not applicable"
Unit: Yuan Currency: RMB
Item
Amount accounted
for in the current
period
Amount
accounted for in
the previous
period
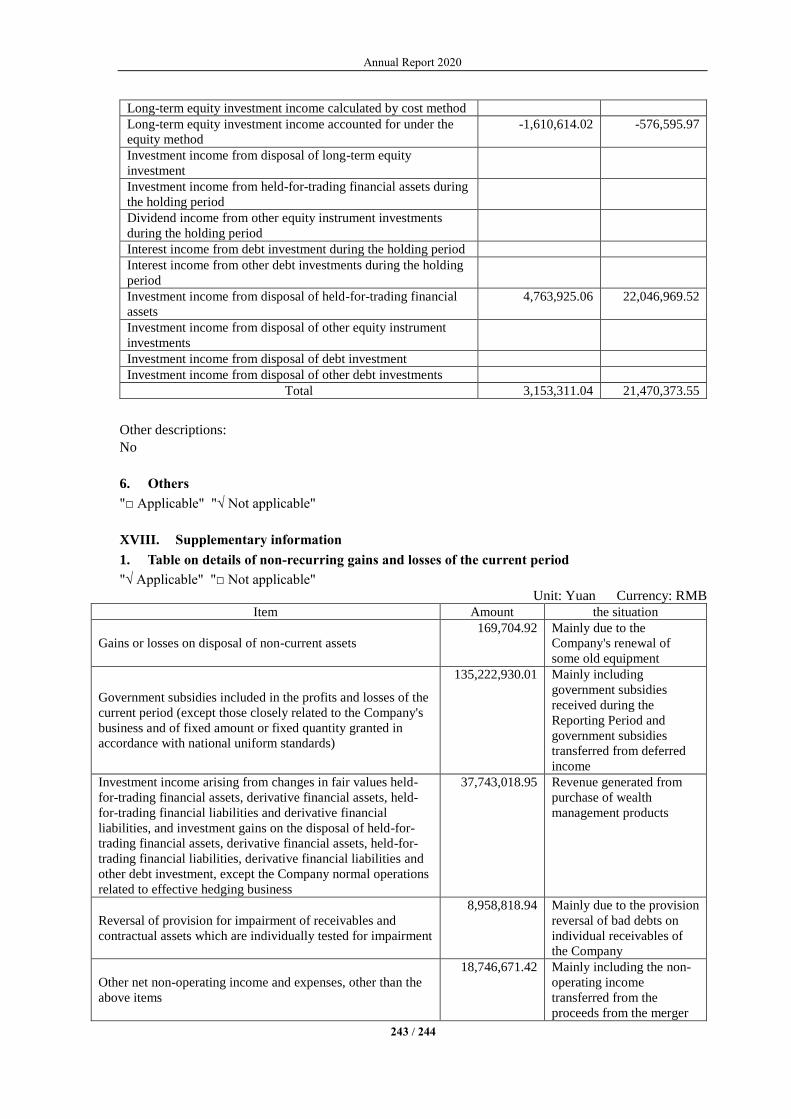
Annual Report 2020
243 / 244
Long-term equity investment income calculated by cost method
Long-term equity investment income accounted for under the
equity method
-1,610,614.02 -576,595.97
Investment income from disposal of long-term equity
investment
Investment income from held-for-trading financial assets during
the holding period
Dividend income from other equity instrument investments
during the holding period
Interest income from debt investment during the holding period
Interest income from other debt investments during the holding
period
Investment income from disposal of held-for-trading financial
assets
4,763,925.06 22,046,969.52
Investment income from disposal of other equity instrument
investments
Investment income from disposal of debt investment
Investment income from disposal of other debt investments
Total 3,153,311.04 21,470,373.55
Other descriptions:
No
6. Others
"□ Applicable" "√ Not applicable"
XVIII. Supplementary information
1. Table on details of non-recurring gains and losses of the current period
"√ Applicable" "□ Not applicable"
Unit: Yuan Currency: RMB
Item Amount the situation
Gains or losses on disposal of non-current assets
169,704.92 Mainly due to the
Company's renewal of
some old equipment
Government subsidies included in the profits and losses of the
current period (except those closely related to the Company's
business and of fixed amount or fixed quantity granted in
accordance with national uniform standards)
135,222,930.01 Mainly including
government subsidies
received during the
Reporting Period and
government subsidies
transferred from deferred
income
Investment income arising from changes in fair values held-
for-trading financial assets, derivative financial assets, held-
for-trading financial liabilities and derivative financial
liabilities, and investment gains on the disposal of held-for-
trading financial assets, derivative financial assets, held-for-
trading financial liabilities, derivative financial liabilities and
other debt investment, except the Company normal operations
related to effective hedging business
37,743,018.95 Revenue generated from
purchase of wealth
management products
Reversal of provision for impairment of receivables and
contractual assets which are individually tested for impairment
8,958,818.94 Mainly due to the provision
reversal of bad debts on
individual receivables of
the Company
Other net non-operating income and expenses, other than the
above items
18,746,671.42 Mainly including the non-
operating income
transferred from the
proceeds from the merger

Annual Report 2020
244 / 244
and acquisition of Office
Depot, and the expenditure
of charity donations.
Effect of income tax -29,169,213.11
Effect of minority equity -18,957,557.36
Total 152,714,373.77
For non-recurring profit and loss items defined by the Company according to the Explanatory
Announcement of Information Disclosure by Companies Offering Securities to the Public No. 1 - Non-
recurring Gains and Losses, and non-recurring profit and loss items listed in the Explanatory
Announcement of Information Disclosure by Companies Offering Securities to the Public No. 1 - Non-
recurring Gains and Losses defined as recurring profit and loss items,the reasons shall be explained.
"□ Applicable" "√ Not applicable"
2. Return on net assets and earnings per share
"√ Applicable" "□ Not applicable"
Profits during the Reporting Period
Weighted
average ROE
(%)
Earnings per share
Basic earnings per
share
Diluted earnings
per share
Net profit attributable to ordinary
shareholders of the Company
26.91 1.3558 1.3558
Net profit attributable to ordinary
shareholders of the Company after deducting
non-recurring gains and losses
23.63 1.1908 1.1908
3. Difference in the Accounting Information under the PRC Accounting Standards for Business
Enterprise (“PRC GAAP”) and Overseas Accounting Standards
"□ Applicable" "√ Not applicable"
4. Others
"□ Applicable" "√ Not applicable"
Chapter XII References
References Financial statements signed and sealed by the legal representative, the person in
charge of accounting work, and the person in charge of the accounting agency.
References Original of the auditor’s report with the seal of the accounting firm and the signature
and seal of the certified public accountant.
References Originals of all company documents and announcements publicly disclosed on the
designated information disclosure media by CSRC during the Reporting Period.
Chairman: Chen Huwen
Date of report and submission approved by the Board of Directors: 26 March 2021
Revision information "□ Applicable" "√ Not applicable"


