Shannon, Fall 2005 Becoming Lean: The “Adkins Diet” for Companies Presented By: Patrick Shannon, Professor Department of Networking, Operations and Information Systems College of Business and Economics
Transcript
Shannon, Fall 2005
Becoming Lean:
The “Adkins Diet” for Companies
Presented By:
Patrick Shannon, Professor
Department of Networking, Operations and Information Systems
College of Business and Economics
Shannon, Fall 2005
Today’s Outline Competitive Challenges Putting Companies on a Lean Diet
The Lean Tools Get on the Scale! – the Need to
Measure Some Examples and Results
Shannon, Fall 2005
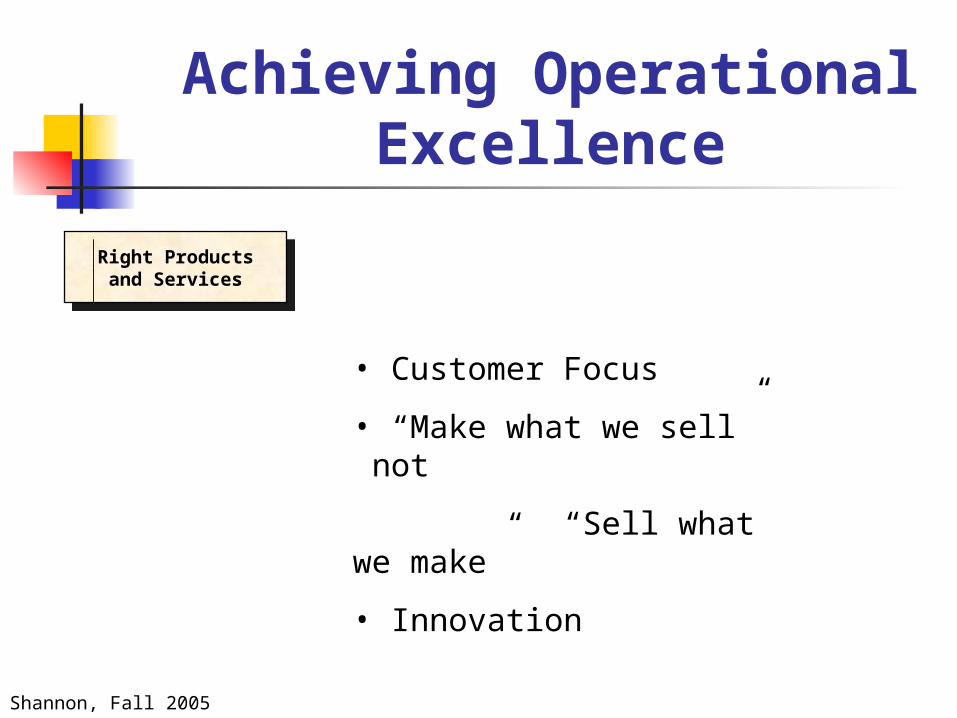
Achieving Operational Excellence
Right Productsand Services
Right Productsand Services
• Customer Focus
• “Make what we sell” not
“Sell what we make”
• Innovation
Shannon, Fall 2005
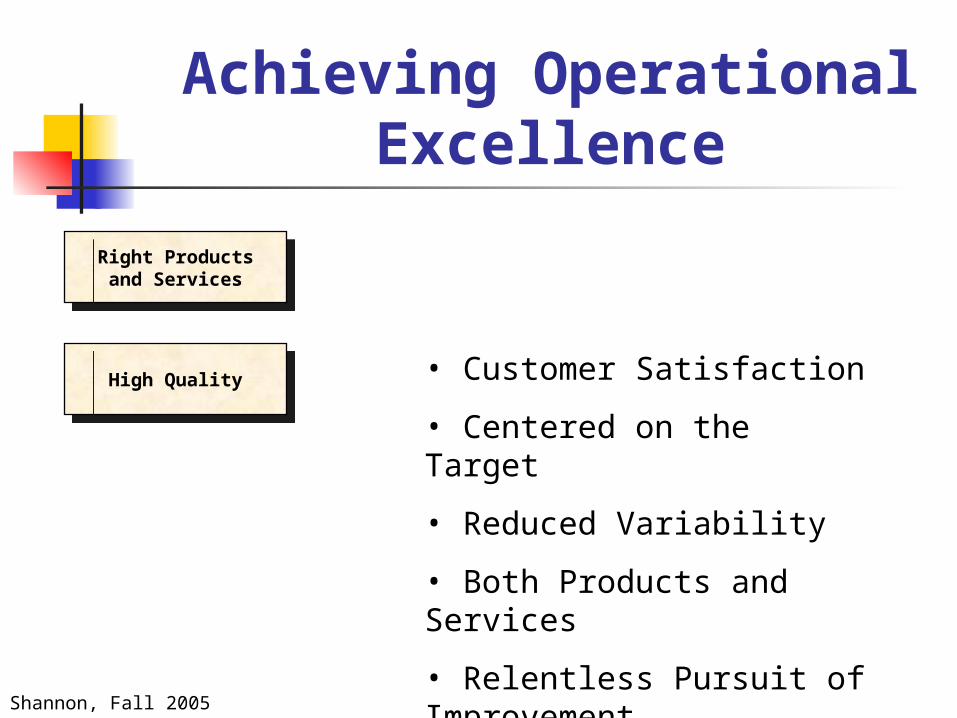
Achieving Operational Excellence
Right Productsand Services
Right Productsand Services
High QualityHigh Quality • Customer Satisfaction
• Centered on the Target
• Reduced Variability
• Both Products and Services
• Relentless Pursuit of Improvement
Shannon, Fall 2005
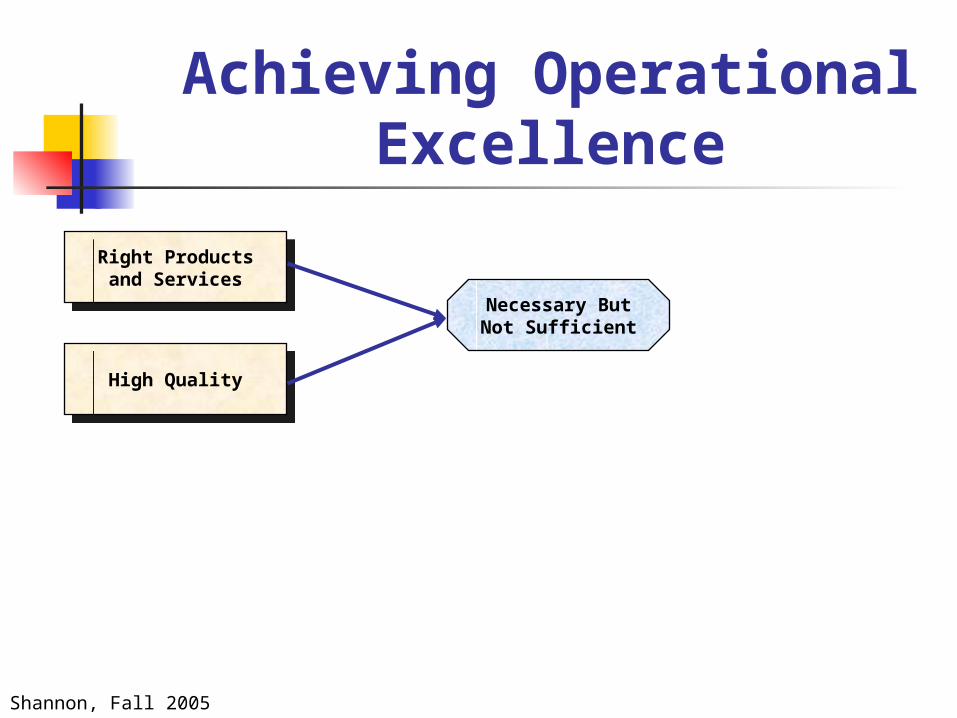
Achieving Operational Excellence
Right Productsand Services
Right Productsand Services
High QualityHigh Quality
Necessary ButNot Sufficient
Shannon, Fall 2005
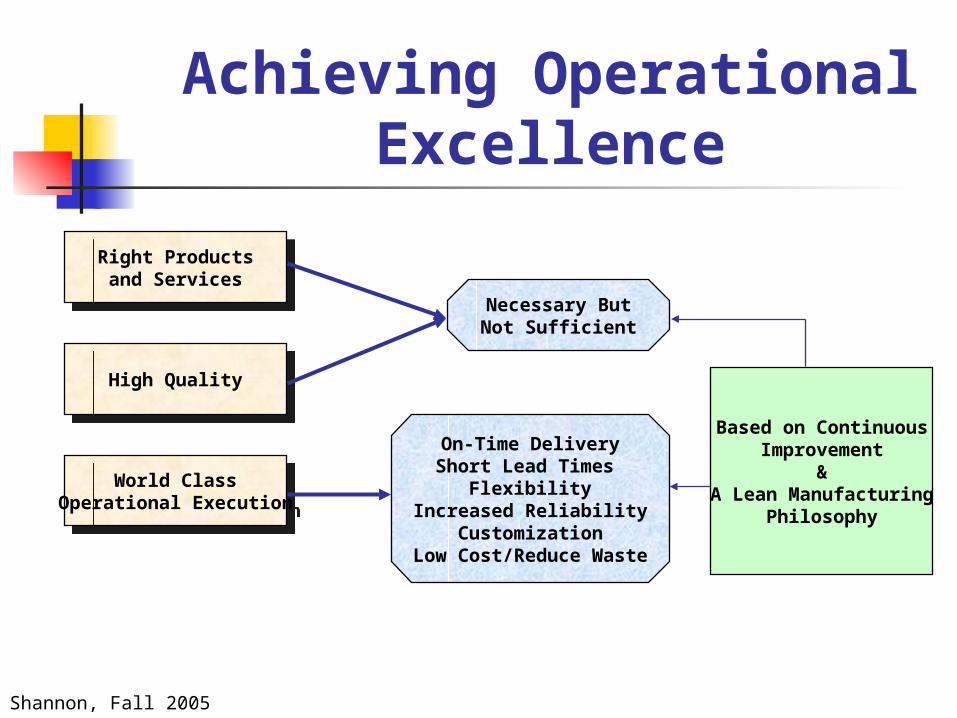
Achieving Operational Excellence
Right Productsand Services
Right Productsand Services
High QualityHigh Quality
Necessary ButNot Sufficient
World ClassOperational Execution
World ClassOperational Execution
On-Time DeliveryShort Lead Times
FlexibilityIncreased Reliability
CustomizationLow Cost/Reduce Waste
Based on ContinuousImprovement
&A Lean Manufacturing
Philosophy
Shannon, Fall 2005
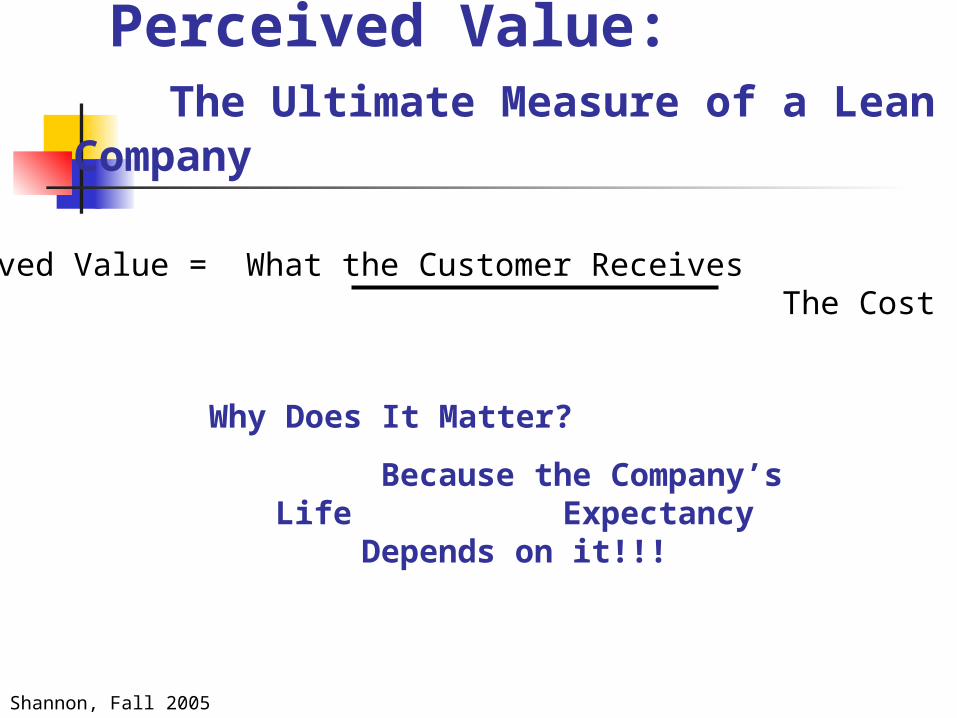
Perceived Value: The Ultimate Measure of a Lean
Company
Perceived Value = What the Customer Receives The Cost
Why Does It Matter?
Because the Company’s Life Expectancy Depends
on it!!!
Shannon, Fall 2005
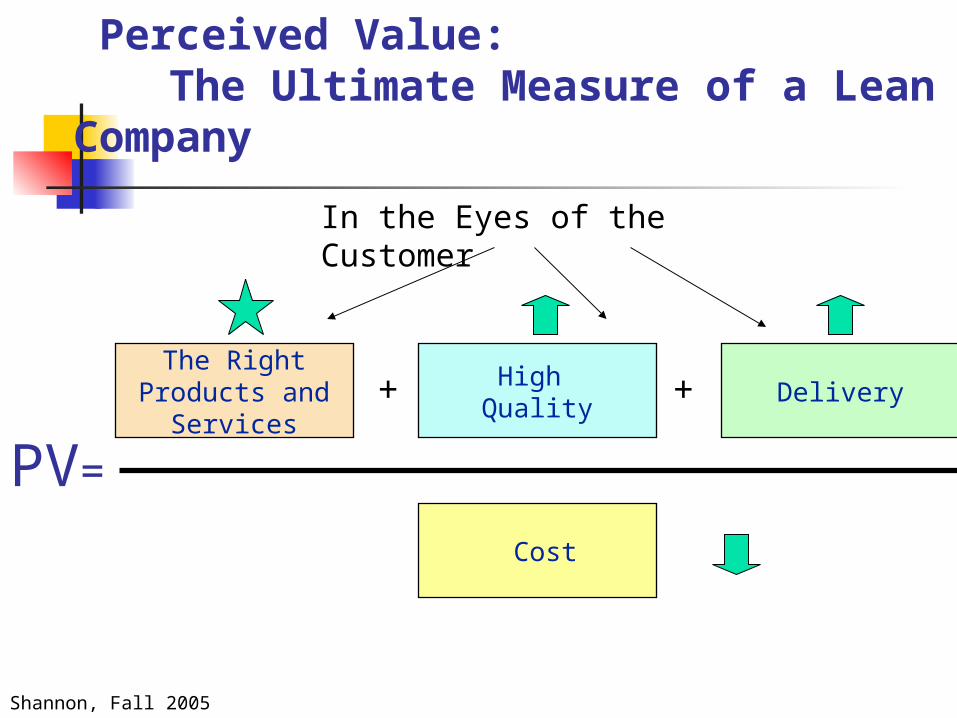
Perceived Value: The Ultimate Measure of a Lean
Company
The RightProducts and
Services
High Quality
+ Delivery+
Cost
PV=
In the Eyes of the Customer
Shannon, Fall 2005
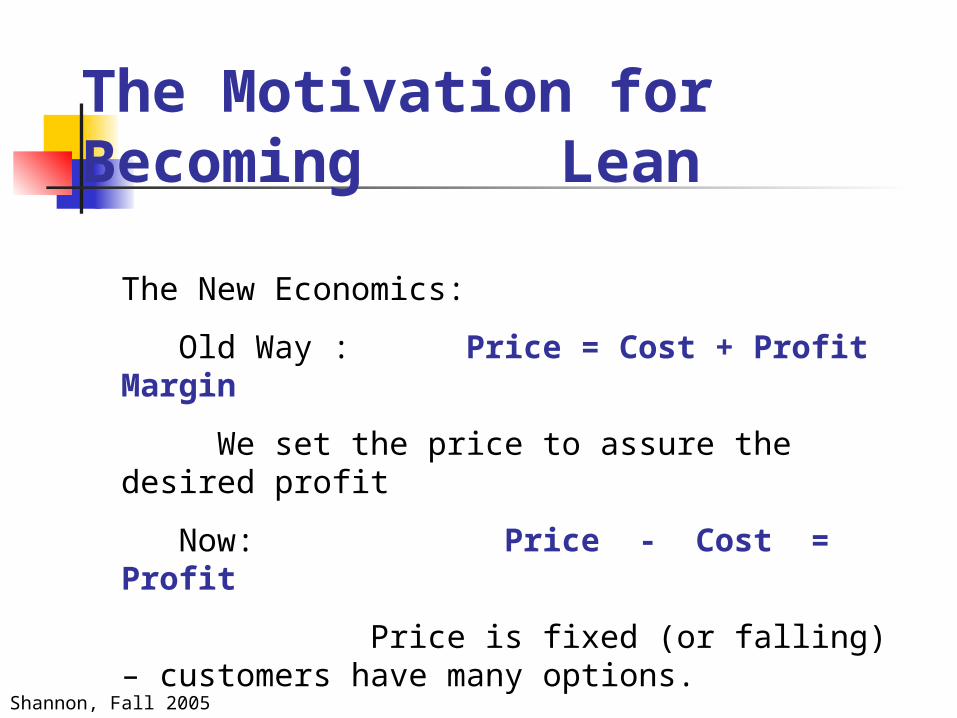
The Motivation for Becoming Lean
The New Economics:
Old Way : Price = Cost + Profit Margin
We set the price to assure the desired profit
Now: Price - Cost = Profit
Price is fixed (or falling) – customers have many options.
How do we make a profit?
Shannon, Fall 2005
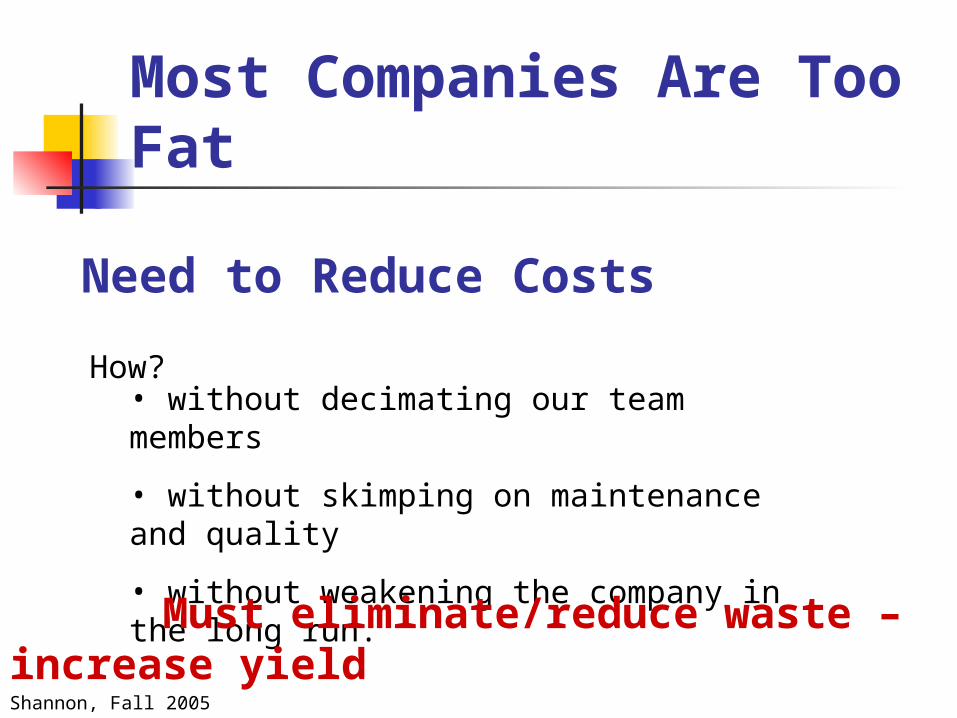
Most Companies Are Too Fat
Need to Reduce Costs
• without decimating our team members
• without skimping on maintenance and quality
• without weakening the company in the long run.
How?
Must eliminate/reduce waste – increase yield
Shannon, Fall 2005
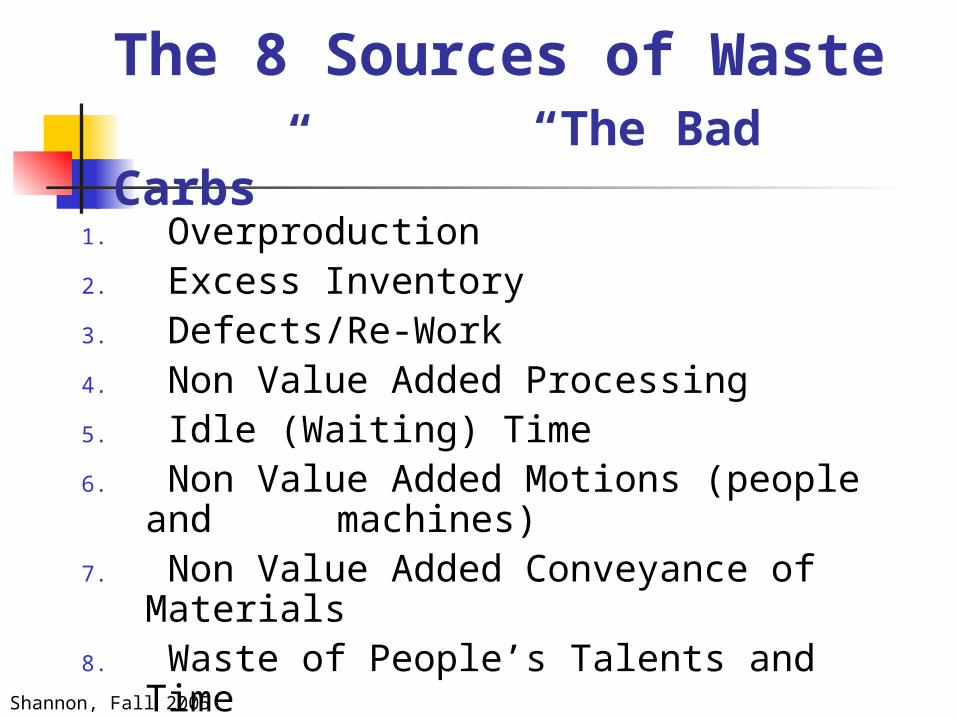
The 8 Sources of Waste “The Bad Carbs”
1. Overproduction2. Excess Inventory3. Defects/Re-Work4. Non Value Added Processing5. Idle (Waiting) Time6. Non Value Added Motions (people and
machines)7. Non Value Added Conveyance of Materials8. Waste of People’s Talents and Time
Shannon, Fall 2005
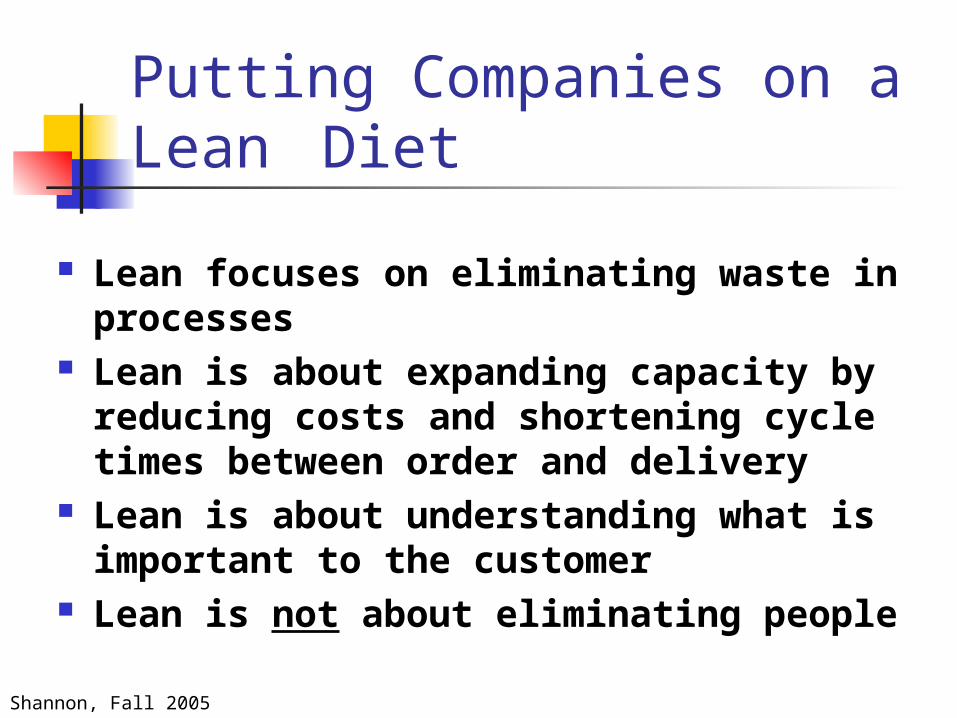
Putting Companies on a Lean Diet
Lean focuses on eliminating waste in processes Lean is about expanding capacity by reducing
costs and shortening cycle times between order and delivery
Lean is about understanding what is important to the customer
Lean is not about eliminating people
Shannon, Fall 2005
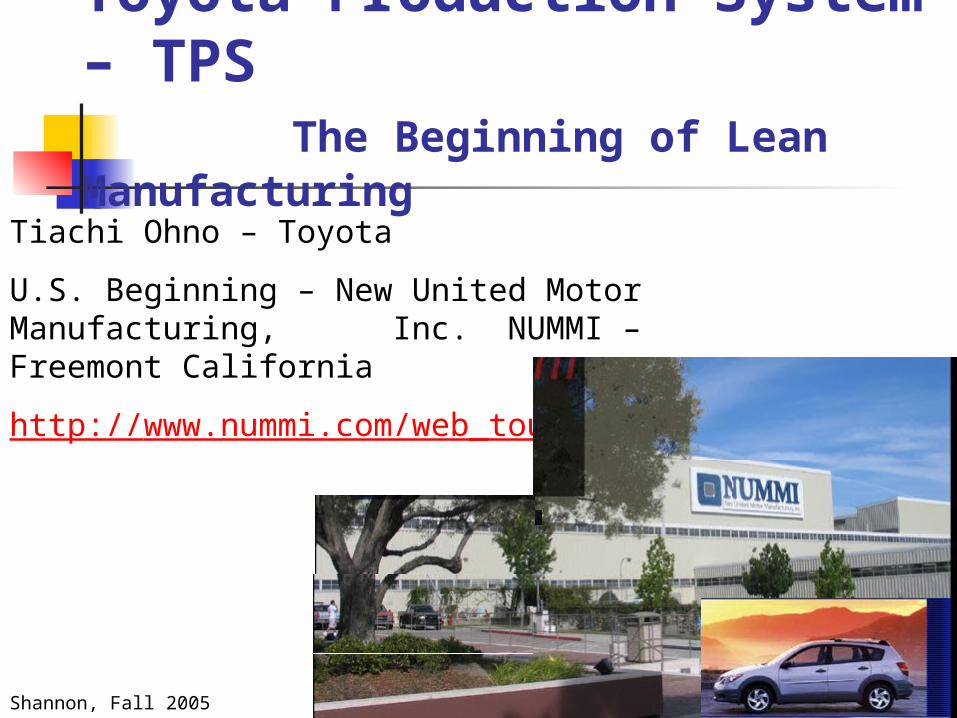
Toyota Production System – TPS The Beginning of Lean Manufacturing
Tiachi Ohno – Toyota
U.S. Beginning – New United Motor Manufacturing, Inc. NUMMI – Freemont California
http://www.nummi.com/web_tour.html
Shannon, Fall 2005
Shannon, Fall 2005
e
Shannon, Fall 2005
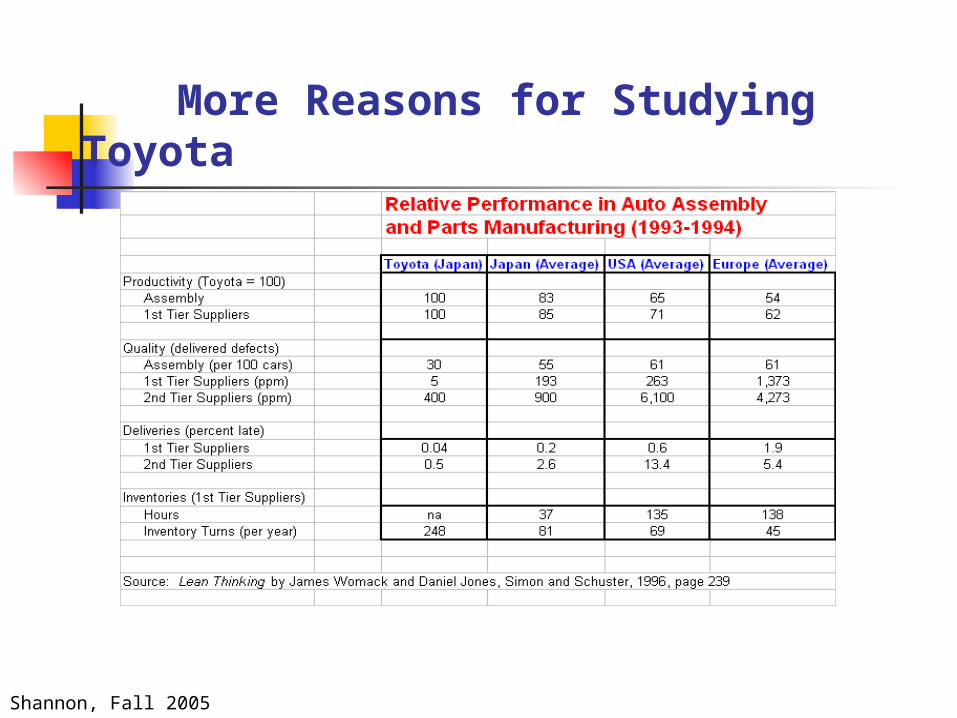
More Reasons for Studying Toyota
Shannon, Fall 2005
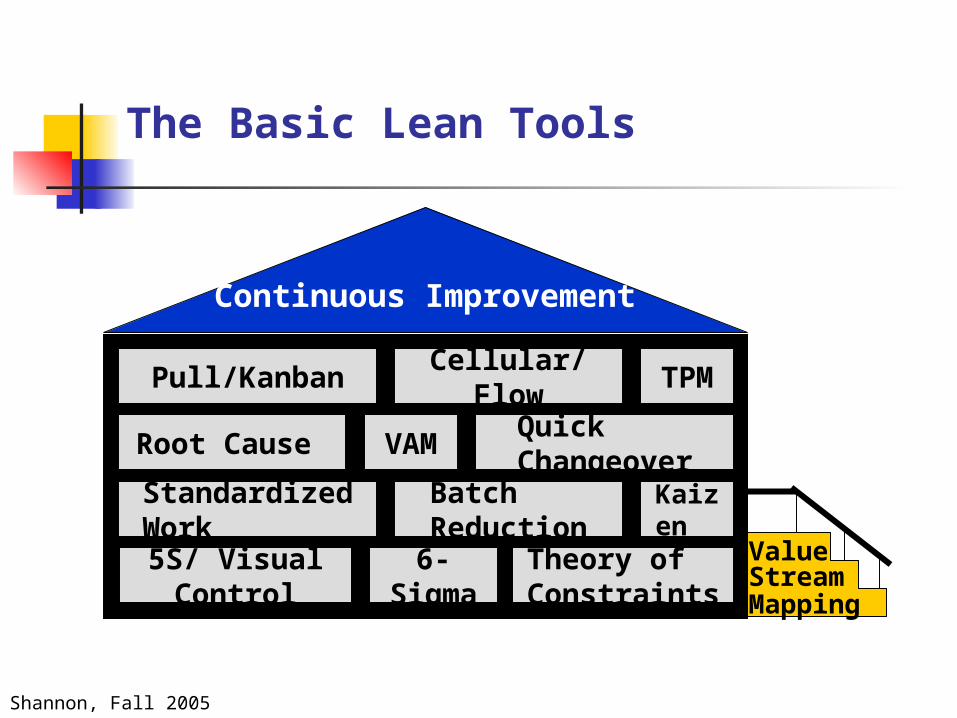
The Basic Lean Tools
Quick Changeover
Standardized Work
Batch Reduction
Kaizen
Root Cause
5S/ Visual Control
6-Sigma
Theory of Constraints
VAM
Cellular/Flow
Pull/Kanban TPM
ValueStreamMapping
Continuous Improvement
Shannon, Fall 2005
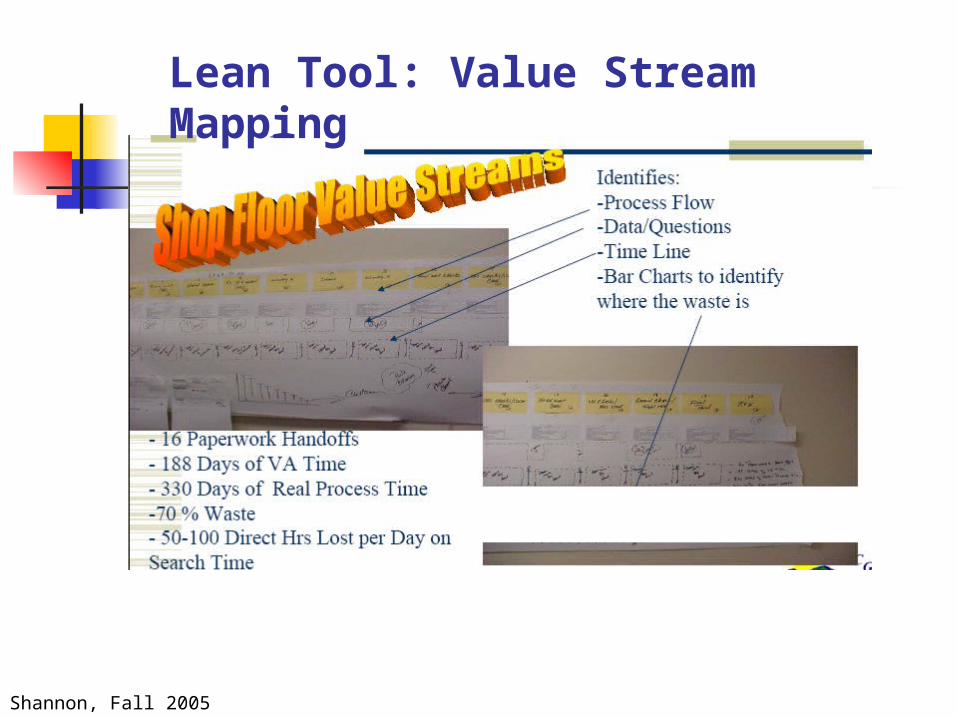
Lean Tool: Value Stream Mapping
Shannon, Fall 2005
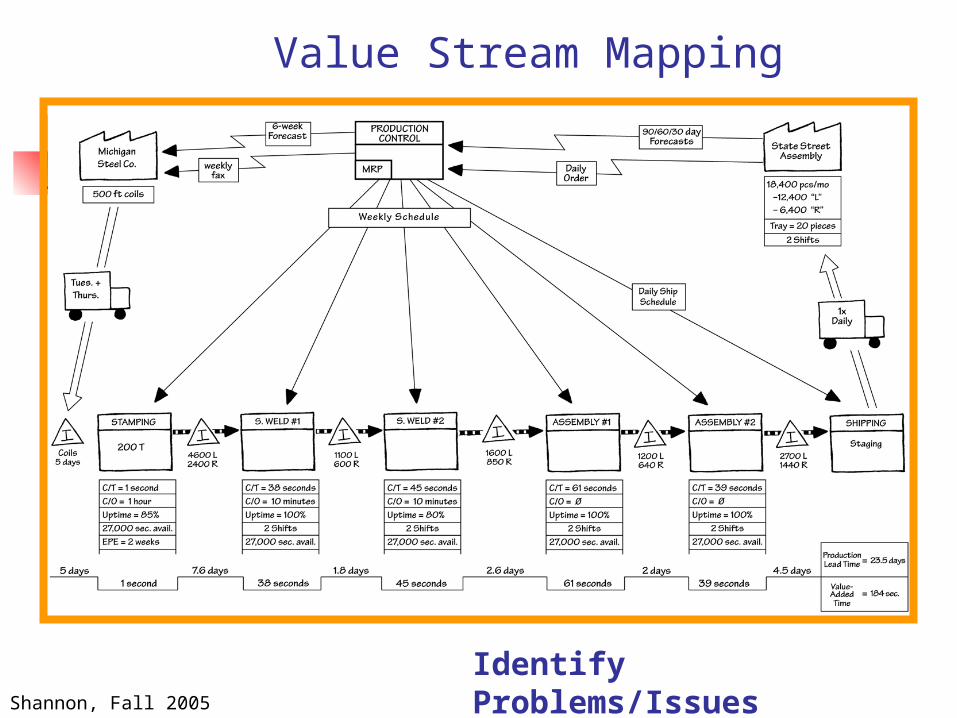
Value Stream Mapping
Identify Problems/Issues
Shannon, Fall 2005
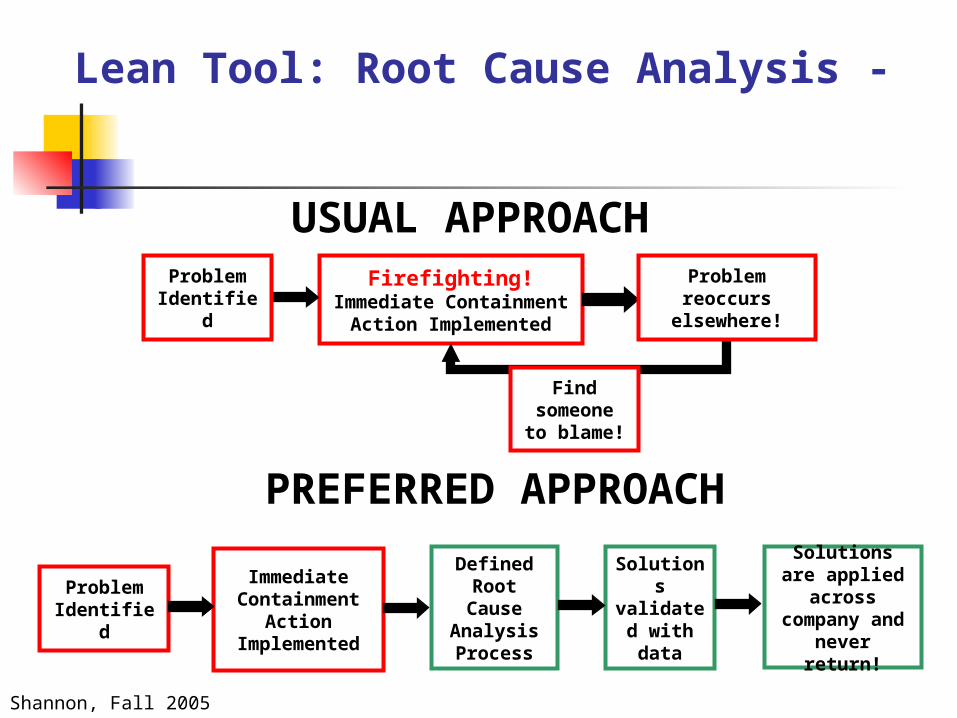
Lean Tool: Root Cause Analysis -
Firefighting!Immediate Containment
Action Implemented
Problem Identified
Immediate Containment
Action Implemented
Defined Root Cause
Analysis Process
Solutions validated with data
Solutions are applied across company and never return!
USUAL APPROACH
PREFERRED APPROACH
Problem Identified
Problem reoccurs
elsewhere!
Find someone to
blame!
Shannon, Fall 2005
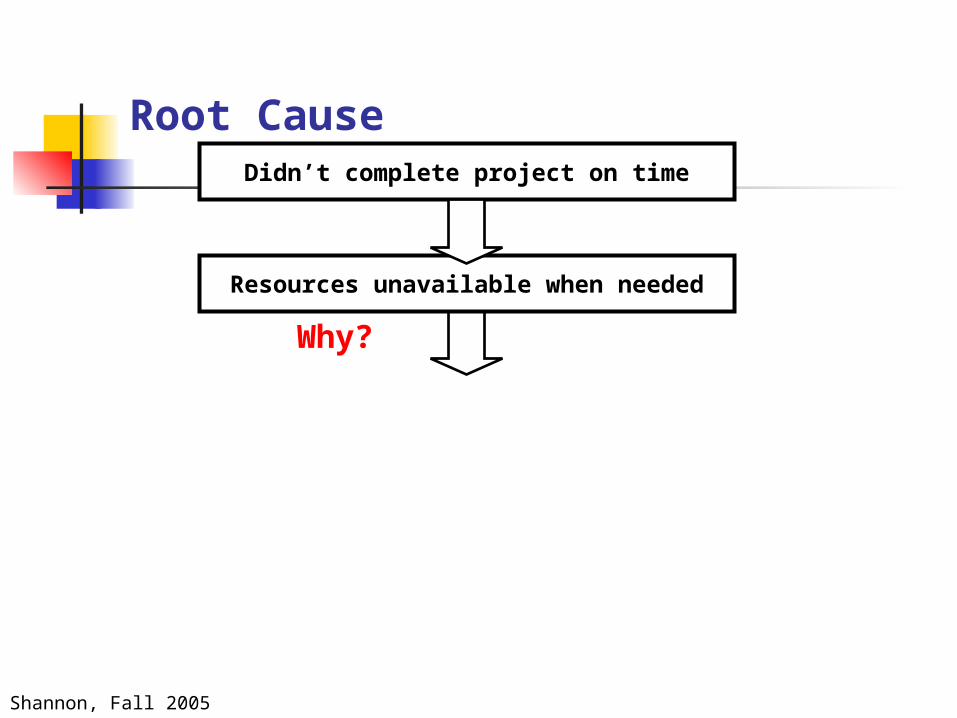
Root Cause Example
Identify Problem
Project Is behind Schedule – Won’t Finish on Time
Shannon, Fall 2005
Immediate Action
Additional resources applied to help get the project team back on schedule
No new projects started until Root Cause Analysis completed
Shannon, Fall 2005
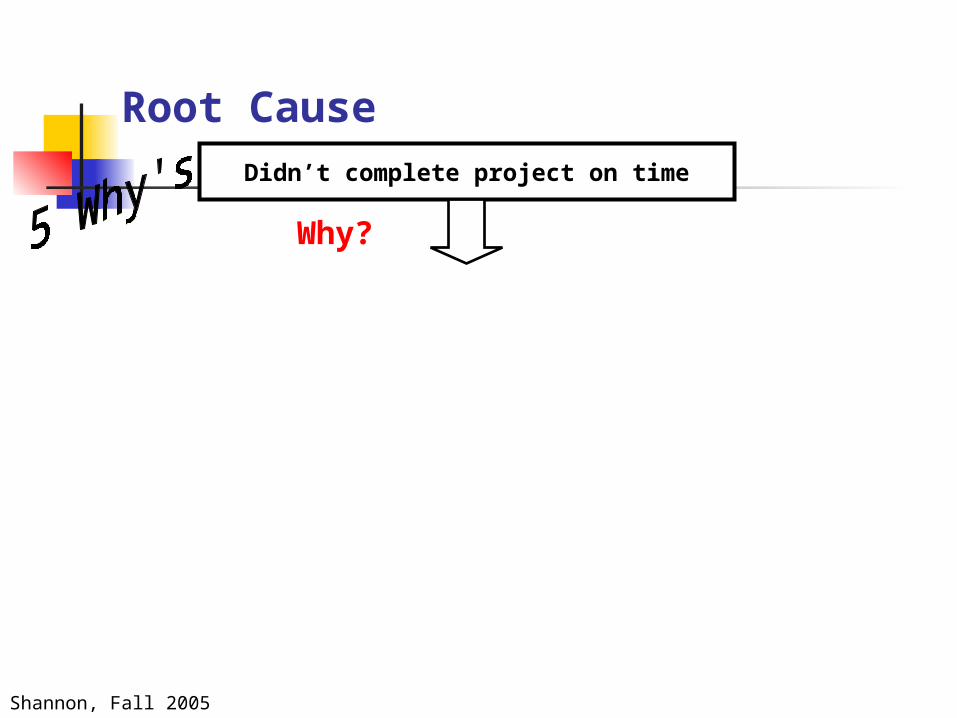
Root CauseDidn’t complete project on time
Why?
Shannon, Fall 2005
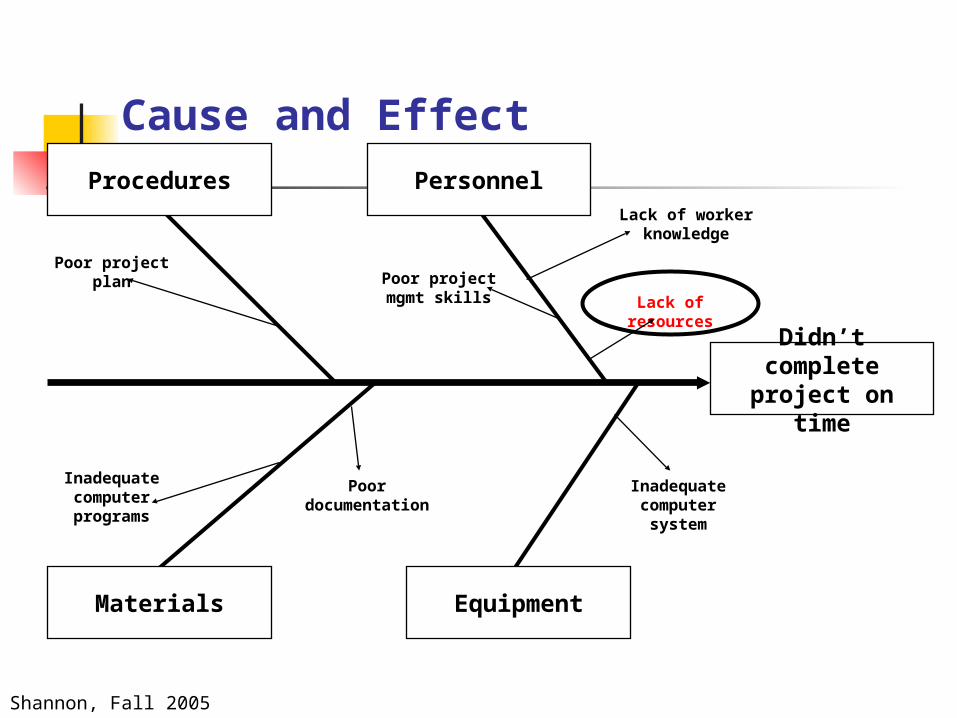
Cause and Effect Diagram
Didn’t complete project on time
EquipmentMaterials
PersonnelProceduresLack of worker
knowledge
Poor project mgmt skills
Poor project plan
Inadequate computer programs
Inadequate computer system
Poor documentation
Lack of resources
Shannon, Fall 2005
Cause and Effect
Didn’t complete project on time
EquipmentMaterials
PersonnelProceduresLack of worker
knowledge
Poor project mgmt skills
Poor project plan
Inadequate computer programs
Inadequate computer system
Poor documentation
Lack of resources
Shannon, Fall 2005
Root CauseDidn’t complete project on time
Resources unavailable when needed
Why?
Shannon, Fall 2005
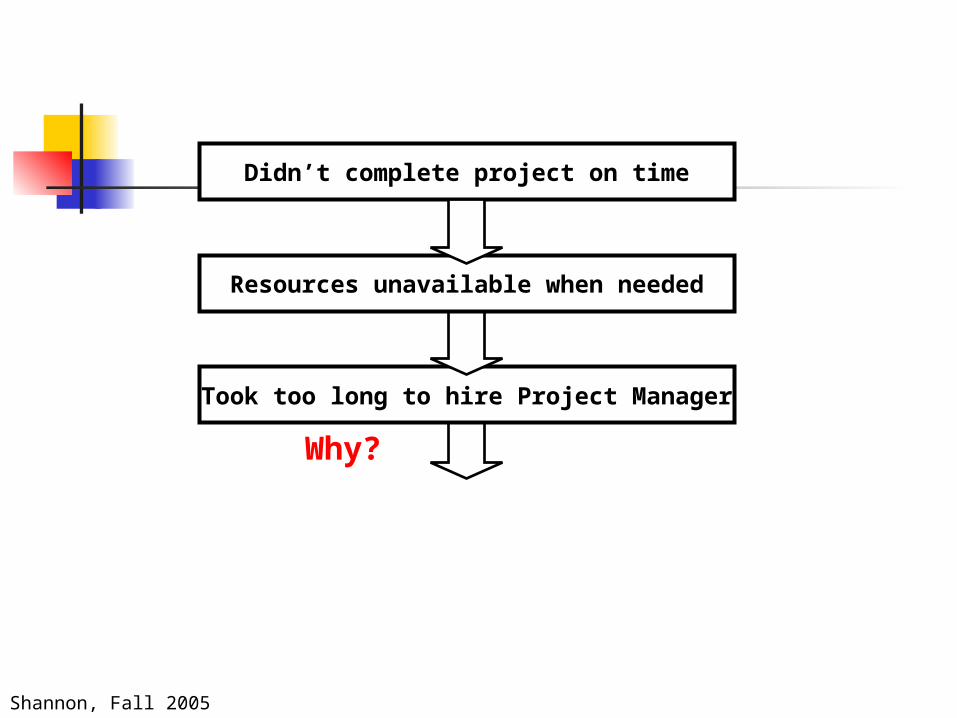
Took too long to hire Project Manager
Didn’t complete project on time
Resources unavailable when needed
Why?
Shannon, Fall 2005
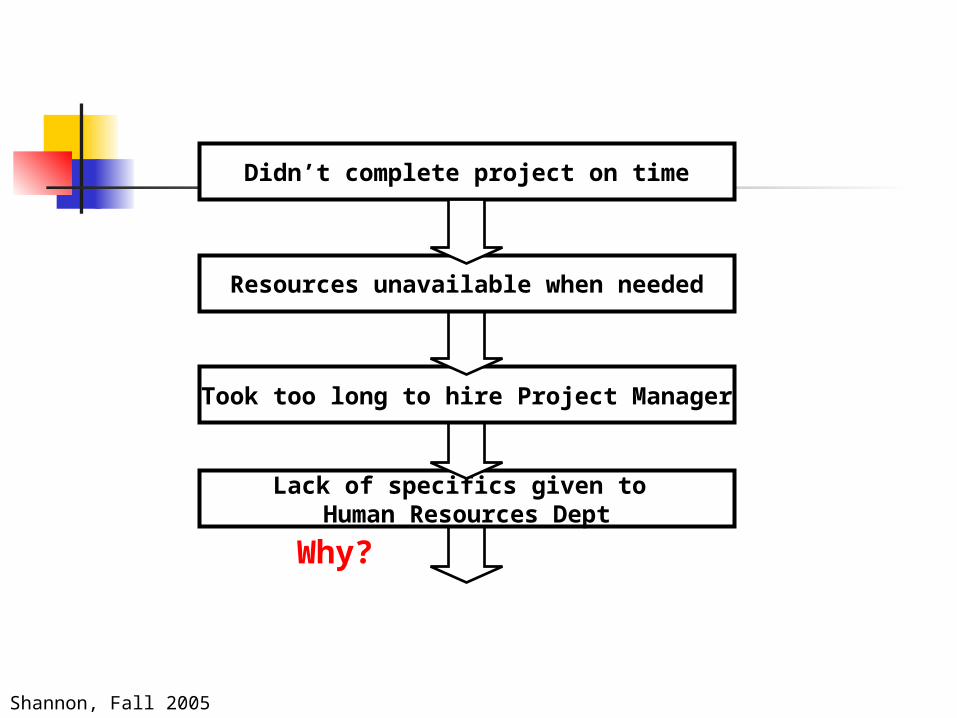
Lack of specifics given to Human Resources Dept
Took too long to hire Project Manager
Didn’t complete project on time
Resources unavailable when needed
Why?
Shannon, Fall 2005
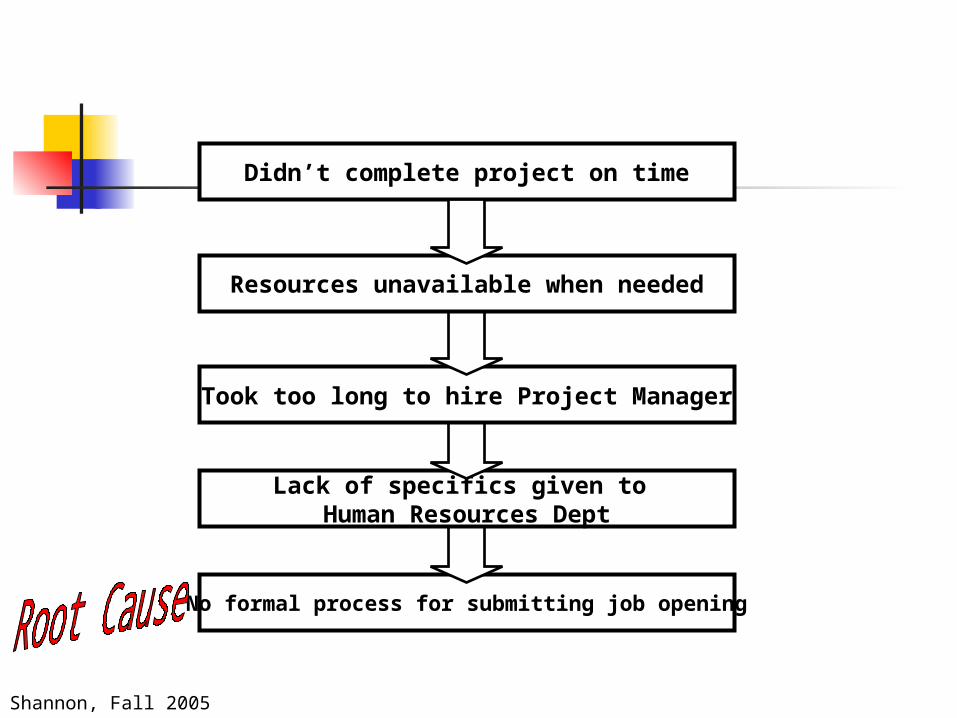
No formal process for submitting job opening
Lack of specifics given to Human Resources Dept
Took too long to hire Project Manager
Didn’t complete project on time
Resources unavailable when needed
Shannon, Fall 2005
Corrective Action
Permanent – Hired another project manager to meet needs of next project team
Preventive - Developed checklist form with HR for submitting job openings in the future
Shannon, Fall 2005
Lean Tool: 5S
Sort Straighten Shine Standardize Sustain
Shannon, Fall 2005
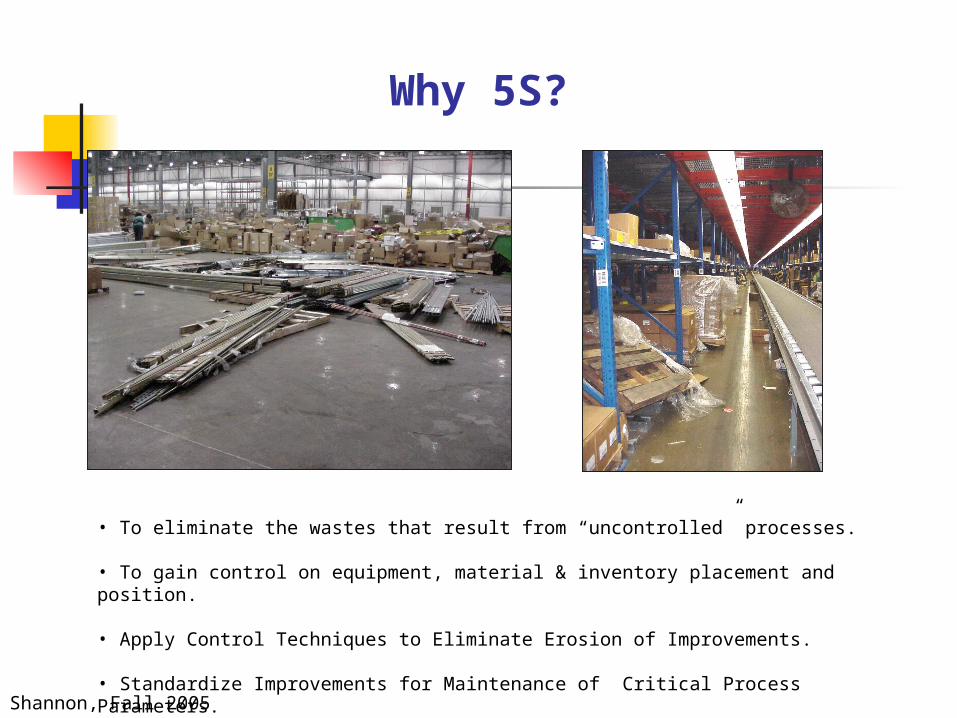
Why 5S?
• To eliminate the wastes that result from “uncontrolled” processes.
• To gain control on equipment, material & inventory placement and position.
• Apply Control Techniques to Eliminate Erosion of Improvements.
• Standardize Improvements for Maintenance of Critical Process Parameters.
Shannon, Fall 2005
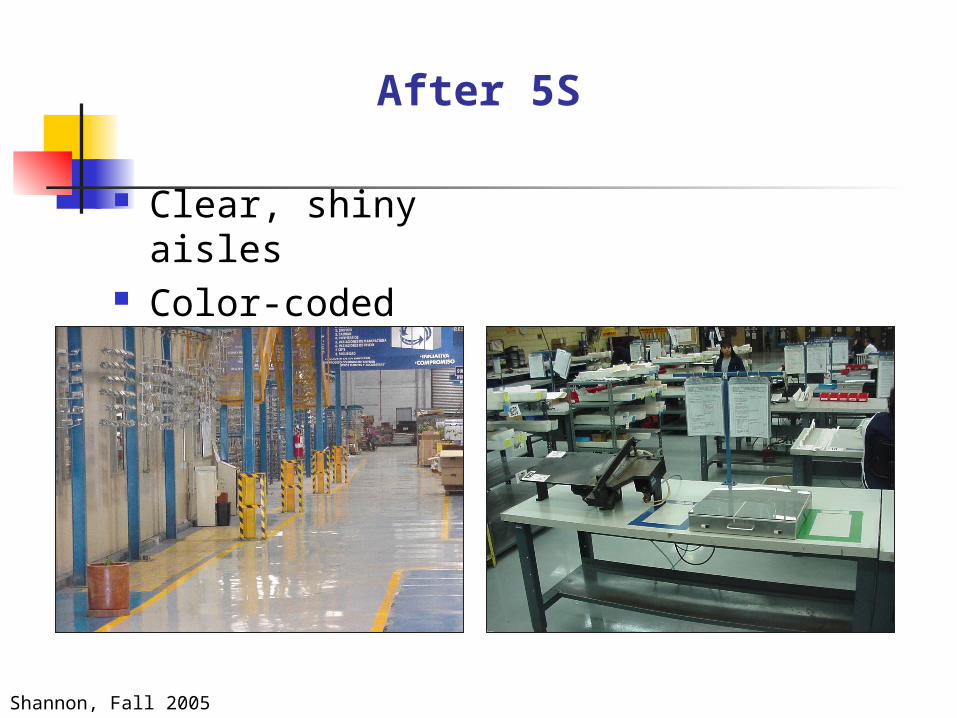
After 5S
Clear, shiny aisles Color-coded areas Slogans & banners No work in process
Shannon, Fall 2005
Lean Tool: Poka yoke
Mistake-proofing systems
Does not rely on operators catching mistakes
Inexpensive Point of Origin inspection
Quick feedback 100% of the time
“Be more careful” is not effective
Shannon, Fall 2005
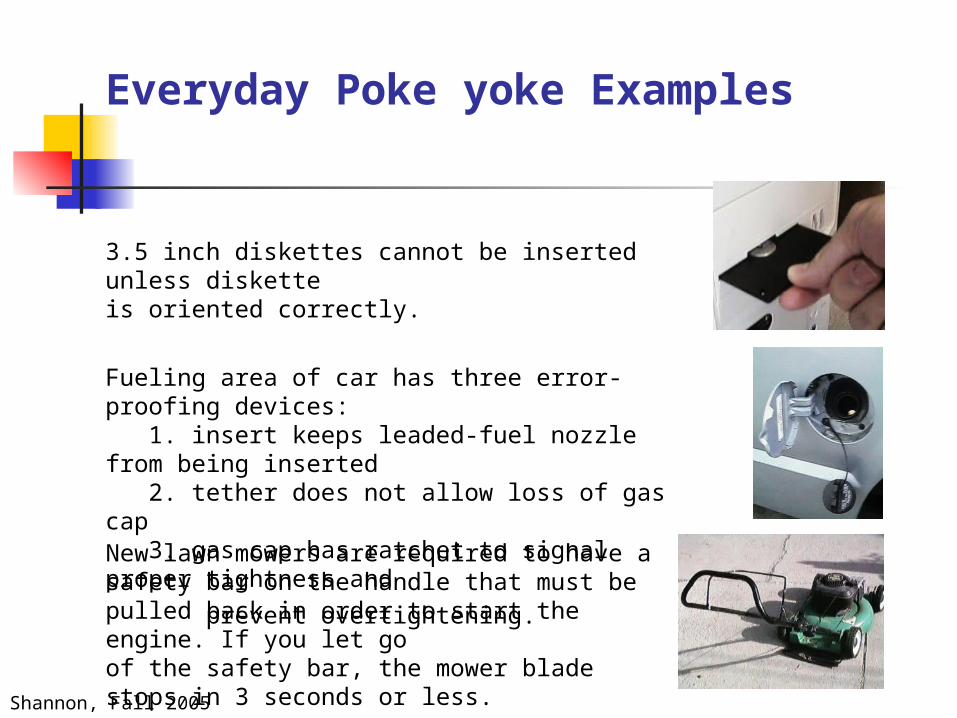
Everyday Poke yoke Examples
New lawn mowers are required to have a safety bar on the handle that must be pulled back in order to start the engine. If you let goof the safety bar, the mower blade stops in 3 seconds or less.
Fueling area of car has three error-proofing devices: 1. insert keeps leaded-fuel nozzle from being inserted 2. tether does not allow loss of gas cap 3. gas cap has ratchet to signal proper tightness and
prevent overtightening.
3.5 inch diskettes cannot be inserted unless diskette is oriented correctly.
Shannon, Fall 2005
3 Rules of POKA YOKE
Don’t wait for the perfect POKA YOKE. Do it now!
If your POKA YOKE idea has better than 50% chance to succeed…Do it!
Do it now….improve later!
Shannon, Fall 2005
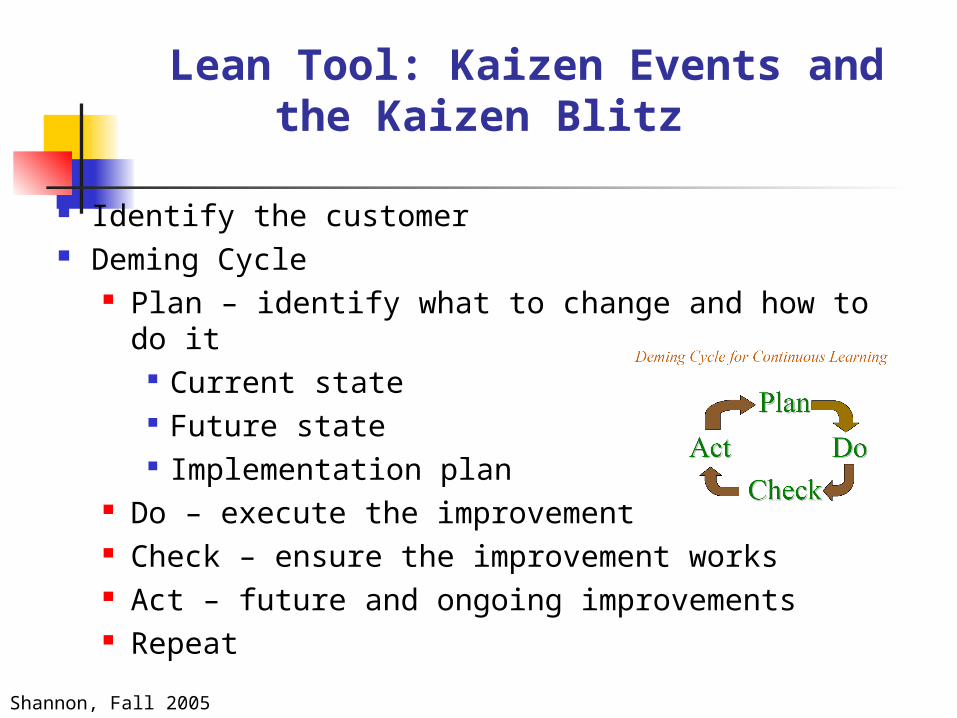
Lean Tool: Kaizen Events and the Kaizen Blitz
Identify the customer Deming Cycle
Plan – identify what to change and how to do it Current state Future state Implementation plan
Do – execute the improvement Check – ensure the improvement works Act – future and ongoing improvements Repeat
Shannon, Fall 2005
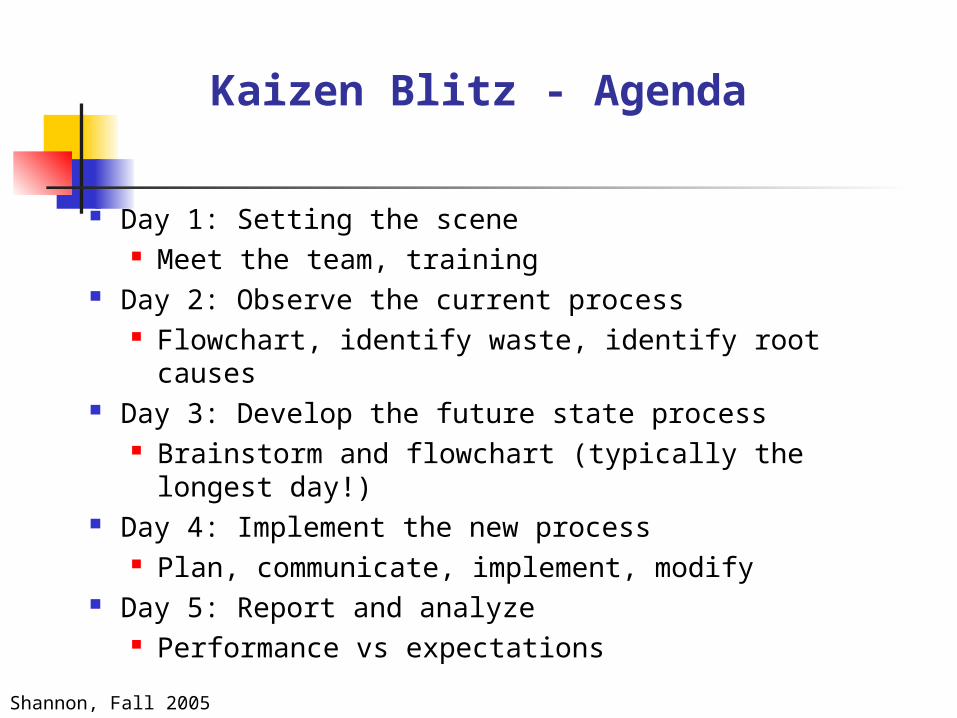
Kaizen Blitz - Agenda
Day 1: Setting the scene Meet the team, training
Day 2: Observe the current process Flowchart, identify waste, identify root causes
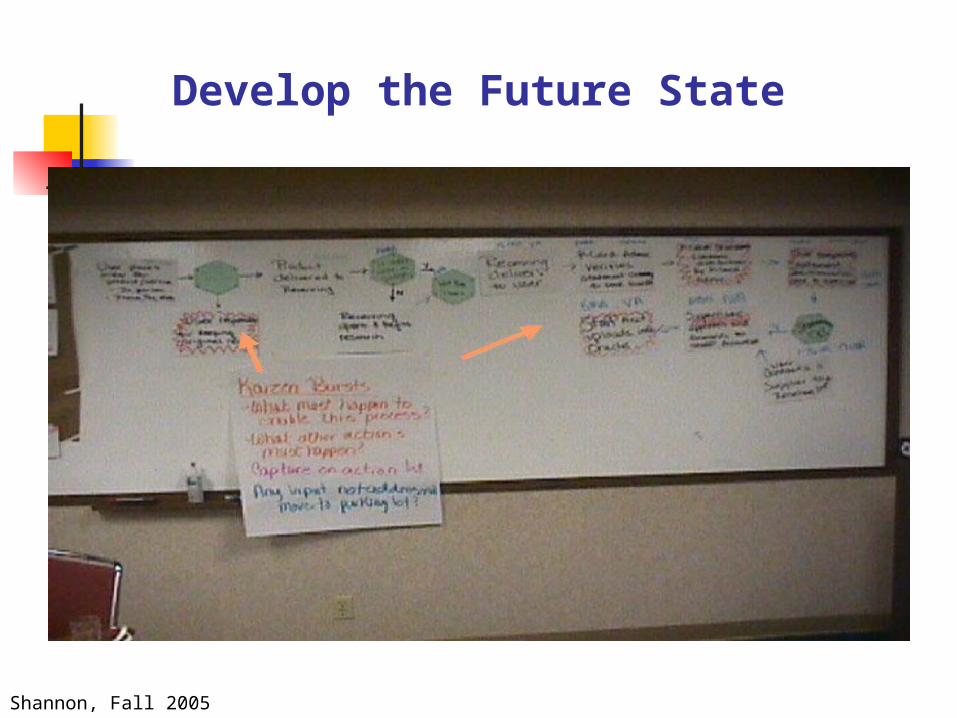
Day 3: Develop the future state process Brainstorm and flowchart (typically the longest
day!) Day 4: Implement the new process
Plan, communicate, implement, modify Day 5: Report and analyze
Performance vs expectations
Shannon, Fall 2005
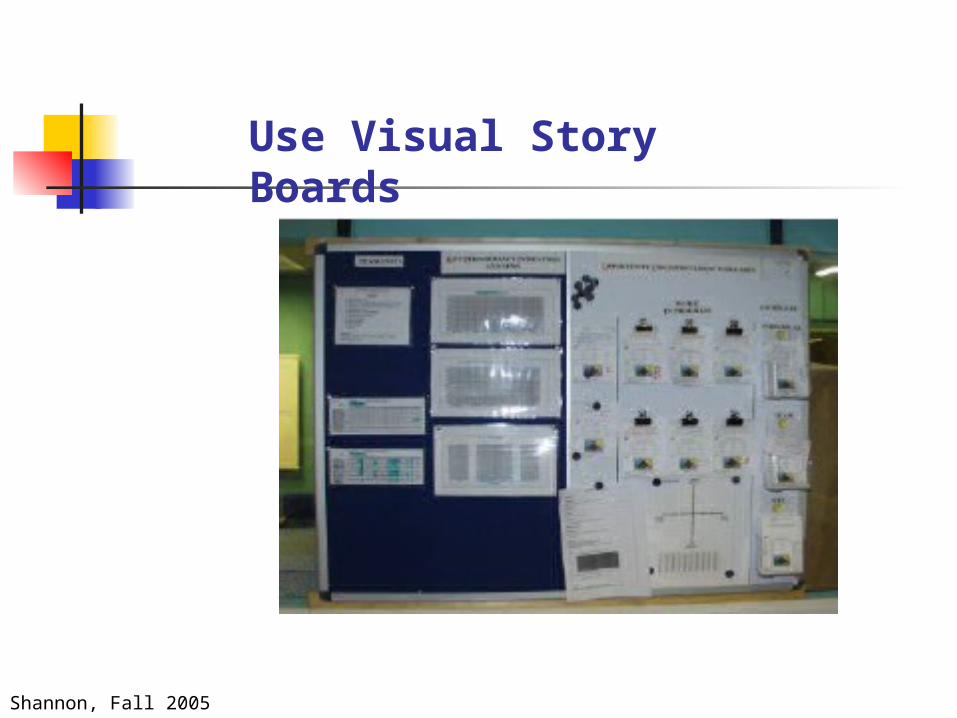
Use Visual Story Boards
Shannon, Fall 2005
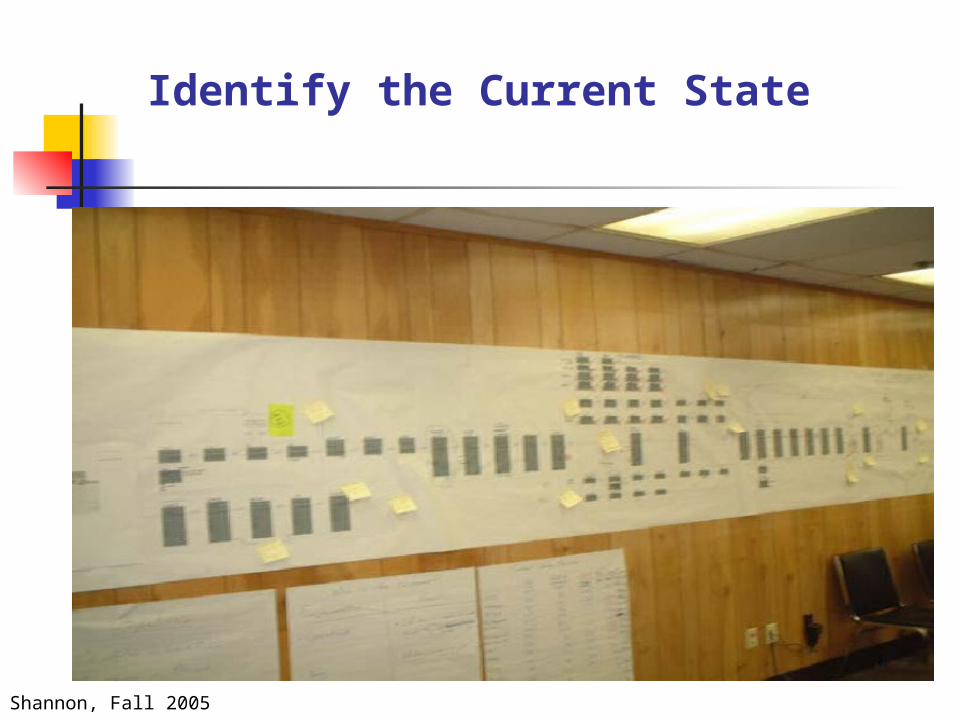
Identify the Current State
Shannon, Fall 2005
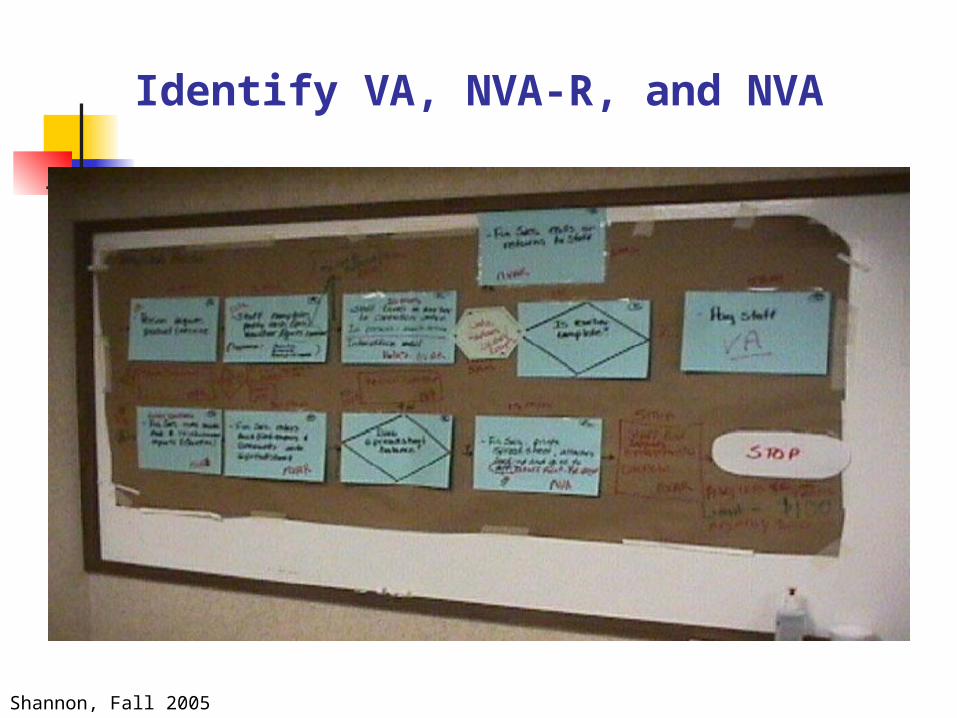
Identify VA, NVA-R, and NVA
Shannon, Fall 2005
Brainstorm and Analyze
Kaizen team brainstorming to develop new process Post improvement ideas on map or by category
Workflow Technology People / Organization Procedures
Develop detailed future state map New workflow Value Add and Non-Value Add Cycle times Identify Kaizen “bursts” (immediate radical change)
Shannon, Fall 2005
Develop the Future State
Shannon, Fall 2005
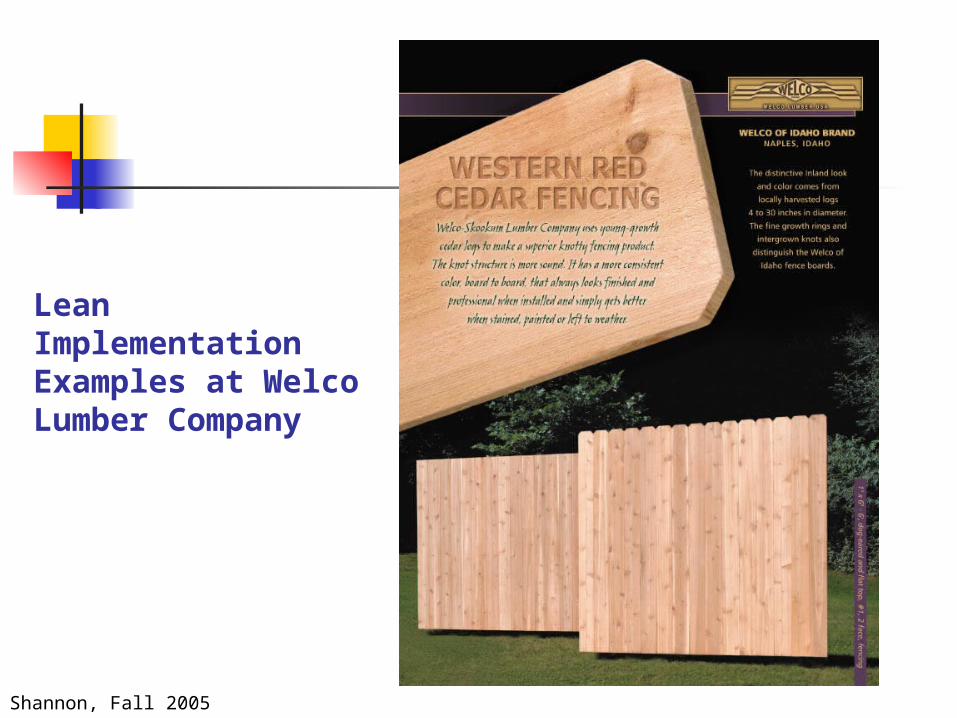
Lean Implementation Examples at Welco Lumber Company
Shannon, Fall 2005
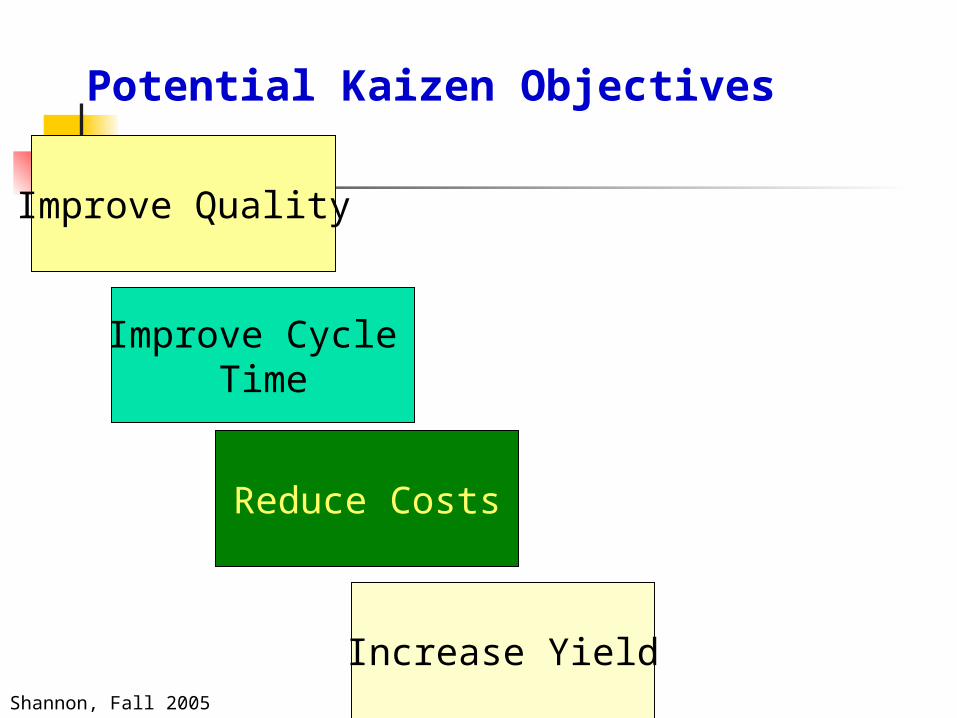
Potential Kaizen Objectives
Improve Quality
Improve Cycle Time
Reduce Costs
Increase Yield
Shannon, Fall 2005
Kaizen Methodology at Welco 1 De- Bark
Su rge Inventor y
Move to SortFeed
Cho p Saw
All 14” And Over
Un der 1 4”
HeadRig
Short RigEar to Waste
Scragg
Slab
Cant
Cant
Slab
2
2
3
3
Saw Mill Saw Mill –– FrontFront--EndEnd2
5-Nov-03 Thru 21-Nov-03Baseline
Log # Operator Log SizeLarge/Small
LogCorrect Cut (Yes or No) Error Category Welco Value Potential Value Potential Gain
1 Sid 15 Large No Excessive Log Breakdown $59.00 $65.97 $6.972 Sid 17 Large No Excessive Log Breakdown $79.27 $85.33 $6.063 Sid 11 Small Yes No Error $35.40 $35.40 $0.004 Sid 11 Small No Off Center Cant $31.61 $35.40 $3.795 Sid 14 Large No Reduced Value Cut $47.67 $58.86 $11.196 Sid 17 Large Yes No Error $85.33 $85.33 $0.007 Sid 8 Small Yes No Error $16.22 $16.22 $0.008 Sid 11 Small Yes No Error $35.40 $35.40 $0.009 Sid 9 Small Yes No Error $21.54 $21.54 $0.00
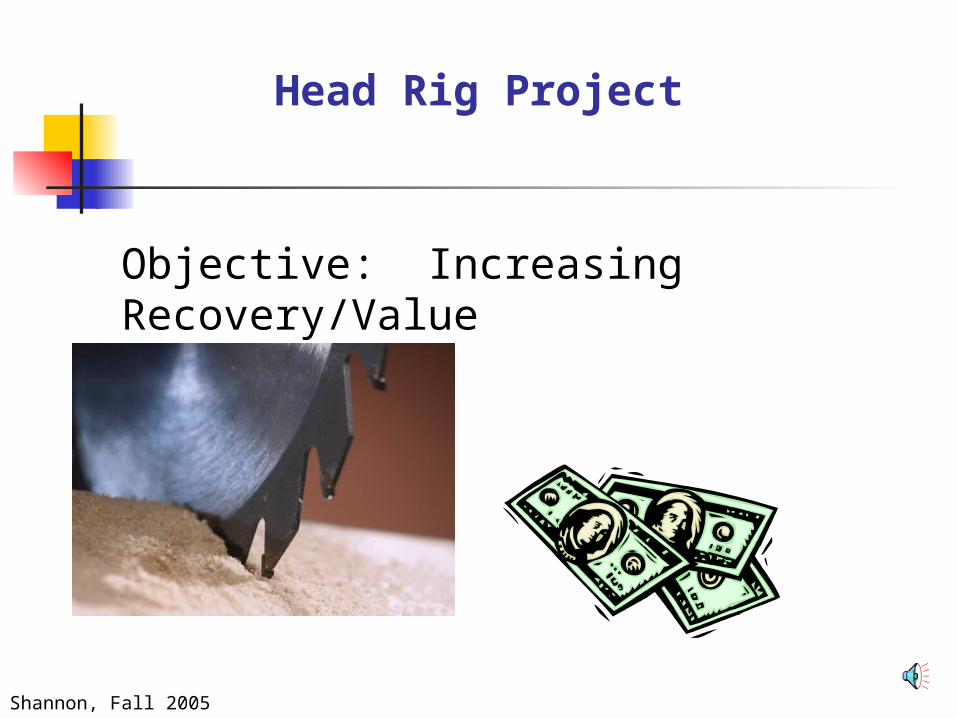
Head Rig Log Study
Analyze OperationIdentify Opportunity
Collect Baseline Data
Brainstorm Changes/Improvements
Make Changes
Collect Follow-Up Data/ Analyze Improvement
Results
Shannon, Fall 2005
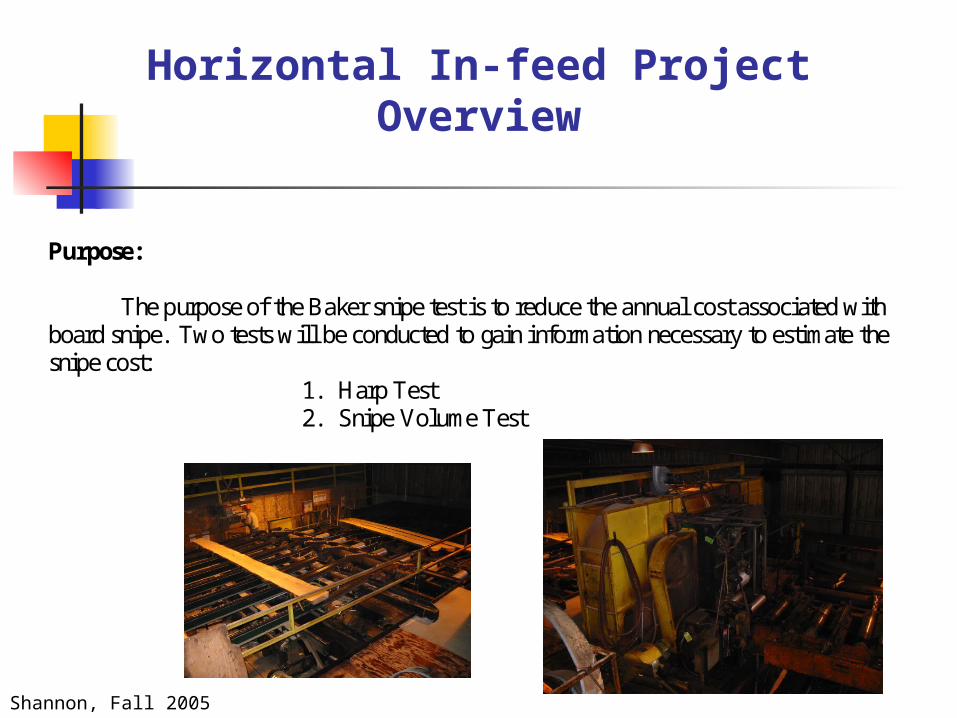
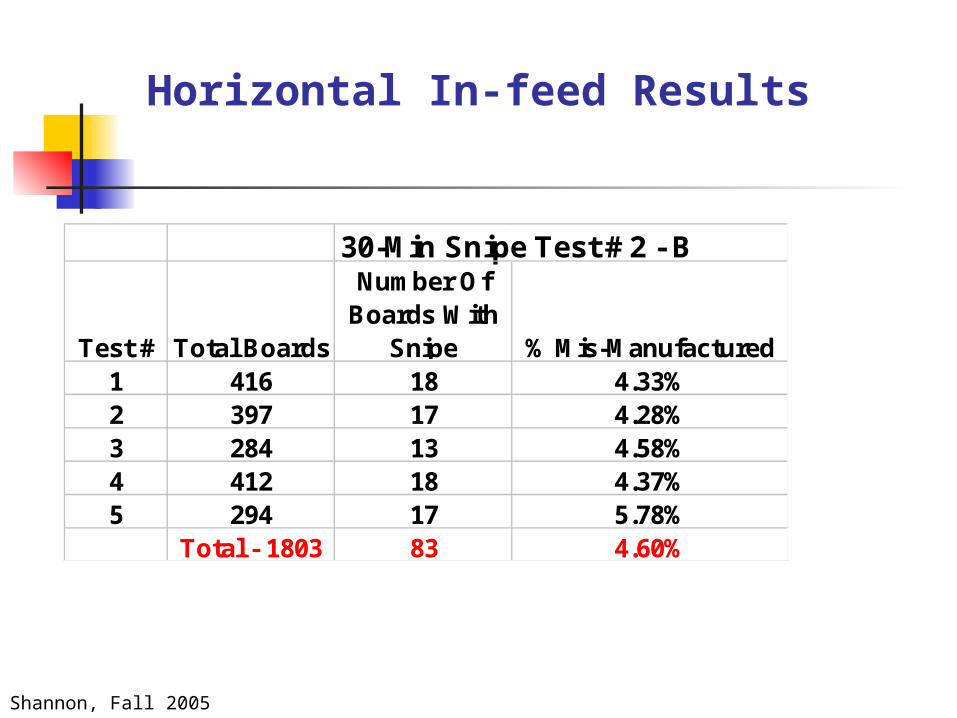
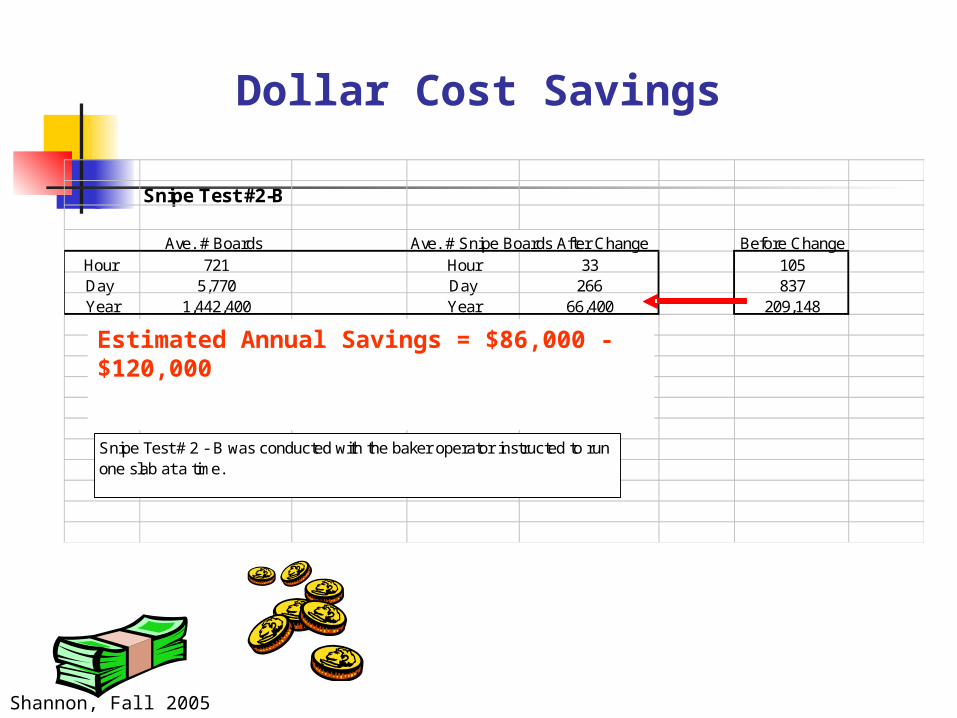
Horizontal In-feed Project Overview
Purpose: The purpose of the Baker snipe test is to reduce the annual cost associated with board snipe. Two tests will be conducted to gain information necessary to estimate the snipe cost:
1. Harp Test 2. Snipe Volume Test
Shannon, Fall 2005
Baseline Results
# of boards % Of Boards
Test Total Boards With Snipe With Snipe1 469 62 13.22%2 558 75 13.44%3 322 48 14.91%4 261 38 14.56%5 459 76 16.56%
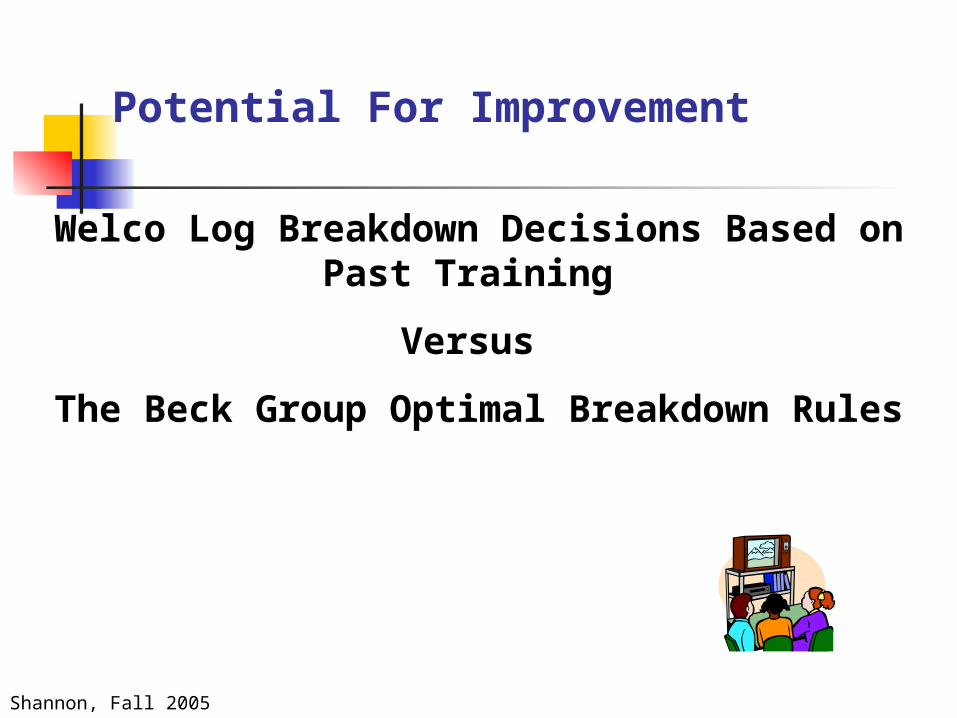
Welco Log Breakdown Decisions Based on Past Training
Versus
The Beck Group Optimal Breakdown Rules
Shannon, Fall 2005
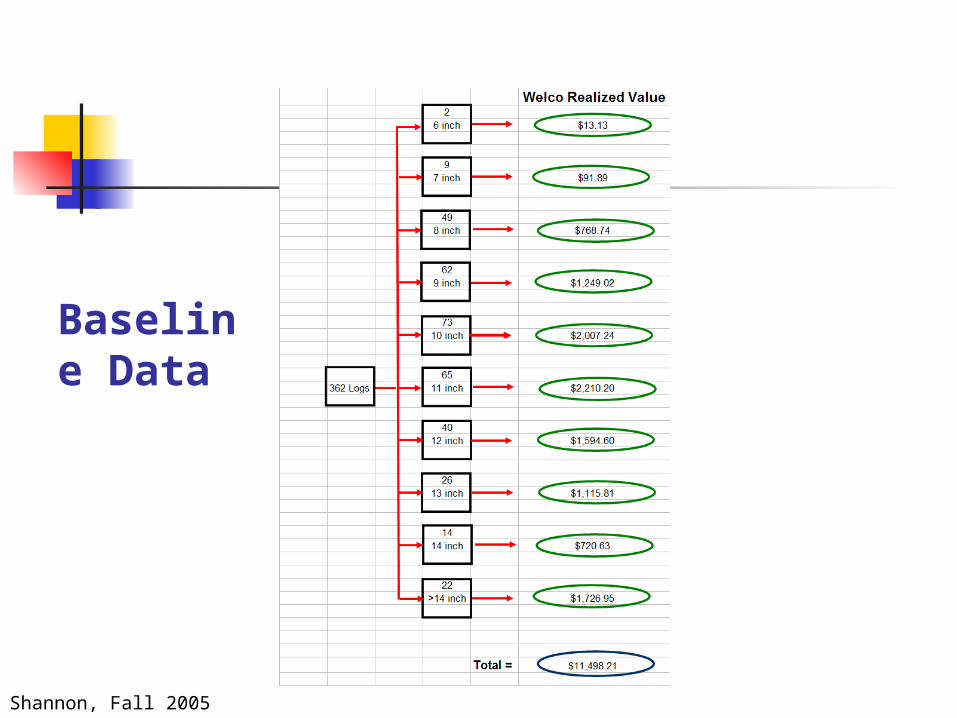
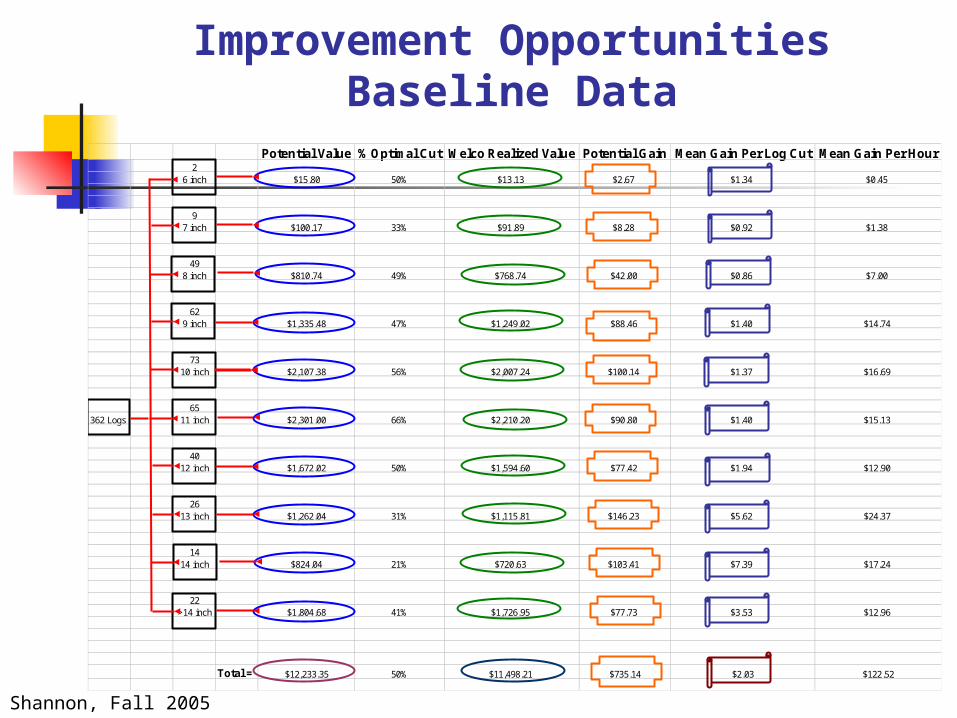
Improvement OpportunitiesBaseline Data
Potential Value % Optimal Cut Welco Realized Value Potential Gain Mean Gain Per Log Cut Mean Gain Per Hour2
6 inch $15.80 50% $13.13 $2.67 $1.34 $0.45
97 inch $100.17 33% $91.89 $8.28 $0.92 $1.38
498 inch $810.74 49% $768.74 $42.00 $0.86 $7.00
629 inch $1,335.48 47% $1,249.02 $88.46 $1.40 $14.74
7310 inch $2,107.38 56% $2,007.24 $100.14 $1.37 $16.69
65362 Logs 11 inch $2,301.00 66% $2,210.20 $90.80 $1.40 $15.13
4012 inch $1,672.02 50% $1,594.60 $77.42 $1.94 $12.90
2613 inch $1,262.04 31% $1,115.81 $146.23 $5.62 $24.37
1414 inch $824.04 21% $720.63 $103.41 $7.39 $17.24
22>14 inch $1,804.68 41% $1,726.95 $77.73 $3.53 $12.96
Total = $12,233.35 50% $11,498.21 $735.14 $2.03 $122.52
Shannon, Fall 2005
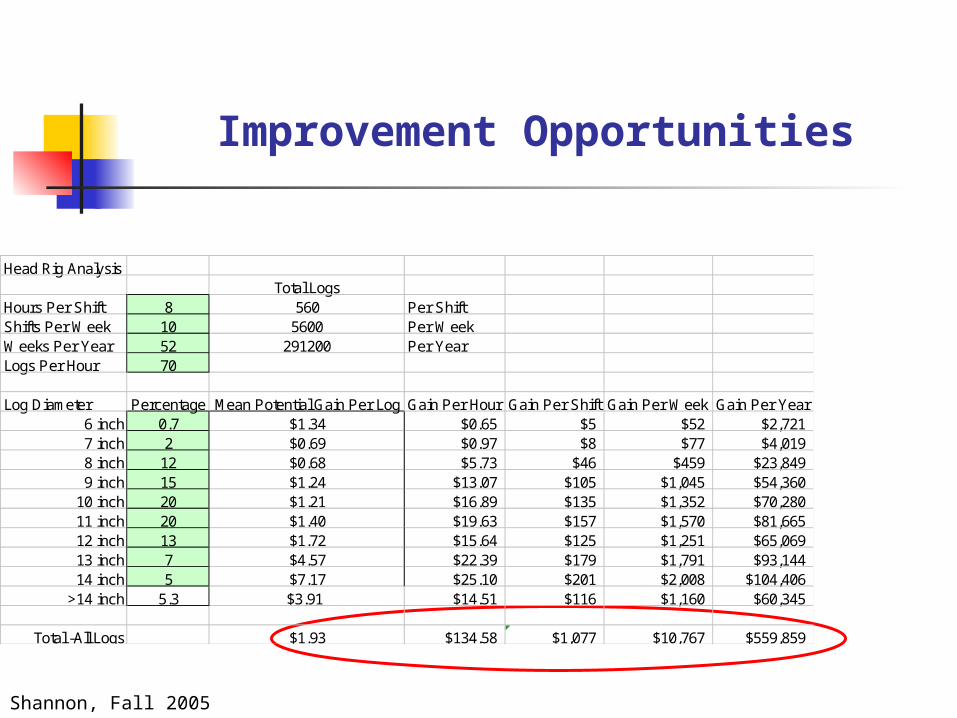
Improvement Opportunities
Head Rig AnalysisTotal Logs
Hours Per Shift 8 560 Per ShiftShifts Per Week 10 5600 Per WeekWeeks Per Year 52 291200 Per YearLogs Per Hour 70
Log Diameter Percentage Mean Potential Gain Per Log Gain Per Hour Gain Per Shift Gain Per Week Gain Per Year6 inch 0.7 $1.34 $0.65 $5 $52 $2,7217 inch 2 $0.69 $0.97 $8 $77 $4,0198 inch 12 $0.68 $5.73 $46 $459 $23,8499 inch 15 $1.24 $13.07 $105 $1,045 $54,360
10 inch 20 $1.21 $16.89 $135 $1,352 $70,28011 inch 20 $1.40 $19.63 $157 $1,570 $81,66512 inch 13 $1.72 $15.64 $125 $1,251 $65,06913 inch 7 $4.57 $22.39 $179 $1,791 $93,14414 inch 5 $7.17 $25.10 $201 $2,008 $104,406
>14 inch 5.3 $3.91 $14.51 $116 $1,160 $60,345
Total -All Logs $1.93 $134.58 $1,077 $10,767 $559,859
Shannon, Fall 2005
How to Achieve The Gains?
Know the Beck Group Rules Operator Training Use the Beck Group Rules Laser Lights Other ???
Shannon, Fall 2005
Analyze Changes
Video Data Collection and Analysis Assess Progress Hold the Gains
Shannon, Fall 2005
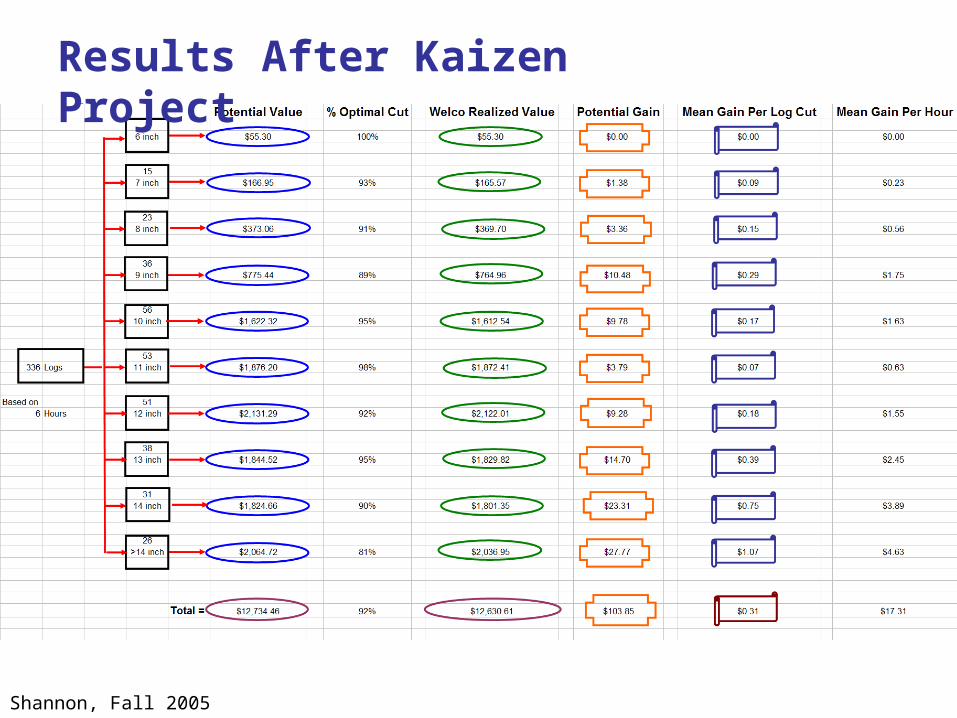
Results After Kaizen Project
Shannon, Fall 2005
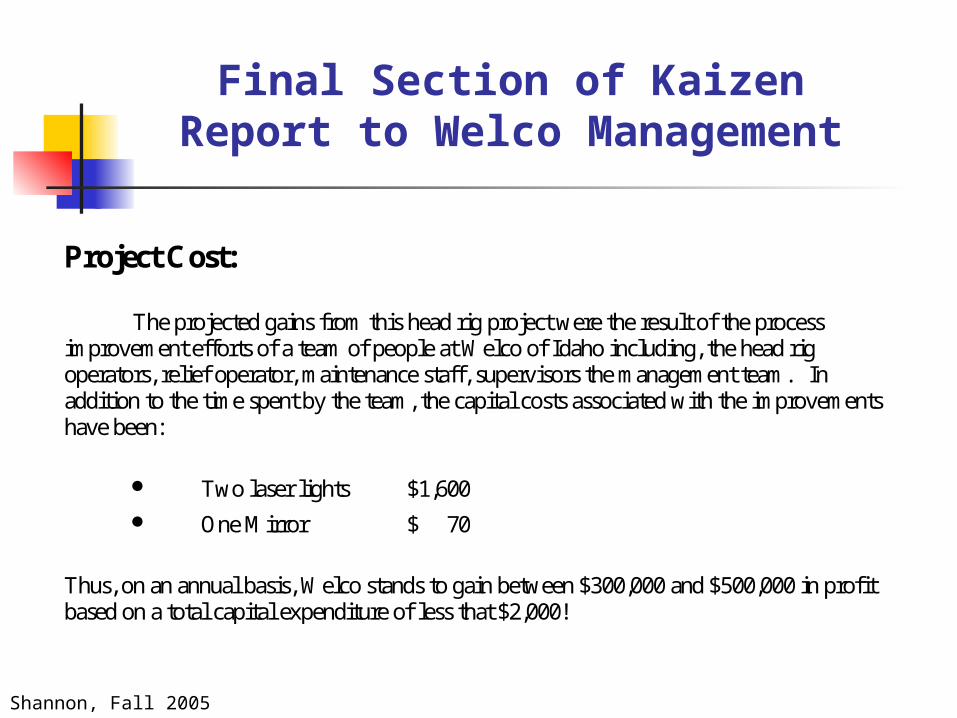
Project Cost: The projected gains from this head rig project were the result of the process improvement efforts of a team of people at Welco of Idaho including, the head rig operators, relief operator, maintenance staff, supervisors the management team. In addition to the time spent by the team, the capital costs associated with the improvements have been:
Two laser lights $1,600 One Mirror $ 70
Thus, on an annual basis, Welco stands to gain between $300,000 and $500,000 in profit based on a total capital expenditure of less that $2,000!
Final Section of Kaizen Report to Welco
Management
Shannon, Fall 2005
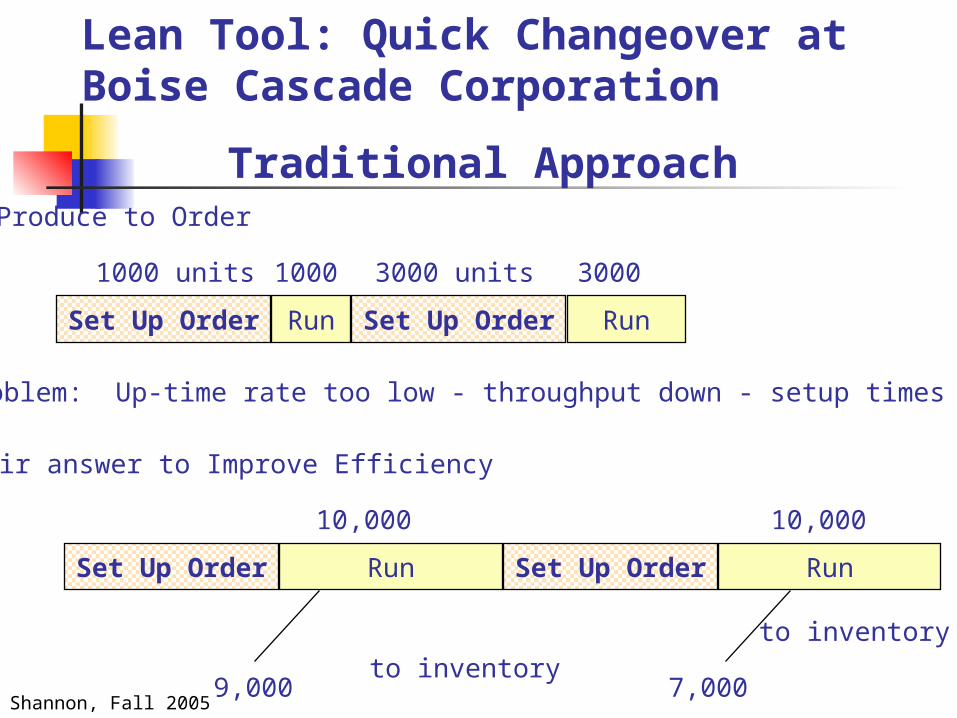
Traditional Approach
Lean Tool: Quick Changeover at Boise Cascade Corporation
Set Up Order Run
1000 units
Produce to Order
1000
Set Up Order Run
3000 units 3000
Problem: Up-time rate too low - throughput down - setup times too long
Their answer to Improve Efficiency
Set Up Order Run
10,000
9,000to inventory
Set Up Order Run
10,000
to inventory
7,000
Shannon, Fall 2005
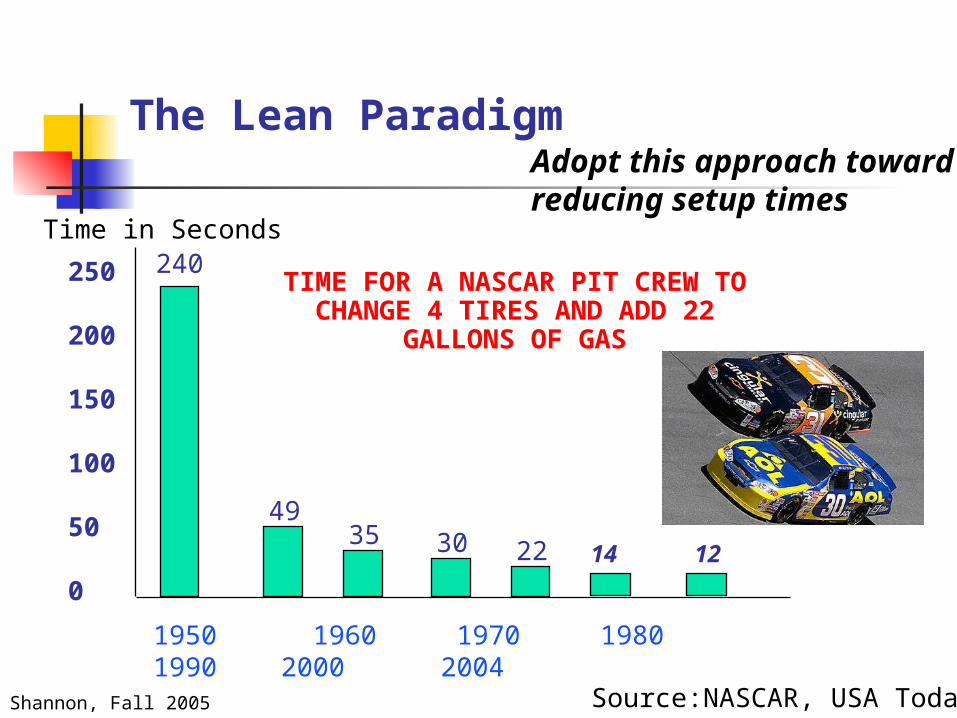
The Lean Paradigm
TIME FOR A NASCAR PIT CREW TO CHANGE 4 TIRES AND ADD 22
GALLONS OF GAS
1950 1960 1970 1980 1990 2000 2004
250
200
150
100
50
0
Time in Seconds240
4935 30 22
Source:NASCAR, USA Today
Adopt this approach towardreducing setup times
14 12
Shannon, Fall 2005
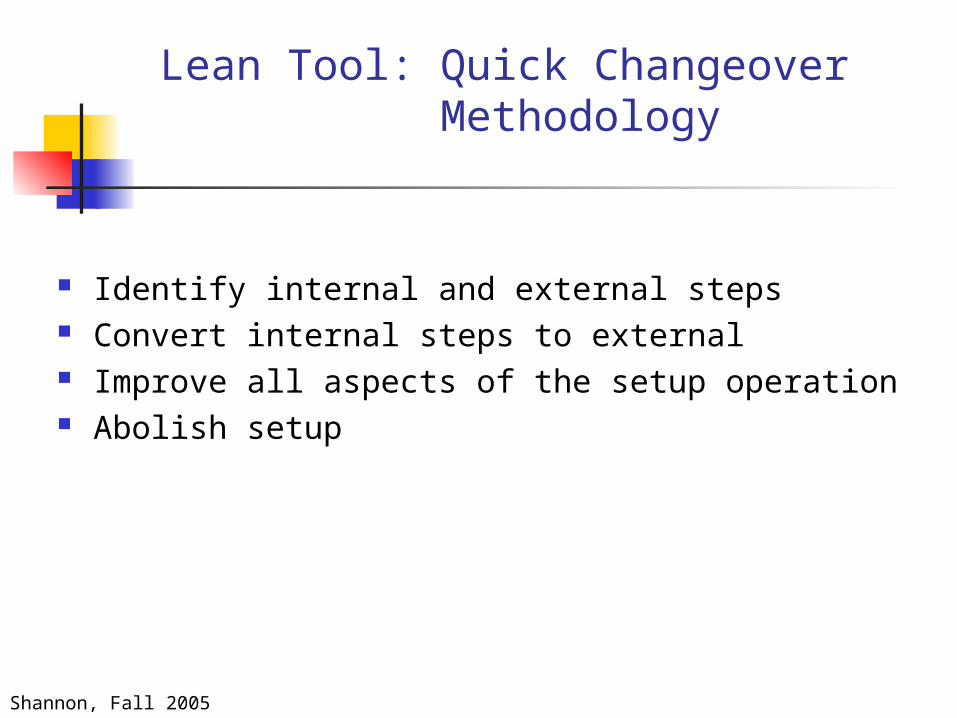
Lean Tool: Quick Changeover Methodology
Identify internal and external steps Convert internal steps to external Improve all aspects of the setup operation Abolish setup
Shannon, Fall 2005
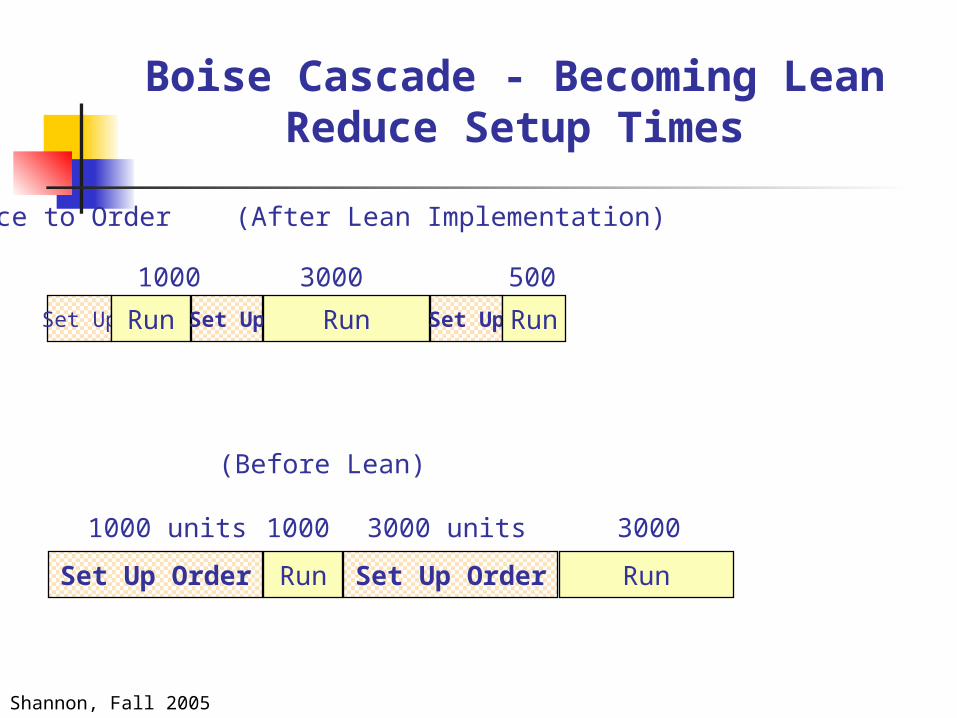
Boise Cascade - Becoming LeanReduce Setup Times
Set Up Run
Produce to Order (After Lean Implementation)
1000
Set Up Run
3000
Set Up Run
500
Set Up Order Run
1000 units 1000
Set Up Order Run
3000 units 3000
(Before Lean)
Shannon, Fall 2005
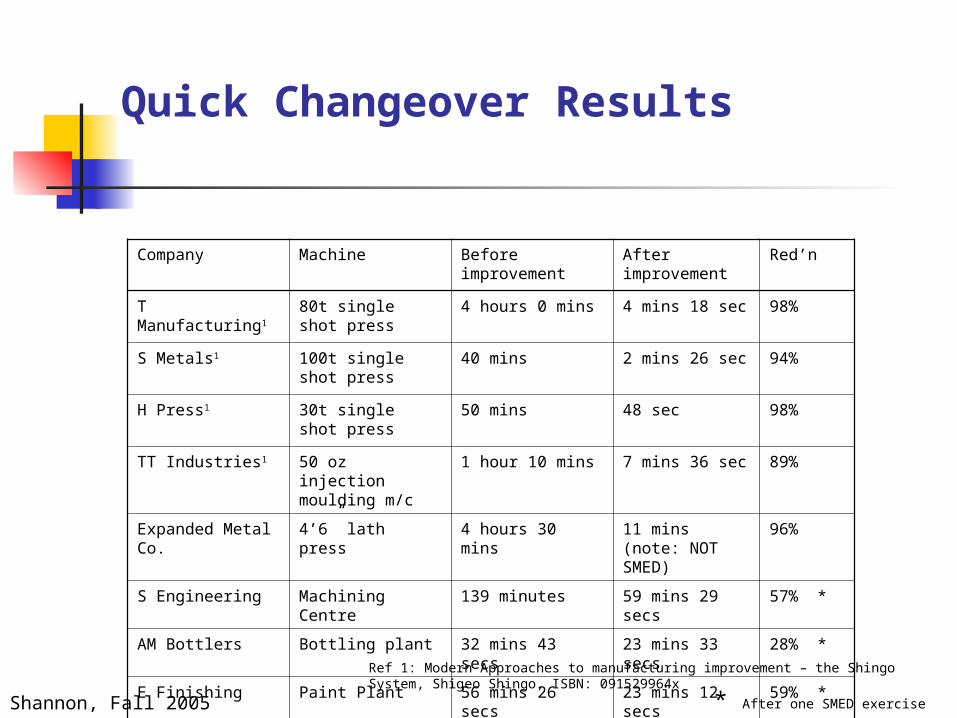
Quick Changeover Results
Company Machine Before improvement
After improvement
Red’n
T Manufacturing1 80t single shot press
4 hours 0 mins 4 mins 18 sec 98%
S Metals1 100t single shot press
40 mins 2 mins 26 sec 94%
H Press1 30t single shot press
50 mins 48 sec 98%
TT Industries1 50 oz injection moulding m/c
1 hour 10 mins 7 mins 36 sec 89%
Expanded Metal Co.
4’6” lath press 4 hours 30 mins 11 mins (note: NOT SMED)
96%
S Engineering Machining Centre 139 minutes 59 mins 29 secs
57% *
AM Bottlers Bottling plant 32 mins 43 secs 23 mins 33 secs
28% *
E Finishing Paint Plant 56 mins 26 secs 23 mins 12 secs
59% *
Ref 1: Modern Approaches to manufacturing improvement – the Shingo System, Shigeo Shingo, ISBN: 091529964x
* After one SMED exercise
Shannon, Fall 2005
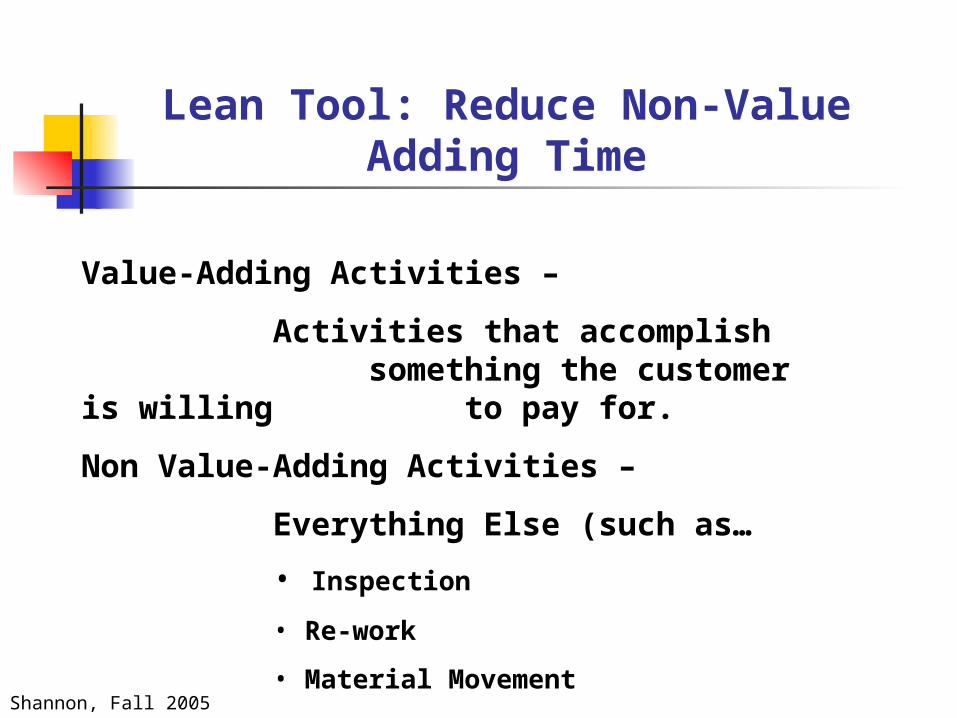
Lean Tool: Reduce Non-Value Adding Time
Value-Adding Activities –
Activities that accomplish something the customer is
willing to pay for.
Non Value-Adding Activities –
Everything Else (such as…
• Inspection
• Re-work
• Material Movement
Shannon, Fall 2005
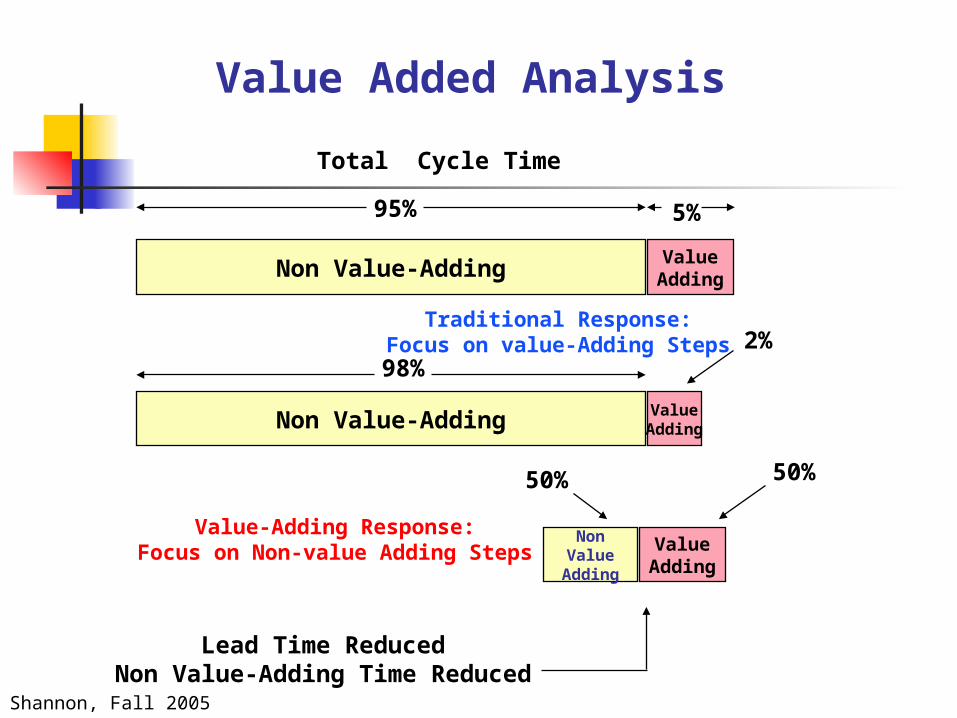
Value Added Analysis
Non Value-Adding ValueAdding
95% 5%
Total Cycle Time
Traditional Response:Focus on value-Adding Steps
Non Value-Adding ValueAdding
98%2%
Value-Adding Response:Focus on Non-value Adding Steps
NonValue
Adding
ValueAdding
50% 50%
Lead Time ReducedNon Value-Adding Time Reduced
Shannon, Fall 2005
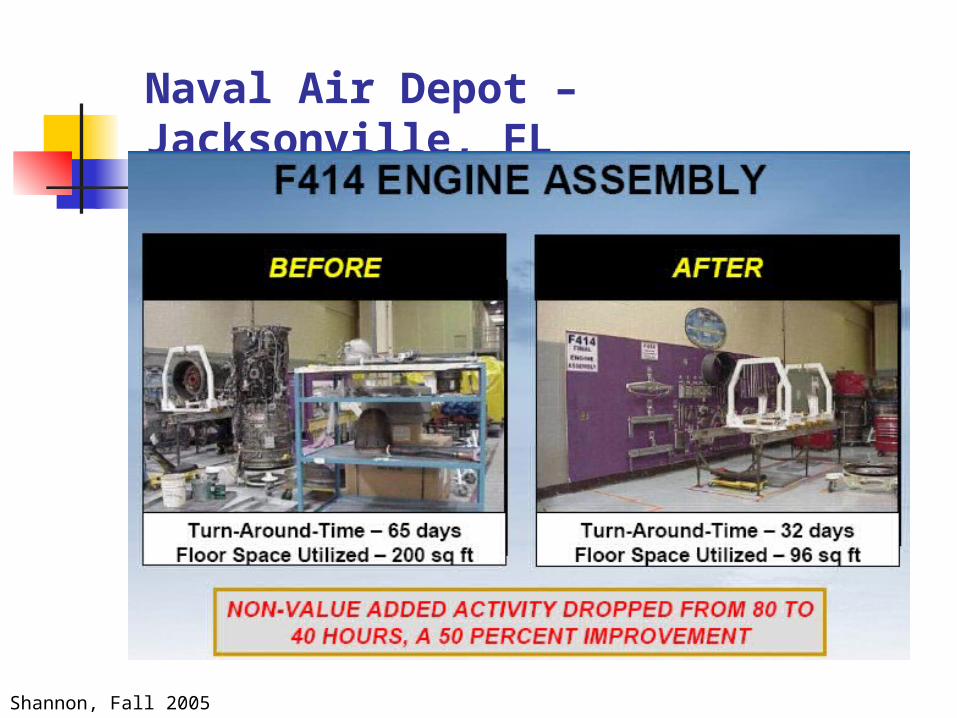
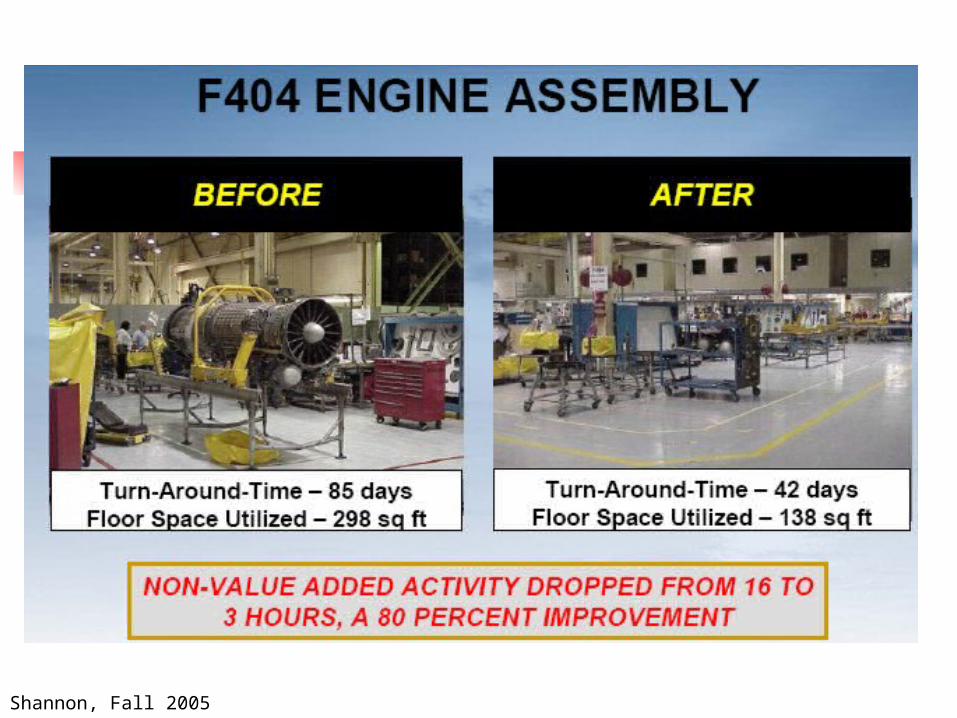
Naval Air Depot – Jacksonville, FL
Shannon, Fall 2005
Shannon, Fall 2005
Get the Company On the Scale
Impediment to Success;Measuring the Wrong Things
“People do how they are measured.”
Dave Packard -- HP
Right
Shannon, Fall 2005
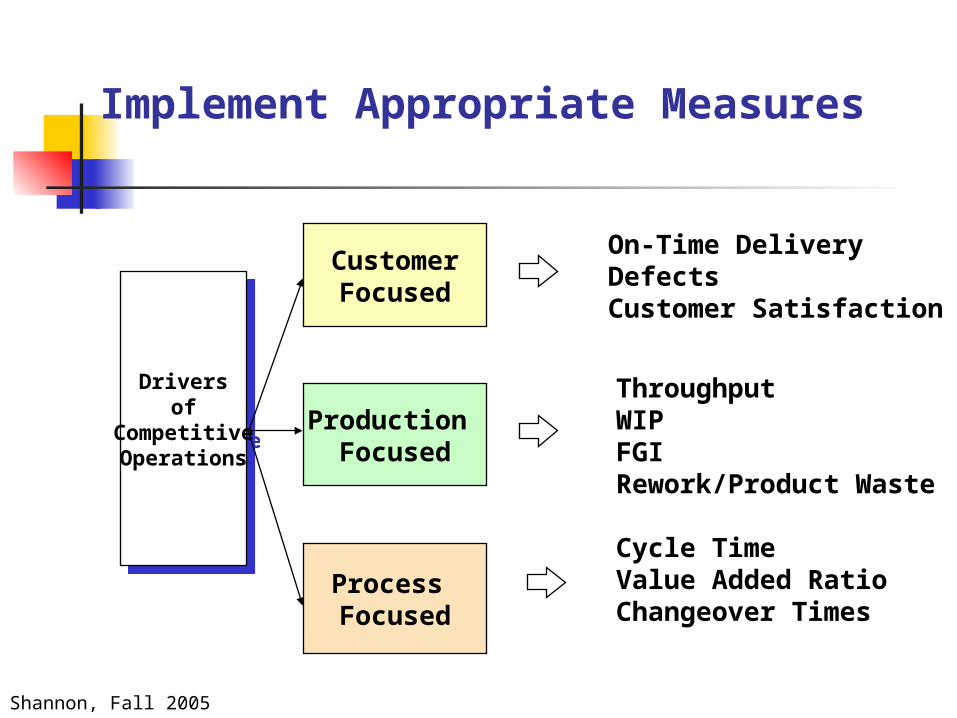
Implement Appropriate Measures
CustomerFocused
On-Time DeliveryDefectsCustomer Satisfaction
Production Focused
ThroughputWIPFGIRework/Product Waste
Process Focused
Cycle TimeValue Added RatioChangeover Times
Driversof
CompetitiveOperations
Driversof
CompetitiveOperations
Shannon, Fall 2005
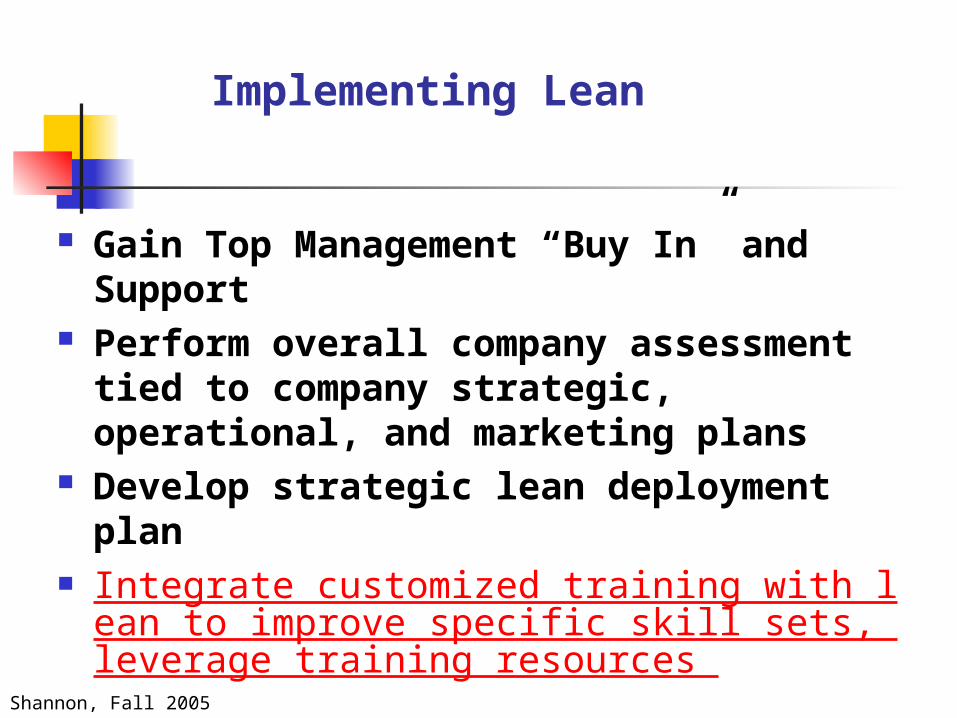
Implementing Lean
Gain Top Management “Buy In” and Support Perform overall company assessment tied to
company strategic, operational, and marketing plans
Develop strategic lean deployment plan Integrate customized training with lean to improve sp
ecific skill sets, leverage training resources
Shannon, Fall 2005
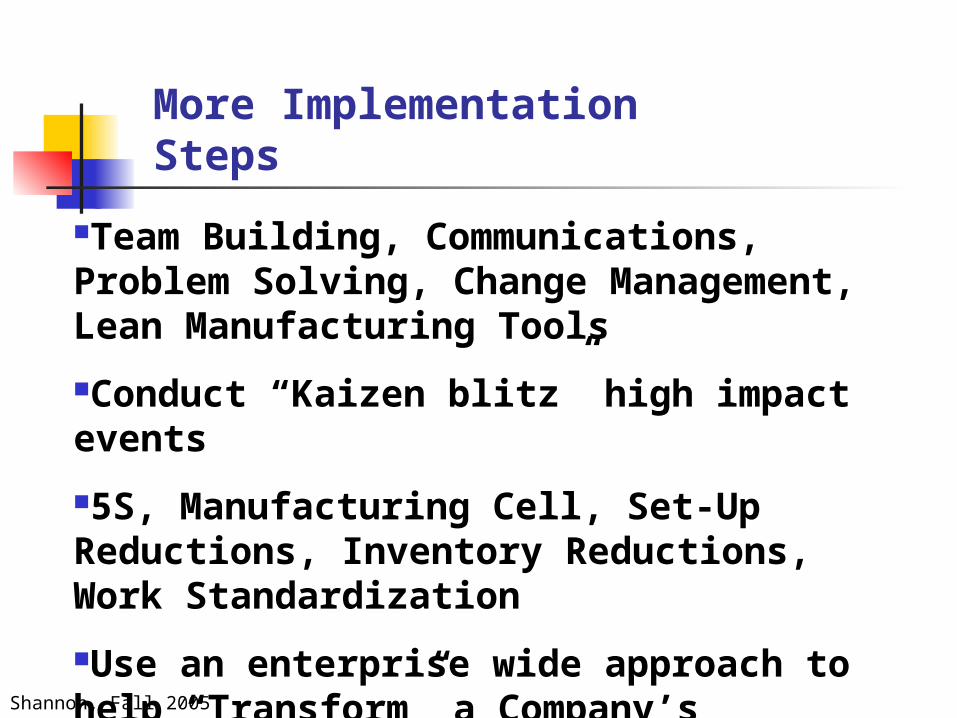
Team Building, Communications, Problem Solving, Change Management, Lean Manufacturing Tools
Conduct “Kaizen blitz” high impact events
5S, Manufacturing Cell, Set-Up Reductions, Inventory Reductions, Work Standardization
Use an enterprise wide approach to help “Transform” a Company’s culture and the way they do business.
More Implementation Steps
Shannon, Fall 2005
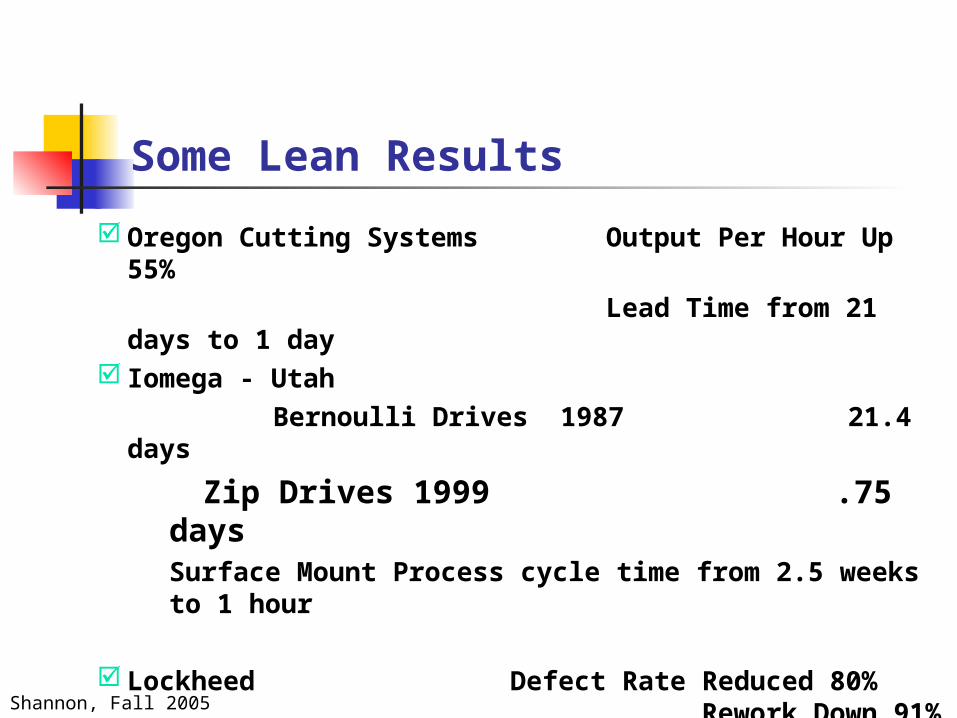
Some Lean Results
Oregon Cutting Systems Output Per Hour Up 55%
Lead Time from 21 days to 1 day
Iomega - Utah Bernoulli Drives 1987 21.4 days
Zip Drives 1999 .75 daysSurface Mount Process cycle time from 2.5 weeks to 1 hour
Lockheed Defect Rate Reduced 80% Rework Down
91% Lead Time Down by
95%
Motorola Pager Lead Time from 16 weeks to 28 minutes
Shannon, Fall 2005
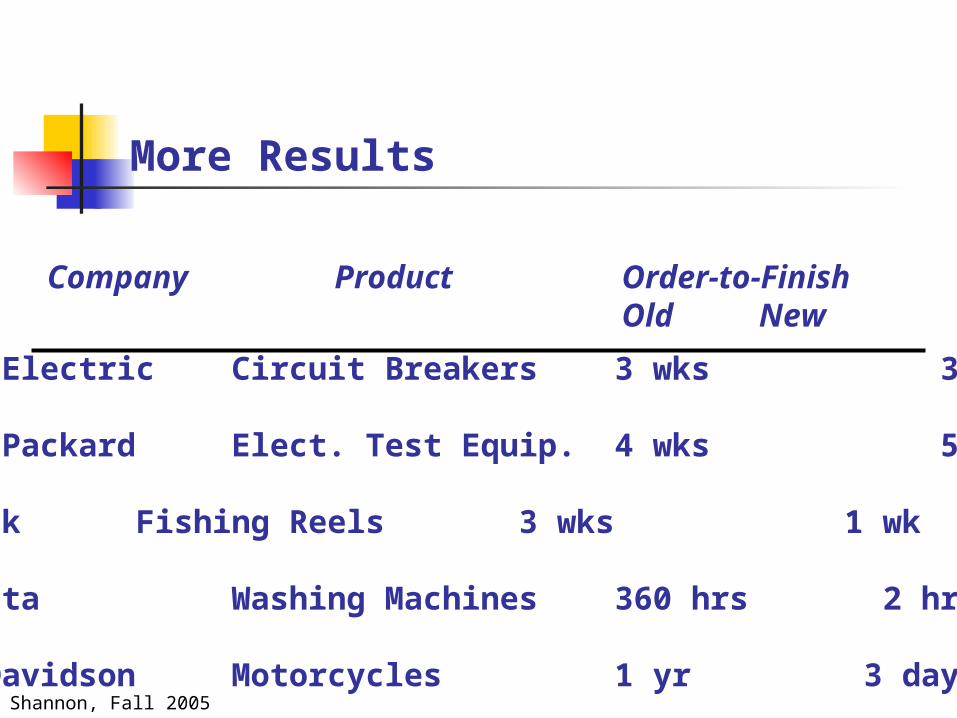
More Results
Company Product Order-to-FinishOld New
General Electric Circuit Breakers 3 wks 3 days
Hewlett-Packard Elect. Test Equip. 4 wks 5 days
Brunswick Fishing Reels 3 wks 1 wk
Matsushita Washing Machines 360 hrs 2 hrs
Harley-Davidson Motorcycles 1 yr 3 days
Shannon, Fall 2005
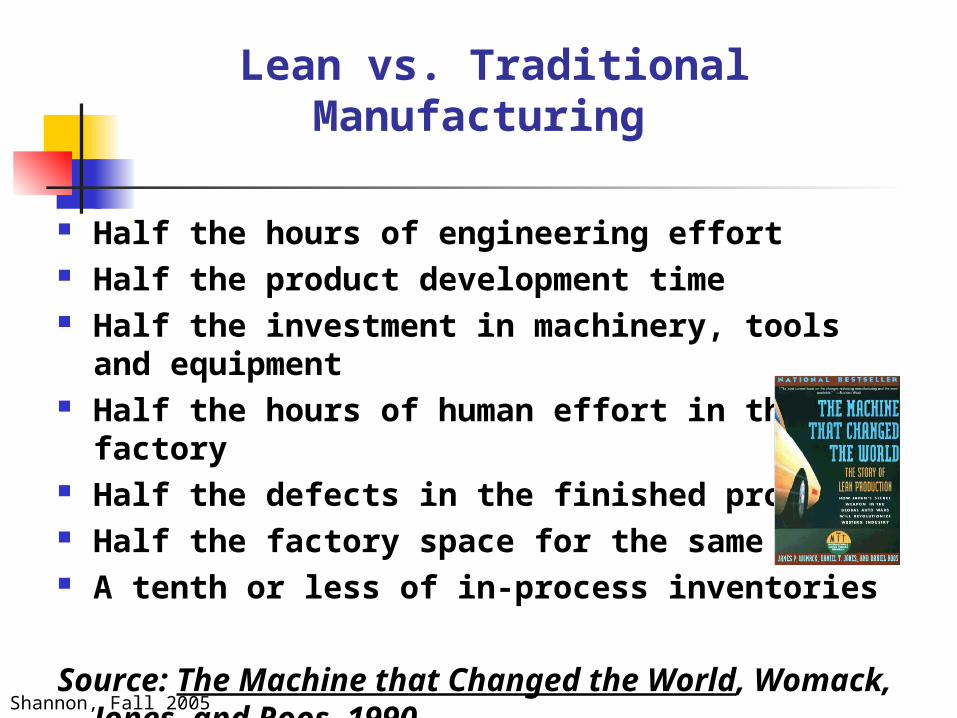
Lean vs. Traditional Manufacturing
Half the hours of engineering effort Half the product development time Half the investment in machinery, tools and equipment Half the hours of human effort in the factory Half the defects in the finished product Half the factory space for the same output A tenth or less of in-process inventories
Source: The Machine that Changed the World, Womack, Jones, and Roos, 1990.
Shannon, Fall 2005
Barriers to Lean
Implementing Lean Can Be Difficult Because it is Counterintuitive from a Traditional Paradigm:
Buying multiple small machines rather than one big machine that offers economies of scale.
Shutting down equipment when maximum inventory levels are reached rather than running flat out.
Using standards to continuously improve.
There is no step-by-step cook book There are some basic steps but the how-to varies from
organization to organization Requires an assessment of the company in order to map out the
strategy
Company culture plays a big part in the how-to
Shannon, Fall 2005
Lean Is A Journey
The Journey never ends Toyota estimates it is only 50% waste-free
There is much room for Improvement It is time to begin.
Shannon, Fall 2005
A Few References
Lean Thinking By James Womack and Daniel Jones, Simon and Schuster, 1996
The Toyota Way, Jeffrey Liker, McGraw-Hill, 2004
Fast Track To Waste-Free Manufacturing by John Davis, Productivity Press, 1999
Toyota Production System, by Taiichi Ohno, Productivity Press, 1988
Lean Production Simplified, By Pascal Dennis, Productivity Press, 2002
The Lean Enterprise Memory Jogger, Goal/QPC, 2002
Becoming Lean, By Jeffery Liker, Productivity Press, 1998
The Goal, By Eliyahu Goldratt and Jeff Cox, North River Press, 1986
It’s Not Luck, By Eliyahu Goldratt, North River Press, 1994
The Machine That Changed The World, By James Womack, Daniel Jones, and Daniel Roos
Goldratt’s Theory of Constraints, By H. William Detmer