Shantilal Shah Engineering College, Bhavnagar General Department Physics (Practical)-3110011 Index Sr. No. Code Objective Page no. Date Sign Remarks 1 P_1 To Determination of the velocity of ultrasonic waves in a non-electrolytic liquid by ultrasonic interferometer. 1 - 3 2 P_2 (VLAB) To determine the frequency of an electrically maintained tuning fork by, 1. Transverse mode of vibration 2. Longitudinal mode of vibration 4 - 7 3 P_3 To find reverberation time using Sabin’s formula. 8 - 10 4 P_4 (VLAB) To determine the wavelength of the given source using Newton’s ring. 11 - 12 5 P_5 Understand the function of CRO and measure the rms voltage ns frequency of AC signal using CRO. 13 - 14 6 P_6 (VLAB) To determine the moment of inertia of the given disc using Torsion pendulum, with identical masses. 15 - 16 7 P_7 Measurement of the distance using ultrasonic sensors 17 - 17 Sr. No. Code Tutorial no. Page no. Date Sign Marks 8 T_1 Tutorial - 1 9 T_2 Tutorial - 2 10 T_3 Tutorial - 3 11 T_4 Tutorial - 4 12 T_5 Tutorial - 5 13 T_6 Tutorial - 6
Transcript
Shantilal Shah Engineering College, Bhavnagar
General Department
Physics (Practical)-3110011
Index
Sr.
No. Code Objective
Page
no. Date Sign Remarks
1 P_1
To Determination of the velocity of
ultrasonic waves in a non-electrolytic liquid
by ultrasonic interferometer.
1 - 3
2 P_2
(VLAB)
To determine the frequency of an
electrically maintained tuning fork by,
1. Transverse mode of vibration
2. Longitudinal mode of vibration
4 - 7
3 P_3 To find reverberation time using Sabin’s
formula. 8 - 10
4 P_4
(VLAB)
To determine the wavelength of the given
source using Newton’s ring. 11 - 12
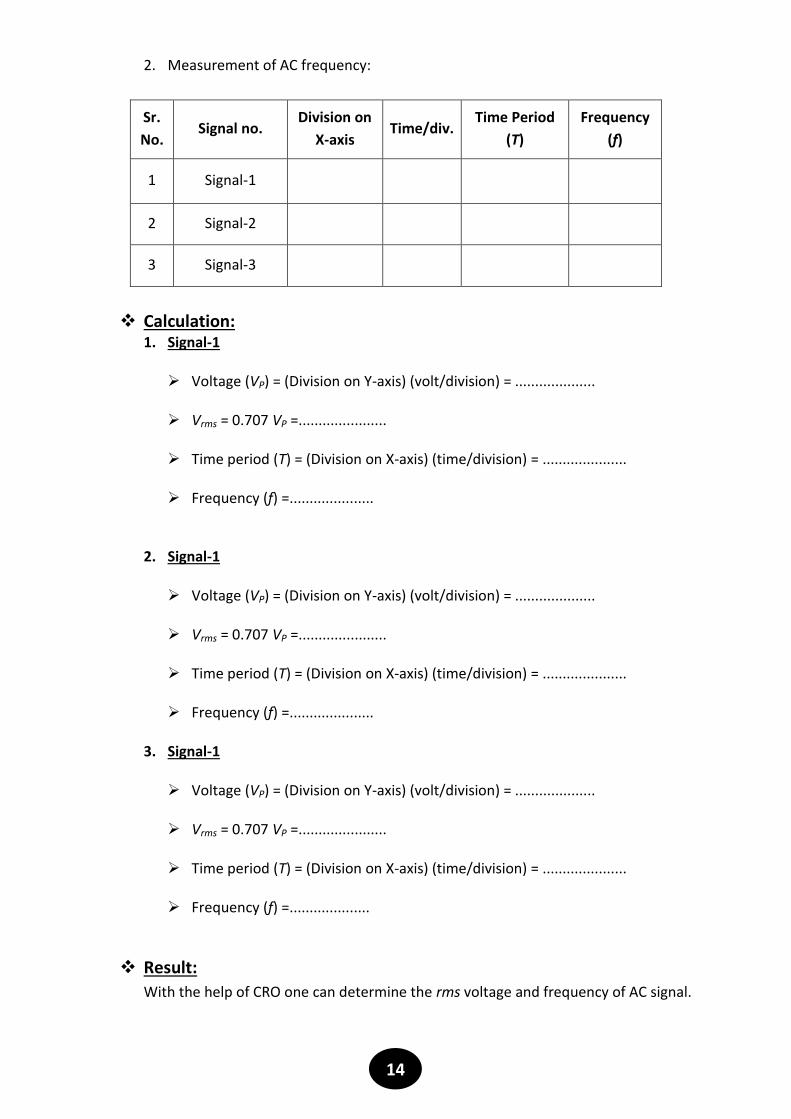
5 P_5
Understand the function of CRO and
measure the rms voltage ns frequency of AC
signal using CRO.
13 - 14
6 P_6
(VLAB)
To determine the moment of inertia of the
given disc using Torsion pendulum, with
identical masses.
15 - 16
7 P_7 Measurement of the distance using
ultrasonic sensors 17 - 17
Sr.
No. Code Tutorial no.
Page
no. Date Sign Marks
8 T_1 Tutorial - 1
9 T_2 Tutorial - 2
10 T_3 Tutorial - 3
11 T_4 Tutorial - 4
12 T_5 Tutorial - 5
13 T_6 Tutorial - 6
1
Shantilal Shah Engineering College, Bhavnagar
Physics Laboratory Manual
Experiment-1 (P_1)
Objective: Determination of the velocity of ultrasonic waves in a non-electrolytic liquid
2. Insert the cell in the base and clamp it with the help of a screw provided on one of
its side.
3. Unscrew the knurled cap of cell and lift it away from double walled construction of
the cell. In the middle portion of it pour experimental liquid (water) and screw the
knurled caps as shown in figure 1.
4. Two chutes in double wall construction are provided for water circulation to
maintain desired temperature.
Note: Make sure the power switch should be ‘Off’ at the time of connection.
5. Connect co-axial cable between liquid cell and receiver terminal of Nvis 6109
Ultrasonic Measurement Lab Trainer.
Note: Set the gain knob at fully anticlockwise, before switch ‘On’ the trainer.
6. Switch ‘On’ the power of trainer.
7. Wait for 2-3 minutes until display shows a constant value of current (because for
better interference, some time is needed).
8. Adjust the gain knob for maximum constant value of current.
9. Move the micrometer slowly (by increments of 0.01mm) in either clockwise or
anticlockwise direction till the current shows minimum reading on meter.
10. Note the readings of micrometer corresponding to the value of current. Now again
rotate the micrometer in same direction until the second minimum value of current
occurred.
11. Note the readings of micrometer in the table below.
12. Repeat the same procedure for number of consecutive minima value of current and
tabulate them.
2
[Figure: Ultrasonic interferometer]
Observation Table:
Sr
No.
Current
(μA) Min
Micrometer Reading N(mm) Difference between
consecutive Max/Min
λ/2 = Nn+1 – Nn M.S.R C.S.R.
T.R.=M.S.R.+
(C.S.R.*L.C.)
1
2
3
4
5
6
7
8
9
10
3
Mean λ/2 =………………
⸫ Wavelength λ = ………….. mm = ……….. 10–3 m
Calculations:
Frequency f = 2MHz = 2 106 Hz
Therefore velocity of Ultrasonic wave in experimental liquid,
v = λ × f = ……………………………….. m/s
Result: The velocity of Ultrasonic wave in experimental liquid v = …………….. m/s.
4
Shantilal Shah Engineering College, Bhavnagar
Physics Laboratory Manual
Experiment-2 (P_2)
Aim: To determine the frequency of an electrically maintained tuning fork by,
1. Transverse mode of vibration
2. Longitudinal mode of vibration
Apparatus: Electrically maintained tuning fork, fine thread, scale pan, weights and
meter scale.
Transverse drive mode :
In this arrangement the vibrations of the prongs of the tuning fork are in the
direction perpendicular to the length of the string.
The time, during which the tuning fork completes one vibration, the string also
completes one vibration. In this mode, frequency of the string is equal to the
frequency of the tuning fork.
Frequency 24
gMf
l
Where the total mass M is equal to the mass M' of the weight in the scale pan plus the mass
M0 of the scale pane, M = M' + M0.
Linear density of string, 41.17 10Kg
m
Mass of the scale pan M0 = 0.5 gm
Longitudinal drive mode:
In this arrangement the tuning fork is set in such a manner that the vibrations of the
prongs are parallel to the length of the string.
The time, during which the tuning fork completes one vibration, the string completes
half of its vibration. In this mode, frequency of the fork is twice the frequency of the
string.
Frequency 2
gMf
l
5
Performing Simulator
Combo Box:
Longitudinal mode- In this arrangement the tuning fork is set in such a manner that the
vibrations of the prongs are parallel to the length of the string.
Transverse mode - In this arrangement the vibration of the prongs of the tuning fork are in
the direction perpendicular to the length of the string.
Selecting Tuning fork - There are five tuning forks with different frequencies. One can
choose any one of the tuning forks to carry out the experiment.
Select Environment- Use only earth’s environment.
Sliders:
Mass in the pan M'- This slider is used for adding mass in the scale pan.
Transformer Voltage- This is used to change the voltage of the step down transformer.
Note: At 8V, we get well defined loops.
Scale Position- This is used to change the position of the meter scale and one can calculate
the length of one loop.
Power On - This is used to start the experiment.
Pointer movement- The pointer can be moved by using the arrow keys on either side of the
zoomed part of the loop image in the simulator.
Reset- One can repeat the whole experiment by using this button.
Procedure for simulation
1. Select the mode of Vibration.
2. Select a particular tuning fork to carry out the experiment.
3. Choose the environment for doing the experiment.
4. The transformer voltage is adjusted to 8V.
5. Mass is suspended in the scale pan.
6. Power on the button and loops will be formed.
7. Length l for one loop is measured by adjusting the scale position.
8. Using equations for mode of vibration, calculate the frequency of particular tuning
fork.
9. Repeat the experiment by changing the parameters.
6
Observation Table
Mode of Vibration: Transverse Mass of the pan M0 = 0.5 gm
Tuning fork
Mass Suspended M
Kg
Total mass M in Kg (M+M0)
Number of Loops
N
Length of Loops (Total) L
Length of one Loop
LlN
Frequency in Hz f
1
2
3
4
5
Calculation of frequency: 24
gMf
l
7
Mode of Vibration: Longitudinal Mass of the pan M0 = 0.5 gm
Tuning fork
Mass Suspended M
Kg
Total mass M in Kg (M+M0)
Number of Loops
N
Length of Loops (Total) L
Length of one Loop
LlN
Frequency in Hz f
1
2
3
4
5
Calculation of frequency: 2
gMf
l
Result: (1) Frequency of tuning fork in transverse mode is = ........................Hz (2) Frequency of tuning fork in longitudinal mode is = ......................Hz
8
Shantilal Shah Engineering College, Bhavnagar
Physics Laboratory Manual
Experiment-3 (P_3)
Objective: To find reverberation time using sabin’s formula.
Item Required: Measurement tap.
Procedure:
1. Measure length, width and height in meter for given room.
2. Find volume of hall using V = l W h
3. Find area of each wall of the room.
4. Calculate reverberation time using following formula:
T = .
a
5. Repeat the same by considering all windows of room.
6. Repeat the same by considering all windows of room and carpet flooring and
gypsum ceiling.
Observations:
Length of room/hall, l = …………… m
Width of room/hall, W = …………. m
Height of room/hall, h = …………… m
Area of window, Sw = ……….. m2
Volume of the room/hall, V = ………………m3
Absorption coefficient of flooring tiles = 0.02 O.W.U m2
Absorption coefficient of concrete wall = 0.05 O.W.U m2
Absorption coefficient of wood = 0.08 O.W.U m2
Absorption coefficient of thick carpet = 0.65 O.W.U m2
Absorption coefficient of perforated Gypsum = 0.84 O.W.U m2
9
Observation Table:
Without Windows
Absorption of
walls, alS1
(O.W.U m2)
Absorption of
floor, a2S2
(O.W.U m2)
Absorption of
Ceiling, a3S3
(O.W.U m2)
Total Absorption,
ΣaS
(O.W.U m2)
Reverberation Time, T1
(s)
With wooden windows
Absorption of
walls, alS1
(O.W.U m2)
Absorption of
floor, a2S2
(O.W.U m2)
Absorption of
Ceiling, a3S3
(O.W.U m2)
Absorption of
Windows, awSw
(O.W.U m2)
Total Absorption,
ΣaS
(O.W.U m2)
Reverberation
Time, T2
(s)
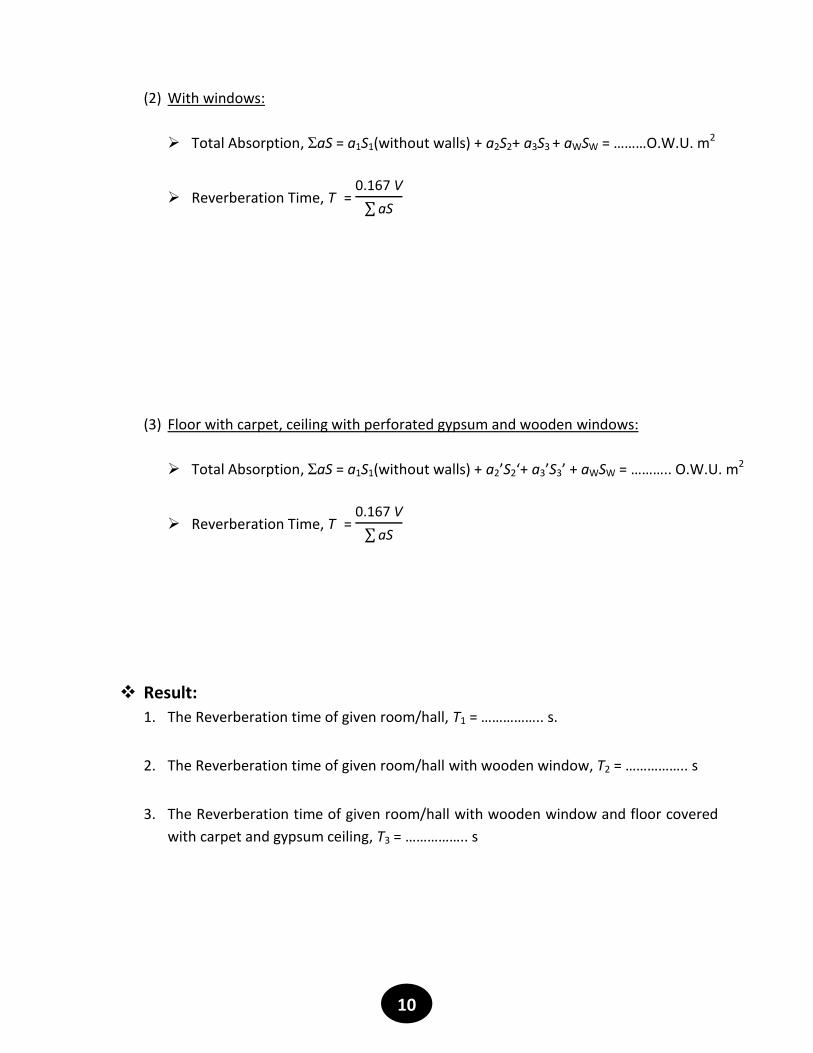
Floor with carpet, Ceiling with perforated gypsum and wooden windows