Under consideration for publication in J. Fluid Mech. 1 Shape and motion of drops sliding down an inclined plane By NOLWENN LE GRAND, ADRIAN DAERR AND LAURENT LIMAT Laboratoire de Physique et M´ ecanique des Milieux H´ et´ erog` enes (PMMH) UMR 7636 of CNRS, ESPCI, 10 rue Vauquelin, 75231 Paris Cedex 05, France F´ ed´ eration de Recherche Mati` eres et Syst` emes Complexes, UMR 7057 of CNRS (Received 28th April 2005) We report experiments on the shape and motion of millimetre-sized drops sliding down a plane in a situation of partial wetting. When the Bond number based on the component of gravity parallel to the plane Bo α exceeds a threshold, the drops start moving at a stationary velocity which increases linearly with Bo α . When this velocity is increased by tilting the plate, the drops change their aspect ratio : they become longer and thinner, but maintain a constant, millimetre-scale height. While their aspect ratio changes, a threshold is reached at which the drops are no longer rounded but develop a ‘corner’ at their rear: the contact line breaks into two straight segments meeting at a singular point or at least in a region of high contact line curvature. This structure then evolves such that the velocity normal to the contact line remains equal to the critical value at which the corner appears, i.e. to a maximal speed of dewetting. At even higher velocities new shape changes occur in which the corner changes into a ‘cusp’, and later a tail breaks into smaller drops (pearling transition). Accurate visualisations show four main results. (i) The corner appears when a critical non-zero value of the receding contact angle is reached. (ii) The interface then has a conical structure in the corner regime, the in-plane and out-of-plane angles obeying a simple relationship dictated by a lubrication analysis. (iii) The corner tip has a finite non-zero radius of curvature at the transition to a corner, and its curvature diverges at a finite capillary number, just before the cusp appears. (iv) The cusp transition occurs when the corner opening in-plane half-angle reaches a critical value of about 45 ◦ . 1. Introduction Contact line dynamics are encountered in many everyday situations and especially in industrial coating processes (Kistler & Schweizer 1997), from offset printing to the chocolate-frosting of candy. But the dynamics of wetting, although of interest in a wide range of industrial applications, still lacks a fully satisfactory physical description. Here we focus our interest on a well defined and in appearance simple problem : what happens when a liquid drop slides down a uniform, inclined plane in a situation of partial wetting ? At which velocity does it slide and what shape does it assume to accommodate capillary effects and drop motion ? Perhaps unexpectedly, these problems have received rather little attention. Available studies mostly focused on static or quasi-static drops : on yield conditions, i.e. the onset of movement of the drops (Bikerman 1950, Furmidge 1962, Dussan & Chow 1983), and on drop velocity just above onset, when the shape of the drops remains nearly circular
Transcript
Under consideration for publication in J. Fluid Mech. 1
Shape and motion of drops sliding down aninclined plane
By NOLWENN LE GRAND, ADRIAN DAERRAND LAURENT LIMAT
Laboratoire de Physique et Mecanique des Milieux Heterogenes (PMMH)
UMR 7636 of CNRS, ESPCI, 10 rue Vauquelin, 75231 Paris Cedex 05, France
Federation de Recherche Matieres et Systemes Complexes, UMR 7057 of CNRS
(Received 28th April 2005)
We report experiments on the shape and motion of millimetre-sized drops sliding downa plane in a situation of partial wetting. When the Bond number based on the componentof gravity parallel to the plane Boα exceeds a threshold, the drops start moving at astationary velocity which increases linearly with Boα. When this velocity is increased bytilting the plate, the drops change their aspect ratio : they become longer and thinner,but maintain a constant, millimetre-scale height. While their aspect ratio changes, athreshold is reached at which the drops are no longer rounded but develop a ‘corner’ attheir rear : the contact line breaks into two straight segments meeting at a singular pointor at least in a region of high contact line curvature. This structure then evolves suchthat the velocity normal to the contact line remains equal to the critical value at whichthe corner appears, i.e. to a maximal speed of dewetting. At even higher velocities newshape changes occur in which the corner changes into a ‘cusp’, and later a tail breaksinto smaller drops (pearling transition). Accurate visualisations show four main results.(i) The corner appears when a critical non-zero value of the receding contact angle isreached. (ii) The interface then has a conical structure in the corner regime, the in-planeand out-of-plane angles obeying a simple relationship dictated by a lubrication analysis.(iii) The corner tip has a finite non-zero radius of curvature at the transition to a corner,and its curvature diverges at a finite capillary number, just before the cusp appears.(iv) The cusp transition occurs when the corner opening in-plane half-angle reaches acritical value of about 45.
1. IntroductionContact line dynamics are encountered in many everyday situations and especially
in industrial coating processes (Kistler & Schweizer 1997), from offset printing to thechocolate-frosting of candy. But the dynamics of wetting, although of interest in a widerange of industrial applications, still lacks a fully satisfactory physical description. Herewe focus our interest on a well defined and in appearance simple problem : what happenswhen a liquid drop slides down a uniform, inclined plane in a situation of partial wetting ?At which velocity does it slide and what shape does it assume to accommodate capillaryeffects and drop motion ?
Perhaps unexpectedly, these problems have received rather little attention. Availablestudies mostly focused on static or quasi-static drops : on yield conditions, i.e. the onsetof movement of the drops (Bikerman 1950, Furmidge 1962, Dussan & Chow 1983), andon drop velocity just above onset, when the shape of the drops remains nearly circular
2 N. LE GRAND, A. DAERR, L. LIMAT
(a) Rounded drop (b) Corner (c) Pearling drop
Figure 1. Drops sliding down a partially wetting solid surface, pictures from Podgorski(2000). Motion is from top to bottom in (a) and (b), and from left to right in (c).
(Dussan 1985, Kim, Lee & Kang 2002). However, concerning the motion and shape of thedrops far above the onset, there has been really very few works. In a recent experiment,our group performed careful observations on silicone oil drops sliding down a glass platecoated with fluoropolymers (Podgorski, Flesselles & Limat 2001). They showed thatastonishing shape changes occur when the velocity U of the drop is increased. WhenU exceeds a critical value Uc, the drops are no longer rounded as in figure 1(a) and a‘corner’ develops at the rear of the drops (figure 1(b)). Such singularities are surprisingconsidering the enormous capillary pressure which the high surface curvature inducesnear the corner tip. At higher velocities other shape changes occur in which a ‘cusp’forms and, for even higher velocities, a liquid tail develops at the corner tip, leading todroplet deposition, which was referred to as ‘pearling’ (figure 1(c)).
These phenomena were qualitatively related to previous observations of what happenswhen a plate or a tape is pulled out of a bath in the same conditions of partial wetting.Above the critical velocity Uc (maximum speed of dewetting), a triangular film edged bytwo contact lines forming a similar corner is entrained on the tape with droplet depositionat the corner tip (Blake & Ruschak 1979). In both cases (drops and tapes), this transitionto a corner shape is supposed to postpone a forced dynamic wetting transition (Blake& Ruschak 1979, Podgorski et al. 2001), in turn supposed to occur when the dynamicreceding contact angles vanishes (hypothesis first proposed by Derjaguin & Levi (1964)).To summarise, its inclination allows the contact line to move normally to itself at thecritical velocity Uc, while the whole drop (or tape) moves at a larger velocity U. Thecorner opening angle is thus linked to the drop or plate velocity by a ‘Mach cone type’relationship of the kind Uc = U sinϕ. These qualitative considerations leave unresolvedthe detailed theoretical understanding of these surprising shape changes of sliding drops,that have become a challenge for theoretical modelling. For the moment, only the roundedto corner transition has been investigated (Ben Amar, Cummings & Pomeau 2001 and2003), and also the interface and flow structure in the corner tip (Stone et al. 2001, Limat& Stone 2004). In the first reference a saddle-point structure of the corner tip is assumed,which allows to both impose a vanishing contact angle at contact line and limit thepressure divergence. On the contrary, in the second reference, the interface is supposed toassume a conical, self-similar, structure, which increases the pressure divergence usuallyinvolved in hydrodynamic models of contact line dynamics (Cox 1986, Voinov 1976).
In the present paper we revisit the experiment by Podgorski and co-workers with a new,improved, setup. A simple visualisation method enables us to get simultaneous pictures
Shape and motion of drops sliding down an inclined plane 3
of the drops taken from above and from the side. These two simultaneous views provideinformation on the three-dimensional structure of the interface which was impossible withour previous visualisation method. An appropriate lighting gives a very strong contrastto these pictures (the drops appearing black on a light background) from which severalgeometrical quantities are extracted as a function of the capillary number, includingthe dynamic contact angles and the opening angles of the corner. Among other results,we found that in the corner regime the interface at the rear of the drop has a conicalstructure, and that this structure appears for a non-zero value of the dynamic recedingcontact angle. This contrasts with what was commonly believed up to now (Blake &Ruschak 1979, Podgorski et al. 2001, Ben Amar et al. 2001). Also, the tip of the cone isin fact rounded at small scale, its curvature diverging progressively until the cusp regimeappears.
There are several motivations for the present study. Firstly, understanding the cornerformation is important for coating applications (Kistler & Schweizer 1997) where thiseffect limits the efficiency of coating devices (maximal speed of wetting or dewetting, dy-namic wetting failure, air trapping. . . ). Secondly, there has been recently a great interestin singularity formation at interfaces (Cohen & Nagel 2002), with possible applicationsfor micro-fabrication (encapsulation processes. . . ). When a corner is formed on a slidingdrop, one is faced with a point-singularity at the intersection of two line-singularities(contact lines), which can be important for deposition on a solid surface. Finally, it isone of the simplest wetting experiment that one can imagine to test available contactline models (de Gennes 1986, Voinov 1976, Cox 1986, Blake & Ruschak 1997, Pomeau2000, Eggers, to be published. . . ). Here we compare our measurements of dynamic con-tact angles at the front and rear of the drops to four of these models.
The structure of our paper is as follows. In section 2, we first describe the experimentand specify its physical conditions (fluid, surface, image acquisition etc. . . ). In section3 we describe qualitatively the different observed regimes (oval drops, corner, cusp, andpearling drops). In section 4 we present quantitative results concerning the motion of thedrops (onset of motion, dependency of the velocity on plate inclination. . . ). In section 5we investigate the evolution of the shape of the drops for an increasing capillary number,through several quantities : aspect ratio, dynamic contact angles, and opening angles ofthe corner. Finally, in section 6, we submit a synthesis of the results, attempting to givea unified picture of the evolution of drop shapes when the capillary number (i.e. the dropvelocity) is changed. We also try to establish connections with recent available models ofthe corner (Stone et al. 2001, Limat & Stone 2004, Ben Amar et al. 2001). Preliminarymeasurements and a brief account of some of the results in our paper are available intwo recent issues of European Coating Symposia (Limat et al. 2001, Daerr et al. 2003).
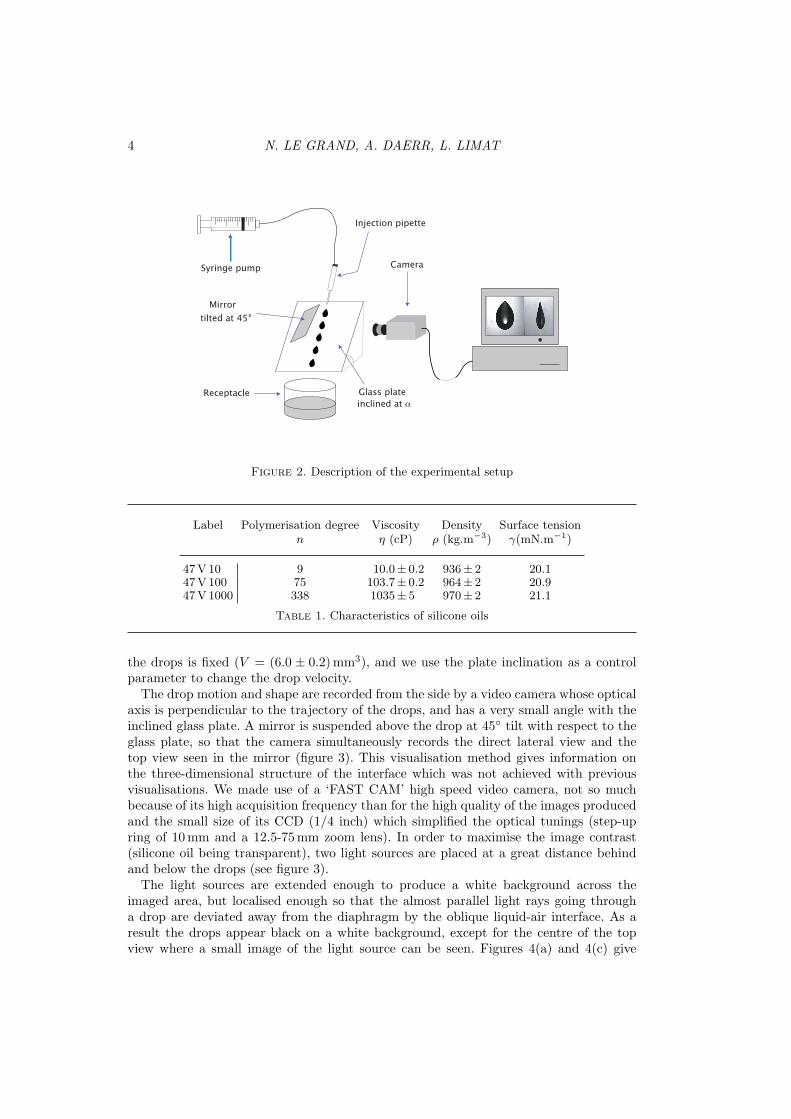
2. Experimental setupAs depicted in figure 2, millimetre-size drops of silicone oil are emitted at a frequency
of about 0.5 Hz by a capillary tube (Pasteur pipette) connected to a syringe-pump. Thedrops fall at the top of a 22 x 22 cm glass plate coated with fluoropolymers (FC-725 by3M) which provide partial wetting conditions for silicone oils (Podgorski 2000), the staticcontact angles being close to 50. Using silicone oils (PDMS : CH3[Si(CH3)2O]nSi(CH3)3)allows us to vary the viscosity η (via the polymer chain length n) over two orders ofmagnitude at almost constant surface tension and density. The main characteristics ofthe oils used are summarised in table 1.
The drops slide down the inclined plate at constant speed — the terminal velocity isreached within a few millimetres below impact — and constant shape. The volume of
4 N. LE GRAND, A. DAERR, L. LIMAT
Figure 2. Description of the experimental setup
Label Polymerisation degree Viscosity Density Surface tensionn η (cP) ρ (kg.m−3) γ(mN.m−1)
the drops is fixed (V = (6.0 ± 0.2) mm3), and we use the plate inclination as a controlparameter to change the drop velocity.
The drop motion and shape are recorded from the side by a video camera whose opticalaxis is perpendicular to the trajectory of the drops, and has a very small angle with theinclined glass plate. A mirror is suspended above the drop at 45 tilt with respect to theglass plate, so that the camera simultaneously records the direct lateral view and thetop view seen in the mirror (figure 3). This visualisation method gives information onthe three-dimensional structure of the interface which was not achieved with previousvisualisations. We made use of a ‘FAST CAM’ high speed video camera, not so muchbecause of its high acquisition frequency than for the high quality of the images producedand the small size of its CCD (1/4 inch) which simplified the optical tunings (step-upring of 10mm and a 12.5-75mm zoom lens). In order to maximise the image contrast(silicone oil being transparent), two light sources are placed at a great distance behindand below the drops (see figure 3).
The light sources are extended enough to produce a white background across theimaged area, but localised enough so that the almost parallel light rays going througha drop are deviated away from the diaphragm by the oblique liquid-air interface. As aresult the drops appear black on a white background, except for the centre of the topview where a small image of the light source can be seen. Figures 4(a) and 4(c) give
Shape and motion of drops sliding down an inclined plane 5
Figure 3. In our visualisation method, the drops appear dark on a light background. Thisdiagram is built in the plane perpendicular to both the inclined plate and the direction of dropmotion.
examples of the simultaneous top and side views of the drops (respectively on the leftand right-hand side of the picture). The side view shows the reflection of the drop inthe glass plate in addition to the drop itself. From the movies we extract the velocity ofthe drops for different plate inclinations, as well as geometrical quantities including theadvancing and receding dynamic contact angles, as will be detailed in section 5.2.
3. Description of the different drop regimesAt different stationary speeds (obtained by changing the plate inclination), the drops
adopt different shapes which are particularly well discriminated by looking at the topviews. At low velocities the drops take an oval shape as shown in figure 4(a). If the velocityof the drops is increased, a corner develops at the rear of the drops. This transition seemsat first continuous : the radius of curvature of the contact line at the rear decreases, andtwo straight line segments appear on both sides of the tip. Consequently, we first have a‘rounded-corner’ (figure 4(b)), and only for higher velocities the tip appears to be sharp(figure 4(c)). We will see that the distinction between the oval and the corner regimeis justified by the corner in-plane opening angle which defines a precise transition point(section 5.4.1) : it varies sharply from 90 to smaller values just at this transition. Thecorner shape is surprising, considering that surface tension is usually thought to opposethe formation of such a singularity. As one can judge from the side views, the interfacehas a conical structure when the corner regime is well enough developed. This point willbe discussed in more details in section 5.4.4.
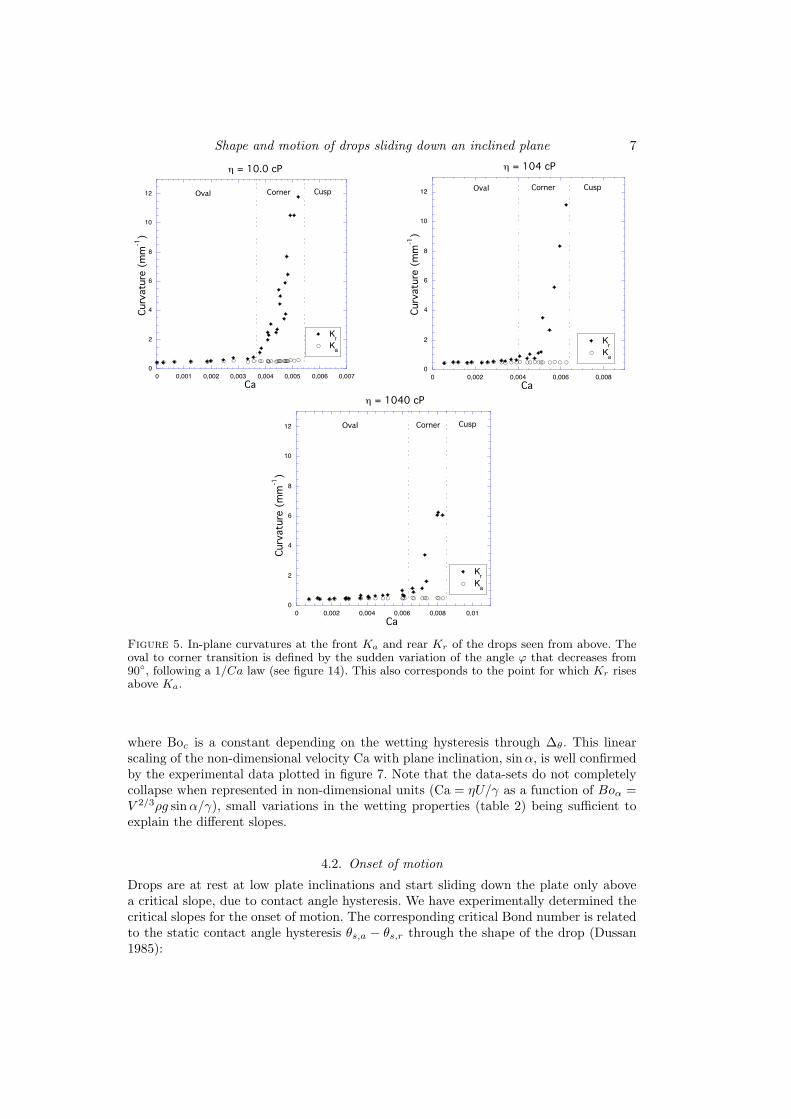
To describe the ‘oval’ to ‘corner’ transition more accurately, the curvatures in the planeof the substrate, measured at the front Ka and at the rear of the drops Kr, are plottedin figure 5 versus the capillary number Ca = ηU/γ (defined upon the drop velocity U ,the liquid viscosity η and its surface tension γ), along with a description of the observedshapes. The curvature at the front of the drop remains practically constant, whatever theregime. On the contrary, the curvature at its rear is equal to the front curvature only fora stationary or slowly moving drop, and it increases rapidly at higher velocity. It can benoted that the point for which Kr rises above Ka corresponds to the transition from ovaldrops to corners. We can see that the curvature at the rear remains finite throughoutthe corner regime, but sharply diverges for a finite capillary number, which seems tocoincide with the transition from ‘corner’ to ‘cusp’. Indeed, for even higher velocities, a
6 N. LE GRAND, A. DAERR, L. LIMAT
(a) Oval drop Ca= 2.85 10−3(b) Corner Ca =4.95 10−3 (c) Corner Ca = 5.14 10−3
(d) Cusp Ca= 7.07 10−3 (e) Pearls Ca= 7.19 10−3
Figure 4. Top views (along with side views for (a) and (c)) of drops sliding down an inclinedplate for increasing velocities, η= 104 cP. The motion is from top to bottom except for figure(e) where it is from left to right.
cusp begins to form at the rear of the drop, i.e. the contact line is bent outwards closeto the tip (figure 4(d)). It is remarkable to see that this shape change occurs precisely atthe capillary number at which the curvature of the tip diverges.
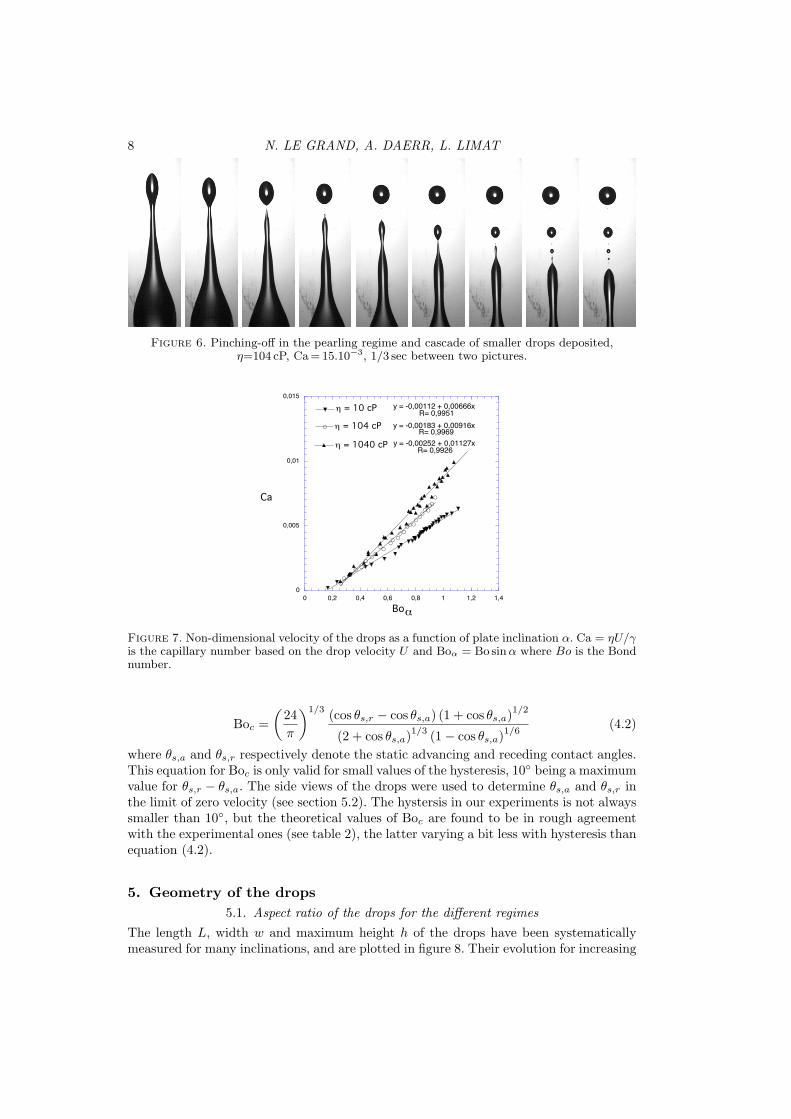
Above yet another critical velocity, a pearling transition characterised by the emissionof droplets from the tip of the cusp occurs (figure 4(e)). The size of the droplets increaseswith the velocity of the drops, and eventually the pinching-off produces a cascade ofsmaller droplets in a process akin to the pinching-off below a dripping faucet (see figure 6).
4. Motion of drops4.1. Velocity of drops and plate inclination
After the drops start sliding down the plate, their stationary velocity U is an increasingfunction of the plate inclination angle α. To illustrate this, figure 7 shows the evolutionof the capillary number Ca = ηU/γ versus an effective Bond number based on thecomponent of gravity parallel to the plane : Boα = Bo sinα = V 2/3(ρg/γ) sinα, whereBo is the ‘true’ Bond number. These two dimensionless parameters are those used inPodgorski et al. (2001). Indeed, three forces are acting on the drops : their weight, aviscous drag on the glass plate, and the interfacial forces. The in-plane components ofthese forces respectively scale as : ρV g sinα, −ηUV 1/3, and −γV 1/3∆θ, where the non-dimensional factor ∆θ depends on the contact angle distribution along the perimeter andon the perimeter shape. The force balance implies the following scaling law :
Ca ' Boα − Boc (4.1)
Shape and motion of drops sliding down an inclined plane 7
Figure 5. In-plane curvatures at the front Ka and rear Kr of the drops seen from above. Theoval to corner transition is defined by the sudden variation of the angle ϕ that decreases from90, following a 1/Ca law (see figure 14). This also corresponds to the point for which Kr risesabove Ka.
where Boc is a constant depending on the wetting hysteresis through ∆θ. This linearscaling of the non-dimensional velocity Ca with plane inclination, sinα, is well confirmedby the experimental data plotted in figure 7. Note that the data-sets do not completelycollapse when represented in non-dimensional units (Ca = ηU/γ as a function of Boα =V 2/3ρg sinα/γ), small variations in the wetting properties (table 2) being sufficient toexplain the different slopes.
4.2. Onset of motion
Drops are at rest at low plate inclinations and start sliding down the plate only abovea critical slope, due to contact angle hysteresis. We have experimentally determined thecritical slopes for the onset of motion. The corresponding critical Bond number is relatedto the static contact angle hysteresis θs,a − θs,r through the shape of the drop (Dussan1985):
8 N. LE GRAND, A. DAERR, L. LIMAT
Figure 6. Pinching-off in the pearling regime and cascade of smaller drops deposited,η=104 cP, Ca =15.10−3, 1/3 sec between two pictures.
Figure 7. Non-dimensional velocity of the drops as a function of plate inclination α. Ca = ηU/γis the capillary number based on the drop velocity U and Boα = Bo sin α where Bo is the Bondnumber.
Boc =(
24π
)1/3 (cos θs,r − cos θs,a) (1 + cos θs,a)1/2
(2 + cos θs,a)1/3 (1− cos θs,a)1/6(4.2)
where θs,a and θs,r respectively denote the static advancing and receding contact angles.This equation for Boc is only valid for small values of the hysteresis, 10 being a maximumvalue for θs,r − θs,a. The side views of the drops were used to determine θs,a and θs,r inthe limit of zero velocity (see section 5.2). The hystersis in our experiments is not alwayssmaller than 10, but the theoretical values of Boc are found to be in rough agreementwith the experimental ones (see table 2), the latter varying a bit less with hysteresis thanequation (4.2).
5. Geometry of the drops5.1. Aspect ratio of the drops for the different regimes
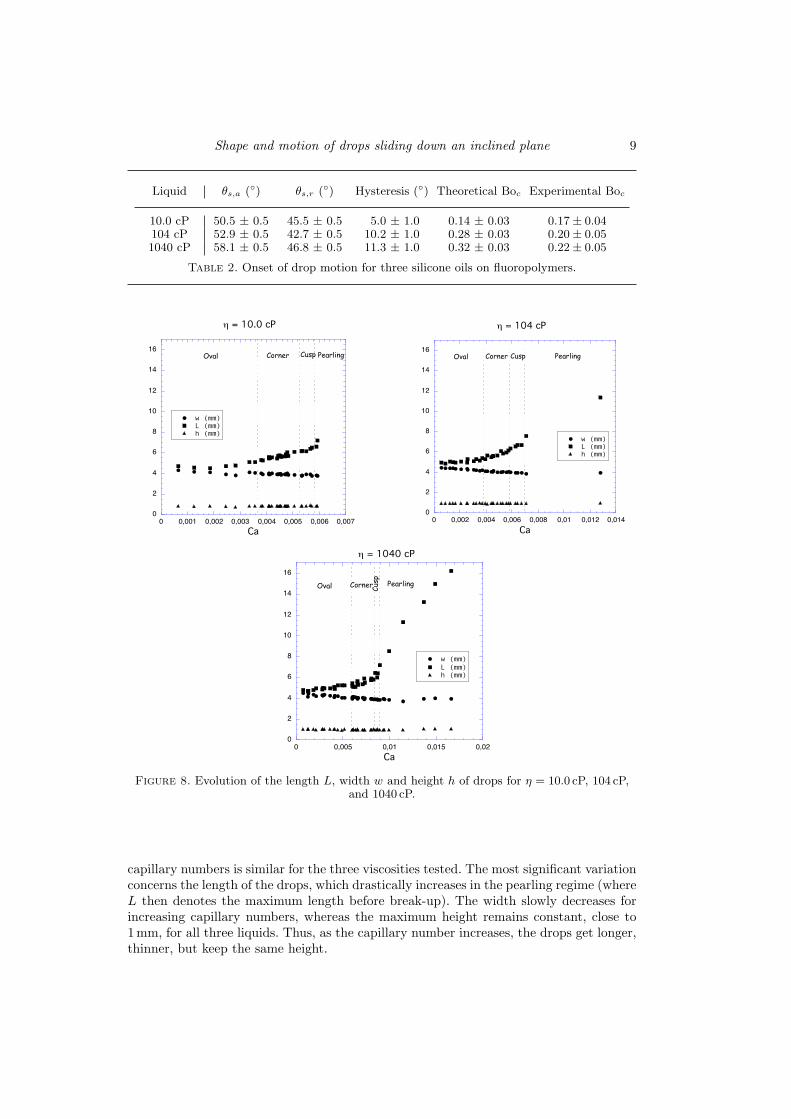
The length L, width w and maximum height h of the drops have been systematicallymeasured for many inclinations, and are plotted in figure 8. Their evolution for increasing
Shape and motion of drops sliding down an inclined plane 9
Table 2. Onset of drop motion for three silicone oils on fluoropolymers.
Figure 8. Evolution of the length L, width w and height h of drops for η = 10.0 cP, 104 cP,and 1040 cP.
capillary numbers is similar for the three viscosities tested. The most significant variationconcerns the length of the drops, which drastically increases in the pearling regime (whereL then denotes the maximum length before break-up). The width slowly decreases forincreasing capillary numbers, whereas the maximum height remains constant, close to1 mm, for all three liquids. Thus, as the capillary number increases, the drops get longer,thinner, but keep the same height.
10 N. LE GRAND, A. DAERR, L. LIMAT
θ
θ
r
a
Figure 9. Measuring contact angles withcircles. The motion is from top to bottom.
Figure 10. Advancing and recedingcontact angles for η = 10.0 cP
5.2. Dynamic contact angles for rounded dropsUsing the side view of a drop, the dynamic advancing contact angle θa at the front andthe dynamic receding contact angle θr at the rear of the drops can be measured. Thisexperiment is one of the simplest giving the opportunity to test dynamic wetting models.Figure 9 shows how we measure the contact angles by adjusting two circles tangent tothe surface near the tips to fit the contour of the drops. The angle at the intersectionof the circles is then calculated. It turns out that interactively adjusting the circles tofit the contour yields a much better precision and reproducibility (typically 1-2) thansimply adjusting a wedge made up of two straight line segments. This method gives amacroscopic estimate of the dynamic contact angles at a millimetre scale.
The resulting measurements for silicone oils are plotted as a function of capillarynumber in figure 10, for η = 10.0 cP, the plots for the two other viscosities being verysimilar (see figure 18 later). As expected, the advancing contact angle increases with dropspeed, while the receding angle becomes smaller. At rest the angles can range anywherebetween the critical values θs,a = 46 and θs,r = 51. This relatively small interval of 5,referred to as wetting hysteresis, is another indicator of a very clean and homogeneoussurface, in addition to the observed perfectly regular motion of the drop.
The most important observation from the contact angle measurements is that thecorner occurs for a finite receding contact angle of about 21 for the present viscosity.For a viscosity of 104 or 1040 cP, the critical receding angles for the corner regime arerespectively around 23 and 26. This contrasts with the hypothesis of Blake (Blake &Ruschak 1979) and Podgorski (2000) that the corner shape occurs when the recedingcontact angle reaches zero.
5.3. Dynamic contact angles: comparison with modelsWe now compare different models of wetting dynamics to our above experimental data : deGennes’ model, Cox-Voinov’s law, a molecular-kinetic model, and finally a linear modelof the mobility law linking dynamic contact angles to the capillary number. To startwith, de Gennes’ wetting model (de Gennes 1986) assumes that the air-liquid interfaceis locally planar. The liquid therefore forms a wedge, advancing or receding on a solidsurface. By writing down an energy balance, truncated at a microscopic dimension a anda macroscopic one b, he obtains :
θ(θ2 − θ2s) = ±6 ln(b/a)Ca (5.1)
Shape and motion of drops sliding down an inclined plane 11
where θs denotes a statical equilibrium value of the contact angle (hysteresis being ne-glected). The + symbol refers to an advancing contact line and the − symbol to a recedingone. Note that this equation suggests a dynamic forced wetting transition of first order(with discontinuity of contact angle) occurring for θ = θs/
√3, whereas all the follow-
ing models are rather consistent with a second order one. Cox and Voinov’s approach(Cox 1986, Voinov 1976) consists in solving Stokes’ equations assuming a slowly changingslope of the air-liquid interface, down to microscopic scales. Similar to the approach ofde Gennes, the solution is truncated at molecular and macroscopic dimensions, givingthe following law :
θ3 − θ3s = ±9 ln(b/a)Ca = ±Ca/A (5.2)
where A = 1/[9 ln(b/a)]. The exact formula given by Voinov is more complex, but it canbe simplified as written above for contact angles smaller than 3π/4 (Blake & Ruschak1997), which is always the case in our experiments here. In the molecular-kinetic modelof wetting (Blake & Ruschak 1997, Ruijters, Blake & De Coninck 1999), the approachis very distinct from the two former ones. The dissipation at contact line is supposedto be dominated by individual molecular displacements at a frequency f , disturbing theadsorption equilibrium at the wetting line. Hence one gets :
θ2 − θ2s = ±
(vNkT
2πfLm~
)Ca (5.3)
where v is called the molecular flow volume, N the number of adsorption sites per unitarea, k the Boltzmann constant, T the absolute temperature, Lm the length of an in-dividual displacement, and finally, ~, the reduced Planck constant. It is here interestingto remark that all the three so-called ‘mobility laws’ reminded above can be writtenas P (θ, θs) ' Ca where P is third or second order polynomial. This polynomial can ofcourse be linearised at low Ca values, which sometimes enables to simplify calculationsof wetting or dewetting flows (Ben Amar et al. 2001, Ben Amar et al. 2003, Pomeau2002). This results in a simplified linear model :
θ − θs ∝ ±U (5.4)
that has been proposed in fact long ago by Dussan (1979), before becoming a bit forgottenin view of the noticeable curvature of most available experimental data (Blake & Ruschak1997):
All these possible descriptions of contact line dynamics neglect wetting hysteresis,which complicates the comparison between models and experimental data. A simplifica-tion very often encountered, made by most experimentalists, consists in identifying thestatic contact angle to the limit static angle observed on each branch of the mobility law(i.e. to θs,a for the ‘advancing’ curve, and to θs,r for the ‘receding’ case). This hypothesishas never been proved, but, intuitively, could be reasonable in situations of low hystere-sis, as occurs here. Speaking differently, this point of view implicitly assumes that thehysteresis effect can be reduced to a simple shift of the mobility laws. To simplify thevisualisation, we found convenient to plot the quantities θ − θs, θ2 − θ2
s , θ(θ2 − θ2s), and
θ3−θ3s , versus the algebraic capillary number Ca, Ca > 0 corresponding to the advancing
contact line at the drop front, and Ca < 0 to the receding contact line, and where θs hasbeen identified to the static limit angles.
One can see in figure 11 that all these models seem to match fairly well the data in alarge range of capillary number. Clearly, our data cannot be used to rule out any of themdefinitely. On the other hand, each of them is affected by specific drawbacks and hasspecific advantages. First, de Gennes’ model seems to fail very near the forced wetting
12 N. LE GRAND, A. DAERR, L. LIMAT
(a) -1
-0,5
0
0,5
1
-0,006 -0,004 -0,002 0 0,002 0,004 0,006
θ 3- θ
s
3
(ra
d3)
Ca
(b) -0,6
-0,4
-0,2
0
0,2
0,4
-0,006 -0,004 -0,002 0 0,002 0,004 0,006
θ 2- θ
s
2
(ra
d2)
0,6
Ca
(c) -0,8
-0,6
-0,4
-0,2
0
0,2
0,4
0,6
0,8
-0,006 -0,004 -0,002 0 0,002 0,004 0,006
θ (
θ 2-
θs
2 )
(ra
d3)
Ca
(d)
Ca
Figure 11. Comparing several models for the dynamics of wetting, η = 10.0 cP. (a)Cox–Voinov,(b)molecular-kinetic, (c) de Gennes, (d) linear.In this figure exclusively, in order to highlight the similarity or discrepancy between the slopes ofthe advancing and receding parts, the ordinates have been plotted versus the algebraic capillarynumber Ca. Ca is positive for the advancing branch and negative for the receding one.
transition, where an unexpected ‘plateau’ is observed. Also, the molecular-kinetic modeland the linear description do not preserve the symmetry between wetting and dewetting.The right hand part of the curve and the left hand part do not exhibit the same slopeat zero capillary number. There is of course no known reason for ‘nature’ to favour thissymmetry, but it is a fact that the Cox-Voinov representation of the data does preservethis symmetry. One can check on fig. 11-a that the slope at zero capillary number is indeedthe same for both positive and negative capillary number. With this respect, though -again - we can not extract from our data a definite proof in favour of Cox and Voinov’smodel, this symmetry is a strong indication in favour of this classical hydrodynamicapproach, at least for our experiments on smooth and weakly hysteretic substrates. Itis why, in the subsequent sections of our paper we have made an intensive use of thismodel.
Moreover, this symmetry survives a change in viscosity, as can be checked in table 3for three different oils. For the three oils, the value of the constant A = 1/[9 ln(b/a)](θ3− θ3
s = ±Ca/A) is found to be identical, or at least rather close, for both wetting and
Shape and motion of drops sliding down an inclined plane 13
Liquid a(n) (nm) a(√
n) (nm) A for a=a(n) A for a=a(√
n) Experimental Experimentaladvancing A receding A
Table 4. Ratio θc/θs,r observed experimentally. De Gennes’ model would imply a ratio equal
to 1/√
3 = 0.577.
dewetting. Also, in the same table, it is possible to check that the measured values for Aare consistent with orders of magnitude of the relevant spatial scales acting at microscopicscales. The value of the constant A = 1/[9 ln(b/a)] can be estimated as follows. Thetypical size of the drops (i.e. 1mm) will be taken for the macroscopic dimension b,and the size of the molecules of silicone oil (PDMS : CH3[Si(CH3)2O]nSi(CH3)3) for themolecular dimension a. Knowing that the distance between a silicon and an oxygen atomin PDMS is lSi−O =0.160 nm and that the angle β = SiOSi equals 144.0, thereforelSi−Si =2lSi−O sin(β/2) =0.30 nm, and the total length of an accordion-like silicone oilmolecule would be a(n) =nlSi−Si. If the molecules are very flexible, the typical diameterof the molecule will be a(
√n) =
√nlSi−Si, supposing a random walk. We might expect
the true molecule size, and microscopic cut-off a, to be somewhere between these twoestimates of the molecular dimension. From table 3 we see that the experimental valuesare in excellent agreement with the corresponding values for A. To our knowledge, thisis the first time that a variation in the molecule size is shown to consistently modify themicroscopic cut-off length in a hydrodynamic model, and this observation is also anotherindication in favor of this hydrodynamical approach.
Yet, we must also mention that even Cox-Voinov model has a particular drawback. Asstated more above, rather than predicting a forced wetting transition for a non-zero valueof contact angle, this one is expected for a vanishing contact angle. This is in apparentcontradiction with our finding a non-zero critical value for the appearance of the corner.Only de Gennes’ model does predict such a transition for a non zero critical angle θc.At this point, despite the problems faced with de Gennes’ model in the description ofour data, it is interesting to seek if this critical angle we found experimentally is closeto that predicted by de Gennes’ approach. In table 4, we have reported the static angleswith the involved hysteresis, the critical angle and the ratio of its value to the recedingcontact angle for the three oils used. As appears in this table, the ratio θc/θs,r is close tode Gennes’ prediction 1/
√3 = 0.577, at least for the two most viscous oils, but remains
definitely smaller. In conclusion, no model seems to describe perfectly and completelyour data. The better consistency seems to be reached with the Cox-Voinov model : in
Figure 13. Two possible definitions ofthe angle ϕ for a cusped drop: ‘inflectionpoint measurement’ and measurement per-formed at the tip.
this representation, the data preserve the symmetry between wetting and dewetting, butdo not exhibit a forced wetting transition at vanishing dynamic contact angle. On theother hand, de Gennes’ model recovers the non-zero observed critical angle, but its valueis slightly too high and there are problems with the description of the data very nearthis transition.
5.4. Beyond rounded drops : corners and cuspsWe now concentrate on what happens after the transition to a corner shape, and soexamine the evolution of the opening angles of the cone from the top views, denoted ϕ,and from the side views, denoted Ω (figure 12).
5.4.1. In-plane corner opening angleThe in-plane opening angle ϕ is defined unambiguously for corners, for which we used
exactly the same ‘circles’ method as that previously explained in section 5.2, as shown infigure 12. This angle is however more difficult to define for cusped drops since, contrary tothe corner drops, there is a sign change in the curvature of the contact line at the rear. Assuggested in figure 13, two different estimates of ϕ have been measured, one defined at thetip of the drops, and the other defined at the change in sign of the contact line curvature,that we called ‘inflection point measurement’. This latter definition corresponds to theangle spanned by the tangents to the contact line at the curvature inflection points,without taking into account the tip of the drop. It turned out that the ‘inflection point’definition had a better consistency with measurements performed in the corner regime, asappears on figure 14, where we have plotted the evolution of sinϕ versus Ca. This specificmeasurement of sinϕ for the cusped drops aligns with the corner ones on a continuouscurve, suggesting the relevance of the ‘inflection point’ measurement .
As appears on the same figure, sin ϕ can be fitted with a 1/Ca law, as had alreadybeen reported by Podgorski et al. (2001). In his paper, following ideas going back toBlake and Ruschak (Blake & Ruschak 1979), Podgorski explains this 1/Ca law and thecorner formation itself as follows. When the velocity is progressively increased from zero,the dynamic receding contact angle θr = f(Ca) decreases and vanishes for a criticalvelocity Uc. At this threshold, a forced wetting transition should occur at which thedrop should leave a continuous Landau-Levich film behind itself. To minimise surface
Shape and motion of drops sliding down an inclined plane 15
inflection point measurement
corner measurement
tip measurement
Figure 14. Evolution of sin ϕ versus the capillary number for a viscosity η=1040 cP. Dotted line :predictions of equation (5.5), the prefactor being deduced from contact angle measurements onoval drops. Continuous line : predictions of equation (5.6), the critical angle θc being the recedingcontact angle at which he corner is formed.
energy variations the system would ‘choose’ to incline the contact line with respect tothe direction of motion in order to keep the component of velocity normal to the lineequal to Uc. If one assumes that the dynamic contact angle is only a function of thisnormal component of velocity, this statement is equivalent to saying that the ‘corner’appears when the dynamic contact angle reaches zero and that once it has appeared,this contact angle stays equal to zero on each of the two tilted contact line segments.Equation (5.2) then indeed implies that:
sinϕ =θ3
s
9 ln( ba )Ca
∝ 1Ca
(5.5)
As mentioned more above, considering our contact angle measurements, the dynamicreceding contact angle does not vanish when the corner regime begins, which seems torule out this interpretation. This also appears when one tries to directly test equation(5.5) on our data, using the values of A = 1/[9 ln(b/a)] extracted up above from ourcontact angle measurements. When plotted on figure 14 (in dotted lines), the law clearlyoverestimates the measurements of sin ϕ. However, the qualitative argument used byPodgorski and Blake can be saved if one assumes now that in the corner regime, thereceding contact angle, instead of vanishing, stays always equal to the critical contactangle θc identified above, at which the corner appears. This leads now to a new lawdescribing sinϕ, still satisfying a 1/Ca dependance, but with a different prefactor :
sinϕ =θ3
s − θ3c
9 ln( ba )Ca
(5.6)
As can be seen in figure 14 (continuous line), this law fits now very well the data. Insummary, we have shown that instead of satisfying a zero contact angle, the corner seemsto accommodate a uniform and constant dynamic receding contact angle on each of itstwo contact lines, this contact angle being equal to θc. This is reminiscent of the fact thatthe forced wetting transition occurs for a non-zero receding contact angle as suggestedin de Gennes’ model, which value is very close to the θc value found in our experiments(see table 4). Let us repeat here that a paradoxical result of our measurements is the
16 N. LE GRAND, A. DAERR, L. LIMAT
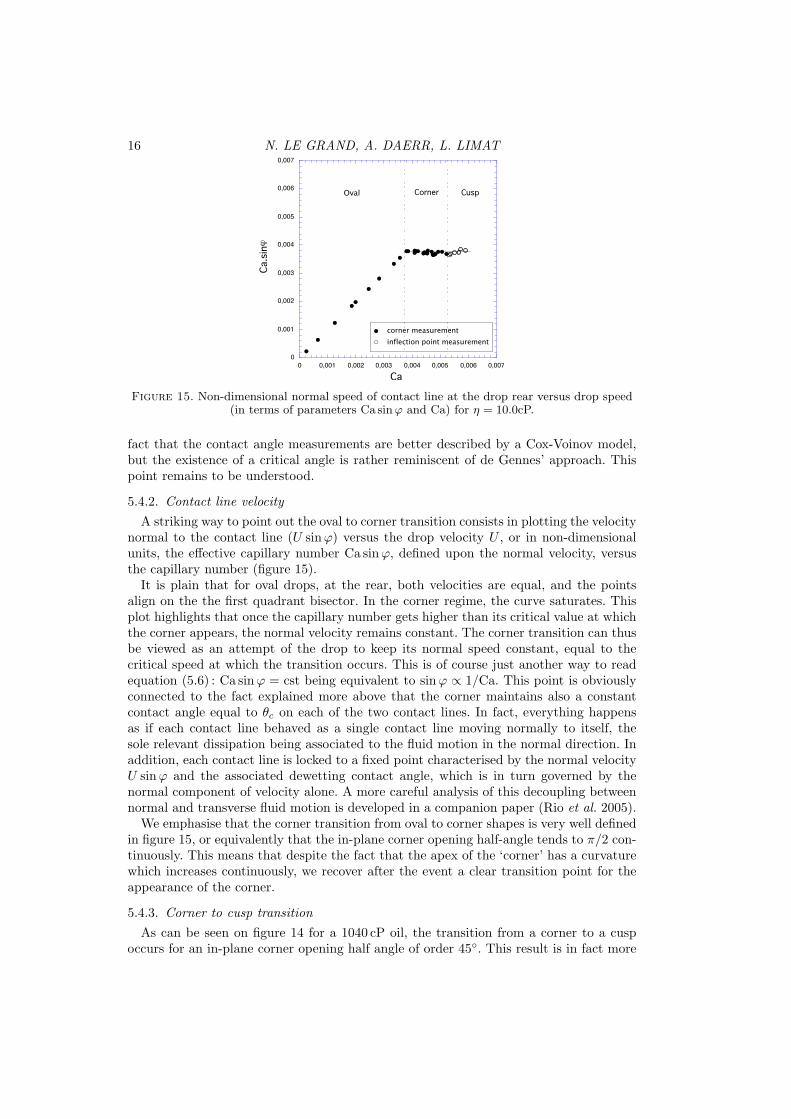
Figure 15. Non-dimensional normal speed of contact line at the drop rear versus drop speed(in terms of parameters Ca sin ϕ and Ca) for η = 10.0cP.
fact that the contact angle measurements are better described by a Cox-Voinov model,but the existence of a critical angle is rather reminiscent of de Gennes’ approach. Thispoint remains to be understood.
5.4.2. Contact line velocityA striking way to point out the oval to corner transition consists in plotting the velocity
normal to the contact line (U sinϕ) versus the drop velocity U , or in non-dimensionalunits, the effective capillary number Ca sinϕ, defined upon the normal velocity, versusthe capillary number (figure 15).
It is plain that for oval drops, at the rear, both velocities are equal, and the pointsalign on the the first quadrant bisector. In the corner regime, the curve saturates. Thisplot highlights that once the capillary number gets higher than its critical value at whichthe corner appears, the normal velocity remains constant. The corner transition can thusbe viewed as an attempt of the drop to keep its normal speed constant, equal to thecritical speed at which the transition occurs. This is of course just another way to readequation (5.6) : Ca sinϕ = cst being equivalent to sinϕ ∝ 1/Ca. This point is obviouslyconnected to the fact explained more above that the corner maintains also a constantcontact angle equal to θc on each of the two contact lines. In fact, everything happensas if each contact line behaved as a single contact line moving normally to itself, thesole relevant dissipation being associated to the fluid motion in the normal direction. Inaddition, each contact line is locked to a fixed point characterised by the normal velocityU sinϕ and the associated dewetting contact angle, which is in turn governed by thenormal component of velocity alone. A more careful analysis of this decoupling betweennormal and transverse fluid motion is developed in a companion paper (Rio et al. 2005).
We emphasise that the corner transition from oval to corner shapes is very well definedin figure 15, or equivalently that the in-plane corner opening half-angle tends to π/2 con-tinuously. This means that despite the fact that the apex of the ‘corner’ has a curvaturewhich increases continuously, we recover after the event a clear transition point for theappearance of the corner.
5.4.3. Corner to cusp transitionAs can be seen on figure 14 for a 1040 cP oil, the transition from a corner to a cusp
occurs for an in-plane corner opening half angle of order 45. This result is in fact more
Shape and motion of drops sliding down an inclined plane 17
Figure 16. Continuity of Ω and θr, andcomparison between the experimental val-ues of Ω and the Limat–Stone model for aviscosity η=10.0 cP
Figure 17. Law giving Ω = f(Ca). The solid linesrepresent equation (5.9) for all three viscosities.The filled rectangular symbols are for the corners,and the empty triangular ones for the cusps.
general and holds for the two other viscosities used (see for instance figure 18, later inthe text). Careful analysis of our data leads to a transition angle equal to :
ϕ = 47± 2 (5.7)
This is somewhat surprising compared to previous results reported by Podgorski (2000),who suggested a transition close to 30. In fact, Podgorski’s visualisation method didnot allow to distinguish very accurately what happened very close to the tip of thedrops, and this transition was also rather defined for the pearling regime, both sourcesof discrepancies being difficult to evaluate. It is however to note that our value of ϕat the transition to a cusp is very close to that announced in a recent paper from BenAmar et al. (2001), though the model used in this paper (saddle point corner tip) is incontradiction with the conical shape of the interface that we found. This issue clearlydeserves more accurate future studies.
5.4.4. Out-of-plane cone angleSince the tail of the drop has a conical shape (at least when the corner tip becomes
highly curved) it is clear that in this regime the angle measured from the side views atthe rear of the drop can no longer be interpreted as a receding contact angle. Indeed,the contact line has a singularity at the rear and the vertical cross-section seen on theside views is nowhere perpendicular to the contact line. Instead, a ‘cone opening angle’is measured, which we denote Ω (see figure 12). We can note however that there isno discontinuity between the values of the receding contact angle θr below the criticalcapillary number of the corner transition and Ω above it, as shown in figure 16. It is alsoworth noticing that above the transition, the values of Ω decrease but are still non-zeroat the onset of the pearling regime.
Recently, Limat and Stone proposed a similarity solution of Stokes’ equation at therear of a sliding drop, in which the interface has indeed a conical shape (Limat & Stone2004). Considering the flow inside the corner in the context of lubrication theory, theauthors explain how Ω and ϕ should be related by the following equation:
tan3 Ω =32Ca tan2 ϕ (5.8)
18 N. LE GRAND, A. DAERR, L. LIMAT
A simple approach based on a parabolic estimate and lubrication analysis, as explainedin the appendix, also gives out this equation. The plot in figure 16 shows that the mea-surements of Ω and [(3/2)Ca tan2 ϕ]1/3 match relatively well, which confirms that thismodel is suitable for the description of the tip of the drops after the corner transition.Since both equation (5.6), giving sinϕ = f(Ca), and equation (5.8), giving Ω as a func-tion of ϕ, appear to be in good agreement with our data, let us combine them in orderto extract a law giving Ω versus Ca :
tan3 Ω =32Ca tan2
(arcsin
θ3s − θ3
c
9 ln(b/a)Ca
)(5.9)
We have compared in figure 17 this law with our data of Ω for the three viscosities used.The agreement is remarkable if one considers the complexity of the physics underlyingboth equations (5.6) and (5.8), which constitute clearly rather crude estimates of thereality. It is however to note that this representation of the data allows us to evidencenoticeable discrepancies between the experiment and the model. The data obtained inthe cusp regime are clearly below the theoretical curve and the expected divergence of Ωnear the corner appearance is screened by something that remains unexplained, possiblythe fact that the corner is rounded.
6. Conclusion : towards a unified description of corners and relatedtransitions
Concerning the problem of the drop shape, the present study allows us to draw thefollowing conclusions. These are summarised in figure 18, where the angles measured aresummed-up in one graph for each tested viscosity, and compared with some of the lawsfound in the paper.
At first, when one considers the dynamic contact angles measured at the advancingand receding front of oval drops, it seems that, when compared to de Gennes’ model (deGennes 1986), to the molecular-kinetic model (Blake & Ruschak 1997), or to a linearmodel, Cox–Voinov’s hydrodynamic model (equation 5.2) has the best consistency withour measurements. In figure 18, the related fit is superimposed on the data (solid line),and as one can judge from this figure, there is a very good agreement between the modeland the data. Let us point out however that the molecular-kinetic and linear models canstill be accommodated within the scatter of our data, but the Cox–Voinov model is ableto capture the full set of data with the same value of the logarithmic prefactor for boththe receding and advancing angle. Though this is not strictly a proof of the validity ofthis model, this fact is a strong indication in favour of this approach.
It must be reminded that all these wetting models are only valid for the ideal case inwhich there is no hysteresis at all (θs,r = θs,a = θs). In order to take the hystersis intoaccount, we have, in a way, subtracted it to the dynamic contact angles, and obtainedsymmetrical straight lines for Cox–Voinov’s model (see figure 11), just as expected with-out any hysteresis. This seems to point out that everything happens as if the hysteresissimply induced a shift in the curves governing the mobility laws, which is not somethingobvious by the way, as it could also have induced deformations of the curves. Anyway,it must be mentioned that the hysteresis in our experiments is fairly small, and it ispossibly the reason why things are so simple here.
A second important result is that, contrary to what was up to now commonly believed,the transition to a corner occurs for a non-zero value of the receding angle reached atthe rear of the drop. This appears quite well again in figure 18 : for the three graphs, thedynamic receding angle is still non-zero when the sine of the in-plane corner opening half-
Shape and motion of drops sliding down an inclined plane 19
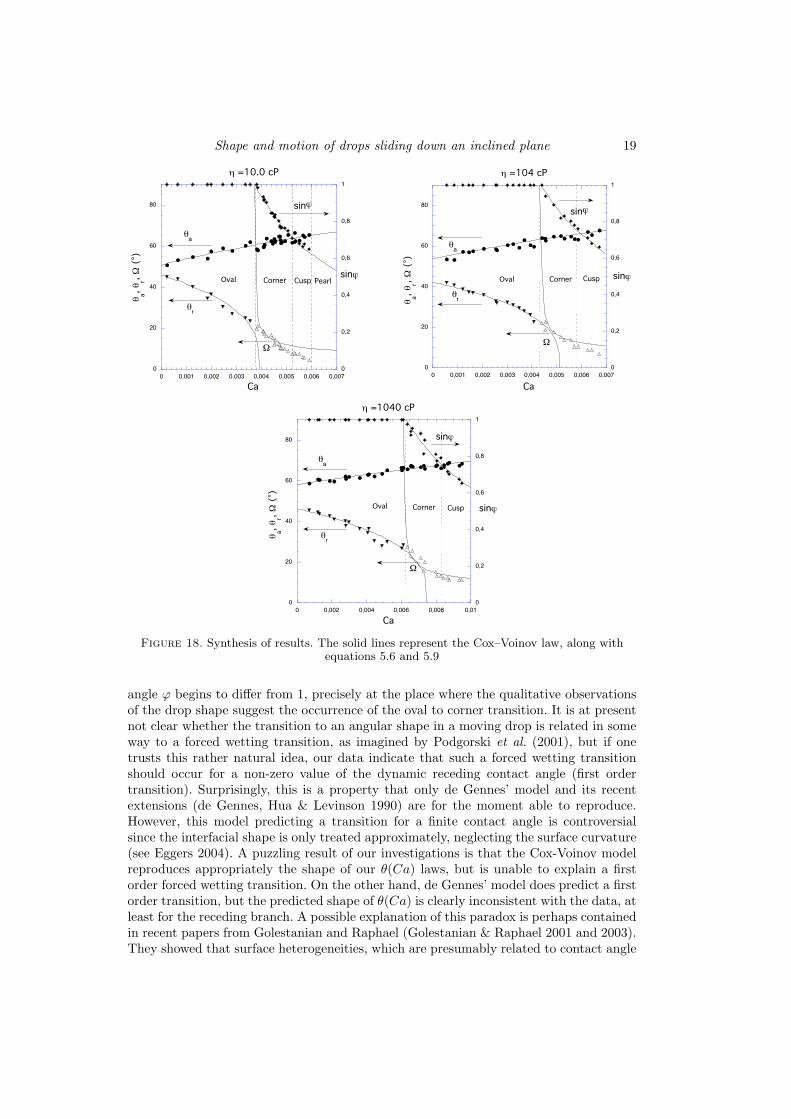
Figure 18. Synthesis of results. The solid lines represent the Cox–Voinov law, along withequations 5.6 and 5.9
angle ϕ begins to differ from 1, precisely at the place where the qualitative observationsof the drop shape suggest the occurrence of the oval to corner transition. It is at presentnot clear whether the transition to an angular shape in a moving drop is related in someway to a forced wetting transition, as imagined by Podgorski et al. (2001), but if onetrusts this rather natural idea, our data indicate that such a forced wetting transitionshould occur for a non-zero value of the dynamic receding contact angle (first ordertransition). Surprisingly, this is a property that only de Gennes’ model and its recentextensions (de Gennes, Hua & Levinson 1990) are for the moment able to reproduce.However, this model predicting a transition for a finite contact angle is controversialsince the interfacial shape is only treated approximately, neglecting the surface curvature(see Eggers 2004). A puzzling result of our investigations is that the Cox-Voinov modelreproduces appropriately the shape of our θ(Ca) laws, but is unable to explain a firstorder forced wetting transition. On the other hand, de Gennes’ model does predict a firstorder transition, but the predicted shape of θ(Ca) is clearly inconsistent with the data, atleast for the receding branch. A possible explanation of this paradox is perhaps containedin recent papers from Golestanian and Raphael (Golestanian & Raphael 2001 and 2003).They showed that surface heterogeneities, which are presumably related to contact angle
20 N. LE GRAND, A. DAERR, L. LIMAT
hysteresis, are able to increase the critical angle at which the forced wetting transitionoccurs. One can thus conceivably imagined that a Cox-Voinov approach could coexistwith a first-order transition because of this effect. In another direction, one can questionthe idea of identifying the observed shape transitions to those predicted by mobility laws.The existence of a given shape (rounded, corner, ...) is a global problem involving bothequilibrium equations of the free surface and boundary conditions at the contact line(see Dussan 1985, Ben Amar et al. 2003). Perhaps considering the whole global probleminstead of the local contact line problem can shift the transition, too...
A third result that we have obtained is that, once the corner is formed (and enoughdeveloped), the interface based on the two involved contact lines has a conical structure.This is in agreement with Stone’s model of the corner (Stone et al. 2001, Limat & Stone2004) but not with that built by Ben Amar et al. (2001) who postulates a saddle-pointstructure of the interface. This is presumably linked to the previous point, i.e. the fact thatthe contact angle does not reach zero at the corner formation, which allows the formationof a cone. Note however that except perhaps at the corner to cusp transition, the cone isnever completely developed, its tip remaining rounded. This imposes to consider Stone’smodel with caution, the completely developed conical structure imagined in these papersbeing only an idealisation of the true structure. Now, although the corner is in factrounded, the corner formation remains a well defined transition if one looks carefully atthe curves linking the sine of ϕ to the capillary number. After this transition, just as inPodgorski et al. (2001), sin ϕ follows a 1/Ca law, but, as we have shown, the predictionof the prefactor imposes to give up the initial idea of a vanishing contact angle on eachof the two contact lines forming the corner. Instead of this, our data are consistent witha dynamic receding contact angle remaining always equal to the critical angle reached atthe corner formation. This yields to a law of the kind sinϕ =
(θ3
s − θ3c
)/ [9 ln(b/a)Ca],
suggested again by the solid lines in figure 18.Our visualisation techniques also allowed us to get information concerning a second
angle ruling the conical structure of the interface, i.e. the cone angle Ω viewed from theside. At first look, the measurements are in continuity with the dynamic receding contactangle θr measured on oval drops. More quantitatively, the data are also consistent withan estimate deduced from the Limat–Stone model (equation 5.8). Its combination withthe law ruling the ϕ selection (equation reminded above) leads to a theoretical curve(solid line on the figure 18) that seems to describe reasonably well the data. A puzzlingobservation is here however that this theoretical estimate should diverge at the oval dropto corner transition, which somewhat contradicts the qualitative continuity mentionedabove between θr and Ω. We believe that this new paradox has its solution in the roundednature of the corner tip that remains to be taken into account in the model.
Finally, on the three graphs displayed in figure 18, it appears that the transition tocusped drops occurs for ϕ ∼ 45, which corresponds to a value predicted by Ben Amaret al. (2001). It is therefore possible that the latter model becomes more relevant at highcapillary numbers, around the cusp regime where the concave tip geometry could bettercorresponds to the saddle-point geometry of the model. It must also be emphasised thatthe curvature eventually tends towards infinity for a finite capillary number, close tothis transition to cusps. This could suggest a possible way to deposit on a surface amicroscopic line (see Cohen & Nagel 2002).
Let us mention that a lot of our results, especially the fact that the tip curvature ofthe corner is always finite and progressively diverges at the cusp appearance, have beenrecently recovered by direct numerical simulations involving a disjoining pressure at thecontact line (Roy, private communication). Also, even though Podgorski has alreadynoticed that, as long as one speaks in terms of Bond number, changing the size of the
Shape and motion of drops sliding down an inclined plane 21
Figure 19. Diagram of the rear of a drop on a plate moving upwards at the velocity U such thatthe drop is in the corner regime. The tail is assumed to be a corner with the opening half-anglesϕ and Ω. ζ represents the height of the the drop for a given x and y.
drops does not change their speed and shape (Podgorski et al. 2001), it would probablybe interesting to investigate the shape and motion of puddles (bigger drops flattened bygravity) sliding down a plane.
AcknowledgmentsWe would like to thank Howard Stone for comments and a critical reading of the
manuscript. We are also indebted to Bruno Andreotti for advice on this experiment andto Emmanuelle Rio, Jacco Snoeijer and Valery Roy for helpful discussions.
Appendix : a simple way to link the in-plane and out-of-plane anglesof the cone
Let (x,y,z) be the axes defined on figure 19. The tail of the drop can be approximated toa parabola, an assumption supported by the views from the side of the drops. Thereforethe height ζ of the drop can be related to x and y by :
ζ(x, y) ' Ωx
(1− y2
x2 tan2 ϕ
)(6.1)
A relationship between the angles ϕ and Ω is given by a lubrication constraint. Thebalance of downwards and upwards liquid flow in the framework of the drop gives thefollowing equation :
Uζ ' −h3
3η
∂P
∂x(6.2)
where the pressure P is close to γhyy = 2γΩ/(x tan2 ϕ). Hence we obtain :
Ω3 =32Ca tan2 ϕ (6.3)
which is the same as equation (5.8), since tanΩ ' Ω.
22 N. LE GRAND, A. DAERR, L. LIMAT
REFERENCES
Ben Amar M., Cummings L. & Pomeau Y., 2001, Singular points on a receding contact line,C. R. Acad. Sci (Paris), 329, II-b, 277–282
Ben Amar M., Cummings L.J. & Pomeau Y., 2003, Transition of a moving contact line fromsmooth to angular, Phys. Fluids, 15, p2949–2960
Bikerman J.J., 1950, Sliding of drops from surfaces of different roughness, J. Colloid Sci., 5,349–359
Blake T.D. & Ruschak K.J., 1979, A maximal speed of wetting, Nature, 282, 489–491Blake T.D. & Ruschak K.J., 1997, Wetting: static and dynamic contact lines, Liquid film
coating, scientific principles and their applications edited by Kistler S.F. & Schweizer P.M.(Chapmann & Hall, London), 63–97
Cohen I. & Nagel S.R., 2002, Scaling at a selective withdrawal transition through a tubesuspended above the fluid surface, Phys. Rev. Lett., 88, 074501
Cox R.G., 1986, The dynamics of the spreading of liquids on a solid surface, J. Fluid. Mech.,168, 169–194
Daerr A., Le Grand N., Limat L. & Stone H.A., 2003, Drops sliding along an inclined plane :Experiments versus 3D hydrodynamic model, Proceedings of the 5th European CoatingSymposium (Friburg), edited by Schweizer P.M.
Derjaguin B.V. & Levi S.M., 1964, Film coating theory, Focal Press (London)Dussan V. E.B., 1979, On the spreading of liquids on solid surfaces: static and dynamic contact
lines, Ann. Rev. Fluid. Mech., 11, 371–400Dussan V. E.B. & Chow R. T.-P., 1983, On the ability of drops or bubbles to stick to
non-horizontal surfaces of solids, J. Fluid. Mech., 137, 1–29Dussan V. E.B., 1985, On the ability of drops or bubbles to stick to non-horizontal surfaces
of solids, Part 2: small drops or bubbles having contact angles of arbitrary size, J. Fluid.Mech., 151, 1–20
Eggers J., Instability of a moving contact line, J. Fluid. Mech., to be publishedEggers J., 2004, Toward a description of contact line motion at higher capillary numbers, Phys.
Fluids, 16, 3491–3494Furmidge C.G.L., 1962, Studies at phase interfaces, I. The sliding of liquid drops on solid
surfaces and a theory for spray retention, J. Colloid Sci., 17, 309-324de Gennes P.-G., 1986, Deposition of Langmuir-Blodget layers, Coll. Polym. Sci, 264, 463–465de Gennes P.-G., Hua X. &Levinson P., 1990, Dynamics of wetting : local contact angles,
J. Fluid. Mech., 212, 55–63Golestanian R. & Raphael E., 2001, Relaxation of a moving contact line and the Landau-
Levich effect, Eurphys. Lett., 55, 228-234Golestanian R. & Raphael E., 2003, Roughening transition in a moving contact line, Phys.
Rev. E, 67, 031603Kim H.-Y., Lee H-J & Kang B.-H., 2002, Sliding of liquid drops down an inclined solid surface,
J. Colloid Sci., 247, 372–380Kistler S. F. & Schweizer P. M., 1997, Liquid film coating - Scientific principles and their
technological implications, edited by Chapmann & HallLimat L., Podgorski T., Flesselles J.-M., Fermigier M., Moal S., Stone H.A., Wilson
S.K. & Andreotti B., 2001, Shape of drops sliding down an inclined surface, Proceedingsof the 4th European Coating Symposium (Bruxelles), edited by Buchlin J.-M. & Anthoine J.
Limat L. & Stone H.A., 2004, Three-dimensional lubrication model of a contact line cornersingularity, Europhys. Lett., 65, 365–371
Podgorski T., 2000, Ruissellement en conditions de mouillage partiel, Ph. D. thesis, Paris 6University, Paris, France
Podgorski T., Flesselles J.-M. & Limat L., 2001, Corners, cusps and pearls in runningdrops, Phys. Rev. Lett., 87, 036102–036105
Pomeau Y., 2000, Representation de la ligne de contact mobile dans les equations de lamecanique des fluides, C. R. Acad. Sci. (Paris), 328, II-b, 411–416
Pomeau Y., 2002, Recent progress in the moving contact line problem : a review, C. R.Mecanique, 330, 207–222
Rio E., Daerr A., Andreotti B. & Limat L., 2005, Boundary conditions in the vicinity of a
Shape and motion of drops sliding down an inclined plane 23
dynamic contact line : Experimental investigation of viscous drops sliding down an inclinedplane, Phys. Rev. Lett., 94, 024503
Roy R.V. Modelisation and simulation of film, drops and rivulet flows, private communicationRuijters M.J., Blake T.D., De Coninck J., 1999, Dynamic wetting studied by molecular
modeling simulations of droplet spreading, Langmuir, 15, 7836–7847Stone H.A., Limat L., Wilson S.K., Flesselles J.-M. & Podgorski T., 2001, Corner
singularity of a contact line moving on a solid surface, C. R. Physique, 3, 103–110Voinov O.V., 1976, Hydrodynamics of wetting, Fluid Dynamics, 11, 714–721