- 1 - Shape-dependency activity of nanostructured CeO 2 in the total oxidation of polycyclic aromatic hydrocarbons Laura Torrente-Murciano 1, * , Alexander Gilbank 1 , Begoña Puertolas 2 , Tomas Garcia 2 , Benjamin Solsona 3 and David Chadwick 4 1 Department of Chemical Engineering, University of Bath, Bath, BA2 7AY, UK 2 Instituto de Carboquímica (CSIC), Zaragoza, Spain 3 Department d’Enginyeria Química, Universitat de Valencia, Valencia, Spain 4 Department of Chemical Engineering, Imperial College London, London, SW7 2AZ, UK Abstract A morphological phase diagram is determined to relate the effect of base concentration and temperature during the hydrothermal synthesis with the final ceria nanostructured morphology. Representative samples of nanoparticles, nanorods and nanocubes have been characterised by XRD, N 2 adsorption, TEM, XPS and Raman and catalytically tested for the total oxidation of naphthalene as a model polycyclic aromatic hydrocarbon. Ceria nanoparticles present the highest surface area and smallest crystalline size, leading to the most active of these structures. However if the catalytic activity is normalized by unit of surface area, the observed reactivity trend (nanorods < nanocubes < nanoparticles) is directly related to the concentration of surface oxygen vacancies as a result of the exposure of the (110) and (100) preferential planes. Keywords: Ceria, nanotubes, nanorods, nanocubes, nanostructures, catalytic total oxidation, VOC, naphthalene; morphological diagram * Corresponding author: Laura Torrente-Murciano ([email protected])
Transcript
- 1 -
Shape-dependency activity of nanostructured CeO2 in the total oxidation of polycyclic aromatic hydrocarbons
Laura Torrente-Murciano1, *, Alexander Gilbank1, Begoña Puertolas2, Tomas
Garcia2, Benjamin Solsona3 and David Chadwick4
1Department of Chemical Engineering, University of Bath, Bath, BA2 7AY, UK
2Instituto de Carboquímica (CSIC), Zaragoza, Spain 3Department d’Enginyeria Química, Universitat de Valencia, Valencia, Spain
4Department of Chemical Engineering, Imperial College London, London, SW7 2AZ, UK
Abstract
A morphological phase diagram is determined to relate the effect of base
concentration and temperature during the hydrothermal synthesis with the final ceria
nanostructured morphology. Representative samples of nanoparticles, nanorods and
nanocubes have been characterised by XRD, N2 adsorption, TEM, XPS and Raman
and catalytically tested for the total oxidation of naphthalene as a model polycyclic
aromatic hydrocarbon. Ceria nanoparticles present the highest surface area and
smallest crystalline size, leading to the most active of these structures. However if the
catalytic activity is normalized by unit of surface area, the observed reactivity trend
(nanorods < nanocubes < nanoparticles) is directly related to the concentration of
surface oxygen vacancies as a result of the exposure of the (110) and (100)
preferential planes.
Keywords: Ceria, nanotubes, nanorods, nanocubes, nanostructures, catalytic total
Determination of the morphological phase diagram of CeO2 nanostructures.
Shape-dependency of physical properties on nanostructured ceria
Relationship between surface oxygen vacancies and VOCs full oxidation
activity.
1. Introduction
Ceria is a well-known rare earth material which presents a highly desirable
combination of chemical and physical properties [1]. It has a high oxygen storage
capacity (OSC) and high ion conductivity, a high dielectric constant and it shows high
transparency in the visible and near IR region while being a highly efficient UV
absorber. As a consequence, it is used in a wide range of applications such as
electrochemistry [2], optics [3], fuel cells [4], etc. A major application is in the field
of catalysis, either as a catalyst itself or as a catalyst support, where its main use is as
a component in the three-way catalytic system to reduce automobile exhaust gases
[5]. In many of these catalytic applications, a shape-dependency activity of ceria has
been observed [6] likely due to the selective exposition of surface planes, being the
(100) surface catalytically more active than the (111) and (110) surfaces [7]. Surface
plane exposure can be gained by controlling the morphology at the nanoscale, as a
way of enhancing the catalytic activity and redox properties at the same time as the
surface area is increased [8]. As an example, the dominated surface plane of
morphologies such as nanocubes or nanorods is (100) which make them more active
for CO oxidation than conventional ceria [9].
Consequently, different approaches have been followed to synthesise CeO2
nanostructures including the use of templates [10], complexing agents [6],
- 3 -
electrochemical deposition [11], sol – gel method [12], precipitation followed by
aging [13], hydrothermically using mineralizer agents [14], etc… Among these, the
hydrothermal synthesis is considered the simplest, additive-free and economic
method. However, the establishment of a robust and normalised hydrothermal
manufacturing method remains elusive and a major challenge lies in the controlled
manipulation of the nano-morphology in order to carefully tune its properties. Base
concentration and temperature treatment have been found to be key parameters
determining the final nano-morphology [9, 15] during the hydrothermal synthesis.
Additionally, the variety of set-ups and even conditions used for the hydrothermal
syntheses, often with adventitious temperature inhomogeneities, leads to difficulties
in relating defined conditions to morphological structure.
In recent years, nanocrystalline ceria has been identified as one of the most active
catalysts for the total oxidation of a polycyclic aromatic hydrocarbons (PAH) [16].
PAHs are known to be carcinogenic and are associated with a number of other serious
health hazards [17-18]. Therefore, it is important that convenient, practical and cost
effective methods are developed for atmospheric PAH abatement. Previous studies
have focused on the influence of the ceria nanoparticles’ preparation variables, with
the aim of determining which catalyst features are required for naphthalene total
oxidation as PAHs model compound. Factors such as crystallite size, surface area and
oxygen defect concentration have been identified as key parameters [19-20].
However, there is no available information in the literature related to the presence of
preferential surface planes which can promote the catalytic activity for naphthalene
removal.
In this paper, we report on the determination of a morphological phase diagram which
relates the effect of base concentration and temperature of the hydrothermal treatment
- 4 -
with the final CeO2 nanostructured morphology. Representative shapes (nanoparticles,
nanorods and nanocubes) have been tested for naphthalene total oxidation in order to
correlate the physico-chemical properties of ceria with its catalytic oxidation activity.
2. Experimental
2.1 Synthesis and characterization of materials
The standard hydrothermal method was based on that previously reported [9]. 0.6 g of
Ce(NO3)3∙6H2O were added to a 40 mL NaOH solution in the range of 1 to 20 M and
stirred magnetically during 10 minutes in a PTFE beaker. The solution was placed in
a 45 mL Teflon lined autoclave inside an air-circulating oven which allows
gradientless temperature to be achieved throughout the autoclave. The temperature
range studied is 70 to 180 ºC at a set synthesis time of 10 hours. Following
hydrothermal synthesis, the autoclave was allowed to cool to ambient temperature.
The powder obtained was filtered, washed several times with deionised water and
dried at 120 ºC overnight. Large particles of agglomerated dry powder were broken in
a mortar prior to further investigation. The phase identification of the samples was
done by X-ray diffraction (XRD) analyses using an X'Pert PRO diffractometer by
PANalytical with a Cu Kα radiation, operated at 40 kV and 40 mA. Low temperature
nitrogen adsorption measurements at 77K were done using a Micromeritics ASAP
2020 apparatus. Specific surface area was calculated by the BET method (associated
error of ±0.5 %) and pore size distributions were calculated from the desorption data
using the BJH model. Samples were degassed at 150 ºC prior to analysis to calculate
specific surface area. A JEOL 2010 microscope was used for transmission electron
- 5 -
images and a JSM6400 microscope for scanning electron images. X-ray photoelectron
spectroscopy (XPS) measurements were made on an Omicron ESCA+ photoelectron
spectrometrer using a non-monochromatized MgKα X-Ray source (hv = 1253.6 eV).
Analyser pass energy of 50 eV was used for survey scans and 20 eV for detailed
scans. Binding energies are referenced to the C1s peak from adventitious
carbonaceous contamination, assumed to have a binding energy of 284.5 eV. XPS
data were analysed using CasaXPS software. Shirley background subtraction was
applied to all the raw data. All the peaks of the corrected spectra were fitted with a
Gaussian-Lorentzian shape function to peak fit the data. Iterations were performed
using the Marquardt method. Standard deviations were always lower than 1.5%.
2.2 VOC catalytic oxidation
Catalytic activity tests for naphthalene oxidation were carried out in a fixed bed
laboratory micro-reactor. Blank tests were conducted by passing naphthalene (450
vppm) through an empty reactor that was heated from 100 ºC to 350 ºC at a rate of 10
ºC∙min-1 showing no conversion. Catalysts (pelletized to 0.1 - 0.2 mm particle size
without any binder) were tested using a 3/8” o.d quartz tube as the reactor. The
reaction feed consisted in all cases of ca. 450 vppm naphthalene in a mixture of 20
vol.% oxygen and 80 vol.% helium. A total flow rate of 50 ml∙min-1 was used and the
catalysts occupied a constant volume, giving a GHSV of ca. 25000 h-1 for all the
catalysts. Analyses were performed by an on-line gas chromatograph with thermal
conductivity and flame ionization detectors. The catalytic activity was measured over
the temperature range of 100-275 ºC, in incremental steps of 25 ºC, and temperatures
were controlled by a thermocouple, placed in the catalyst bed. Data was obtained at
each temperature after the naphthalene adsorption equilibrium was accomplished and
- 6 -
steady state activity attained. Four consistent analyses were made at each temperature
and average values were calculated. The reaction temperature was increased and the
same procedure followed to determine each data point. Oxidation activity was
expressed as a yield of carbon dioxide closing the mass balance within ±10%. The
associated error for the conversion values is ± 5%.
3. Results and discussion
3.1 Morphological phase diagram
Transmission electron microscopy (TEM) images of samples synthesised at different
temperatures (between 70ºC and 180ºC) and a range of NaOH concentrations (from 1
to 15 M) during 10 hours of hydrothermal treatment were used to determine the
morphological phase diagram (Figure 1). The phase boundaries were estimated taking
into consideration the relative concentration of different nanostructures at given
conditions but they did not imply a sharp transition to a pure phase. At low
temperatures (<100ºC), no formation of nano-structured ceria is observed when the
concentration of base is lower than 10 M. Under these conditions, nanoparticulated
ceria is observed with dimensions > 5 nm (Figure 2). Increasing the base
concentration to > 10M at low temperatures (70ºC) results in the formation of 1D
nanostructures with diameters of ~ 7 nm and lengths in the range of 20 – 80 nm with
the simultaneous presence of nanoparticles.
The formation of nanorods (20 – 70 nm length) is observed even at low base
concentrations of 1M when the temperature is increased to 100ºC with a high
presence of small particles (< 5 nm). At a constant synthesis temperature of 100ºC, an
increase in the base concentration leads to an increase in the concentration of the
nanorods in detriment of the nanoparticles.
- 7 -
At a temperature of 150ºC, ceria nanorods are mainly formed over a wide range of
base concentrations. At low NaOH concentrations (1M), the co-presence of
nanoparticulated ceria is observed. On the other hand, at high base concentrations
(15M), the formation of ceria nanocubes is observed. Increasing the hydrothermal
temperature to 180ºC favours the formation of mainly nanocubes, although at low
base concentration (<5M), nanocubes co-exist with nanorods and nanoparticulated
structures.
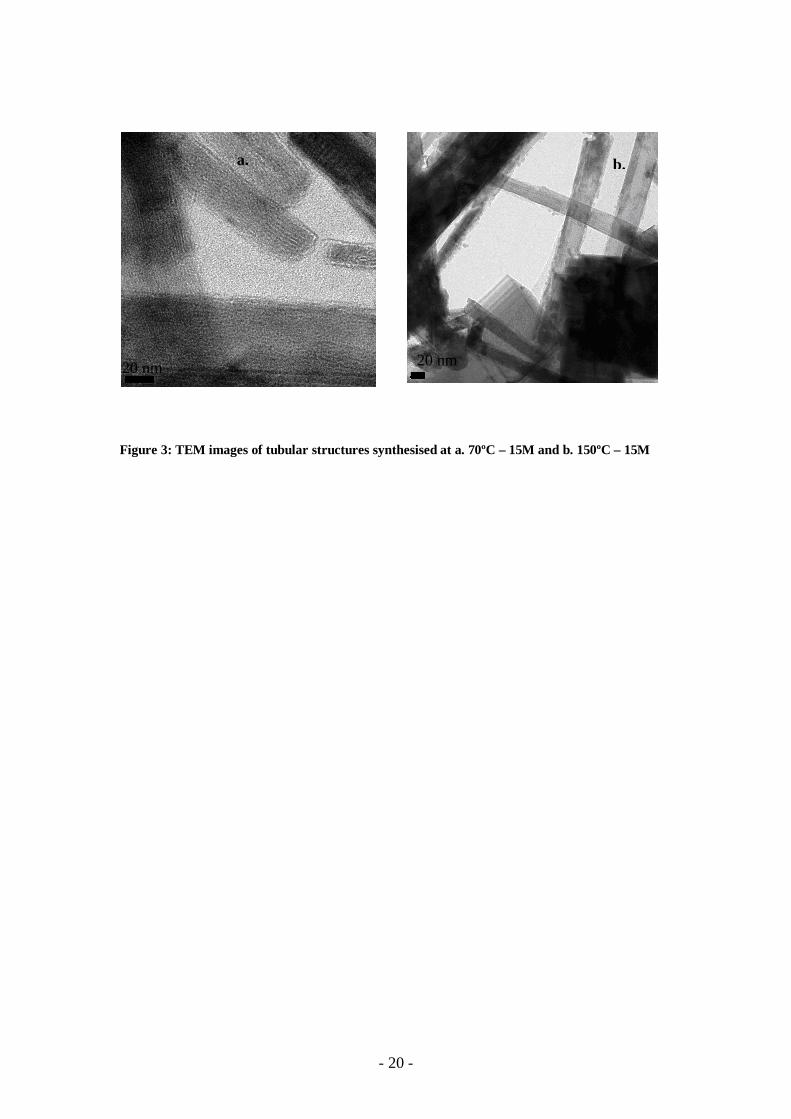
The diameter and length of the nanorods increases as the temperature and base
concentration used during the hydrothermal syntheses increases. In this way, nanorods
synthesised at 70ºC and a base concentration of 10M show an average diameter of 7
nm and length in the range of 20 – 80 nm. Nanorods of 40-60 nm diameters and
several micrometres length are formed at 150ºC and a NaOH concentration of 15M
(Figure 3b).
In some of the samples synthesised under the studied conditions, a relatively small
concentration of nanocrystals were observed surrounding the nanorods and/or
nanocubes. These observations were in agreement with the established
dissolution/recrystallization mechanism of formation of ceria nanostructures under
hydrothermal methods [21-22]. At low temperature and low base concentration, the
dissolution/recrystallization rate is slow, resulting in the formation of ceria
nanoparticles from the anisotropic Ce(OH)3 nuclei initially formed in the solution.
When the temperature and/or base concentration are increased, the chemical potential
to drive the anisotropic growth of the Ce(OH)3 nuclei is higher, forming ceria
nanorods. At even higher temperatures and/or concentration of base, the Ce(OH)3
nuclei are oxidized into ceria with a nanocube morphology [9].
- 8 -
Representative samples of the three different ceria nanostructures (nanoparticles,
nanorods and nanocubes) obtained under the studied range of hydrothermal conditions
were further characterised. The hydrothermal conditions used for their synthesis are
indicated with red circles in Figure 1. Nanoparticulated ceria with dimensions >5 nm
was synthesised by hydrothermal treatment at 70ºC and a base concentration (NaOH)
of 1M. Detailed TEM images of these nanoparticles are shown in Figure 2 where the
crystalline layers can easily be distinguished with enclosing (111) and (100) facets.
Increasing the treatment temperature to 150ºC, ceria nanorods are mainly formed,
independent of the base concentration within the studied range. Figure 3 shows TEM
images of nanorods synthesised under different hydrothermal conditions. Nanorods
are formed of several parallel crystalline layers with enclosing (110) and (100) facets
similar to the ones previously reported [15]. No evidence of hollow structures are
observed as previously claimed for nanotubular structures synthesised by other
methods [8]. Under certain conditions, monocrystal cylindrical nanostructures are
surrounded by nanoparticles [15] as clearly shown in Figure 3b. Finally, ceria
nanocubes with enclosing (100) facets are formed at hydrothermal temperatures >
180ºC with a variety of size lengths from 20 to 200 nm as shown in Figure 4.
Nanoparticles, nanorods and nanocubes were analysed by XRD (Figure 5) revealing a
crystalline structure with diffraction peaks at 2θ angles of 28.5º, 33.0º, 47.4º, 56.3º,
69.6º and 76.7º which corresponds to the (111), (200), (220), (311), (400) and (331)
respectively of the crystalline planes of the pure cubic phase (ceria fluorite structure,
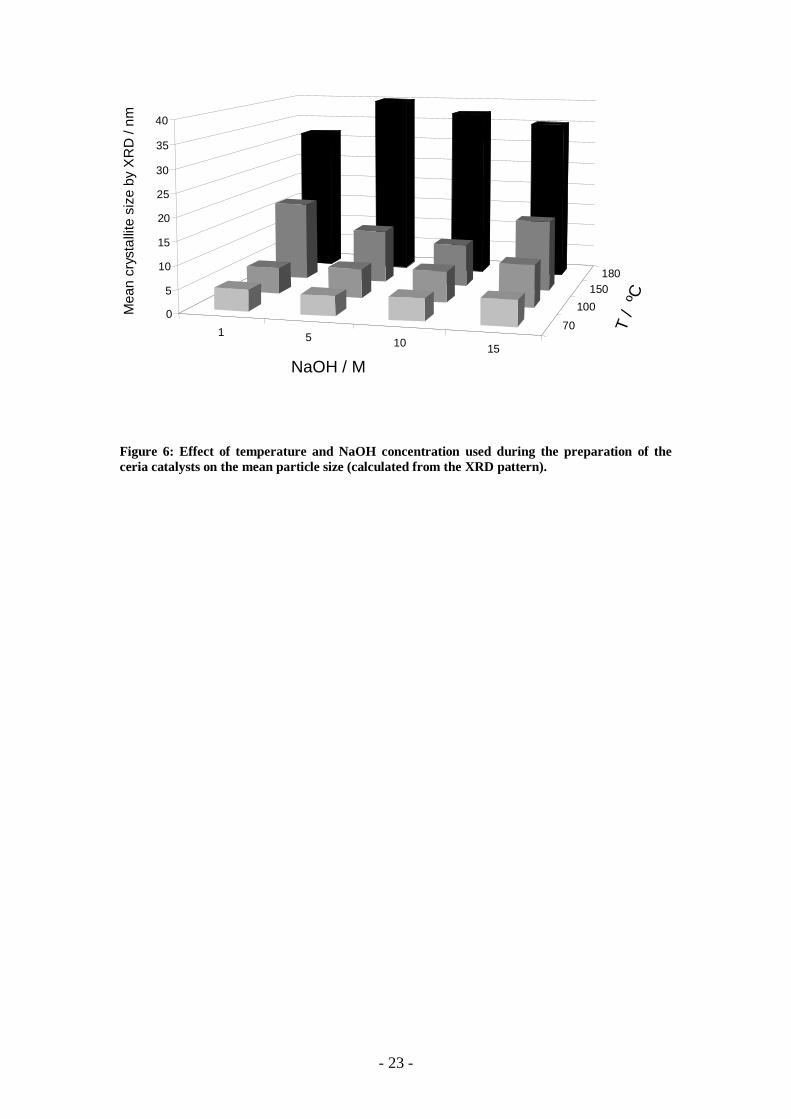
JCPDS 34-0394). The mean crystallite size was determined using the Scherrer’s
equation [10]. For a given base concentration, the crystallite size increases as the
temperature increases. The effect of the base concentration at a constant temperature
on the crystallite size is though less crucial (Figure 6). Samples synthesised at 70ºC
- 9 -
show a mean crystallite size of ca. 5nm which corresponds to the nanoparticulated
ceria observed by microscopy. By increasing the temperature for a constant base
concentration, both the diameter and length of the nanorods increase. A further
increase of the hydrothermal temperature leads to the formation of nanocubes with
narrower XRD diffraction peaks indicating an increment of the mean crystallite size,
up to 30 – 40 nm at 180ºC. This data is entirely consistent with the observations by
microscopy discussed above. Similar tendencies were observed at all temperatures
and base concentrations in the studied range.
3.2 Oxidation of naphthalene
The characterised representative samples of each morphology (particles, rods and
cubes) were used in a catalytic study of the total oxidation of naphthalene. The
conversion of the different ceria nanostructures with respect to temperature is shown
in Figure 7. CeO2 nanoparticles showed the highest activity towards full oxidation
followed by CeO2 nanorods. Both catalysts were remarkably more active than CeO2
nanocubes. All three catalysts showed 100% selectivity at conversions of about 20%
and above. Below this conversion value, CO2 remained the main product but small
amounts of other products such as phenanthrene, naphthalene dione, dimethyl
phthalate, benzene, alkyl benzenes, benzaldehyde, toluene and xylenes were also
identified. The selectivity to CO2 increased with the naphthalene conversion; this
trend was similar for all these catalysts independently of the reaction temperature at
which high conversions were reached. Thus, the morphology does not seem to have
an influence on the selectivity to CO2, but it does strongly influence catalyst activity.
A catalytic activity of 90% conversion to carbon dioxide, using a space velocity of
25,000 h-1 was achieved at only 190ºC with the ceria nanoparticles, which is amongst
- 10 -
the best ceria catalysts reported in the literature to date [16, 19, 23-26]. This high
activity is believed to be related to the high surface area and small crystallite size of
the nanoparticles, as previously reported in the literature [16, 19-20]. Accordingly, a
decrease in activity is observed as the surface area decreases and the crystalline size
increases from ceria nanoparticles to nanorods and nanocubes. On the other hand, if
one considers the catalytic activity of the different ceria nano-morphologies per unit
of surface area (Table 1), a different reactivity trend is drawn, the most active
morphology being nanorods, followed by nanocubes and finally nanoparticles. Low
levels of conversion (<20%) are considered for this comparison to avoid potential
mass transfer limitations in low surface area catalysts.
XPS analyses were used to investigate surface oxidation states of the different ceria
nanostructures. Figure 8 shows the XPS spectra of Ce3d. It can be seen that no
appreciable major differences between catalysts were observed. Two principal peaks
of Ce3d5/2 and Ce3d3/2, and four satellite peaks resulting from ionization attributed to
Ce(IV) can be observed at 881.7 , 888.4, 897.8, 900.3, 906.5 and 916.1 eV. A shift
towards higher values occurs in the case of ceria nanocubes, likely to be due to the
presence of more labile Ce4+-O bonds on the ceria surface. Thus, it can be concluded
that the main valence of surface cerium was Ce4+ [27], albeit the existence of a low
percentage of Ce3+ cannot be ruled out due to the presence of three small peaks at
878.5, 885 and 903.0 eV [28]. Again a shift to higher values was observed in the case
of ceria nanocubes. Although it is possible in theory to determine the surface ratio of
Ce3+ and Ce4+, in practice it can be difficult to achieve, as effects such as charging and
line broadening make the amounts of both oxidation states difficult to quantify
Nevertheless, the amount of Ce3+ was tentatively calculated from the XPS spectra of
Ce3d (Figure 8) according to published methods [29] (see Table 2). All the samples
- 11 -
analysed contained predominantly surface Ce4+ with different amounts of Ce3+
depending on their morphology; ceria nanorods contained a higher amount of Ce3+
(16.4%) followed by ceria nanocubes (13.9%), being the lowest amount of Ce3+ for
ceria nanoparticles (13.6%). The presence of higher amounts of surface Ce3+ could
probably be related to a higher presence of surface oxygen defects as previously
reported in the literature [30].
XPS studies concentrating on oxygen species were also conducted (see Figure 9). In
the case of photoemission from oxygen, the O1s signal clearly shows two different
surface oxygen species. The low binding energy peak (O: 529.0-530.5 eV) is
ascribed to lattice oxygen whereas the high binding energy peak (O: 531.0-532.8 eV)
is assigned to oxygen vacancies but also to surface adsorbed oxygen, hydroxyl, and
carbonate groups [31]. Despite this, the XPS O/O ratio is a common way to roughly
assess the amount of oxygen vacancies in the different ceria samples. As seen in
Table 2, ceria nanorods present the highest O/O ratio and the lowest is obtained in
the case of the nanoparticles. Summarizing, similar conclusions can be drawn from
Ce3d and O1s XPS analyses; the concentration of surface oxygen vacancies decreases
from ceria nanorods < nanocubes < nanoparticles. The same trend was observed in the
catalytic activity per surface area of these nanostructures for the naphthalene
oxidation, highlighting the importance of the amount of oxygen defects on the
catalytic activity of ceria [32].
Complementary data can be drawn from the Raman analyses of the different CeO2
nanostructured. A similar spectra is obtained for the three different morphologies (see
Figure 10) showing a single dominant band centred at a frequency of 462 cm-1,
characteristic of the CeO2 vibrations. Table 2 summarises the full width at half
maximum (FWHM) of the main Raman band. Some authors [33] have associated the
- 12 -
increase of the FWHM with a decrease in the crystallite size and/or a higher
concentration of oxygen vacancies of the CeO2. Nanocubes present the lowest width
but also the highest particle size. Therefore the comparison of the amount of oxygen
vacancies in the nanocubes with that of the other two ceria catalysts (nanorods and
nanoparticles) is not straightforward. However, if nanorods and nanoparticles are
compared some information can be attained. The FWHM in nanorods is marginally
higher than in the nanoparticles in spite of the higher crystallite size of nanorods.
These observations suggest that out of the three morphologies studies, the amount of
oxygen vacancies is higher for the nanorods [34-36]. It must be indicated that the
internal strain can also contribute to a higher width of this band. Raman results are
also in agreement with the results obtained by XPS and with some previous works
[37-38].
The variation on the concentration of surface oxygen defects on the different ceria
nano-morphologies is believed to be related to the crystalline layers selectively
exposed in each structure. Thus, higher catalytic activities per unit of surface area are
observed on the surface of CeO2 nanorods and nanocubes with enclosing (110) and
(100) facets and (100) facets, respectively. Additionally it can be seen that the
position of the O binding energy differs depending on the morphology since O
binding energies corresponding to ceria nanocubes are shifted to higher values. This
fact could be related to a higher mobility of the lattice oxygen in the case of ceria
nanocubes with enclosing (100) facets as it has been previously reported [39]. On the
other hand, the (111) planes exposed on the nanoparticles presented the lowest
catalytic activity per unit surface area for the full oxidation of naphthalene. This data
is in agreement to molecular simulation results. Computer modelling showed that the
low-index (111) surface has the lowest surface energy and is thus the most stable
- 13 -
surface [40]. Similarly Conesa et al [41] indicated that less energy is required to form
oxygen vacancies on (110) and (100) than on (111).
The link between exposed planes and the catalytic performance of ceria for the
oxidation polycyclic aromatic hydrocarbons such as naphthalene has not been
experimentally reported yet. However, the influence of the exposed planes on the
catalytic performance for the oxidation of CO has been widely studied being in
agreement with the observations of this study for the oxidation of polycyclic aromatic
hydrocarbons. According to Tana et al [42], the CeO2 nanoparticles mainly expose the
stable (111) plane on the surface, whereas the rod-shaped nanostructures
preferentially expose the reactive (110) and (100) planes, giving higher oxygen
storage capacity and catalytic activity for CO oxidation. In another work Zhou et al
[43], showed that CeO2 nanorods with well-defined reactive planes ((001) and (110))
show higher CO oxidation activity than CeO2 nanoparticles because of their more
reactive planes.
4. Conclusions
A morphology phase diagram showing different ceria nanostructures (particles, rods
and cubes) has been established by studying the effect of temperature and base
concentration under hydrothermal conditions. One representative sample of each of
these three nanostructures have been tested as catalysts in the total oxidation of
naphthalene. Ceria nanoparticles are the most active of these structures due to their
high surface area and low crystalline size with comparative activity to the best
reported in the literature to date. However if the catalytic activity is normalized by the
unit of surface area, nanorods (with (110) and (100) as preferential planes) are the
most active catalyst followed by nanocubes ((100) as the main exposed plane), with
- 14 -
nanoparticles (with (111) as the preferential plane) presenting the lowest areal rate.
This observed trend is directly related to the Ce3+/Ce4+ ratio and concentration of
surface oxygen vacancies as shown by the XPS and Raman analyses, respectively.
These results support previous works that propose that (110) and (100) planes are
more reactive than (111) planes, giving higher oxygen storage capacity and
consequently a higher oxidation catalytic activity.
Acknowledgments
We thank EPSRC (UK) and the Ministry of Science and Innovation (Spain) and Plan
E through project ENE2009-11353 for funding.
References
[1] Mogensen, M., N.M. Sammes, and G.A. Tompsett, Solid State Ionics, 129.(2000) 63 - 94. [2] Lai, W. and S.M. Haile, J. Am. Chem. Soc., 88.(2005) 2979 - 2997. [3] Saitzek, S., F. Guinneton, L. Sauques, K. Aguir, and J.R. Gavarri, Opt. Mater, 30.(2007) 407 - 415. [4] Godickemeier, M., K. Sasaki, L.J. Gauckler, and I. Riess, J. Electochem. Soc., 144.(1997) 1635 - 1646. [5] Kaspar, J., P. Fornasiero, and M. Graziani, Catal. Today, 50.(1999) 285 - 298. [6] Singh, P. and M.S. Hedge, J. Solid State Chem., 181.(2008) 3248 - 3256. [7] Sayle, D.C., S.A. Maicaneaunu, and G.W. Watson, J. Am. Chem. Soc., 124.(2002) 11429 - 11439. [8] Gonzalez-Rovira, L., J.M. Sanchez-Amaya, M. Lopez-Haro, E. del Rio, A.B. Hungria, P. Midgley, J.J. Calvino, S. Bernal, and F.J. Botana, Nano Lett., 9.(2009) 1395 - 1400. [9] Mai, H.-X., L.-D. Sun, Y.-W. Zhang, R. Si, W. Feng, H.-P. Zhang, H.-C. Liu, and C.-H. Yan, J. Phys. Chem. B, 109.(2005) 24380 - 24385. [10] Wang, S., J. Zhang, J. Jiang, R. Liu, B. Zhu, M. Xu, Y. Wang, J. Cao, M. Li, Z. Yuan, S. Zhang, W. Huang, and S. Wu, Micropor. Mesopor. Mat., 123.(2009) 349 - 353. [11] Yamaguchi, I., M. Watanabe, T. Shinagawa, M. Chigane, M. Inaba, A. Tasaka, and M. Izaki, ACS Appl. Mater. Interfaces, 1.(2009) 1070 - 1075. [12] Liu, Z.L., B. Guo, L. Hong, and H.X. Jiang, J. Phys. Chem. Solids, 66.(2005) 161 - 167. [13] Han, W.-Q., L. Wu, and Y. Zhu, J. Am. Chem. Soc., 127.(2005) 12814 - 12815. [14] Yan, L., R. Yu, J. Chen, and X. Xing, Cryst. Growth Des., 8.(2008) 1474 - 1477. [15] Chen, G., C. Xu, X. Song, W. Zhao, Y. Ding, and S. Sun, Inorg. Chem., 47.(2008) 723 - 728. [16] Garcia, T., B. Solsona, and S.H. Taylor, Applied Catalysis B-Environmental, 66.(2006) 92-99.
- 15 -
[17] McMurry, P.H., Atmospheric Environment, 34.(2000) 1959-1999. [18] Shie, J.L., C.Y. Chang, J.H. Chen, W.T. Tsai, Y.H. Chen, C.S. Chiou, and C.F. Chang, Applied Catalysis B-Environmental, 58.(2005) 289-297. [19] Garcia, T., B. Solsona, and S.H. Taylor, Catalysis Letters, 105.(2005) 183-189. [20] Aranda, A., J.M. Lopez, R. Murillo, A.M. Mastral, A. Dejoz, I. Vazquez, B. Solsona, S.H. Taylor, and T. Garcia, Journal of Hazardous Materials, 171.(2009) 393-399. [21] Hirano, M. and E. Kato, J. Am. Ceram. Soc., 82.(1999) 786 - 788. [22] Wu, Q., F. Zhang, P. Xiao, H. Tao, X. Wang, Z. Hu, and Y. Li, J. Phys. Chem. C, 112.(2008) 17076 - 17080. [23] Puertolas, B., B. Solsona, S. Agouram, R. Murillo, A.M. Mastral, A. Aranda, S.H. Taylor, and T. Garcia, Applied Catalysis B-Environmental, 93.(2010) 395-405. [24] Zhang, X.W., S.C. Shen, L.E. Yu, S. Kawi, K. Hidajat, and K.Y.S. Ng, Applied Catalysis a-General, 250.(2003) 341-352. [25] Carno, J., M. Berg, and S. Jaras, Fuel, 75.(1996) 959-965. [26] Bampenrat, A., V. Meeyoo, B. Kitiyanan, P. Rangsunvigit, and T. Rirksomboon, Catalysis Communications, 9.(2008) 2349-2352. [27] Zou, H.B., X.F. Dong, and W.M. Lin, Applied Surface Science, 253.(2006) 2893-2898. [28] Shanghong, B., W. Xue, L. Xiaoyan, and J. Yuan, Rare Earths, 24.(2006) 177 - 181. [29] Fujimori, A., Physical Review B, 28.(1983) 2281-2283. [30] Naganuma, T. and E. Traversa, Nanoscale, 4.(2012) 4950-3. [31] Galtayries, A., R. Sporken, J. Riga, G. Blanchard, and R. Caudano, Journal of Electron Spectroscopy and Related Phenomena, 88.(1998) 951-956. [32] Ntainjua, E.N., T.E. Davies, T. Garcia, B. Solsona, and S.H. Taylor, Catalysis Letters, 141.(2011) 1732-1738. [33] Ndifor, E.N., T. Garcia, B. Solsona, and S.H. Taylor, Applied Catalysis B-Environmental, 76.(2007) 248-256. [34] Kosacki, I., T. Suzuki, H.U. Anderson, and P. Colomban, Solid State Ionics, 149.(2002) 99-105. [35] Falkovsky, L.A. and J. Camassel, Physica B, 284.(2000) 1145-1146. [36] Spanier, J.E., R.D. Robinson, F. Zheng, S.W. Chan, and I.P. Herman, Physical Review B, 64.(2001) [37] Lawrence, N.J., J.R. Brewer, L. Wang, T.S. Wu, J. Wells-Kingsbury, M.M. Ihrig, G.H. Wang, Y.L. Soo, W.N. Mei, and C.L. Cheung, Nano Letters, 11.(2011) 2666-2671. [38] Lee, Y., G.H. He, A.J. Akey, R. Si, M. Flytzani-Stephanopoulos, and I.P. Herman, Journal of the American Chemical Society, 133.(2011) 12952-12955. [39] Yang, Z.Q., K.B. Zhou, X.W. Liu, Q. Tian, D.Y. Lu, and S. Yang, Nanotechnology, 18.(2007) [40] Sayle, T.X.T., S.C. Parker, and C.R.A. Catlow, Journal of the Chemical Society-Chemical Communications, 1992) 977-978. [41] Gamarra, D., G. Munuera, A.B. Hungria, M. Fernandez-Garcia, J.C. Conesa, P.A. Midgley, X.Q. Wang, J.C. Hanson, J.A. Rodriguez, and A. Martinez-Arias, Journal of Physical Chemistry C, 111.(2007) 11026-11038. [42] Tana, M.L. Zhang, J. Li, H.J. Li, Y. Li, and W.J. Shen, Catalysis Today, 148.(2009) 179-183. [43] Zhou, K.B., X. Wang, X.M. Sun, Q. Peng, and Y.D. Li, Journal of Catalysis, 229.(2005) 206-212.
- 16 -
Table 1: Nanostructured ceria catalysts for total oxidation of naphthalene
Catalyst T10%
ºC
T50%
ºC
Formation rate of product @ 175ºC
g CO2/ kg-cat∙h g CO2/ m2 h x 105 (g CO2/ m2 h x 105)/ (O/ O
CeO2_np 155 180 42.3 29.4 21.2
CeO2_nr 165 210 31.9 43.1 34.0
CeO2_nc 225 270 2.85 38.5 29.6
T10 and T50 are the reaction temperatures required for yields to CO2 of 10 and 50%, respectively.
- 17 -
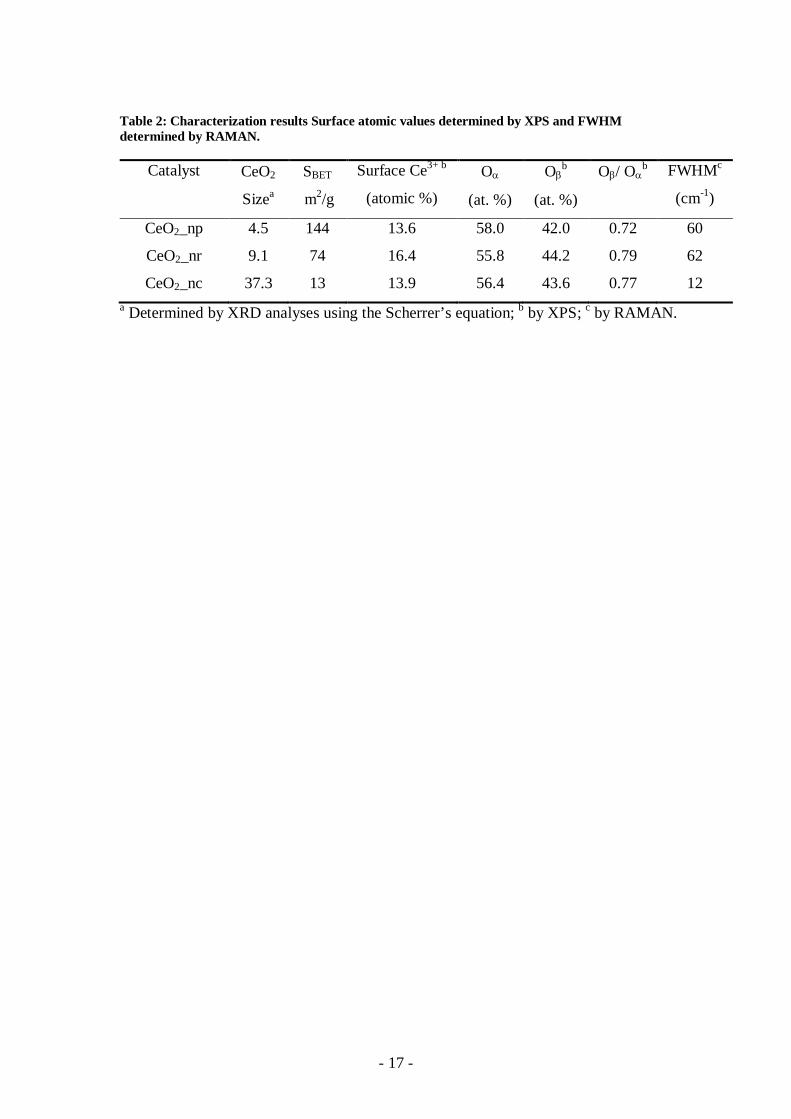
Table 2: Characterization results Surface atomic values determined by XPS and FWHM determined by RAMAN.
Catalyst CeO2
Sizea
SBET
m2/g
Surface Ce3+ b
(atomic %)
O
(at. %)
Ob
(at. %)
O/ Ob FWHMc
(cm-1)
CeO2_np 4.5 144 13.6 58.0 42.0 0.72 60
CeO2_nr 9.1 74 16.4 55.8 44.2 0.79 62
CeO2_nc 37.3 13 13.9 56.4 43.6 0.77 12 a Determined by XRD analyses using the Scherrer’s equation; b by XPS; c by RAMAN.
- 18 -
Figure 1: Morphological phase diagram of CeO2 after 10h of hydrothermal treatment. Phase
boundaries shown do not imply sharp transitions to pure phases. Circles show the conditions of
the representative samples of each morphology taken for the catalytic study.
- 19 -
Figure 2: TEM images of nanoparticulated ceria synthesised at 70ºC and 1M NaOH.
20 nm 5 nm
a. b.
- 20 -
Figure 3: TEM images of tubular structures synthesised at a. 70ºC – 15M and b. 150ºC – 15M
20 nm 20 nm
a. b.
- 21 -
Figure 4: TEM images of ceria nanocubes synthesised at 180ºC – 15M NaOH
20 nm a.
- 22 -
Figure 5: XRD pattern of ceria nanoparticles (synthesised at 70ºC and 5M NaOH), nanorods (synthesised at 100ºC and 15M NaOH) and nanocubes (synthesised at 180ºC and 15M NaOH).
20 30 40 50 60 70 80 90
nanocubes
nanorods
nanoparticles
Inte
nsity
/ a.u
.
2 / degrees
x4
x8
- 23 -
Figure 6: Effect of temperature and NaOH concentration used during the preparation of the ceria catalysts on the mean particle size (calculated from the XRD pattern).
1 5 10 15
70100
150180
0
5
10
15
20
25
30
35
40M
ean
crys
tallit
esi
zeby
XR
D /
nm
NaOH / M
T /
ºC
- 24 -
80 100 120 140 160 180 200 220 240 260 2800
20
40
60
80
100
Yiel
d to
CO
2 / %
Temperature / oC
Figure 7: Np total oxidation activity as a function of temperature of nanostructured ceria catalysts: ■. nanoparticles (5M NaOH, 70ºC); ●. nanorods (15M NaOH, 100ºC) and; ▲. nanocubes (15M NaOH, 180ºC)
- 25 -
925 920 915 910 905 900 895 890 885 880 875
Binding Energy / eV
nanoparticles
Ce3d
nanorods
Inte
nsity
/ a.
u.
nanocubes
Figure 8: Ce3d XPS spectra of CeO2 nanostructured catalysts.
- 26 -
536 534 532 530 528 526 524
nanoparticles
nanorods
O1s
nanocubes
Inte
nsity
/ a.
u.
Binding Energy / eV
Figure 9: O1s XPS spectra of CeO2 nanostructured catalysts.
- 27 -
200 400 600 800
Inte
nsity
/ a.
u.
nanocubes
nanorods
Raman shift / cm-1
nanoparticles
Figure 10: Raman spectra corresponding to different CeO2 nanostructures.