f-A193 125 TEXTURE PERCEPTION AND SHAPE FROM TEXTURE(U) ILLINOIS 1/1 UNIV AT URBANA COORDINATED SCIENCE LAB N ARtJJA FED S AFOSA-TR-97-0933 AIFOSR-S2-9317 WNCLMSIFIED F/G 5/9 N *.uumucmmmmuiu
Transcript
f-A193 125 TEXTURE PERCEPTION AND SHAPE FROM TEXTURE(U) ILLINOIS 1/1UNIV AT URBANA COORDINATED SCIENCE LAB N ARtJJA FED SAFOSA-TR-97-0933 AIFOSR-S2-9317
WNCLMSIFIED F/G 5/9 N*.uumucmmmmuiu
111113L.2IIIII ~ 11-8
1111.25 111 14 11 .6
MICROCOPY RESOLUTION TEST CHARTNATIONAL BUREAU OF STANDARDS- I963-A
-~w w w iw w ..w ~w , W T w w ww .
% % % % %.
*. % %i
ODI ilLE_ ~
Grant AFOSR 82-0317
Lfl IUFOSRT . 7- 0 9 3 3Final Report for 1984-85 to the Air Force Office of Scientific Research:
TEXTURE PERCEPTION AND SHAPE FROM TEXTURE
Narendra Ahuja
Principal Investigator
University of Illinois D T IC(C Coordinated Scilence Laboratory ~E1101 W,. Springfield 7-LECTEUrbana. IL 61801 S JUL3 01987
February 1986 .-.
ABSTRACT
This proposal summarizes the progress made during the year 1984-85 under grant AFOSR
82-0317. We have examined the problem of extracting simple. perceptually significant representa-
tions of natural textures, and developed a system for lowest level perceptual grouping of dots in
dot pattern representation. We have also developed procedures for deriving a "scale-space" represen-
tation of natural textures in terms of discs.
Approved for pmil,li(: relfcr,o.Distribution InLbruito :_
*1_'3
UNCLA? .. 'SECURITY CLASSIFICATION OF THIS PAGE
REPORT DOCUMENTATION PAGE
Is. REPORT SECURITY CLASSIFICATION lb. RESTRICTIVE MARKINGS
2@, SECURITY CLASSIFICATION AUTHORITY 3. DISTRIBUTION/AVAILABILITY OF REPORT
Approved for Wbllo release:
2b. PECLASSIFICATION/DOWNGRAOING SCHEDULE distribution unlimited.
6a. NAME OF PERFORMING ORGANIZATION b. OFFICE SYMBOL 7a. NAME OF MONITORING ORGANIZATION
ADDRSity. a~ j jaCj&(If applicable) AFOSR/NM6c. ADDRESS lCity. State and ZIP Code) 7b. ADDRESS (City, State and ZIP Code)
AFOSR/NM1101 W. Springfield Bldg 410Urbana, IL 61801 Bolling AFB DC "20_1J._AA8
So. NAME OF FUNDING/SPONSORING Sb. OFFICE SYMBOL 9. PROCUREMENT INSTRUMENT IDENTIFICATION NUMBERORGANIZATION (If applicable)
AFOSR NM AFOSR 82-0317
Sc. ADDRESS (City, State and ZIP Code) 10. SOURCE OF FUNDING NOS.
PROGRAM PROJECT TASK WORK UNIT
Pi12 410 ELEMENT NO. NO. NO. NO.
Bolling AFB DC 20332-6448
11. TITLE (include Security Cla.ifcaton) 61102F 2304 A7
Textire Prcptinn anid .Shapp R'mT,,.12. PERSONAL AUTHOR(S)
13a. TYPE OF REPOR 13b. TIME COVERED 14. DATE OF REPORT (Yr., Mo., Day) 15. PAGE COUNT
17n-1 FROM 1984 TO 1985 Fah- R.
16. SUPPLEMENTARY NOTATION
17. COSATI CODES 18. SUBJECT TERMS (Continue on reverse if necessarY. and identify by block number)
FIELD GROUP SUB. GR.
19. ABSTRACT (Continue on reverse if neceuary and identify by block number,
This proposal summarizes the progress made during the year 1984-85 under grant
AFOSR 82-0317. We have examined the problem of extracting simple, perceptually
significant representations of natural textures, and developed a system for lowest
level perceptual grouping of dots in dot pattern representation. We have also developed
procedures for deriving a "scale-space" representation of natural textures in terms of
discs.
20. DISTRIBUTION/AVAILABILITY OF ABSTRACT 21. ABSTRACT SECURITY CLASSIFICATION
UNCLASSIFIED/UNLIMITED ] SAME AS RPT. O OTIC USERS C3
22s. NAME OF RESPONSIBLE INDIVIDUAL 22b TELEPHONE NUMBER 22c OFFICE SYMBOL(include .4 rea Coderi
Dr. Buchal (202)767-4939
DD FORM 1473, 83 APR EDITION OF I JAN 73 IS OBSOLETE,SECURR; tFAWIF? AA 0F T)IS PAGE
INTRODUCTrION
The objectives of our ongoing research are tuo-fold [AIIL'JA84I. The first part of our research
concerns perceptual grouping in dot textures [A]liL J -2. WVIRT13]. The goal here is to segment a
Si\en t Iolt pattern in!,, its percept ual component- i r . t, idelntif ', regions and cur\ es defined h\ dots
that coincide \,, ith the segmentation provided b J;umans.
In the second part of our research, we are developing a computational theory for extracting
three-dimensional shape of a homogeneously textured surface from its images [ST-VENS8I. WIT-
KIN81l. The goal of the second part of the research is to separate the spatial variation in the
transformed texture into its two components: one. characteristic of the original texture before
imaging. and the other introduced by the distance and orientation changes in the imaging process.
Since we are not imposing any constraints on the complexity of the original texture, the problem in
general involves separating the ambient, homogeneous, possibly anisotropic. part of the texture
from a smooth. nonhomogeneous. geometric distortion due to distance gradients and geometry of
the textured surface. The algorithm developed in this part of our research will interface with the
first part. We have worked on both of these parts simultaneously during the year 1984-85. Fol-
low ing is a summary of the progress we have made during this year in each of the two areas.
PERCEPTUAL SEGMENTATION OF DOT PATTERNS
The structure of our current grouping algorithm is shown in Figure 1. The first step of the
algorithm (box A in figure 1 ) consists of three independent modules (boxes l1. BI. and CI) running
in parallel. Each of these modules responds to a certain aspect of the stimulus. The first one (1I)
identifies interior points, the second one (BI) identifies border points, and the third (Ci) identifies
curves. These modules were developed prior to 19h4-h5. The second step (B) corrects possible
errors that might exist in the results of each of the three modules. The third step (C) combines the
results of the border correction (BC) and interior correction modules (IC) performing a more global
analysis. Steps B and C have been implemented this year (1984-85). We nov summarize steps B
-itI I ,
StepA DI te
Identification Idecntifction(!!) I I (BI) (CO)
a (I) (BC)
SW -! ----- ----- f - --------
-/-
Intrio Bod rC reC reto
i "
Coreio orif Corrvec o rrto
ICombination Y-
(BC))
SLowest Level .. ....... .
Perceptual Grouping '': "F u I S r e t ui
.. .- S L I I
.. . - . ..
and C; details are available in the enclosed copies of publications.
To perform the corrections. first the results of the modules (I1. BI. and CI) are cross compared
(figure I ). A module changes the labels of its input ii doing so improves the measure of border
smnoothness and lncrease agreement \ ith the resultS 01 other 1('dules The results reflect proper-
ties ol more extended spatial context of dots anti edges than computed h\ the individual modules.
Once the correction of the interior and border identifications is completed. then the necessary
changes are made and the correction process is iterated on the new set of identification until there
are no changes. This iteration is necessary in order to propagate the effect of the label changes spa-
tially.
The corrected results from step B are combined with the aid of assumptions about more global
properties such as closure of borders. To do this. first the borders around the points labeled as inte-
rior by the module IC are identified. This results in border segments around interior regions. Then.
the intersection of these identifications and the results of the module BC is taken. This results in
those Delaunay edges-being identified as border that have confirmation from two independent
processes. The result is a set of border segments and a set of interior points next to them. A con-
nected component analysis is carried out on the regions surrounded or separated by the border seg-
ments (step C). If a set of border segments defines a closed curve, no further processing is done on "1.4,
that region. If the border is not closed, then the process attempts to extend it with the eventual
goal of closing it and. at the same time, ensuring that the border segment being extended is smooth.
After the border completion is accomplished the borders are smoothed by performing single point
changes in which the border grabs a single point either from the interior or the exterior if it makes
the border smoother. A component interaction module then checks (step D) if any two components
can be merged together. thus making the border smoother without altering the interior properties
of the components.
SURFACE SHAPE FROM TEXTURE
Texture variations provide strong cues for the three dimensional arrangement and structure
o the NLirlaes \isible in an image. "'rwo types of ditortjim. occur during the imaging process:
increasi fl', large ,reas A s,!urfae are cwnmprede t, a iwel area of the image as the textured
surlace recedes, x a. I romn the \ ,. er. and an ani strol'O Lompression of the texture elements due
to foreshortening occurs aN the surface tilts away from the frontal plane. We have investigated
.iow to exploit textural cues to infer the relative distance and orientation of the textured surfaces
depicted in an image. We ha\.e looked for methods that \ould work on images of natural (as
opposed to human-made) textures. that handle sub- and super-texture appropriately, and that do
not rely on specific texture models. We do not address the texture segmentation/discrimination
problem. assuming that it is known which parts of the image correspond to different homogene-
ously textured 3D surfaces.
We have found that a "scale-space" representation. which represents V 2G image properties
over a continuous range of scales. is useful for identifying textural features of all different sizes.
We have derived measurements that can be performed in a V 2G scale-space in order to characterize
the size of texture elements without knowledge of the actual shape of the texture elements. The
equations for the measurements are derived by mathematical analysis of the V 2G and V-V2G
responses to images consisting of ideal bars and disks. The V 2(; response to more complex images
cannot be analyzed in this way because the convolution integrals do not have closed form solutions.
Nevertheless. it can be hoped that. due to the smoothing properties of the (aussian. the V 2(;
response to components of real textural primitives will be similar to the response expected for pat-
terns of idealized bars and disks. Tests on real images bear out this hope. We have worked mainly
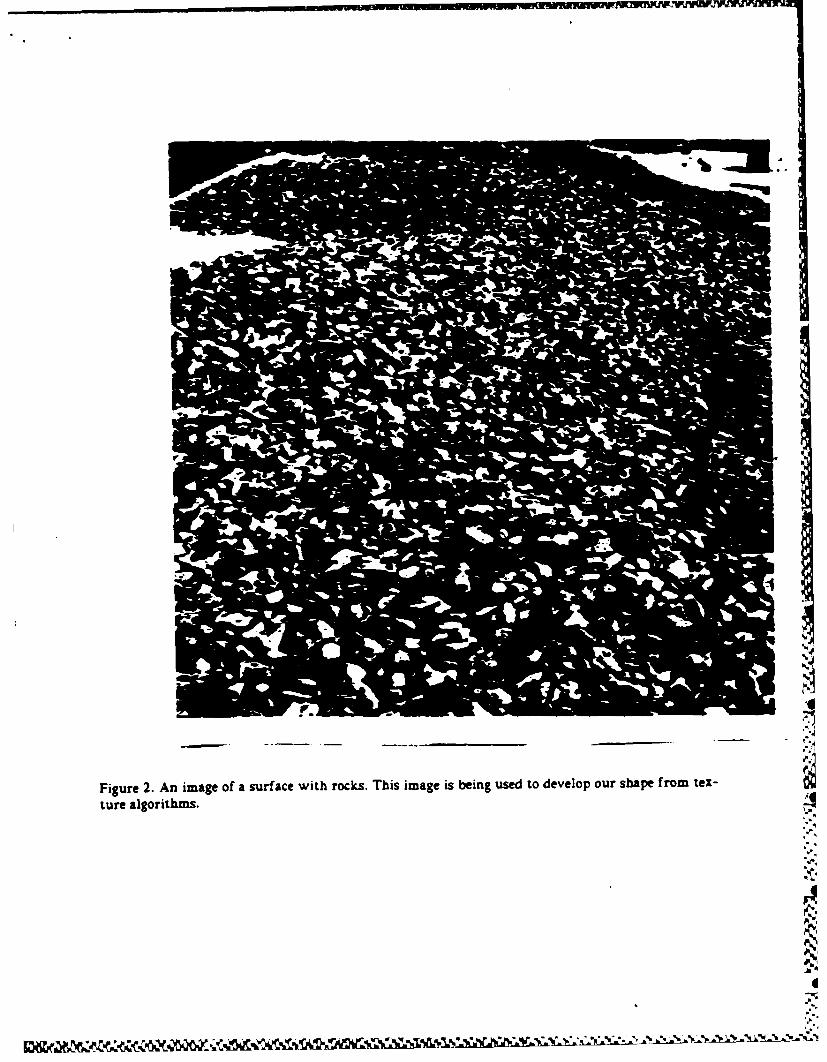
with the image shown in figure 2.
Our method models texture elements with equivalent disks by identifying the size and loca-
tion of circular disks which best fit the scale-space behavior of the texture sample in question. (W\'e
can compute the diameter of a disk. The location of disk centers is approximated by local maxima
U15.
5.
Figure 2. An image of a surface with rocks. This image is being used to develop our shape from tex-
ture algorithms.
1A1~
I %,rI
! ~ '~'
in the V2G response.) Elongated texture elements appear as chains of disks: this representation is 1
remini.scent of the medial axis transform.
hi
I.
S.,.
*0
5-
S ~ .i*S. 5 sI.~\ .\ * * ~ ~ ***5*~***** 5
REFERENCES b
I UAN2]N. -huja. ")ot Pattern Processing. Lsing \oronoi Neigh-horhood,." ILL "ranactin P'attrn.4ALc!. i and Maclant Intclligenct. 4. 3. 1%2. 336-343.
[AIR JAh-4]I,*\ -\huja. "'ie.\ure IPer~epiion anti Shape from "le\tre." R'n,.wa," lP,,p,,al ",- the .41"(R." \la\
[STEVENSh I]K. Stevens. "The Information Content of Texture Gradients". Bilogical Cybernetici. vol 42. 19h].95-105.
[\VERTII38].M. Wertheimer. "L ntersuchungen zur Lehre von der Gestalt." in A Source Book of Gestalt Psychol-ogv. W. I). Ellis (ed.). Nei, York. 1938. Brace.
[WlrKlN81]A. Witkin. "Recovering Surface Shape and Orientation from Texture." Artificial Intelligence. vol 17.1981. 17-45.
0
0%'
I.
APPENDIX
Papers on past work
p.1
(I I m I
EXR3ACrDJG PUCTUAL STIUCTURRINR DOT PATF7NS
%fihran Tiaceryan and Naradra Ahuis
Coordinted Sciences Laboratory1nAivernty of Wino.
1101 W. Springfield Ave. Urbana. IL 61801
ABSTRACT This paper will presnt an algorithm to extract; groupings iThis raper describes an approah to structural segmentation of dot patterns and the resultng spatial structure. Ssctiam 2 will
dot patterns such that the results are in agreement with g8ta- imw~ brify past resarh efforts inds od Section 3willtion performed by humans. Vorona neighborhoods are used to present the algorithm for grouping. Finally, Section 4 Will pestrepresent the geometric strutumre in the dot pattern A st of am caoldling remarks.experts then, in paralel. look for surl components such es 2. SZ~borders interiors and curves. The experts have their expertin The resarch am dot patterns and grouping of dot patterns hasexe tn terms of the properties Of and interaction among Varo,. been conducted in fleld including psychology and computer eci-ot neighborhoods. The interaction is accomplished through a an. Perceptual strutur in both dynamic and stac dot patternsrelaxation. constraint-propagation procins. The reslts of these has bus studied.experts have erors due to the lack of local evidence for the global In the perception of static dot patter different propertiesrole of a dot. Each reasl then is corrected such that 1) it agrees relevant to gropings of elements in the visual field such as spacingwith the results of other experts and 2) it provides locally -~ of eleent weesuied by UttWI at &1 (261 Pomerantz and%bordei. Except for occasional gppe in the borders the union of the Schwaitzberg (191 Jul.. (10. 111 The dricality of dotted Umnecorrected results represents a good approximation to the perceptual in a soary bakground wa studied by Ussal at al [261 and thestructure in the dot patern Connected component analysis is car impoirtance of dot spacin us this detectability was shown. Themst-nod out to identify them Saps. The gap are filled to cls the com- sical propesle of dot pattern their local spatial properties suchponent contours ensuring local border sooshnoe. se number of vermiatsmm. etc and the imsportance of these proper-
-L DMTODUCflMt tUs in the d~imisiehuisy of textures (10. 111Dot patterns have been studied in the pan in difmetnt con- In computer xuace the work am dot patterns a divided into
tests including human perception (5. 14.171 and us simpler -as of two mabir antm 1) denn the neighbors of a dos, and 2)multidimensional clustering algorithm [2. 4.6,12. 1&1 In the oa- clusterin algorithm The resarch in each of these area will betext of visual lutychophysia, dot paittern provide a set of stulih discuissed ne=twhose spatial properties can be controlled precisely. Doce can be The crucial information that is used by perceptual proeseregarded as tokens whom shae ames intenstis. colors. etc. are that perform the grouping of the dots into -meningfulr clusters Iskept constant and whose mast important propertes are their p- the spatial relationship that a dot has with its "neighboW Hencetions. Hence. they form an ideal met of stimuli to study the effects the concept of *gqhboe and the mcncpt of the anihobandoo ofof only the spatial distribution of tokens in grouping poese in a A dot ane of crucial importance to the theory of perceptual groupingtractable fashion. The simplicity of the stimulus may help probe prin In the Past there has been a number of definitions ofselected pars of the early vision in humans and gain smes ude- neighbor.
standng aout he pncemPWIUt ~A Azaixd circular neighborhood of a dot with a globally definedOne of the most important aspects of early human vision is radius Rt is used by Koontz I121 and Patrick and shea 1181. The con-
that it unpist a structure onto the stimulus in the form of pernup- olpt of k-Oezi neighbors of a paint has been used by Zicker andtual grouping. It identifie elements in the visual field that in soe Hummel (311 Velemto (271 and Jarvis and Patrick (%1 Both of thesesense 'go together." This phieinmenon was fire pointed out try the have the disadvantage of beig very inflexible.Gestalt psychologiss (291 and has important consequences. Fims it %'alga 11gvsadfniino egbrba nbtimproves the efciency of the pr.e of parsing the visual field Lno ds A anagls In6 gie a to ointobse ay bthsurfaces and objects and tn the recognition of thoaw obpcs by dsacsadaW nhsdftntopit a ewtireducing the aimount of data thene procese must handle. Second. it the right rag of distance to be consre neighbors. but if theymight result in perceps that do not exist in the objctive data but ae'idn rmec te yatidpitte nntcnare introduced as a realt of the internal bus of th syte itef aidred to be neighborsThus. grouping together the broken edge segments from an edge Other definitions of neighbor include the minimum spanningdetector, would result to oue long border of a region which no edge trfe (NIST) (30D, Gabriel graphs (00) [211 and the relative neighbor-
p detector working on an intensity imag could product because of hood graphs (LNG) (22. 251 Ahuja (1) suggests the use of Vorootthe intensity distribution. An understanding of how this grouping neighborhoods (281 which have ore intuitively appaling proper-is acccomplished and what kinds of rules govern it will probably ties than the previou definitions., in the proonng of dot patterns.incras our understanding of how the early human visual system Early clustering algorithm used various critri baed onis structured. Peirwis siMIlaSt masre of dou; in order to measur goodness of
Tile Werk WN Suffrte bF the Alt YOM 011a a( Sa.mik amna e clusterng [4. 96 1'21 Thae similauity mneaure were based on theCWenn APM~ 12-0317
mom traditional deinitous of neghos of a dot. Graph- su 40 "UItheovitainl appoce hhavIe bas used in order to segment a dot pat- 6te A -
tern into clusters (6 .23. 301 Several methods have beendevieloped whch f or tw@oiineial pafleree bas their messireof simailarity an neighbors of points takiug into conideration local I Interior BorderCuvgeomertic structure, of the pant distibutio [6-L 14.15,.17. 23-251 ldentihicauoin dentuhcationt IdentificationSome researchers have used algorithm (23. 24) which ams formi-BIllaued in a relaeation labeling chem [201 thus -aking it unnaceemary to usm thrubolda. A cosaderatim of the human vlial system. L. - -
its sousispuams about the physical world, its bss amily the gs-talt pirinciples of the way patterns are perceived by humans waslaclung Lo most of these works with som eeptimns (3. 13-I5. 171 r -- FIn sie of the work restrictioins were mae about the kinde of pet-term that the algorithm was suposd to work on. Sacme of theme ItroBrdrcurveraiiniton were that the pattens would contain only umdori Correctiot Corremton Correcionclusters (14. 13. 17. 231 or that they would contain only varying 1C DC ccdensity clusters (241 or only curvilitna clusteus (3. 131 We now go II
on to describe the grouping algorithmn in the neirt section.3. GROUPING ALGO31IHdL------------- - - - -
The algorithm to be doc.ibad in this paper for performing 'tgrouping ofdotptersissed n the Voon etmllasa of dot--------------pattern and the geometrical properties of the Vorooo polygons,that are the outcome of tho telaton. Thm geometrical proper- I9owoue redaect inforniation about the spatial disuibutiamn of dom in the I Borderneighborhood of a given dot.ob~o
grouing by hasandradumthhierchial ir~ The oduandh~reconeBuThe current system is designed to work in two major phasse.
The Amrs phase takes the dot pattern asits input and produce. the - -- --lowest level groupings. The second phae starts with the output 4structure of these groups of dots (if any exists) in, a recursive this system.
m-nner. ~ ~ ~ ~ ~ ~ ~ ~ ~ ~ ~ eci The thewn etinwl ecrb h eaiso hI
3. 1. The First Phane of Segmentation lack of variation in the density. The interior of varying density
The firs phase of the segmentston mentioned above works in clusters will have cells with high eccentricinee due wo the densitythre seps Th geerl srucureof hisphse.itsmodle.n: the diretions of the - otricities will be pointing%
-Uire =L Te gnerl srucure f tis ha= it mouloand towards the mnemng density dirsectio nTus, the eccntricitytheir interconnections are shownr in figure 1. The Jist soep (box A vectors of the calls in the interiors of varying densitty clusters will
infiur 1 cnsuotheineedtmoue(bx .S. be aligned mart of the time. At the borders of clustes, the socen-Cl rnnnginparallel Each of thes modulesrpo d to a certain trat directions in most caesn. will be expected to point towards
aspect of the stimulus. The fims one (U3) identifis interior points, the interiors of the clusters because of the sudden increase in the%the second one (BD) identifies border points. and the third one (CD) do denarr. u.. from the very low density in the interclurter spaceidentihfes curves. The second step (B) corrects posble errors that to the comparatively high density in the interior of the cluster.might exist in the result of each of the three modules. The third Thus obnrvaion also holds on the bode.s of ben which are clus-step (C) combines the results of the border cormcion (90) and inte- ihotiteirponsrnor correctio module (IC performing a more global analysis. teiwhotnerrpits
The outputs of all these module obrainad for the ample patwer i The third propert. Gabriel measure measure. the 'neighbor-figure 5 are shown in figures 6-11. mmes' of two Voronto neighbors. If the ine joining two Voronca
Befoe ging ntoLayfurter etals o th sytem hatdon neighbors i and j Loterets the edge shared by the correspondingeforeping w io anycufurthe r ais of thetmtt Vorono s ooo polygons then & and ji are perfect nerighbors That ts. there
the roupngwe wll imum theproprtis oftheVoroos Ls no third point k. such that the point & is hidden from the pointpolygons in the temellain used by the system to performn the van- j y h point k. e nd vice verse. if. on the other hand theme Isotis gropings. There arm a number of meeauze that are comuted such a third point k . and the lint (a .j crmn the Voronoa cell forrefiecting the geomertric propertes of the spatial distributiion of dots. point k. then i is hidden from I by k and the Gabriel measureEach of then measures and in significance are described below. In indicates the amount by which th i s true. The deeper the linethis paper we will use the terms polygon and neil the region stir- (iq ) Ci cell k. the worse neighbors (Q.1) are and the lower the
roundd bythe olygn. itercangebly.Gabriel measure is. Thau is unportant on the borders of clustersThe first property is the area of the Voronoi neighborhood of where if the two points are not perfect neighbors and have a low
a dot. This is a measure reflecting informauoin about the dot den- Gabriel measure, then the border follows through the interveningsty in the neighborhood of a dot. In the interiors of homogeneous point instead of the two points.clusters, the density does not change. Recalling the way the Voro-Th fothmauec ptdishec pan esr.
not tasllatuon is constructed. we observe that this uniformity of Th fo maur e ndicat owpuede sha the opanoi eigh-e
denstY illresut a th Vornomneihboroodbeig unfor in borhocod of a dot LL These types of cells are men at points wherearea in the interior regions. the borders of two clusters 'gradually approach each other. The
The second property is the eccentricity of the Voronoi wedge-like shape of the cells as caused by toue noniinifor-m dastrsbu- Ipolygons. This measure is a scaled vecto indicating how much a tion of the neighbors of a point around it. and the wedge-likedot is off the center of gravity of its Voronoi polygon. The shapes of the polygons indicate that the points are possibly on thesignificance of the eccentricity measure as that it is related to the border of a cluster.change of density of dots. The intertois of uniform clusters are
7N, &, C,:!N': , 2 t i Z
Another measire. squeeindnin a computed which a verycloely related to th. eleqaatios. buat it as a PropN y of thelIauay, edges rather than Vorom polygons ad it is basd uapon.
dav. the disances oth uvidigDauyegsIts computation isshow infigre. This messu'e. simlar to the distance mumare. asJ' mostly useful around curvilinear clustars Naely, the Dlaunay
a"gs that lie on a curvilinear Cluster are expected to be shorter* r ~.compared to the Dulaunay edges extending on the two sid.s of the/ curve laterally.
The interior identificatioo to formulated in a probabilisticrelaxation scheme with the dots being labeled as either I7IORor NONDITEIO This formulation a basd upon the localgeometrial properies Of the Voromo polygons reulting from theVoromotimllatioc.
Figure 2 -The distance measure for the Delaunay edge (a j). The main task ie to formulate the local compautitieda,,. is defined in term of the length of the Delaunay edge (s~j)I betwee par of dots. Thus formulation is bae on the Assumptiond. and the average Delaunay edge lengh on its two endpoints. that certain properties of the polygons will be trues for the interiordav, and davj. Let D mmn(dav,,jdav,)I Then dimr, -l-D/Id if points, Specifically, in the intersors of homogeneous clustms thed >D. and disr,, -0 otherwise, arma of Vorono polygons will be approximately the sme and the
eccentricities of the cells will be low. In the interiom of nonhomo-geneous clusters the eccentricities will be high but they will bepointing in the ame directioni, namely. an the increasing densitydircton. Thes facts used conservatively. will reslt in the most9obvious interior points being idented
daedam% The compatibilities arn defined for the foar possble combina-
dd tons of labeling two points as MTRIOR or NONITRIOL Inodrto define these compatibilitis one hsto consider all the com-
dr- bi es of combinaions and in what contrats they can occur. Inthis case all the possble contexts an which interor and nownnor
C1 combinations can occur are shown an figure 4. For each of these2.4 case an expression is written which measures bow compatible the
label combination for two points is in the given conitext. For eam-pie. for the cass shown an figure 4a&X -n would have the expre-*on inlclcclA ).In this axpremo- sec. and are a theeccentricity magnitudes for the Voronot polygons of the cells ofdots i and j, respectively. &A. is the arm difference of the twopolygons normalized to the range [0.1 and is definedi as abe(A-
Figre3 -SDelauaede (eau) is adefthed aver ms Dofauha A)/msx(A.AA In tism case A, and A; ane the areas of the polygonslength of the Deanyeg i1d n h vrg eany for the dots a and j respec avely. The antuitive meaning of theedge lengths on its two sides laterally. dav a and dav2. Let prnoisttt heneirofaomgeuscsesteD =aun (dev aiv 21 Then sq, I l-d ID if d < D. and sq, I 0 excenronit agtatite anter a diff genes cxpte the
othewise smal. I tht tothe ase iththe two doti the above expremonwill have a high value and will have a positive contribution to theCqTERIOR-IN7rEROR compatibility value. After the exprestonsfor all these cases have been derived, for a partcular combination
The fifth measure as a distance measure defined (or a of labels. the expressions for all its case an combined by a fuzzyDelaunay edge. It measiuw the change in the distance between two OR operation. That is, for two points a and jto be compatible wathdots compared to their surroundings. The computation of this labels INTUIRM-CCMROR they must have the context shown in rmeasure as shown in figure 2. This measure is useful mostly in the can (a&I or con (bI. of figure 4. Similarly, for other combuntions ofregions containing curvilinear clusters or single-point clusters, labels for the two point&, the expresins for different camr ane coin-because around such clusters, measures such a areas. centaties. bined to get the compatibility expressons.etc are very unreliable. Distance. and Gabriel and slueezednese (to Once thes compatibilities are defined, the relaxzation labelingbe described below) measures ane mostly the only ones ised to scheme as run which results in the assinment of probabilities todesribe thae contexts. Of course, if the clusters are well separated.this measure as also helpful (or identifying edges between clusters each point of baying a certain label (step. module 1I in figure 1).with ineios Most of then probabilities converge to either very high or very low
values resulting in unambiguous labelings (even though thev mayThe sixth measure computed is the elongations of the Voronos be the wrong labels). The few points with more ambi.guous .probe.
cells and the directions of thear minor aes. When there is a cluster bilities are &signed the label Sith the stronger probabilitv. If thisin a pattern where the density of dote as uniform but direction UU- turns out to be the wrong label. it as hoped that the later phasesitave (a.&. the density in one direction as different from that in wall corrct this taking into considertion a larger context (step B inanother direction) the Voronoa polygons tend to be elongated. The figure IL. information coming from other modules independently.direction o( the manor axis tends to be aligned with the higher den, and Gealt assumptions such as border smoothness (steps B and C)%sty direction. As the disparity of the densities in two directions and closure (step C1 These correctaions an performed when theincreases the 'Voronot cells become mome elongated. This measure is results of the three modules are being procaned for poinable correc-
computed using the weond order moments of are of a cell. tions and merges (steps B and C an figure I)I
(a) homogeneous tb) nonhomogeneous () homogeneous
A nonhomogeneous (e) homogeneos (fromveneou"
or nonnomoseneous or nonhomoseneous
Figure 4 - The posible contexts in which N-7ERIOR and NON- Figure 5 - A ample dot pattern to be segmented.
LrE OR compaubilium are computed. ; eWn mple of computig compatibtes r,, for objecs i
and j m As follows3. 1. Boo Udeo and Cuv M tiaon. ((--arV, )+(-rVW' )+O..gr, +agr,))
The method of identicatuon of bordes and curve is imilar 3
to the ident catuon of the iaterm point. In this a the obpcu to In this epresmon. cwv stands for the value of the curvature of a
be labeled am the Delauay edges. They are labeled as either border segment. The border segment whm curvature is computed
BORDER or NONBORDER in the border identification module and depends on the identicatuo of the obpct being labelled. ForCLRVE or NONCURVE in the curve identiatuon module. example. if the object is a dot that as identified as interior, the the
The compatibilitie in thee module are also formulated by border segment around the point as considered for curvature com-
look.ing at all the pofsble context and identifying the different IttatiO. Now that if the interior point a surrounded by el int-
cases and formulating the constraints between properum of the nor points and doe not have a horder paig by it. then it has a
cells and edges that must hold. The posble aontere for thue c conAfident identification and will not be considered for correction to
are identuid similar to the interor identificatean prmo . The b with. If the dot as ientifir as border then the borer sg-
expremons for each of these carei deatiled baed on thee con- Went going through the dot is condered for curvature compute-
texts and combined to get the final compatibility relations. o In each of them case a small portion o the border segment as
considered, for eample, a segment of five dos. The exproemsn egr
3.13. LAW Corectiona is meumre of the agreement of the results of the two independentmodula. TheWfore, this computation reflects the expectation that
As a rmutlt of the previous step (step A in flue 1). the dots the curvature of borwdem around the object i and j be minmize
and the DNlaunay edges are labelled as LN7ERIOR-NNVqT OR. (i.e. the borde be smooth) and the agreements of results betweenBORDER-NONBORDER. or C'RVE-NONCLIRVE. Some of them different module be high.labels may not be correct due to lack of local evLee. aOtitgtim, eS
etc. Thee incorrut labels need to be corrected by iima-. Once the cor n of the interor and border identifictions i
non rom a larer context. The results of the module (I. am completed. then the necemury changee ar made and the correction
CD and the Agreement among thee esilts is used to obtain the prom dumbed above is iterated on the new set of identiication.
information from the larger conext. The aitenion that borders be This iteration is necemary in order to propagate the effect of the
smooth is &i used to decide whether a labeling of a dot or a newly changed labels. This iteration proceeds until there are no
Delaunay edge needs to be corrected. The context that as considered mom label changes. Thelimnc results are then combined to
is larger because the border segment necery for computing get a final segmentaton in the next step.
smoothnee or the agreement measure pombly eztuends beyod the
neighborhood of the obpci bneg considered for correction. .. bin the ReUrts
This step consists of three modulo (IC. 8C and CC in figure The corrected results from step B ae combined with the aid
I). Each one corrects one set of idenucations; from the previous of assmptions about more global propertie such as clomure of bord-
step concurrently and independently using the information from e A connected component analysis is done in order to perform
the previous step as shown n figure I. A module change the labels thi. task which is described below.
of its input if doing so umprove the measure of border smoothnes First, the borders around the points labeled as intenor by the
and increu agreement with the results of other module. The module IC are identified. This is done by Kentifyig thosecorrection proces is formulated in a probabilistic relaxation scheme Delaunay edges as borders that have both endpoits noninteor and
with the labels I CHAINGE NO-CHANGE I on the objcts. The the common neighbors of whom endpoints. located m the two side
objects are the dots for the correcton of dot labels, and the of the edge, have different labels, This results in border segmentsDelauny edges for the correction of boider identificakons. How- that surround the ntenor regions. Then, the interseio of thee
ever, not all of the dots or the Delaunay edgm ame conadered for ieniications and the results of the module BC s taken. This
correction. The most confident ont (i.e. the dots or Delaunay edges results in thrn Delaunay edge being ident4ed as border that have
whom idetiAfications from the two independent module 13 and I confirmation from two independent proceus The result is a set of
are n agreement) Ar omitted. Only the objects whom border segments and a set of anteror points next to them. Each of
identificatiOns from the two indepeodent modules confict are con- these border segments is given a label (e.g. they are numbered . Thesidered for correction. Thi increase the egtcaency of he correKon interior regions then are asigned the labels of all the border
,. ...-.
the l0m attempts to exend it with the eventual goal of cloung menu that surround them. That u. a point P i g ged theit ad, at the sae tLe. eanurinn that the border segment being label of a boidor sgment B. if thee eUM a path P 2 • • , PSchextended a smooth. The relting forks and dangling border m. that ptOP. p, a on the border smmnt 3. and all the pointsment ae cleaned. If theretill remain border sgments around a P '' * pj - an labelled interior. The tm;ult a that all th into-region that are no clod. they are extnded as smoothly as pomble Nr pOsnt have me or more border ragment labels amsgned toso that me of th-- segments will either merge with ech other to them. The goal is to have all ths border segments to form a cloudform longer border sgments to be further proceed. or they will conour. NOt that the number of final border sgment labelsbecome cloed. thus ending the procsing of that region. While &sgod to each interior reon may be more than an snce a com-combining the resalts of the Correction step (step B in figure 1) one porent may have hole in i.must be careful in handling the regons which ane bar-Uke (L. two The coination proces proceeds aith the regons that havesegments of parllel borders with no interior reVon between them). only owe label assigned to them. If the border is cloud no further
Promng is done on that region. If the border a not closd, then
/.'4;
Figure 6 - The reult of interior identifcation (H) module run onthe pattern. The borders that surround the idenufid interior re-gions ae shown in the figure. Figure 9 - The result of the interior correction (IC) module run on
the result in figure 6 unq information aelo from figure 7.
Figure 7 -- The result of border IdeDAtIM1on (11i) module run on Figure 1O0- The result of border correction (90) module run onthe patten. the result in figure 7 using information also from figure 6.
('.K .,
Fig~ure A - The result of curv identification (CI) modu~le run on the Figure I I - The partial result of combinin the two results LDpattern. figures 9 &ad 10.%
6> ,.* ; :,.
The an important b=aUi they might be pat of a neI In a clW- 14 . . OCAllaha. *Human Percepon of Homogeanu Dotwv and if they are not ammdred at h ag then problem asPaturn Pswgpma J. (1974133-.,n tryng to €lim the IIe Wasn wendad. The prblem will be tr'o Perceptual 3.(94.3-1due to the fact that i tm u be amu anm am We IS. J. f. D'aotaht . Compung the Per al a Iage
the bode. agman Of uegia with interior pun then themr will Of D PatrmC pa- GaphUc end Imagebe gape in the boder of the entire clumr Ud the come Of It will PmOCkI 3. (1974). 141-162.be mmsd. To avow tUs didculty the boder Igum of theu 16, J. F. OCallagban. *An Alternative Deitm forreo with no interm are merged with the bder gsm Of Neighborboad of a Point!' IEEE Troueawi anthe regins with inron if Posble. The cmum in which them Cmputes C-24, (1975), 1121-112,.Is a treum from a region with titermn to a juom witheut an 17. . F. CAl1agban. *A Model for Reovering Percepualintenor in a clumer an Occur are liniItd. TherefoM th u - Organiztiot from Dot Paturm" Jrd IJCP. 1976.tual knowledge along with the crtursm of border m ane 294-291Ltiad when mrng th hade atU3Ul 14.weCrmW I&. E. A. Patrick and L Shen. Interacuve u-, of problemknowledge for cluenag and docimon inakin& IEEEWe have pytused an alontbah for oblining grmping in Truueuims an C -pws C-30. (Febuary 1971). 216-dot pattUL The algorithm works boUtm up and i highly paral- 222.leL Soe of the mdulo have no be completed and ancurrently "ng worked m. The. are the two medulo interor- 19. 3. 8 Pememenz and S D. Schwaitzbeq Groupi bybar mr-combnaUm (MC) and curve crctUm (C ) in igun 1. PIumamn: Selective attention ma us, Perceptin mdThe algorithm obum the Wwit level gMuPiap pemn in the dot Psychophysics 1. 5 (1975). 353-361.pattru. However, us patter which cotan hrarchical sruc- 20. A. Rnmfeld 3. Hummel and S Zucker. 'Sam .clelnuwn in them the group of dots obtained as a rmah of the ugmen- by blamaton Operations. IEEE Trweacas ontatuo at this level am be rUated a tokem to be further guVped Systems. Mm rus Cybea'aes SMC-6.(1976). 420-433.recuxuvuly. Future plane miclude extnding the alrnthm to be 21. Q. T. Tumnjn. 'Patte Rco oua and Geometricalable to obtain the hierarchical sctrurm in Such paniO Cample".ith Irntwaioel Jaw Cmfvwuv on
W iCES Pauer RAsogrnitan. 1960. 1324-1347.22. G. T. Tousant. 'The Relative Neghborho Graph of aN. AhuL "Dot Pattern Proceing Lung Vrom Finite Planar Set." Patem Reognitn 1. (1960). 261-
Neighborbood. Patern AnrAysis and MAh 26LIntelligence 4. 3 (May 1962) 336-341. 23. . Tuwryan and N. Abuj. "Sqmentatan of Dot Patterns
2- G. 1 BalI. 'Data Analva in the Social Sciance What C antang Homoagenuo Clustes Proc. 61h lt. Camf.About DtaulsY' 1965 Fall Jon Cmp . Conf. AFIPS opt PWatm &CoU5WN. Munich. Germany. October 19-Conf. Proc. 27. (1%5). 533-559. Spart- 22. 1912 392-394.
3. J. Farfield. "Couwured Shape Geatiow Forms that 24. M. Tuaryan and . Ahup. Perceptual Segmentaton ofPeople See t Dot Pater, ."oe. Inmte of Elau ne Noahego . Dot - Paters." Inm"noS i Electrondes Enogiers Conf. an Systenu. Mot. mid Crnfff = C-npar Viai Om W PartwnCybem-encs. 1979. 0-64. &eowgnii^, Wahluigtm. D. C. Jun 196147-52.
4. LFukunag and W. L G. Kontz. *A Critron and an 25. L. UrqubamGraph Teoretical Cluerg Bid oAlgonthm for Grouping Da." IEEE TrnsActiu an Limited Nighborhood Sem. -Ptreq fRecounon 15. 3Compurs C-19. (Otober 1970). 917-921 (1962). 173.187.J. J. Gilsn. The Percepton of the Vismu WorLd. 26. W. IL UttaL L M. Bunnell and S. Corwn. *On theHoughton Milin Company. Bm m. M 6 1950M deectality of sright sma in the visual nos An
6. J. C Gower and G. J. S. Row, smun SpanTrue e nn of Frnch's paradigm into the mallmosndand Single Lukage Cluster Analyim." Appied Stauncs domain Per tion and Psychophysc , 6 (1970),18. 1 (1969). 54-64 -361L J. Hube",t. 'Some Applicaion of Graph Theoy to 27. F. L D. Velum "A Method for the Analyse of Gauman-Clus "tering. Psvcomone-rka 39(1974). 283-309. W ClWurW Pat-r Reogrto 1-2 (19111 361- 393.
& I. A. Jarvs and E. A. Patrick. *C'luta"~ V g a 2L G. Vornmo.. 'Nouvelle applications do parametruS .milarity aeo .B ated o k Chse r in aghng cointin a la teoi du form. quadrauqum. DeuumeIilarity Mms, hued Comn sd ea (Ne141 memo1C Recb m SUr I parallelloedru prmufs." I.IEEE Trmuactnni on C-mpaiers C-22. (November Raw Aogw Moth 134. (1908). 198-287.1 9 7 3 ). 1 0 2 3 -10 3 4 . R M A g w a h r 1 0 ) 9 - 8 /9. 1025.1034m. i, 29. M. Werthemer. *"ntrsucungen zur Labre von der9. S. C. Johno. Hierarchical Clusteing Scbemu Gestalt." u2 A Source Book of Gestak P;vcolgi. W. D.Psycuomesika J_' (September 1967). 241-252. Ellis (ed., New York. 1938 Brace.
20. L Jules. "Tetonm the Elements of Texture Perception. 30, C. T. Zahn. Graph Themm'ucal methods for detecting andand Their lnteractoos" Na t e n.(19Sl). 91-97. doribog Gatlt cluster," IEEE Trnsctuon on
11. IL JulLn. A Theory of Pratrenuve Texure C-puirs C-2 0 ( 1971 ) 68-86Diummnation Based on First-Order Stausumo of Tetuorne.BiologcalC netics 41.(191). 131-13. 31. S. W. Zucker and R. A. Hummel 'Toward a Low-level
Damipuon of Dot Clustes: LAbeln Edge. Intror and12. W. L G. Koontz and K. Fukunaga A Nonparametrc No Pwta. Computer Graphics and Image PocejmssgValley-euking Technique for Cluster Asalyam. IEEE 9, (1979). 213-233.Traanoeu on Computners C-21, (1972). 171-178
13. D. J. LAanrdge, "Curve Encoding and the Detection ofDsrontmunuua Cop uter Graphics anl ImageProcessmig 20.(1982), 58-71.
Coordinated Sciences LaboratoryUniversity of Illinois
1101 W. Springfield Ave.Urbana. IL 61801
ABSTRACT
A representation of basic geometrical properties of dots is crucial in obtaining perceptual structure of dot pat-terns. This paper describes the use of Voronoi neighborhoods and their geometrical properties to infer geometri-cal structure in dot patterns. The distribution of dots characterizing different structural components such ascurve bars, single-point clusters, nonempty clusters with uniform and varying density interiors are studied.The effects of dot distribution in each of these components on the geometrical properties of the Voronoi neigh-borhood of a dot are described.
1. INTRODUCTION
This paper concerns representation of geometric structure in dot patterns. Since the perceived structure ina dot pattern is completely determined by the relative spatial locations of dots, a definition of "neighbors" of adot and the neighborhood" around a dot is crucial in procesing the dot patterns. In [1] we discussed the impor-tance of the notion of the neighborhood of a dot. and specifically, the possible use of the Voronoi neighborhoodin a variety of applications. In this paper. we will describe in detail some of the geometric properties of theVoronoi neighborhoods that we have used in our research to infer structural information in a dot pattern.
Section 2 reviews previous work on dot pattern procesing and definitions of neighbors of a dot. Section 3reviews the definition of Voronoi teuellauon and Voronoi neighborhood. Section 4 describes in detail thegeometrical properties that can be used to infer structural information in dot patterns. Many of these proper-ties have already been used in our programs for perceptual segmentation ot dot patterns. Finally. Section 5presents concluding remarks.
2. REIvEW OF PAST WORK
A major part of the past work on defining the neighborhood of a point has been concerned mainly withthe following question: given an arbitrary point in a dot pattern. which other points should be treated as itsne:ghbors? The defiuon used in the past have included all the points co'ered b" a circular neighborhoodwith a globally defined radius R [41 k-nearest neignbors of a dot j121 minimal spaming trees [11]. relativeneighborhood graphs (7. 9]. and Gabriel graphs [81. In all of these. the geometrical information used pertains :opairs of dots and is one dimensional in nature except for the circular neighborhood which has the disadvantageof being insensitive to data. Minimal -panning trees are global in nature and a small change in one part mayresult in drastic changes in parts of the graph that are far away. CYCallaghan defines a more intuitivedefinition of a neighborhood. He uses two thresholds, TQ and T,. to decide whether two points P and P areneighbors. If P,,, is the nearest neighbor of P then P. is a neighbor of P if a) the distance ratiod (P..P., )id (P. .P.,,. ) is not greater than T, and b) for any neighbor P, of P the ahgle P, P, P is differentthan 180 degrees by more than T, (i.e. P is not behind any neighbor P. of P . In [1]. Ahu* examined theuse of the neighborhood of a point which asociazes with a point not only otner points as is neighbors. but alsoa part of the Euclidean plane around it., thus, giving the problem a two-dimensional character. He closelyexamined one specific definition of neighborhood called the Voronoi neighborhood, which is based upon theVoronoi temellation defined by a set of points.
•WU 2WN I '.Ei % LNJ'F IW I
3. VORONOI NEIGHBORHOODS
3.1. Voronoi Tessellation
Suppose that we are given a set S of three or more points in the Euclidean plane. Assume that these pointsare not all colinear. and that no four points are cocircular. Consider an arbitrary pair of points P and Q. Thebisector of the line joining P and Q is the locus of points equidistant from both P and Q and divides the Cplane into two halves. The half plane HY(He is the locus of points closer to P (Q) than to Q (P). For anygiven point P a set of such half planes is obtained for various choices of Q. The intersection n HP?
Q eS.QOPdefines a polygonal region consisting of points closer to P than any other point. Such a region is called theVoronoi [I0] polygon associated with the point. The set of complete polygons is called the Vorono diagram ofS [5] The Voronoi diagram together with the incomplete polygons in the convex hull define a Vorono tessel-larion of the entire plane. The Voronoi tessellation for an example pattern is shown in figure 1. Two points aremaid to be Voronoi neighbors if the Vorono polygons enclosing them share a common edge. The dual represen-tation of the Voronoi te ellation is the Deiaunay graph which is obtained by connecting all the pairs of pointswhich are Voronoi neighbors as defined above.
3.2. Neighborhood of a Point
We will consider as the neighborhood of a point P (the region enclosed by) the Voronoi polygon contain-ing P. Considering the way a Voronoi polygon is constructed, this is an intuitively appealing approach. Thelocal environment of a point in a given pattern is reflected in the geometrical characteristics of its Voronoipolygon. This presents a convenient way to compare the local environments of different points. Since the per-ceived structure in a dot pattern results from the relative spatial arrangement of points, the geometric proper-ties of Voronoi polygons may be useful for describing and detecting structure in dot patterns. Such anapproach lends a fully two-dimensional character to the problem in that the dot pattern is converted into aplanar image or a mosaic.
The advantages of the Voronoi neighborhood compared to the definitions given in the previous section arethat the Voronoi neighborhood s (i) intuitive. (ii) adaptive. and (iii) two-dimensional in character. It is adap-tive in the sense that the assignment of neighbors does not depend on the scale of the dot pattern and neighborsare asigned to dots that reflect the local density variations. Also, the number of neighbors of a dot is not fi edand may vary depending on the structure in the vicinity of the dot.
4. GEOMETIC PROPERTIES
It is useful to look at the possible structural patterns in a dot pattern and to see how the various possibledistributions are reflected in the geometric properties of the Voronoi neighborhoods. One type of structuralcomponent in a dot pattern is a cluster of dots with nonempty interior. These types of clusters may have aninterior having either a uniform density or a varying density. Another component is a cluster with no interzor.or a bar. Besides these there are the curvilinear structures and single-point clusters. All of these and their sna-tial configurations are reflected in the shapes of the Voronoi neighborhoods or properties of the Delaunay edges.
The Voronoi neighborhoods of the points which reside within the interior of a homogeneous cluster w:liIhave similar shapes and sizes. For different clusters, these interior polygons may differ in their geometrical pro-perties. The border :elis of a cluster will be open if there is no other cluster to bound them. The cells of theborder points of a cluster that have neighbors in a nearby cluster will differ from interior cells. For example.they may be elongated if the distance between cross cluster neighbors is larger than within cluster neighbors.'orthe nucleus of the cell may be located well off its center. Clearly, a globular cluster will have a larger numberof interior cells than will a more elongated cluster. For dot patterns containing varying density clusters, theinterior cells will be compressed in the direction of increasing density. This results in the dots being off thecenter of the cell in the direction of increasing density. Certain border cells wili assume wedge-like shapeswhere borders of two clusters gradually approach each other. This is caused bv the uneven distribution of theneighbors of a point. Such properties will be further described in detail in the next section.
Others have suggested in the past the use of certain properties of the Voronoi polygons for use in cot pat-tern processing. Sibson (6] has suggested the use of the areas and nucleus-vertex distances of the Voronoipolygons, and the distances between neighboring points as statistics of a point pattern. Chapman [2] uses thedistribution of the areas of the Voronoi polygons to infer the structure of dot patterns describing geographicconcentrations of economic activity. He relates the degree of the local clustering, or nonrandomness. to anentropy measure computed f.-om the histogram o the cell areas. In the retnainder of this. section we .l'"1.
,, , • 5 , e " e we .',-, " " " "" , "" t ." w "° "", , '•" " ,-", ,-", .: . '" , , o- , . "/ "-'-"%
3
describe each of the geometric properties in detail and their computation. The terms polygon and neighborhoodwhich is the two-dimensional area surrounded by the Voronoi polygon will be used interchangeably.
The first property is the area of a Voronoi polygon of a dot. This is a measure reflecting informationabout the dot density in the local neighborhood of a dot. In the interiors of homogeneous clusters, the densitydoes not change. Recalling the way the Voronoi teellation is constructed, we observe that this uniformity ofdensity will result in the Voronoi neighborhood areas being uniform in the interior regions.
The second property is the eccentricity of the Voronoi polygons. This measure is a scaled vector indicatinghow much a dot is off the center of gravity of its Voronoi polygon. The situation and the computation of theeccentricity is shown in figure 2. The significance of the eccentricity measure is that it is related to the changeof density of dots. The interiors of uniform clusters are expected to have cells with very low eccentricitiesbecause of the lack of variation in the density. The interiors of varying density clusters will have cells withhigh eccentricities due to the density variation; the directions of the eccentricities will be pointing towards theincreasing density direction. Thus, the eccentricity vectors of the cells in the interiors of varying density clus-ters will be aligned most of the time. At the borders of clusters, the eccentricity directions in most cases, willbe expected to point towards the interiors of the clusters because of the sudden increase in the dot density: Le .
from the very low densty in the intercluster space to the comparatively high density in the interior of thecluster. This observation also holds on the borders of bars which are clusters without interior points.
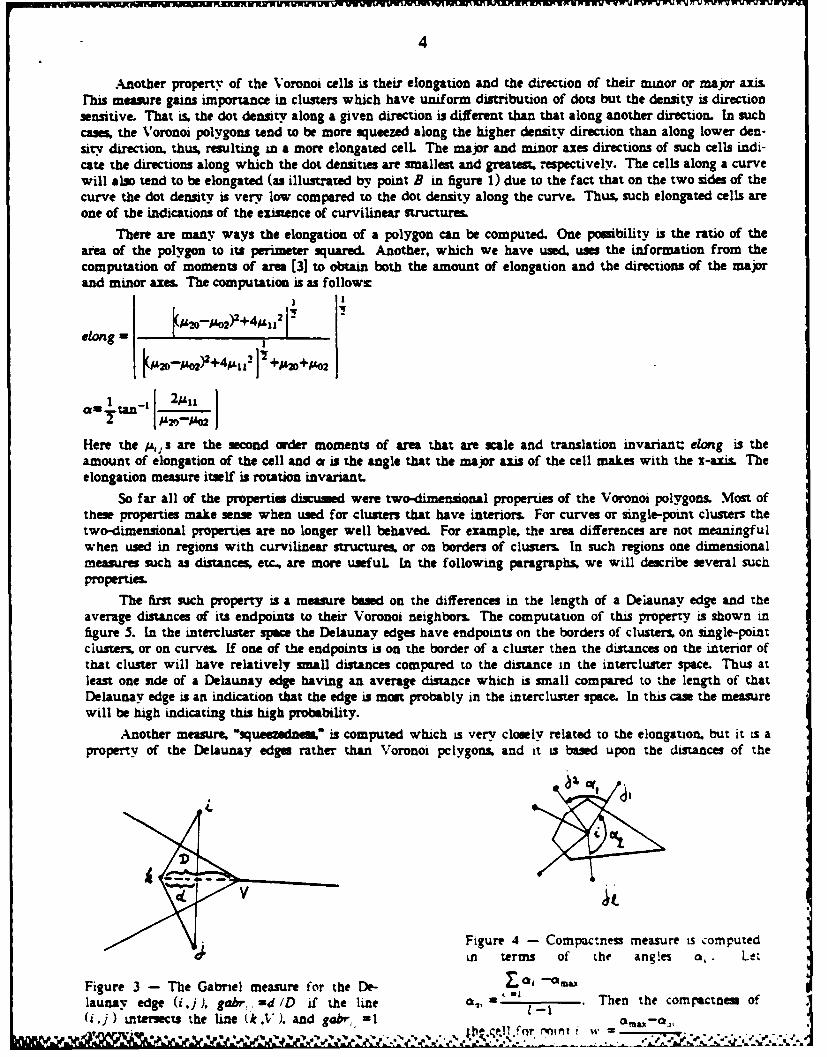
The third property is Gabriel measure, whom computation is shown in figure 3. It measures the "neigh-borliness" of two Voronoi neighbors. If the line joining two Voronoi neighbors i and j intersects the edgeshared by the corresponding Voronoi polygons then i and j are perfect neighbors. That is, there is no thirdpoint k, such that the point i is hidden from the point j by the point k , and vice versa. If. rn the other hand,there is such a third point k, and the line (i,j ) cre the Voronoi cell for point k, theni is hidden from j byk and the Gabriel measure indicates the amount by which this is true. The deeper the line (i ,j) cram cell k,the worse neighbors (i,j) are and the lower the Gabriel measure is. This is important on the borders of clus-ters, where if the two points are not perfect neighbors and have a low Gabriel measure, then the border followsthrough the. intervening point instead of the two points. For example, in figure 3 if Gabriel measure is low -'
enough. the border passes through points (i , . ) instead of going through ki ,j directly. ,
The fourth property computed is the compactness of the Voronoi cells. In the interiors of clusters, eventhough the density of points may vary, the points are surrounded uniformly by other points all around. This rresults in the interior angles of the Voronoi polygons of such points being uniform. Such cells are called "corn-pact." When the borders of two clusters gradually approach each other, the cluster exterior sides of such bordershave a nonuniform distribution of dots. The cluster interior sides of such borders, however, have a uniformdistribution of dots. This results in the dot distribution around a point lying on such a border segment to beuneven which, in turn. is reflec-ted in the shape of the Voronoi polygon of the dot An example of such a case isthe point A and its Voronoi neighborhood in figure 1. Such a polygon has a wedge-like shape, and is "non-compact" The computation of the compactness measure is shown in figure 4.
16
I "70
A'A ,- *1.t'
F 7IF ..
/
,. ".Figure 2 - Eccentricity of a cell belonging topoint P is defined as d /D. Eccentricity direc-
Fieure I - The Voronoi tessellation of an ex- tion is in the direction of QP. Here Q is the
4
Another property of the Voronoi cells is their elongation and the direction of their minor or major axirhis measure gains importance in clusters which have uniform distribution of dots but the density is directionsensitive. That is, the dot density along a given direction is different than that along another direction. In suchcas the Voronoi polygons tend to be more squeezed along the higher density direction than along lower den-sity direction, thus, resulting in a more elongated cell The major and minor axes directions of such cells indi-cate the directions along which the dot densities are smallest and greatest, respectively. The cells along a curvewill also tend to be elongated (as illustrated bY point B in figure 1) due to the fact that on the two sides of thecurve the dot density is very low compared to the dot density along the curve. Thus, such elongated cells areone of the indications of the existence of curvilinear structures.
There are many ways the elongation of a polygon can be computed. One posibility is the ratio of thearea of the polygon to its perimeter squared. Another, which we have used, uses the information from thecomputation of moments of area [3] to obtain both the amount of elongation and the directions of the majorand minor axes. The computation is as follows:
jLQO/LO2$2+4PAiiZelong = I
IA2-AW44Mii2 +AW42,02
-utan- 2A12 1 A2-IA02
Here the 1 Is are the second order moments of area that are scale and translation invariant: eiong is theamount of elongation of the cell and a is the angle that the major axis of the cell makes with the x-axis. Theelongation measure itself is rotation invariant.
So far all of the properties discued were two-dimensional properties of the Voronoi polygons. Most ofthese properties make sense when used for clusters that have interiors. For curves or single-point clusters thetwo-dimensional properties are no longer well behaved. For example, the area differences are not meaningfulwhen used in regions with curvilinear structures, or on borders of clusters. In such regions one dimensionalmeasures such as distances, etc.. are more useful In the following paragraphs, we will describe several suchproperties.
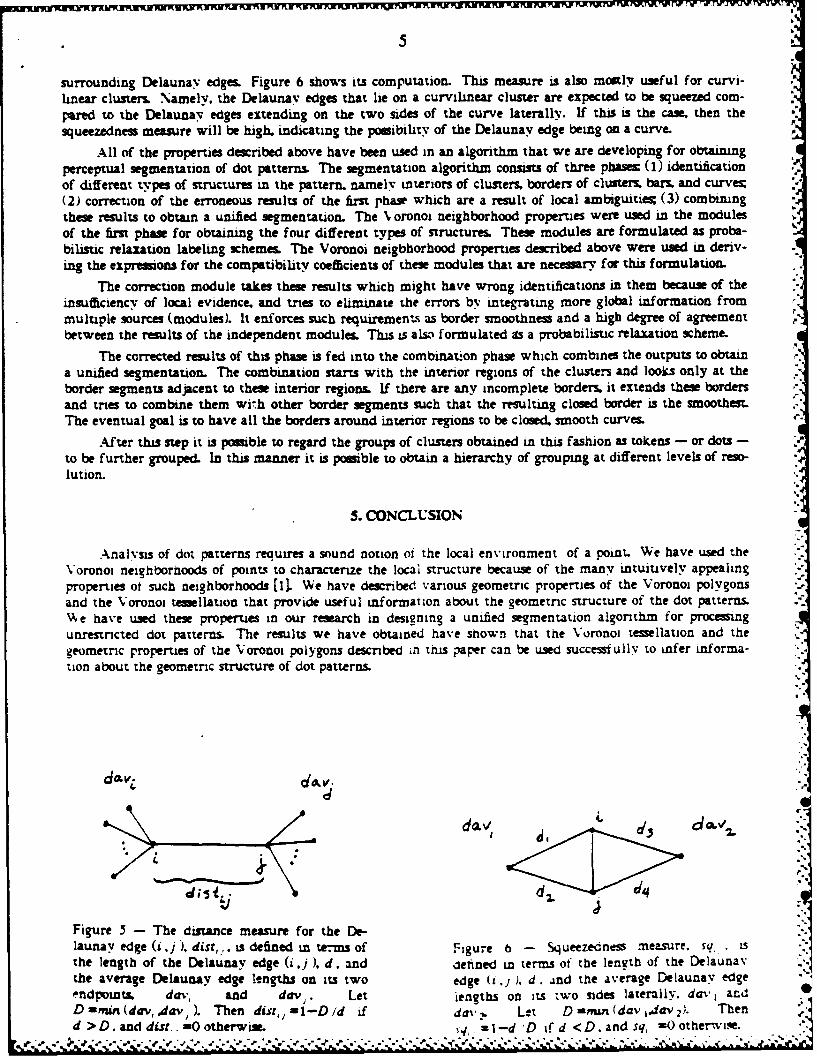
The first such property is a measure based on the differences in the length of a Deiaunay edge and theaverage distances of its endpoints to their Voronoi neighbors. The computation of this property is shown infigure 5. In the intercluster space the Delaunay edges have endpoints on the borders of clusters, on single-pointclusters, or on curves. If one of the endpoints is on the border of a cluster then the distances on the interior ofthat cluster will have relatively small distances compared to the distance in the intercluster space. Thus atleast one side of a Delaunay edge having an average distance which is small compared to the length of thatDelaunay edge is an indication that the edge is mort probably in the intercluster space. In this case the measurewill be high indicating this high probability.
.Another measure. Osqueezedness," is computed which is very closely related to the elongation, but it is aproperty of the Delaunay edges rather than Voronoi pclygons, and it is based upon the distances of the
V v.
Figure 4 - Compactness measure is computedin terms of the angles a,. Let
Figure 3 - The Gabriel measure for the De- T. 01 -C0 max
launay edge (i,j). gabr., ad/D if the line C., = I -I Then the compactness of(i ,1) itersect the line (k ,"). and gabr, -I 1 lb--q. . .6-I-,,
5S
surrounding Delaunav edges. Figure 6 shows its computation. This measure is also mostly useful for curvi-linear clusters. Namely, the Delaunay edges that lie on a curvilinear cluster are expected to be squeezed corn-pared to the Delaunay edges extending on the two sides of the curve laterally. If this is the case, then thesqueezedness measure will be high. indicating the posibility of the Delaunay edge being on a curve.
All of the properties described above have been used in an algorithm that we are developing for obtaimngperceptual segmentation of dot patterns. The segmentation algorithm consists of three phases (1) identificationof different types of structures in the pattern, namely interiors of clusters, borders of clusters. bars, and curve(2) correction of the erroneous results of the first phase which are a result of local ambiguities: (3) combiningthese results to obtain a unified segmentation. The Xoronot neighborhood properties were used in the modulesof the first phase for obtaining the four different types of structures. These modules are formulated as proba-bilistic relaxation labeling schemes. The Voronoi neigbhorhood properties described above were used in deriv-ing the expresions for the compatibility coefficients of these modules that are necessary for this formulation.
The correction module takes these results which might have wrong identifications in them because of theinsufficiency of local evidence, and tries to eliminate the errors by integrating more global information frommultiple sources (modules). It enforces such requirements as border smoothness and a high degree of agreementbetween the results of the independent modules. This is als, formulated 9s a probabilistic relaxation scheme.
The corrected results of this phase is fed into the combinauon phase which combines the outputs to obtaina unified segmentation. The combination starts with the interior regions of the clusters and looks only at theborder segments adjacent to these interior regions. If there are any incomplete borders, it extends these bordersand tries to combine them wi.,h other border segments such that the resulting closed border is the smoothest.The eventual goal is to have all the borders around interior regions to be closed, smooth curves.
After this step it is posible to regard the groups of clusters obtained in this fashion as tokens - or dots -to be further grouped. In this manner it is possible to obtain a hierarchy of grouping at different levels of reso-lution.
S. CONCLUSION
Analysis of dot patterns requires a sound notion of the local environment of a point. We have used theVoronoi neighborhoods of points to characterize the local structure because of the many intuitively appealingproperties of such neighborhoods [Ii We have described various geometric properties of the Voronoi polygonsand the Voronoi t llation that provide useful information about the geometric structure of the dot patterns.Nke have used these properties in our research in designing a unified segmentation algorithm for procesingunrestricted dot patterns. The results we have obtained have shown that the Voronoi tessellation and thegeometric properties of the Voronoi polygons described in this paper can be used successfully to infer informa-tion about the geometric structure of dot patterns.
Figure 5 - The distance measure for the De-launay edge ( .j ), dist,.,, is defined in tems of Figure 6 - S ueezedness measure. su. iSthe length of the Delaunay edge (i ,j). d. and clefined in terms of the length of the Delaunavthe average Delaunay edge lengths on its two edge (i.). d. and the average Delaunay edgeendpoints. da,, and day,. Let iengths on its two sides laterally. dav, ardD ,mn (dav, dav,). Then dist, -I-DId if dav. Let D =,mm(dav idav). Thend >D. and dist. -0 otherwise. I inl-d 'D if d <D. and sq, -0 otherwie..
6
6. REFERENCES
I. N. Ahuj. "Dot Pattern Procesing Using Voronoi Neighborhoods: Patten Analysis and MachineIntelligence 4. 3 (May 1982). 336-343.
2. G. P. Chapman. "The Application of Information Theory to the Analysis of Population Distribuuonsin Space. Economic Geography 46. 2 317-331.
3. M. Hu. Visual Pattern Recognition by Moment Invarian'" IRE Trans. on Information Theory IT-8, (1962), 179-187.
4. W. L G. Koontz and K. Fukunaga. "A Nonparametric Valley-seeking Technique for Cluster Analysis,IEEE Transactions on Computers C-21, (1972), 171-178.
5. M. L Shamos and D. Hoey. "loest-point Problems." Proc. 16th Annual Svmp. on Found atwns ofComputer Science, October 1975, 131-162.
6. R. Sibson. The Dirichlet Tessellation as an Aid in Data Analyis" Scandinavian Journal of Statistics,(1980), 14-20.
7. G. T. Tousaint, "The Relative Neighborhood Graph of a Finite Planar Set." Pettern Recognition 12.(1980), 261-26L
& G. T. Toussamint, Pattern Recognition and Geometrical Complexity," 5th International JointConference on Pattern Recognition. 1980, 1324-1347.
9. L B. Urquhart. *Graph Theoretical Clustering Based on Limited Neighborhood Sets: PetzernRecognition 15. 3 (1982), 173-187.
10. G. Voronoi. .Nouvelles applications des pararnetres continus a la theorie des formes quadratiques.Deuxieme memoire: Recherches sur les parallelloedres primitifs, 1. Reine Angew. Math. 134. (1908).198-287.
11. C. T. Zahn. Graph Theoretical methods for detecting and describing Gestalt clusters IEEETransactions on Computers C-20, (1971), 694S&
12. S. W. Zucker and R. A. Hummel "Toward a Low-level Description of Dot Clusters Labeling Edge.Interior and Noise Points,' Computer Graphics and Image Processing 9, (1979). 213-233.