36
Shape of the dose-response curve and its importance re leukemia risk Alfred Körblein Nuremberg, Germany

Shape of the dose-response curveand its importance re leukemia risk
Alfred KörbleinNuremberg, Germany

Dr. Alfred Körblein KiKK Studie 2
Leukaemia incidence in children < 5 ynear German nuclear power plants (KiKK study)
regression model: r < 5 km compared with r > 5 km
0,5
1,0
1,5
2,0
2,5
3,0
0 10 20 30 40 50 60 70 80
rela
tive
ris
k
distance from NPP [km]
error bars = 1 standard deviation
Dr. Alfred Körblein KiKK Study 3
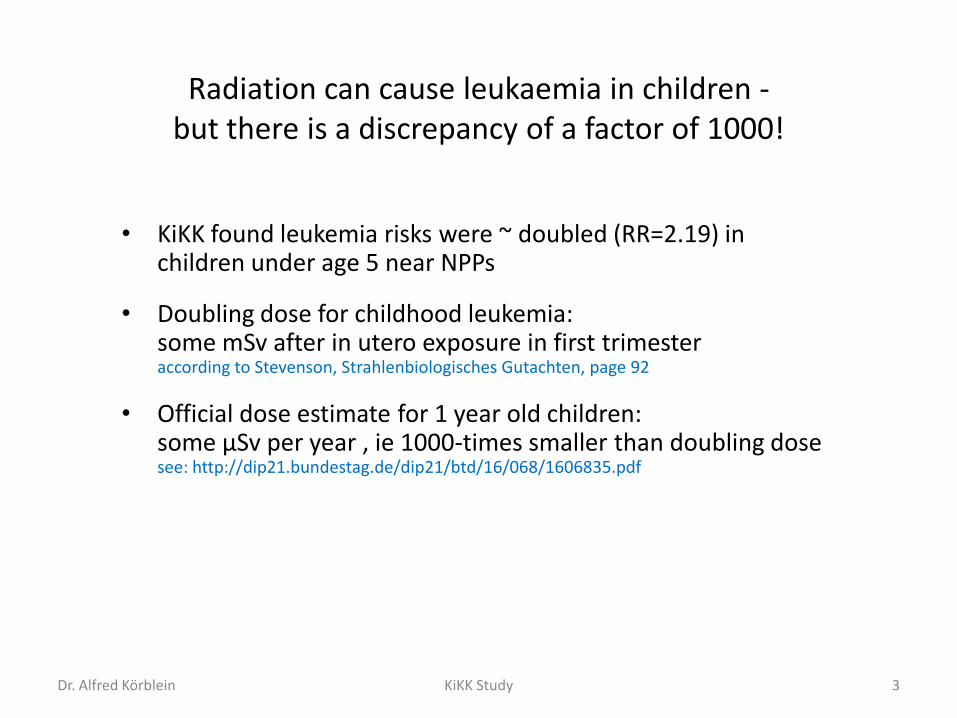
Radiation can cause leukaemia in children -but there is a discrepancy of a factor of 1000!
• KiKK found leukemia risks were ~ doubled (RR=2.19) in children under age 5 near NPPs
• Doubling dose for childhood leukemia: some mSv after in utero exposure in first trimesteraccording to Stevenson, Strahlenbiologisches Gutachten, page 92
• Official dose estimate for 1 year old children: some µSv per year , ie 1000-times smaller than doubling dosesee: http://dip21.bundestag.de/dip21/btd/16/068/1606835.pdf

Dr. Alfred Körblein KiKK Study 4
http://dip21.bundestag.de/dip21/btd/16/068/1606835.pdf

Dr. Alfred Körblein KiKK Study 5
Official dose and risk estimates unrealiable
• Official dose calculations use simplified propagation models:Two dimensional Gauss model might be in error (up to ± factor 10)
• UK Government’s Committee Examining Radiation Risks of Internal Emitters (CERRIE, 2004) concluded uncertainties in INTERNAL radiation doses were considerably greater than in EXTERNAL radiation doses
• Uncertainties accumulate:official dose and risk estimates might be low by a factor of 10 to 100!-> extra annual dose from NPP could be ~100 µSv/y = 0.1 mSv/yie about 1/10 of background dose (excluding radon)(German legal dose limit = 0.3 mSv/y near NPPs)

Dr. Alfred Körblein KiKK Study 6
The official risk estimates might be lowby a factor of 10-100, but
we need to explain a factor of 1000!

How to close the gap?
The usual assumption that risk is proportional to average dose isonly correct if dose-response relationship is linear.
But:
(1) do we know the shape of the dose-response curvefor leukemia induction in-utero?
(2) doses from NPPs show large variations in time and spacewhile dose rate from natural background radiation
is rather constant at a given location

Dr. Alfred Körblein KiKK Study 8
http://dip21.bundestag.de/dip21/btd/16/068/1606835.pdf

Dr. Alfred Körblein KiKK Study 9
Quarterly C-14 air concentrations near the German Neckarwestheim NPP. The columns
are measurements by BfS (green) and by the utility (orange)from: http://www.bfs.de/de/bfs/druck/uus/jb06_Gesamtbericht.pdf

Dr. Alfred Körblein KiKK Studie 10
Calculated isolines of the fallout dispersion coefficient for diffusion category D and stack height
150 meters. The calculated maximum fallout occurs at a distance of 2100 m from the NPPFrom: Otfried Schuhmacher, Portsmouth conference 1996
http://strahlentelex.de/PORTS_Schumacher.pdf
Factor
10 000

Combined effect of discontinuous emissionsand curvilinear dose-response
Model calculation:
Natural background radiation: 1 mSv/y
Annual dose from muclear power plant: 0.1 mSv/y
Discontinuous emissions: 100% dose delivered in 1/10 of a year
Curvilinear dose-response with power of dose 3.5: risk ~ dose^3.5
Average risk: 0.1*(1+1)^3.5 + 0.9*(1+0)^3.5 = 2.03
Result: 10% increase in average dose -> 103% increase in risk!

excess relative dose from NPP 0,01 enhancement factor
factor
power
10 20 30 factor
power
10 20 30
3 1,03 1,04 1,04 3 3,3 3,6 4,0
4 1,05 1,05 1,06 4 4,6 5,4 6,2
5 1,06 1,07 1,09 5 6,1 7,4 9,0
excess relative dose from NPP 0,03
factor
power
10 20 30 factor
power
10 20 30
3 1,12 1,15 1,20 3 4,0 5,2 6,5
4 1,19 1,28 1,40 4 6,2 9,3 13,4
5 1,27 1,47 1,79 5 9,0 15,8 26,4
excess relative dose from NPP 0,10
factor
power
10 20 30 factor
power
10 20 30
3 1,70 2,30 3,10 3 7,0 13,0 21,0
4 2,50 5,00 9,50 4 15,0 40,0 85,0
5 4,10 13,10 35,10 5 31,0 121,0 341,0
power = power of dosefactor = 365 days / exposure period [days] RR = (1+avdose*factor)^power/factor + (factor-1)/factorenhancement factor = (RR-1) / excess relative dose
Curvilinear dose-response relationship:
Results of model calculations for the dependency of relative risk on dose

from: http://radioonkologie.uniklinikum-leipzig.de

http://gd1.med.uni-giessen.de/ugm_2/deu/ugi_nuk/PDF/Rad_V2_Strahlentherapie.pdf

Dr. Alfred Körblein KiKK Study 15
Assumptions
1. Annual background dose (excluding radon) ~ 1 mSv/a
2. Average additional dose from NPP: ~ 0.1 mSv per year(ie ~ 10-100 times larger than official estimates)
3. Discontinuous emissions from NPPs
4. Random distribution of both doses and radiosensitivitiesin a population

Dr. Alfred Körblein KiKK Studie 16

Dr. Alfred Körblein KiKK Study 17
Shape of the dose-response curveMathematical derivation
Assumptions:
A Random distribution of doses in a cohort:lognormal distribution with median dose x=µ1 and standard deviation σ1:density function f(x) = 1/(x*σ1*(2π)1/2)*exp(-(ln(x)-µ1)²/2σ1²)
B Random distribution of radiosensitivity:cumulative lognormal distribution function g(x, µ2, σ2)
C Effect in a small dose interval (x, x+dx) is ~ f(x)*g(x)*dxSum effect = ∫f(x)*g(x)*dx.
Dr. Alfred Körblein KiKK Studie 18
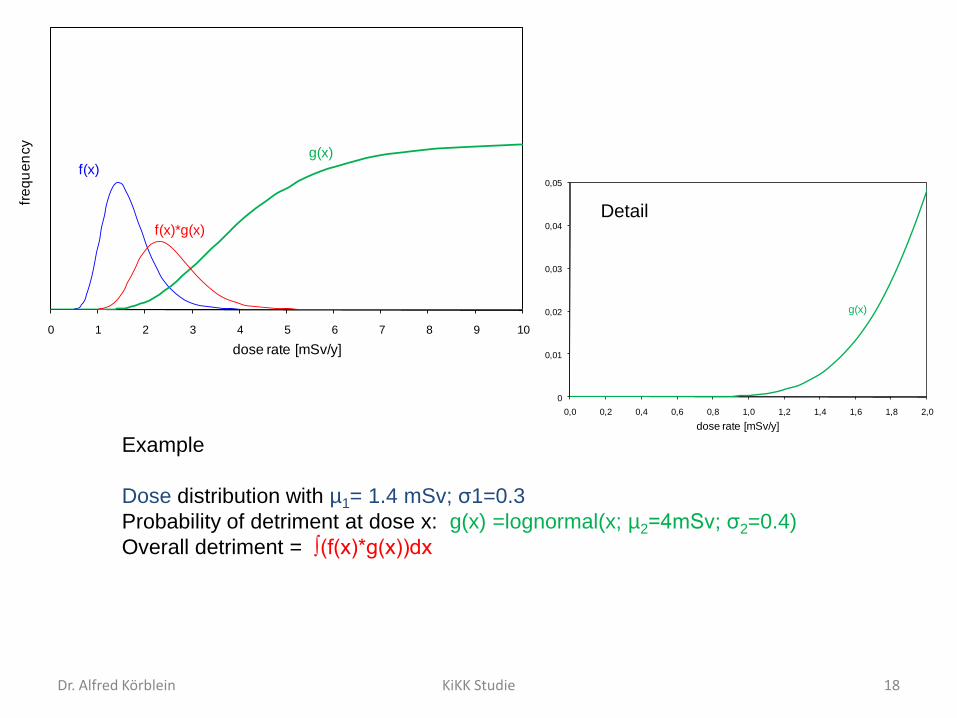
Example
Dose distribution with µ1= 1.4 mSv; σ1=0.3
Probability of detriment at dose x: g(x) =lognormal(x; µ2=4mSv; σ2=0.4)
Overall detriment = ∫(f(x)*g(x))dx
Detail
0
0,01
0,02
0,03
0,04
0,05
0,0 0,2 0,4 0,6 0,8 1,0 1,2 1,4 1,6 1,8 2,0
dose rate [mSv/y]
g(x)
0 1 2 3 4 5 6 7 8 9 10
fre
qu
en
cy
dose rate [mSv/y]
f(x)
g(x)
f(x)*g(x)

Dr. Alfred Körblein KiKK Studie 19
Effect grows disproportionately with median dose
0 1 2 3 4 5 6 7 8 9 10
fre
qu
en
cy
dose rate [mSv/y]
f(x)
g(x)
f(x)*g(x)
median annual doses: µ1 = 1.0, 1.2, 1.4, 1.6, 1.8 mSv; σ1= 0.3

Dr. Alfred Körblein KiKK Studie 20
Shape of the dose response curve
Regression with model y=x^n yields power of dose n=4.9
0,0056
0,0149
0,0311
0,0551
0,0867
0,00
0,02
0,04
0,06
0,08
0,10
0,12
0,14
0 0,2 0,4 0,6 0,8 1 1,2 1,4 1,6 1,8 2
pro
po
rtio
n
median of annual dose [mSv/y]
y = 0.0059*x^4.93

Dr. Alfred Körblein KiKK Studie 21
Shape of the dose response curveRegression with lognormal distribution function
(σ² = σ1² + σ2² )
Increase of dose Increase of risk
20% 170%
40% 460%
60% 880%
80% 1450%
0,0056
0,0149
0,0311
0,0551
0,0867
0,00
0,02
0,04
0,06
0,08
0,10
0,12
0,14
0 0,2 0,4 0,6 0,8 1 1,2 1,4 1,6 1,8 2
pro
po
rtio
n
median of annual dose [mSv/y]
y = lognormal(x; µ=1.27; sigma=0.50)

Dr. Alfred Körblein KiKK Study 22
Epidemiological evidence for curvilinear dose response:Chernobyl consequences
• Significant association of perinatal mortality with the caesium burden of pregnant women in Germany. The dose response is curvilinear with a best estimate of 3.5 for the power of dose (95% CI: 1.5-7.5)(Körblein and Küchenhoff, Rad Environ Biophys, 1997)
• Significant association of monthly infant mortality with the caesium burden of pregnant women in Poland. Curvilinear dose response with a power of dose of 3.8.
• Significant association of congenital malformations with caesium ground deposition in Bavaria. Curvilinear dose response.

Dr. Alfred Körblein KiKK Studie 23
Example 1: Perinatal mortality in West Germanylinear-quadratic regression model for caesium effect
caesium effect is significant: p=0.0005 (chisquare test, df=2) quadratic term is significant: p=0.0057 (chisquare test, df=1)
0,8
0,9
1,0
1,1
1,2
1,3
0 5 10 15 20 25 30
rela
tive
ris
k
caesium burden [Bq/kg]

Dr. Alfred Körblein KiKK Studie 24
Example 2: Infant mortality in Polandlinear-quadratic regression model for caesium effect
caesium effect is significant: p=0.0032 (chisquare test, df=2)quadratic term is significant: p=0.0066 (chisquare test, df=1)
0,85
0,90
0,95
1,00
1,05
1,10
1,15
1,20
0 5 10 15 20 25 30
rela
tive
ris
k
caesium concentration [Bq/kg]

Dr. Alfred Körblein KiKK Studie 25
Example 3: Congenital malformations in Bavarialinear-quadratic regression model for caesium effect
caesium effect is significant: p=0.0064 (chisquare test, df=2) quadratic term is significant: p=0.0032 (chisquare test, df=1)
0,0
0,5
1,0
1,5
2,0
2,5
3,0
3,5
0 2 4 6 8 10 12 14 16 18 20 22
rela
tive
ris
k
caesium burden
Dr. Alfred Körblein KiKK Study 26
Summary
• The mathematical form of the dose-response relationship is a cumulative lognormal distribution function.
• The only assumption for the calculation is that both the doses and the radiosensitivities are randomly distributed in a population.
• The present model, together with revised dose estimates, has the potential to explain the size of the increased childhood leukaemia rates observed near German NPPs.

email from A. Körblein to Prof. Müller (SSK), from 11 July 2008:
Sehr geehrter Herr Müller, anbei leite ich Ihnen meine Überlegungen zur Form der DWB weiter bei Effekten, bei denen die Existenz einer Schwellendosis vermutet wird.Freundliche Grüße, Alfred Körblein
Reply from Prof. Müller, the same day:
Sehr geehrter Herr Körblein, haben Sie vielen Dank für die Übersendung der Information.Ich finde solche Überlegungen auch immer wieder faszinierend, habe aber nach wie vor die Überzeugung, dass wir mit solchen Modellen der Komplexität der biologischen Systeme nicht gerecht werden. Intellektuell aber auf jeden Fall reizvoll. Beste Grüße, ein schönes Wochenende, Wolfgang-U. Müller
Prof. Dr. Wolfgang-Ulrich Müller Institut für Medizinische Strahlenbiologie Universitätsklinikum Essen

Thank you for your attention patience!

Distance dependencyof relative risk

cases and controls within 5 km of German NPPs
From Figure 3.5 of KiKK technical report

Thanks to Ralf Kusmierz who provided the graphical software to determine the midpoints
-5
-4
-3
-2
-1
0
1
2
3
4
5
-5 -4 -3 -2 -1 0 1 2 3 4 5
21 cases50 controls
77-21 = 56 cases148-50 = 98 controls

All cancers in children < 5 y near German NPPs
Dr. Alfred Körblein KiKK Study 32
0,00
0,50
1,00
1,50
2,00
2,50
0 5 10 15 20 25 30
rela
tive
ris
k
distance from NPP [km]

Sex ratio at birth (ratio of male to female births)near Bavarian NPPs
0,95
1,00
1,05
1,10
1,15
1,20
1,25
0 5 10 15 20 25 30
se
x ra
tio
distance from NPP [km]

Early childhood cancer - congenital malformations - sex ratio near NPPs(error bars: 1 standard deviation)
0,0
0,5
1,0
1,5
2,0
2,5
3,0
3,5
0,90
0,95
1,00
1,05
1,10
1,15
1,20
1,25
0 5 10 15 20 25 30
rela
tive
ris
k
se
x ra
tio
distance from NPP [km]
sex ratio cancers malformations

Results of a combined regression(lognormal distributions with common sigma)
parameter data estimate SD t value p value
intercept cancer 0,2469 0,0053 46,47 0,0000
ampl cancer 0,1545 0,0740 2,088 0,0378
median cancer 3,1641 0,4766 6,638 0,0000
intercept sexratio 0,5124 0,0008 669,1 0,0000
ampl sexratio 0,0268 0,0126 2,135 0,0337
median sexratio 3,3614 0,3517 9,557 0,0000
intercept malf 0,0247 0,0108 2,290 0,0228
ampl malf 0,0323 0,0149 2,165 0,0313
median malf 5,6499 0,6231 9,068 0,0000
sigma 0,1908 0,0920 2,074 0,0390
p = 0.0009 (chisquare test with df=7)

From: Strahlenbiologisches Gutachten, Appendix C1: O. Schumacher: Zuverlaessigkeit der AVV
sh
ort
-te
rmp
rop
ag
atio
nfa
cto
r
distance from source [metres]


