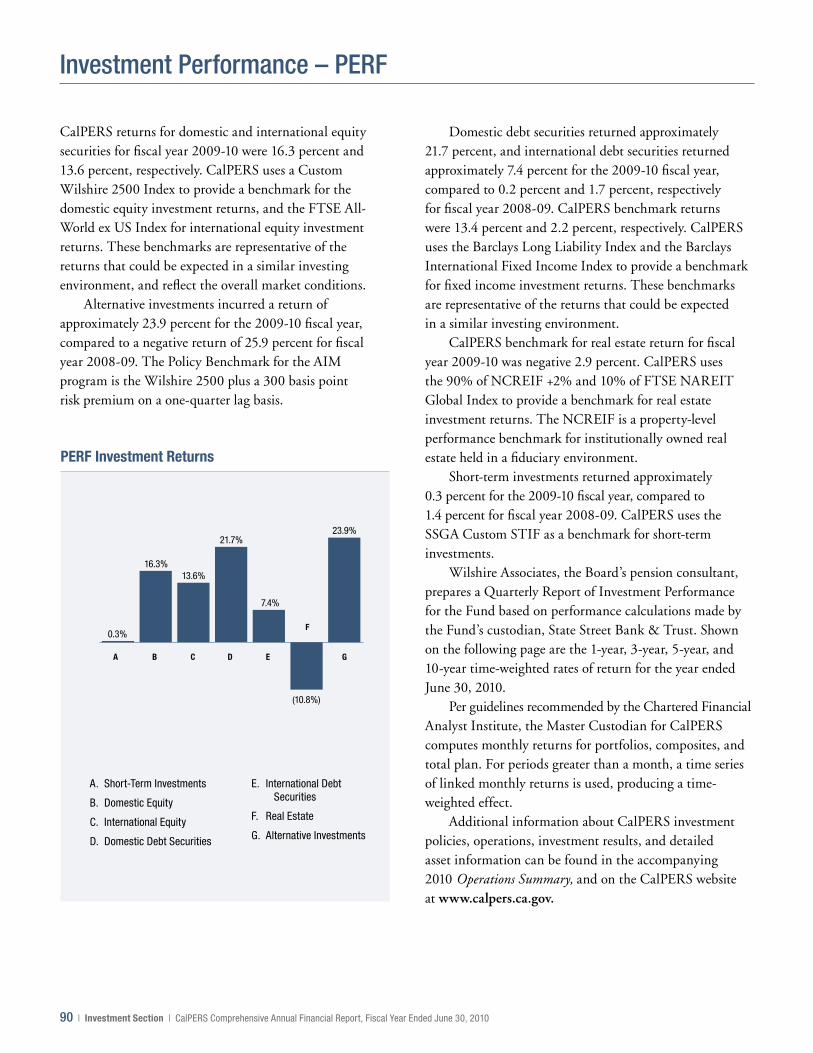
13.3% RATE OF INVESTMENT RETURN 12.7% NET ASSET INCREASE $ 201.6 BILLION – NET ASSETS 12.7% NET ASSET INCREASE Shaping Our Future: Ensuring Performance, Transparency and Accountability Comprehensive Annual Financial Report Fiscal Year Ended June 30, 2010 California Public Employees’ Retirement System A Component Unit of the State of California
Transcript
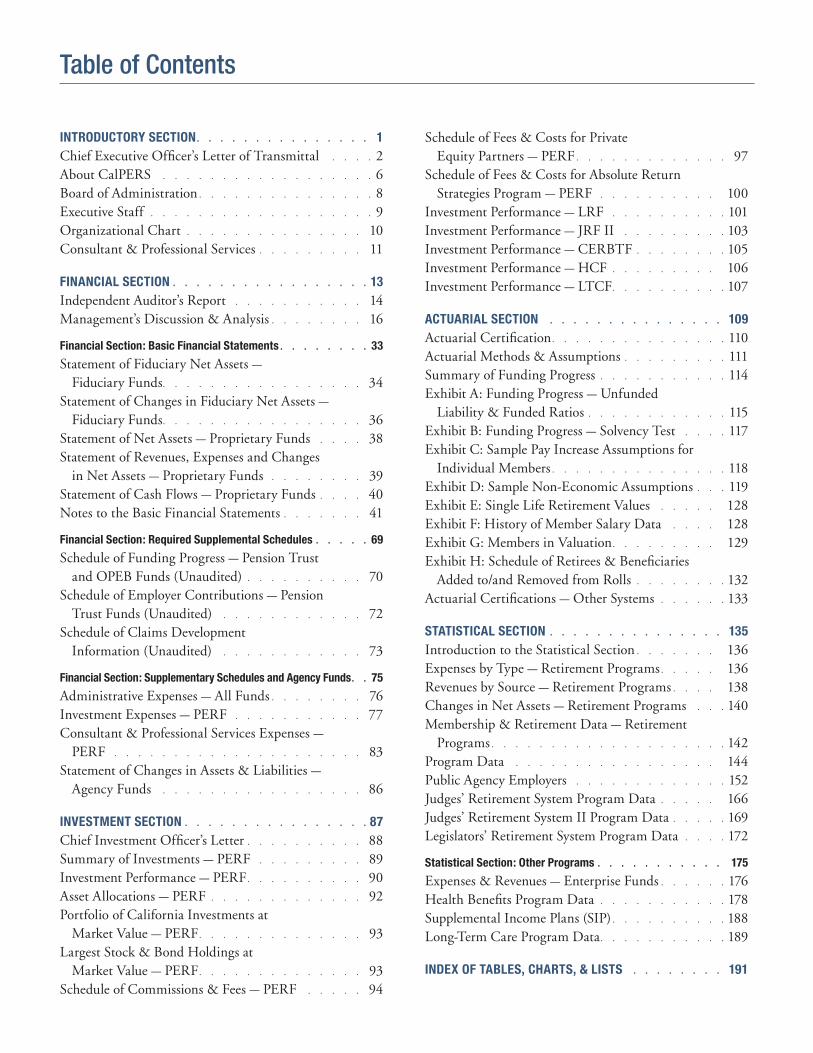
13.3% RATE OF INVESTMENT RETURN
12.7% NET ASSET INCREASE
$201.6 BILLION – NET ASSETS
12.7% NET ASSET INCREASE
Shaping Our Future: Ensuring Performance, Transparency and Accountability
Comprehensive Annual Financial ReportFiscal Year Ended June 30, 2010
California Public Employees’ Retirement System
A Component Unit of the State of California
This page intentionally left blank to facilitate double-sided printing.
Comprehensive Annual Financial ReportFiscal Year Ended June 30, 2010
Prepared by the Fiscal Services Division, the Investment Office, the
Actuarial and Employer Services Branch, the Office of Public Affairs,
and several additional divisions and branches of the California Public
Employees’ Retirement System.
Available online at www.calpers.ca.gov
California Public Employees’ Retirement System
A Component Unit of the State of California
This page intentionally left blank to facilitate double-sided printing.
CERTIFICATE OF ACHIEVEMENT OF EXCELLENCE IN FINANCIAL REPORTINGThe Government Finance Officers Association of the United States and Canada (GFOA) awarded a Certificate of Achievement for Excellence in Financial Reporting to CalPERS for our Comprehensive Annual Financial Report for the fiscal year ended June 30, 2009 . This was the 14th consecutive year that CalPERS has achieved this prestigious award . In order to be awarded a Certificate of Achievement, a government must publish an easily readable and efficiently organized comprehensive annual financial report that satisfies both generally accepted accounting principles and applicable legal requirements . We believe our current comprehensive annual report continues to meet the Certificate of Achievement Program’s requirements .
PUBLIC PENSION STANDARDS AWARDThe Public Pension Coordinating Council (PPCC) awarded a Public Pension Standards Award for Funding and Administration to CalPERS for our Comprehensive Annual Financial Report for the fiscal year ended June 30, 2009 . This is the 9th consecutive year that CalPERS has achieved this prestigious award . In order to be awarded a Public Pension Standards Award, a public pension program must meet professional standards for plan design and administration as set forth in the Public Pension Standards . A Public Pension Standards Award is valid for a period of one year .
Professional Awards
Introductory Section
2 Chief Executive Officer’s Letter of Transmittal
6 About CalPERS
8 Board of Administration
9 Executive Staff
10 Organizational Chart
11 Consultant & Professional Services
2 | Introductory Section | CalPERS Comprehensive Annual Financial Report, Fiscal Year Ended June 30, 2010
CalPERS has been at the forefront of efforts to close federal regulatory gaps, obtain protec-tion from system risk, and restrain the poor corporate governance practices that led to the financial crisis and recession . We are pleased that the “Restoring American Financial Stability Act of 2010” favorably addresses most of our 2010 Financial Market Reform Objectives . We will continue to use our voice as an investor to put an end to corruption and greed in the financial markets .
On the environmental front, we supported a vote by the U .S . Securities and Exchange Commission that requires public companies to disclose to investors any serious risks global warming might pose to their businesses .
During the year, we rounded out our executive leadership team . Alan Milligan was selected as our new Chief Actuary following the retirement of Dr . Ron Seeling after 16 years of service . Alan is a seasoned pension fund actuary with more than 20 years of public and private sector experience, including nearly 10 years with CalPERS . He has been with CalPERS since 2001 and served previ-ously as Deputy Chief Actuary since August 2009 .
Another key staff change was the appointment of Ann Boynton as Deputy Executive Officer of Benefits . Ann joined CalPERS from the legal and consulting firm Manatt, Phelps, and Phillips where she served as a manag-ing director and worked on health care and health care information technology issues .
Chief Executive Officer’s Letter of Transmittal
December 10, 2010
Members of the CalPERS Board of Administration:
I am pleased to present the CalPERS Comprehensive Annual Financial Report (CAFR) and accompanying Operations Summary for the year ended June 30, 2010 .
CalPERS faced many challenges over the past 12 months . Those challenges prompted us to take a fresh look at the internal processes and fundamental values that will shape the future of CalPERS . As we conducted this re-examination, a key focus was a renewed commitment to transparency, accountability, and performance . During the year, we implemented a number of policies that underscore the importance of these principles in all our business activities . We also supported State legislation that strengthens the disclosure requirements of organizations seeking to do business with CalPERS .
We experienced our first investment gain in three years, with an investment return rate of 13 .3 percent for the fiscal year ending June 30, 2010 . This return marked the 17th time in the past 27 years that we have seen double-digit investment returns . As of June 30, 2010, the market value of our assets was $201 .6 billion .
The rebound in our investment portfolio was the result of many factors, including the stabilization in the financial industry, the increase in market liquidity, and the aggressive response of our Board and investment staff to harness opportunities in the market . We are continuing to apply the hard lessons of the financial crisis to a re-assessment of our investment policies, processes, and strategies . This includes developing more robust risk management practices, reviewing our asset allocation, and taking steps to better align our interests with those of our investment partners to ensure we are getting the best results for dollars spent .
Anne Stausboll Chief Executive Officer
CalPERS Comprehensive Annual Financial Report, Fiscal Year Ended June 30, 2010 | Introductory Section | 3
Chief Executive Officer’s Letter of Transmittal (continued)
In the spring, we began to examine our organizational structure and processes, culture and core values, and business strategy and planning activities . We established Our CalPERS: Shaping the Future, an enterprise-wide initiative to restore confidence, rebuild trust, and enhance integrity and accountability in our organization . As part of Shaping the Future, we are re-examining how our organiza-tion is structured to ensure effective customer service, risk intelligence, and innovation . We also are strengthening our business planning, performance management, and budgeting .
Our 2010-11 Business Plan focuses on three enterprise priorities: customer focus, sustainability, and building internal strength . Together, Shaping the Future and the Business Plan will support our determination to rebuild trust and enhance transparency and accountability within our organization .
One of our key internal activities for the past few years has been integrating all of our information technol-ogy systems into a comprehensive Internet-based platform that provides 24/7 access . The new my|CalPERS has been an enormous undertaking, requiring thousands of employee hours .
Throughout the year, news reports about pension funds in general and CalPERS in particular created uncertainty among our members, employers, and business partners . The debate over pensions can be emotional because it is ultimately about people and their financial security . Our goal is to be a proactive educator and an honest broker of information — dispelling myths through a clear presentation of facts . To enable us to serve as a resource and educator, early in the fiscal year we launched a new website — CalPERS Responds. Through this site, we are providing information about emerging issues in pension security, investments, and national health care reform .
As government pensions became a significant public policy issue, in January and February 2010 we held two California Retirement Dialogue events, which were attended by a total of more than 465 interested individuals . The events provided an in-depth exploration of pension issues facing State and local government members and retirees .
To ensure accountability and transparency, our goal is to provide a unified, accurate, and timely message to members, employers, and stakeholders . Our newly created External Affairs Branch supports this goal . The branch is composed of the Office of Public Affairs, Governmental Affairs, and a new Office of Stakeholder Relations . The new office will represent the interests of CalPERS leader-ship before member and employer organizations .
As the fiscal year came to a close, we were ramping up our new Office of Enterprise Risk Management and Ethics Helpline . The creation of this office is one more way we are ensuring ethical conduct across our organiza-tion . In addition to enterprise risk intelligence, it brings together internal compliance operations, privacy and security, disaster recovery, and business continuity programs . The Ethics Helpline enables CalPERS to receive and address tips and information regarding possible wrongdoing, such as allegations of fraud, waste, abuse, conflicts of interests, and other misdeeds .
The 2011 health benefits package increases overall premiums by an average of 9 .1 percent . The increase reflects higher costs anticipated by the health plans for hospital, medical, and prescription drug use next year . The increase is not the result of the enactment of federal health care reform .
As the debate over national health care reform unfolded over the past year, we kept our members and other stakeholders updated via a “CalPERS and Health Care Reform” section on our website . We believe the measures included in “America’s Affordable Health Choices Act of 2009” will improve health care delivery for our members and all Americans . Following enactment of the legislation, we established a Health Care Reform Project Implementation Team to analyze the impact the legislation will have on our Health Program .
4 | Introductory Section | CalPERS Comprehensive Annual Financial Report, Fiscal Year Ended June 30, 2010
Chief Executive Officer’s Letter of Transmittal (continued)
of Achievement, a government must publish an easily readable and efficiently organized comprehensive annual financial report . This report must satisfy both generally accepted accounting principles and applicable legal requirements . A Certificate of Achievement is valid for a period of one year . We believe our current comprehensive annual report continues to meet the Certificate of Achievement Program’s requirements, and we are submit-ting it to GFOA to determine its eligibility for another certificate .
The Public Pension Coordinating Council (PPCC) awarded a Public Pension Standards Award for Funding and Administration to CalPERS . This is the ninth consecutive year that CalPERS has achieved this presti-gious award . In order to be awarded a Public Pension Standards Award, a public pension program must meet professional standards for plan design and administration as set forth in the Public Pension Standards . A Public Pension Standards Award is valid for a period of one year .
Accounting System & ReportsManagement is responsible for establishing and maintain-ing an internal control structure designed to ensure that CalPERS assets are protected from loss, theft, or misuse, and income is appropriately distributed . Responsibility for the accuracy, completeness, and fair presentation of the information and all disclosures rests with CalPERS . The basic financial statements have been prepared in accordance with accounting principles generally accepted in the United States of America .
This Letter of Transmittal is designed to complement the Management’s Discussion & Analysis (MD&A) and should be read in conjunction with it . The CalPERS MD&A can be found immediately following the report of the independent auditors .
InvestmentsProper funding and healthy long-term investment returns are essential to the financial soundness of CalPERS . The ratio of investment earnings to total revenue during the last 10 years is evidence of CalPERS continued solid financial management . See the Chief Investment Officer’s letter, page 88, for a summary of our investment performance .
Management Responsibility for Financial ReportingOur system management prepared the CalPERS financial statements included in this CAFR for the 2009-10 fiscal year . Management is responsible for the integrity and fairness of the information presented, including data that, out of necessity, is based on estimates and judgments . The accounting policies used to prepare these financial statements conform to accounting principles generally accepted in the United States . Financial information presented throughout this Annual Report is consistent with these financial statements .
CalPERS maintains a system of internal controls designed to provide reasonable assurance that assets are properly safeguarded, transactions are properly executed, and financial statements are reliable . In addition, internal audit personnel provide a continuing review of the internal controls and operations of CalPERS, and the Chief of the Office of Audit Services regularly reports to the CalPERS Board of Administration’s Finance Committee . The Committee reviews the audit findings and recommenda-tions for improvements in internal control and operational efficiency and the actions of management to implement such recommendations .
Our independent external auditors, Macias Gini & O’Connell, have conducted an audit of the basic financial statements in accordance with auditing standards generally accepted in the United States of America, performing such tests and other procedures as they deem necessary to express an opinion in their report to the Board . The external auditors also have full and unrestricted access to the Board to discuss their audit and related findings as to the integrity of the financial reporting and adequacy of internal control systems .
AwardsThe Government Finance Officers Association of the United States and Canada (GFOA) awarded a Certificate of Achievement for Excellence in Financial Reporting to CalPERS for our Comprehensive Annual Financial Report for the fiscal year ended June 30, 2009 . This was the 14th consecutive year that CalPERS has achieved this prestigious award . In order to be awarded a Certificate
CalPERS Comprehensive Annual Financial Report, Fiscal Year Ended June 30, 2010 | introductory Section | 5
Chief Executive Officer’s Letter of Transmittal (continued)
In Closing. . . We shape the future of CalPERS . We are committed to the fundamental ethics and common sense rules upon which CalPERS was built 78 years ago . This strong foundation will guide us as we work together to restore confidence in CalPERS through exemplary customer service and increased accountability and transparency . I want to thank and acknowledge all employees for their dedication to achieving our mission — providing financial and health security for our members .
We are focused on ensuring quality service for our members and employers, and on pursuing ways to minimize employer pension costs in the long term . And, we are determined to achieve the excellence that our members, employers, and business partners expect from us as the largest public pension fund in the United States .
Anne StausbollChief Executive Officer
Asset AllocationAn integral part of the overall investment policy is the strategic asset allocation policy . This policy is designed to provide an optimal mix of asset class investments which can best meet future pension obligations with the lowest risk possible and the lowest cost to taxpayers, employers, and employees . This approach emphasizes strong diversifi-cation among a range of investments, each of which offers the prospect of compelling, long-term returns . These investments include allocations to listed markets (money markets, bonds, global stocks, and commodities) as well as private markets (real estate, private equity, hedge funds, forestland, and infrastructure) .
FundingThe bottom line for a retirement system is its level of funding . If the funding level is adequate, the ratio of total accumulated assets to total liabilities will be larger and the need for contributions will be reduced . Also, an adequate funding level gives participants assurance that their pension benefits are secure .
As of June 30, 2009, the Public Employees’ Retirement Fund (PERF) stood at 60 .8 percent funded on a market value of assets basis and 83 .3 percent funded on an actuarial value of assets basis . (Updated funded status for June 30, 2010 will be updated in the future CAFR .)
The advantages of a well-funded plan are that partici-pants can see assets that are irrevocably committed to the payment of promised benefits, and employees and taxpay-ers can minimize their contributions in support of defined benefits . The Required Supplemental Schedules to the Basic Financial Statements and the Actuarial Section contain a summary of CalPERS unfunded actuarial accrued liabilities .
Investment returns are used to generate additional revenues and, ultimately, this allows CalPERS to reduce employer contribution rates, reducing pension costs to employers and taxpayers .
We are focused on ensuring quality service for
our members and employers, and on pursuing
ways to minimize employer pension costs in
the long term.
6 | Introductory Section | CalPERS Comprehensive Annual Financial Report, Fiscal Year Ended June 30, 2010
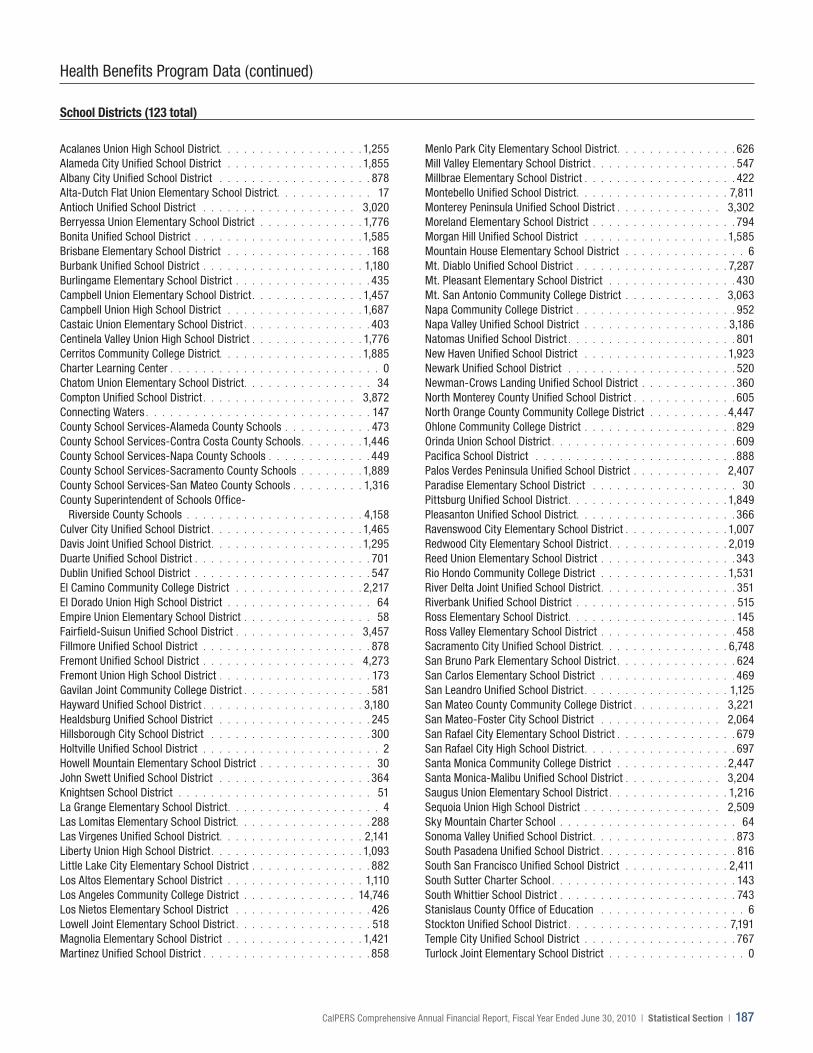
The California Public Employees’ Retirement System (CalPERS) is the nation’s largest public pension fund with total net assets of $205 .0 billion as of June 30, 2010 .
Headquartered in Sacramento, CalPERS provides retirement and health benefit services to more than 1 .6 million people and 3,033 school and public employers . The System also operates eight Regional Offices located in Fresno, Glendale, Orange County, Sacramento, San Diego, San Bernardino, San Jose, and Walnut Creek .
Led by a 13-member Board of Administration, consisting of member-elected, appointed, and ex officio members, CalPERS membership consists of 1,116,044 active and inactive members and 513,623 retirees, beneficiaries, and survivors from State, school, and public agencies .
Established by legislation in 1931, the System became operational in 1932 for the purpose of providing a secure retirement to State employees . In 1939, new legislation allowed public agency and classified school employees to join the System for retirement benefits . CalPERS began administering health benefits for State employees in 1962, and five years later, public agencies joined the Health Program on a contract basis .
A defined benefit retirement plan, CalPERS provides benefits based on a member’s years of service, age, and highest compensation . In addition, benefits are provided for disability and death . Today CalPERS offers additional programs, including long-term care insurance, a member home loan program, a deferred compensation retirement savings plan, and member education services .
About CalPERS
OUR MISSIONTo advance the financial and health security for all who participate in the System . We will fulfill this mission by creating and maintaining an environment that produces responsiveness to all those we serve .
VISIONPride in Our Service, Confidence for Your Future .
CORE VALUESQualityStrive to meet internal and external customer’s needs through innovation, competence, and teamwork . Seek to “do it right” the first time .
RespectSensitive to the needs of others, both within and outside the organization . Courteous, considerate, responsive and professional .
IntegrityIn all endeavors, act in an ethical, honest and professional manner .
OpennessWilling to listen to, and share information with others . Receptive to new ideas . Trusting .
AccountabilityTake ownership and responsibility for actions and their results . Accept both risks and rewards, trusting that good faith risks will not be punished .
CalPERS Comprehensive Annual Financial Report, Fiscal Year Ended June 30, 2010 | Introductory Section | 7
GOALS AND OBJECTIVES• We will be mission driven . • We will sustain a high-performance work culture . • We will make our programs, processes and strategic
decisions understandable to our stakeholders and highly valued by our internal and external customers .
• We will use our resources effectively . • We will continuously meet or exceed internal and
• We will design, develop and deliver our programs and benefits to be innovative and market sensitive .
• We will have a positive public identity and relationship with our external customers and stakeholders .
• We will effectively organize and focus resources to primarily assure that sufficient funds are available to pay benefits and, secondarily, minimize and stabilize employer contributions .
8 | Introductory Section | CalPERS Comprehensive Annual Financial Report, Fiscal Year Ended June 30, 2010
Henry JonesRetired Member (elected by retirees)Retired, Chief Financial Officer,Los Angeles Unified School DistrictTerm Ends: January 15, 2012
Bill LockyerState TreasurerEx Officio Member
Priya MathurEmployee Member (elected by public agency members)Economist, Bay Area Rapid TransitTerm Ends: January 15, 2015
Louis F. MoretPublic Representative 2
Term Ends: January 15, 2012
Tony OliveiraElected Official of Local Government 1
Kings County SupervisorTerm Ends: January 15, 2011
Vacant(Kurato Shimada through August 2010)Employee Member (elected by all members)Term Ends: January 15, 2014
1 Governor appointee2 Appointed jointly by the Speaker of the Assembly
and the Senate Rules Committee
Rob Feckner, PresidentEmployee Member (elected by school members)Glazing Specialist,Napa Valley Unified School DistrictTerm Ends: January 15, 2015
George Diehr, Vice PresidentEmployee Member (elected by State members)Professor, CSU San MateoTerm Ends: January 15, 2015
John ChiangState ControllerEx Officio Member
Patricia Clarey State Personnel Board Member (designated by the State Personnel Board)Term Ends: Serves at the pleasure of the SPB
Dan DunmoyerOfficial of Life Insurer 1
Senior Vice President,Legislative and Regulatory AffairsFarmers Insurance Groups of Companies and Zurich Financial ServicesTerm Ends: January 15, 2013
Debbie EndsleyDirector,Department of Personnel AdministrationEx Officio Member
JJ JelincicEmployee Member (elected by all members)Investment Officer III, CalPERSTerm Ends: January 15, 2014
Board of Administration
CalPERS Comprehensive Annual Financial Report, Fiscal Year Ended June 30, 2010 | Introductory Section | 9
Alan W. MilliganChief Actuary(Ron Seeling through March 2010)
Dale JablonskyAssistant Executive Officer,Information Technology Services(Teri Bennett through June 2010)
Russell FongAssistant Executive Officer, InterimAdministrative Services(Larry Jensen through September 2010)
Donna LumAssistant Executive Officer,Member & Benefit Services
Kathleen BillingsleyAssistant Executive Officer,Health Benefits(Doug McKeever, Interim, through November 2010)
Sheri HoferPrivacy and Security Officer,Enterprise Privacy & Protection
Executive Staff
Anne StausbollChief Executive Officer
Stephen W. KesslerDeputy Executive Officer,Operations
Ann BoyntonDeputy Executive Officer,Benefits Administration(Kathleen Hamilton through January 2010)
Patricia K. MachtDirector,External Affairs
Larry JensenChief Risk Officer, InterimEnterprise Risk Management
Joseph A. DearChief Investment Officer
Janine GuillotChief Operating Investment Officer,Investment Operations(Ken Marzion, Interim, through January 2010)
Peter H. MixonGeneral Counsel
10 | Introductory Section | CalPERS Comprehensive Annual Financial Report, Fiscal Year Ended June 30, 2010
CalPERS Comprehensive Annual Financial Report, Fiscal Year Ended June 30, 2010 | Introductory Section | 11
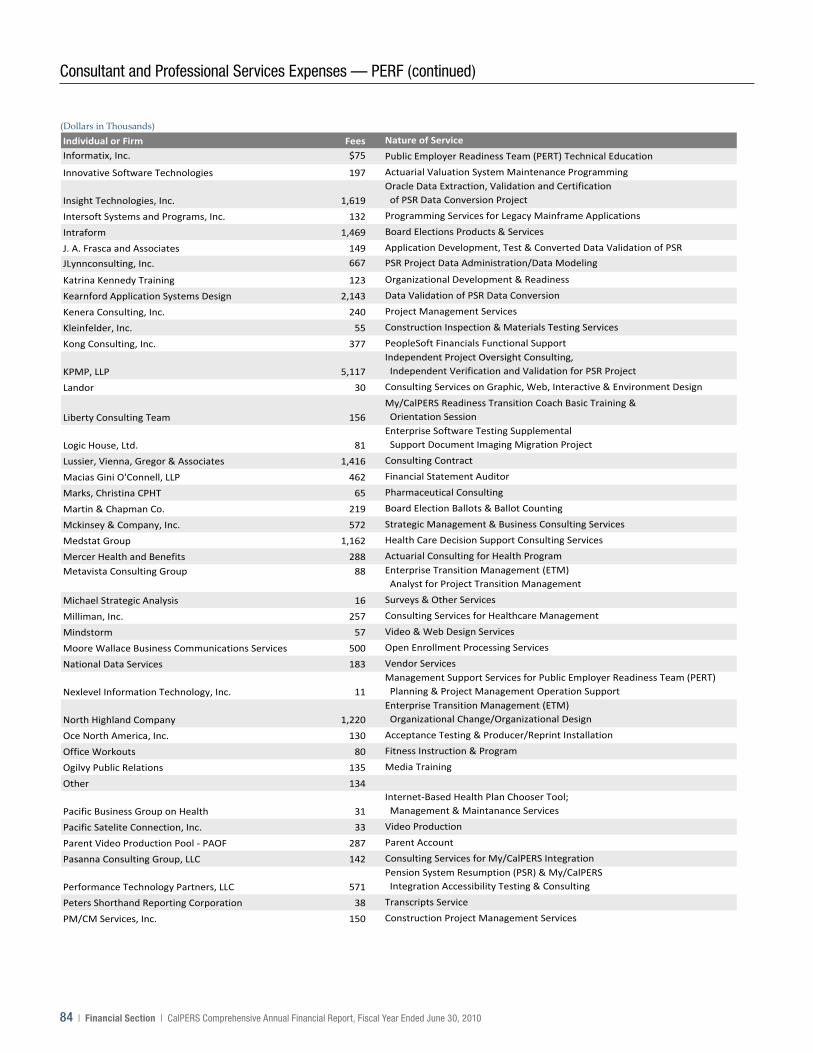
Consultant & Professional Services
Individual or Firm
Accenture, LLPACS Learning Services Advanced Systems Group, LLCAgreeya Solutions, LLCAlexan International, Inc. Ambire Consulting, Inc. ATV Video Center, Inc.Ballard Group, TheBase 3 Consulting Bedrosian & Associates Blackstone Technology GroupBuck Consultants, LLCBusiness Advantage Consulting California Department of JusticeCalifornia State Personnel Board California State Teachers' Retirement SystemCambria Solutions, Inc. Celer Systems, Inc.Chisoft Consultant Services, LLCCoach Source, LLCComac, An Iron Mountain Company ComsysConsortium of Business Continuity Professional, Inc.Cooperative Personnel ServicesCornerstone Fitness, Inc.Csidentity Corporation CSUS, College of Continuing Education Dee Hansford Consulting Delegata Department Of Personnel AdministrationDolamont Consulting, Inc. DSS Research, Inc.Eagle Management GroupEaton Interpreting ServicesEd Friend, Inc.EFI ActuariesEnclipse Corporation Equanim Technologies Evergreen Systems, Inc.Expressworks International, Inc. Global Access, LLCHealth Management AssociatesHewlett-PackardHighlands Consulting Group Information Technology Software ProfessionalInformatix, Inc.Innovative Software Technologies Insight Technologies, Inc. Intersoft Systems And Programs, Inc.Intraform J. A. Frasca And AssociatesJLynnconsulting, Inc. Katrina Kennedy Training Kearnford Application Systems Design
Individual or Firm
Kenera Consulting, Inc. Kleinfelder, Inc. Kong Consulting, Inc. KPMP, LLPLandorLiberty Consulting Team Logic House, Ltd.Lussier, Vienna, Gregor & Associates Macias Gini, & O'Connell, LLP Marks, Christina CPHTMartin & Chapman Co. Mckinsey & Company, Inc.Medstat Group Mercer Health And Benefits Metavista Consulting GroupMichael Strategic Analysis Milliman, Inc. Mindstorm Moore Wallace Business Communications Services National Data Services Nexlevel Information Technology, Inc.North Highland Company Oce North America, Inc. Office Workouts Ogilvy Public Relations Pacific Business Group on Health Pacific Satellite Connection, Inc.Parent Video Production Pool - PAFOPasanna Consulting Group, LLCPerformance Technology Partners, LLCPeters Shorthand Reporting Corporation PM/CM Services, Inc. Princeton Solutions Group, Inc. Propoint Technology, Inc.ProsciPublic Sector Consultants, Inc.R & G AssociatesRegents of the University of California Results GroupRunyon, Saltzman & Einhorn, Inc. Russbo, Inc.Saba Software, Inc.Saber Software, Inc.Sapphire Technologies, Inc. Sas International, Inc.Segula TechnologiesSenn-Delaney Leadership Shooting Star Solutions, LLCSign Language Interpreting Service Agency Softsol Resources, Inc.Software Ag, Inc.Sophus Consulting Spherion Pacific Enterprises, LLCStaff Tech, Inc.
12 | Introductory Section | CalPERS Comprehensive Annual Financial Report, Fiscal Year Ended June 30, 2010
Individual or Firm
Vantage Consulting Group, Inc. Vanwrite Viaspire Visionary Integration, LLC (VIP)Watson Wyatt WorldwideWestern Blue Wright On-Line SystemsZyncor Consulting
Individual or Firm
Stanfield Systems, Inc.State Controller's Office Suzanne Stone Freelance Services Take 1 Productions Teampersona, Inc. Technology Crest Corporation Thomson Reuters Trinity Technology Group, Inc. Two Shea Consulting, Inc.
Consultant & Professional Services (continued)
Financial Section
14 IndependentAuditor’sReport
16 Management’sDiscussion&Analysis
16 Introduction
16 FinancialHighlights
17 OverviewoftheFinancialStatements
19 FinancialOverviewofCalPERSFunds
20 FinancialAnalysisofCalPERSFunds
24 OtherDefinedBenefitPensionPlans
27 DefinedContributionPensionPlans
29 OtherPost-EmploymentBenefitFund
30 EnterpriseFunds
32 RequestsforInformation
14 | Financial Section | CalPERS Comprehensive Annual Financial Report, Fiscal Year Ended June 30, 2010
IndependentAuditor’sReport
Sacramento3000 S Street, Suite 300 Sacramento, CA 95816
916.928.4600
Walnut Creek
Oakland
Los Angeles
Newport Beach
San Diego
To the Board of Administration California Public Employees’ Retirement System Sacramento, California
Independent AudItor’S report
We have audited the accompanying statement of fiduciary net assets of the fiduciary funds and the statement of net assets of the proprietary funds of the California Public Employees’ Retirement System (the System or CalPERS), a component unit of the State of California, as of June 30, 2010, and the related statement of changes in fiduciary net assets of the fiduciary funds, and the statements of revenues, expenses and changes in net assets and cash flows of the proprietary funds for the year then ended. These financial statements are the responsibility of the System’s management. Our responsibility is to express an opinion on these financial statements based on our audit. The prior year summarized comparative information has been derived from the System’s 2009 financial statements on which our report dated November 19, 2009, expressed an unqualified opinion.
We conducted our audit in accordance with auditing standards generally accepted in the United States of America. Those standards require that we plan and perform the audit to obtain reasonable assurance about whether the financial statements are free of material misstatement. An audit includes consideration of internal control over financial reporting as a basis for designing audit procedures that are appropriate in the circumstances, but not for the purpose of expressing an opinion on the effectiveness of the System’s internal control over financial reporting. Accordingly, we express no such opinion. An audit also includes examining, on a test basis, evidence supporting the amounts and disclosures in the financial statements, assessing the accounting principles used and significant estimates made by management, as well as evaluating the overall financial statement presentation. We believe that our audit provides a reasonable basis for our opinion.
In our opinion, the financial statements referred to above present fairly, in all material respects, the fiduciary net assets of the fiduciary funds and the net assets of proprietary funds of the California Public Employees’ Retirement System as of June 30, 2010, and the changes in fiduciary net assets of the fiduciary funds and the changes in net assets and cash flows of the proprietary funds for the year then ended in conformity with the accounting principles generally accepted in the United States of America.
CalPERS Comprehensive Annual Financial Report, Fiscal Year Ended June 30, 2010 | Financial Section | 15
Independent Auditor’s Report (continued)
As described in Note 2, the System adopted the provisions of Governmental Accounting Standard Board Statements (GASBS) No. 51, Accounting and Financial Reporting for Intangible Assets, GASBS No. 53, Accounting and Financial Reporting for Derivative Instruments, and GASBS No. 57, OPEB Measurements by Agent Employers and Agent Multiple-Employer Plans.
As described in Note 5, actuarial data presented for the California Employers’ Retirement Benefit Trust Fund was derived from actuarial valuations performed by actuarial firms engaged by participating employers. Actuarial valuations must comply with the CalPERS OPEB Assumption Model, which requires the use of specified actuarial methods and assumptions.
Also discussed in Note 5 to the financial statements, actual contributions made by the State of California to the Judges Retirement Fund were significantly less than the actuarially determined annual required contributions. State of California contributions were used to fund benefit payments of the current period. As such, the Judges Retirement Fund does not retain the accumulated contributions of active members. Management and legal counsel believe the State of California is legally required to provide contributions to fund benefits when due.
The California Employers’ Long-Term Care Fund’s net assets deficit totaled approximately $118.5 million. As discussed in Note 9, the determination of the estimated liability for future policy benefits is very sensitive to the underlying actuarial assumptions.
As described in Note 10, based on the most recent actuarial valuation of the Public Employees’ Retirement Fund as of June 30, 2009, the System’s actuaries determined that, at June 30, 2009, the actuarial accrued obligation exceeded the actuarial value of its assets by $49.1 billion. The most recent actuarial valuation does not reflect the impact of the remaining deferred fiscal year 2009 investment losses.
The Management’s Discussion and Analysis, the Schedules of Funding Progress and the Schedules of Employer Contributions as listed in the table of contents are not a required part of the basic financial statements, but are supplementary information required by accounting principles generally accepted in the United States of America. We have applied certain limited procedures, which consisted principally of inquiries of management regarding the methods of measurement and presentation of the required supplementary information. However, we did not audit the information and express no opinion on it.
Our audit was conducted for the purpose of forming an opinion on the basic financial statements. The supporting schedules listed in the table of contents are presented for purposes of additional analysis and are not a required part of the basic financial statements. Such information has been subjected to auditing procedures applied in the audit of the basic financial statements and, in our opinion, is fairly stated in all material respects in relation to the basic financial statements taken as a whole.
Certified Public Accountants
Sacramento, CaliforniaNovember 17, 2010
16 | Financial Section | CalPERS Comprehensive Annual Financial Report, Fiscal Year Ended June 30, 2010
16 | Financial Section | CalPERS Comprehensive Annual Financial Report, Fiscal Year Ended June 30, 2010
INTRODUCTION This section presents Management’s Discussion and Analysis of the California Public Employees’ Retirement System’s (CalPERS or the System) financial performance during the fiscal year ended June 30, 2010. It is a narrative overview and analysis that we present in conjunction with the Chief Executive Officer’s Letter of Transmittal, included in the Introductory Section of this Comprehensive Annual Financial Report. It should also be read in conjunction with the basic financial statements of CalPERS, as presented in this report.
In addition to historical information, the Management’s Discussion and Analysis includes certain forward‐looking statements which involve certain risks and uncertainties. CalPERS actual results, performance, and achievements may differ from the results, performance, and achievements expressed or implied in such forward‐looking statements, due to a wide range of factors, including changes in interest rates, changes in the securities markets, general economic conditions, and legislative changes, as well as other factors.
CalPERS is primarily responsible for administering retirement benefits, health benefits, long‐term care benefits, and supplemental retirement savings plans. CalPERS comprises a total of 15 funds, including four defined benefit pension funds, one other post‐employment benefit fund, three defined contribution pension funds, four proprietary funds, and three agency funds. The Public Employees’ Retirement Fund (PERF) is the primary fund administered by CalPERS.
FINANCIAL HIGHLIGHTS Public Employees’ Retirement Fund (PERF)
The net assets of the PERF increased by $22.7 billion, or 12.7 percent. The increase was primarily due to a fourth quarter rally in global stock markets, and robust gains in fixed income and alternative investments. These gains were moderated by negative real estate returns. As a long‐term investor, CalPERS must view investment performance across a multi‐year horizon.
The PERF net rate of return on investments was 13.3 percent on a fair value basis, approximately 5.6 percentage points more than the actuarially assumed 7.75 percent investment return.
On June 15, 2009, the CalPERS board of Administration adopted a modification to the contribution rate smoothing policy. This new policy phased in the short‐term impact of the fiscal year 2008‐09 investment loss over three fiscal years, beginning in the 2010‐11 fiscal year for State and School employers, and in the 2011‐12 fiscal year for Public Agencies. An important aspect of this change in the smoothing method is that it prevents employer rates from increasing dramatically in subsequent fiscal years if the investment markets were to rebound in fiscal years 2009‐10 or 2010‐11.
In 2009‐10, PERF investment return was 13.3 percent. As a result of this return, employer rates are still expected to increase but at a much slower pace. Most employer contribution rates (for fiscal year 2011‐12 for the State and Schools and 2012‐13 for Public Agencies) are not expected to increase by more than 1 percent of payroll as a result of the phase in of the 2008‐09 investment loss. However, to the extent CalPERS earns its assumed 7.75 percent investment return in 2010‐11, the employer rates (for fiscal year 2012‐13 for the State and Schools and 2013‐14 for Public Agencies) are expected to increase in most cases between 2 percent and 5 percent of payroll and potentially much more if CalPERS earns less than 7.75 percent. In order to help employers understand such risk, CalPERS is now providing an investment return sensitivity analysis in all its actuarial valuation reports.
As of June 30, 2009, the date of the most recent actuarial valuation, the PERF was funded at 83.3 percent, based on the actuarial value of assets. A better measure of benefit security is the funded status on a market value of assets basis. On that basis, as a result of the negative 24.0 percent investment return in 2008‐09, the funded status declined from 88.7 percent at June 30, 2008, to 60.8 percent at June 30, 2009.
CalPERS has completed a demographic experience study and implemented new actuarial assumptions for use in the actuarial valuations for state, school, and public agency plans. These new assumptions are reflected in the actuarial valuation reports as of June 30, 2009. The new assumptions predict longer life expectancy for males, higher pay raises for long‐term employees, and slightly earlier retirement ages for all plans except local safety members whose retirement ages are slightly later. These new assumptions predict future experience better than the
Management’s Discussion & Analysis (continued)
CalPERS Comprehensive Annual Financial Report, Fiscal Year Ended June 30, 2010 | Financial Section | 17
current assumptions and provide improved funding for all plans.
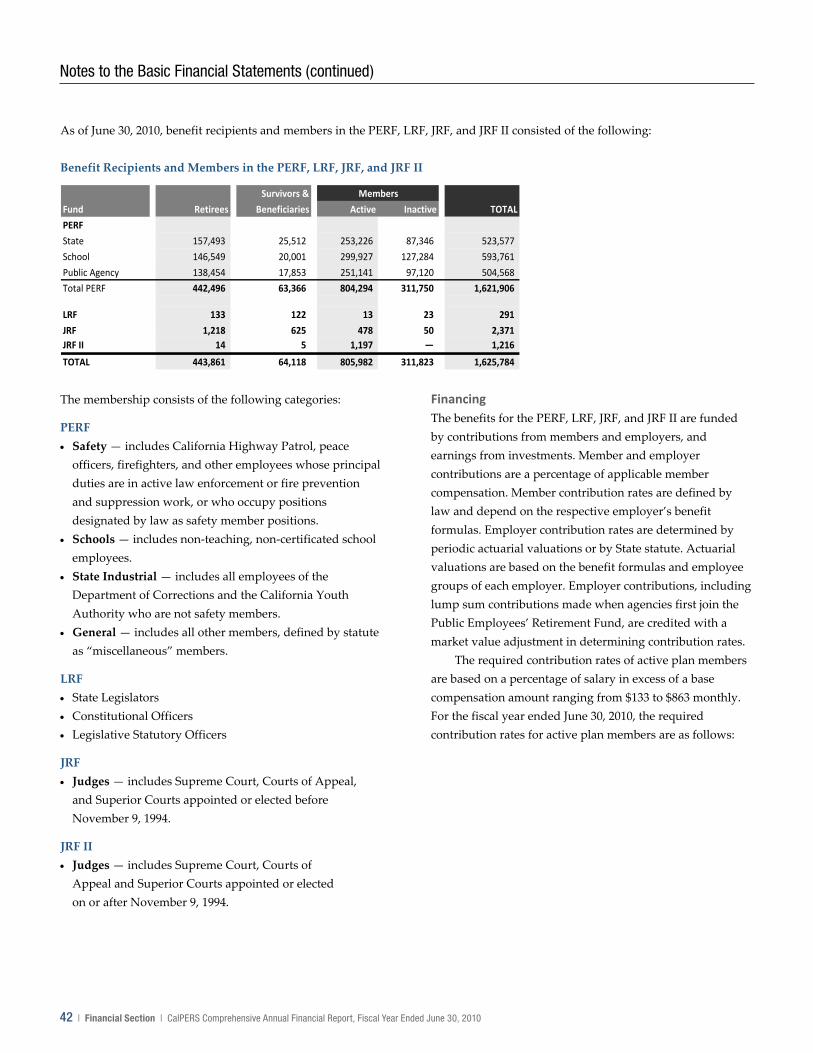
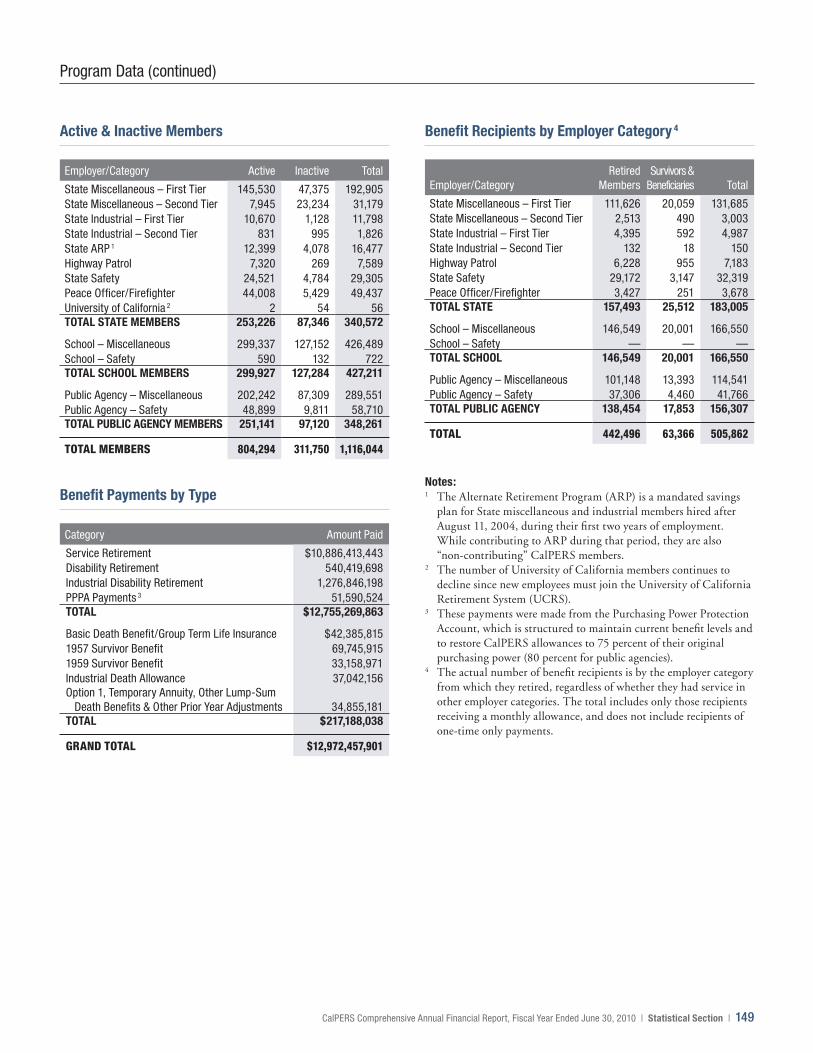
The PERF paid $13.0 billion in retirement benefits to 505,862 annuitants during the 2009‐10 fiscal year, compared to $11.8 billion paid to 484,955 annuitants during the 2008‐09 fiscal year. Benefit payments increased primarily due to an increase in the number of retirees and the average benefit amount, including cost‐of‐living adjustments (COLA).
The total active and inactive membership was 1,116,044 at June 30, 2010. The PERF received $3.4 billion in employee contributions from 804,294 active members and $7.0 billion in employer contributions from 1,544 employers during the 2009‐10 fiscal year, compared with $3.9 billion and $6.9 billion in employee and employer contributions respectively, in fiscal year 2008‐09. The decrease of employee contributions is attributable to budgetary salary constraints experienced by all California governments in 2009‐10.
Additional financial information related to the other
pension funds administered by CalPERS is included in the Financial Analysis of CalPERS Funds section of the Management’s Discussion and Analysis.
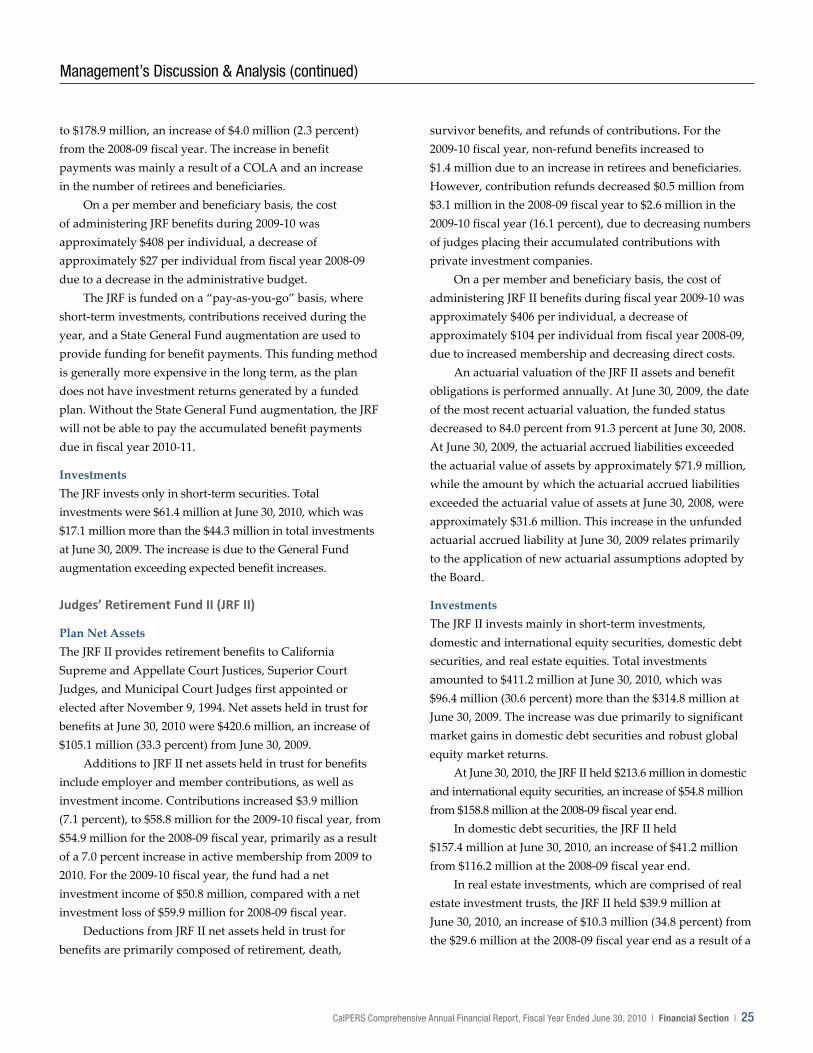
Other Post‐Employment Benefits, Health and Long‐Term Care Programs Contributions to the California Employers’ Retiree Benefit Trust Fund (CERBTF) were $674.4 million, with investment income of $128.9 million. The net asset value of the CERBTF at June 30, 2010 was $1.3 billion.
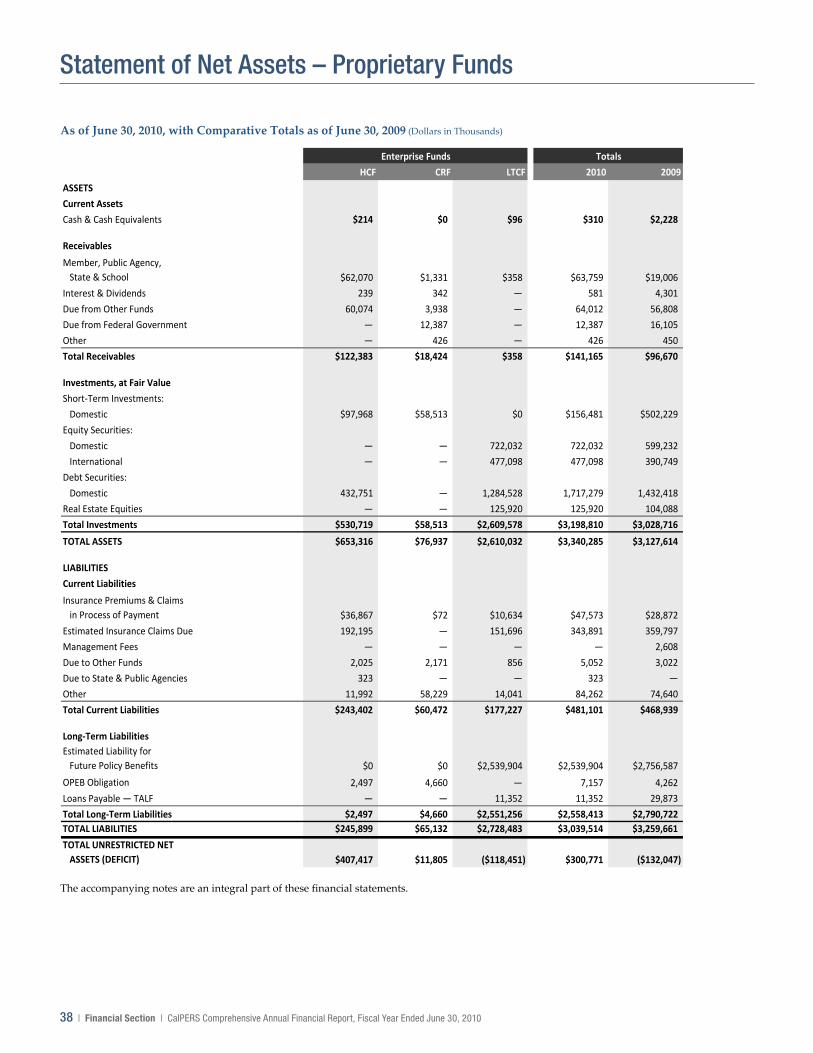
CalPERS administers the PERSCare, PERS Choice, and PERS Select self‐funded health care programs. Financial activity for these programs is accounted for through the Public Employees’ System Health Care Fund. The CalPERS self‐funded health care program incurred a loss of $300.3 million from operations, and unrestricted net assets decreased by $252.8 million to $407.4 million. The decrease in net assets is attributable to a planned reduction of unrestricted reserves. At the beginning of the 2009‐10 fiscal year unrestricted net assets exceeded the amount deemed necessary to fully fund current and anticipated claim expenses. A reduction in unrestricted net assets was achieved through the waiver of premiums for a limited period of time during the year.
The unrestricted net assets of the CalPERS Long‐Term Care Program amounted to a deficit of $118.5 million at June 30, 2010. This amounts to an average deficit of $742 for each of the 159,571 enrollees. The Long‐Term Care Program collected $285.9 million in premiums, and the approximate average annual premium per person was $1,792. The deficit of $118.5 million is a decrease of $693.1 million from the deficit of $811.6 million of June 30, 2009. The reduction of the fund deficit from the prior year is attributable to favorable investment returns since the June 30, 2009 valuation and approved premium rate increases effective July 1, 2010 which was reflected in the June 30, 2010 valuation. The impact of the investment returns and the premium rate increase was offset in part by the impact of the decrease in the investment rate of return assumption from 7.79 percent to 6.38 percent.
Investments During the 2009‐10 fiscal year, the PERF net assets increased from $178.9 billion to $201.6 billion. The increase in assets was largely felt by our global equity investments which started the fiscal year with $80.2 billion in assets and increased to $91.9 billion. The 14.6 percent increase in global equity investments was due to a rebound of global financial markets. The markets rebounded as a result of a coordinated global stimulus provided by governments.
OVERVIEW OF THE FINANCIAL STATEMENTS The Management’s Discussion and Analysis provides an introduction to and overview of the CalPERS basic financial statements, which comprise the following components: Fund Financial Statements, Notes to the Basic Financial Statements, Required Supplementary Information, and Other Supplemental Schedules. Collectively, this information presents the combined net assets held in trust for pension benefits, other post‐employment benefits, and the combined unrestricted net assets for each of the other funds administered by CalPERS as of June 30, 2010. It also summarizes the combined changes in net assets held in trust for pension and other post‐employment benefits, the combined changes in unrestricted net assets, and the cash flows of the proprietary funds for the year then ended, along with an actuarial view on the funded status of the defined benefit pension and other post‐employment plans. The
CalPERS Comprehensive Annual Financial Report, Fiscal Year Ended June 30, 2010 | Financial Section | 17
CalPERS Comprehensive Annual Financial Report, Fiscal Year Ended June 30, 2010 | Financial Section | 17
current assumptions and provide improved funding for all plans.
The PERF paid $13.0 billion in retirement benefits to 505,862 annuitants during the 2009‐10 fiscal year, compared to $11.8 billion paid to 484,955 annuitants during the 2008‐09 fiscal year. Benefit payments increased primarily due to an increase in the number of retirees and the average benefit amount, including cost‐of‐living adjustments (COLA).
The total active and inactive membership was 1,116,044 at June 30, 2010. The PERF received $3.4 billion in employee contributions from 804,294 active members and $7.0 billion in employer contributions from 1,544 employers during the 2009‐10 fiscal year, compared with $3.9 billion and $6.9 billion in employee and employer contributions respectively, in fiscal year 2008‐09. The decrease of employee contributions is attributable to budgetary salary constraints experienced by all California governments in 2009‐10.
Additional financial information related to the other
pension funds administered by CalPERS is included in the Financial Analysis of CalPERS Funds section of the Management’s Discussion and Analysis.
Other Post‐Employment Benefits, Health and Long‐Term Care Programs Contributions to the California Employers’ Retiree Benefit Trust Fund (CERBTF) were $674.4 million, with investment income of $128.9 million. The net asset value of the CERBTF at June 30, 2010 was $1.3 billion.
CalPERS administers the PERSCare, PERS Choice, and PERS Select self‐funded health care programs. Financial activity for these programs is accounted for through the Public Employees’ System Health Care Fund. The CalPERS self‐funded health care program incurred a loss of $300.3 million from operations, and unrestricted net assets decreased by $252.8 million to $407.4 million. The decrease in net assets is attributable to a planned reduction of unrestricted reserves. At the beginning of the 2009‐10 fiscal year unrestricted net assets exceeded the amount deemed necessary to fully fund current and anticipated claim expenses. A reduction in unrestricted net assets was achieved through the waiver of premiums for a limited period of time during the year.
The unrestricted net assets of the CalPERS Long‐Term Care Program amounted to a deficit of $118.5 million at June 30, 2010. This amounts to an average deficit of $742 for each of the 159,571 enrollees. The Long‐Term Care Program collected $285.9 million in premiums, and the approximate average annual premium per person was $1,792. The deficit of $118.5 million is a decrease of $693.1 million from the deficit of $811.6 million of June 30, 2009. The reduction of the fund deficit from the prior year is attributable to favorable investment returns since the June 30, 2009 valuation and approved premium rate increases effective July 1, 2010 which was reflected in the June 30, 2010 valuation. The impact of the investment returns and the premium rate increase was offset in part by the impact of the decrease in the investment rate of return assumption from 7.79 percent to 6.38 percent.
Investments During the 2009‐10 fiscal year, the PERF net assets increased from $178.9 billion to $201.6 billion. The increase in assets was largely felt by our global equity investments which started the fiscal year with $80.2 billion in assets and increased to $91.9 billion. The 14.6 percent increase in global equity investments was due to a rebound of global financial markets. The markets rebounded as a result of a coordinated global stimulus provided by governments.
OVERVIEW OF THE FINANCIAL STATEMENTS The Management’s Discussion and Analysis provides an introduction to and overview of the CalPERS basic financial statements, which comprise the following components: Fund Financial Statements, Notes to the Basic Financial Statements, Required Supplementary Information, and Other Supplemental Schedules. Collectively, this information presents the combined net assets held in trust for pension benefits, other post‐employment benefits, and the combined unrestricted net assets for each of the other funds administered by CalPERS as of June 30, 2010. It also summarizes the combined changes in net assets held in trust for pension and other post‐employment benefits, the combined changes in unrestricted net assets, and the cash flows of the proprietary funds for the year then ended, along with an actuarial view on the funded status of the defined benefit pension and other post‐employment plans. The
18 | Financial Section | CalPERS Comprehensive Annual Financial Report, Fiscal Year Ended June 30, 2010
18 | Financial Section | CalPERS Comprehensive Annual Financial Report, Fiscal Year Ended June 30, 2010
information available in each of these sections is briefly summarized as follows.
Fund Financial Statements At June 30, 2010, financial statements are presented for the two types of funds administered by CalPERS: fiduciary funds, where CalPERS acts in a fiduciary capacity as a trustee or agent for others and is responsible for handling the assets placed under its control; and proprietary funds, where fees are charged for services provided and the focus is on determining financial position, operating and non‐operating income, cash flows and changes in net assets.
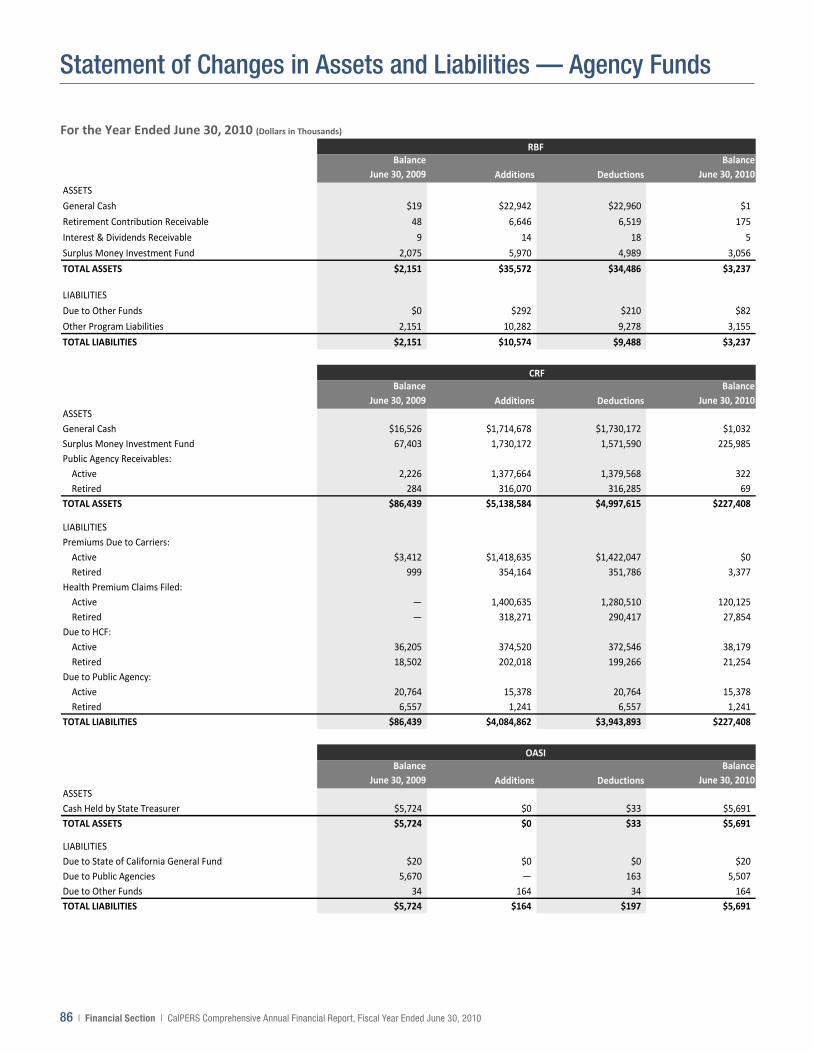
Fiduciary Funds — include pension trust funds, one other post‐employment defined benefit fund, and agency funds. The defined benefit plans administered by CalPERS include the PERF, LRF, JRF, JRF II, and the CERBTF. The defined contribution plans administered by CalPERS include the State Peace Officers’ and Firefighters’ Defined Contribution Plan Fund (SPOFF), the Public Agency Deferred Compensation Program (IRC 457), and the Supplemental Contributions Program Fund (SCPF). The remaining fiduciary funds are the Old Age & Survivors’ Insurance Revolving Fund (OASI), the Contingency Reserve Agency Fund (CRF), and the Replacement Benefit Fund (RBF). The fiduciary funds are used to account for resources held for the benefit of CalPERS participants. A statement of fiduciary net assets and a statement of changes in fiduciary net assets are presented for the fiduciary funds as of and for the year ended June 30, 2010, along with comparative total information as of and for the year ended June 30, 2009. These financial statements reflect the resources available to pay benefits to retirees and other beneficiaries as of year end, as well as the changes in those resources during the year.
Proprietary Funds — include the following enterprise funds: the Public Employees’ Health Care Fund (HCF), the Public Employees’ Contingency Reserve Fund (CRF), the Public Employees’ Long‐Term Care Fund (LTCF), and the Public Employees’ Deferred Compensation Fund (DCF). Proprietary funds are used to account for CalPERS business‐type activities, where fees are charged to cover the costs of certain services, including long‐term care, health care, and other benefits. A statement of net assets, a statement of revenues, expenses, and changes in net assets, and a statement of cash flows are presented for the proprietary funds as of and for the year ended June 30, 2010, along with comparative total information as of
and for the year ended June 30, 2009. These financial statements reflect the net assets, changes in net assets, and cash flows resulting from CalPERS business‐type activities.
Notes to the Basic Financial Statements The Notes to the Basic Financial Statements provide additional information that is essential to a full understanding of the information provided in the fund financial statements. Information available in the notes to the financial statements is described below.
Note 1 — provides a general description of CalPERS, as well as a concise description of each of the funds administered by CalPERS. Information regarding employer and member participation in the pension plans administered by CalPERS is also provided.
Note 2 — provides a summary of significant accounting policies, including the basis of accounting for each of the fund types: investment accounting policies, management’s use of estimates, and other significant accounting policies.
Note 3 — provides information on cash and cash equivalents.
Note 4 — describes investments, including investing authority, investment risk categorizations, and additional information about cash, securities lending, and derivatives.
Note 5 — provides information about employer contributions to the pension and other post‐employment benefit funds administered by CalPERS.
Note 6 — provides information on commitments. Note 7 — provides information on potential
contingencies of CalPERS. Note 8 — provides detailed information on the
estimated claims liability of the HCF. Note 9 — provides information regarding the LTCF
June 30, 2010 actuarial valuation. Note 10 — provides information regarding the funded
status and actuarial assumptions for the PERF, LRF, JRF, JRF II, and CERBTF.
Required Supplementary Information Because of the long‐term nature of public defined benefit pension and other post‐employment benefit plans, financial statements for the past year alone cannot provide sufficient information to properly reflect the funding progress of the plans. Therefore, in addition to the basic financial statements, two required schedules of historical trend
Management’s Discussion & Analysis (continued)
CalPERS Comprehensive Annual Financial Report, Fiscal Year Ended June 30, 2010 | Financial Section | 19
information related to the defined benefit and other post‐employment benefit plans are presented as part of the Required Supplementary Information (RSI) section of the basic financial statements. These two schedules are the Schedule of Funding Progress and the Schedule of Employer Contributions. These two schedules are based on the actuarial valuations for the pension plans performed by CalPERS actuaries and the other post‐employment benefits sponsoring employers’ actuaries, and provide additional actuarial information that contributes to the understanding of the changes in the actuarial funding and the funding progress of these defined benefit and other post‐employment benefit plans over the past six years. The actuarial information is based upon assumptions made about future events at the time the valuations were performed, and, therefore, the amounts presented are management’s estimates. Also included as part of the RSI, is the Schedule of Claims Development Information for the HCF.
Other Supplemental Schedules Other schedules include detailed information on administrative expenses incurred by CalPERS‐administered funds, as well as investment and other professional services expenses incurred, and schedules of changes for agency funds.
FINANCIAL OVERVIEW OF CalPERS FUNDS Fiduciary Funds
Collectively, the net assets held in trust for all fiduciary funds were a total of $204.7 billion at June 30, 2010, an increase of $23.5 billion (13.0 percent) from $181.2 billion at June 30, 2009.
Additions to net assets held in trust for benefits include employer and member contributions as well as investment income/loss. For the 2009‐10 fiscal year, total additions were $37.3 billion, an increase of $83.2 billion from the 2008‐09 fiscal year. Deductions consist primarily of retirement, death, and survivor benefits, refunds, administrative expenses, participant withdrawals, and OPEB reimbursements. For the 2009‐10 fiscal year, total deductions were $14.1 billion, an increase of $1.2 billion (9.3 percent) from the 2008‐09 fiscal year.
Investments Fiduciary fund investments, excluding securities lending collateral, totaled $206.9 billion at June 30, 2010, which was $20.9 billion (11.2 percent) more than $186.0 billion at June 30, 2009. The increase was due primarily to healthy global equity market returns and robust gains in fixed income and alternative investments.
Total investments held by CalPERS fiduciary funds at June 30, 2010, compared to the 2008‐09 fiscal year end, are as follows: $9.8 billion in short‐term domestic and international securities, a decrease of $2.5 billion (20.3 percent) from $12.3 billion. The decrease was primarily due to the sale of short‐term investments. The proceeds were transferred to cash to meet liquidity needs.
$93.7 billion in domestic and international equity securities, an increase of $12.2 billion (15.0 percent) from $81.5 billion.
$54.3 billion in domestic and international debt securities, an increase of $1.9 billion (3.6 percent) from $52.4 billion. The increase was due primarily to lower yields of debt securities on treasury and non‐treasury bonds.
$5.0 billion in Inflation Linked Asset Class (ILAC), an increase of $0.6 billion (13.6 percent) from $4.4 billion. The increase was due primarily to an increase in investments in the forest land portfolio and domestic U.S. Treasury Securities. The ILAC allocation is as follows: – $1.5 billion in inflation‐linked bonds, an increase of $0.1 billion from $1.4 billion.
– $0.4 billion in infrastructure, an increase of $0.3 billion from $0.1 billion.
– $2.4 billion in forestland, an increase of $0.1 billion from $2.3 billion.
– $0.7 billion in commodities, an increase of $0.1 billion from $0.6 billion.
$28.9 billion in real estate on a gross basis (property value). (The gross value equates to $15.4 billion net of $13.5 billion in related debt.) On a gross basis, the real estate decreased $1.3 billion from $30.2 billion gross at fiscal year end 2008‐09. The decrease was due primarily to declines in the commercial real estate market values.
$28.7 billion in alternative investments, an increase of $6.9 billion from $21.8 billion.
CalPERS Comprehensive Annual Financial Report, Fiscal Year Ended June 30, 2010 | Financial Section | 19
CalPERS Comprehensive Annual Financial Report, Fiscal Year Ended June 30, 2010 | Financial Section | 19
information related to the defined benefit and other post‐employment benefit plans are presented as part of the Required Supplementary Information (RSI) section of the basic financial statements. These two schedules are the Schedule of Funding Progress and the Schedule of Employer Contributions. These two schedules are based on the actuarial valuations for the pension plans performed by CalPERS actuaries and the other post‐employment benefits sponsoring employers’ actuaries, and provide additional actuarial information that contributes to the understanding of the changes in the actuarial funding and the funding progress of these defined benefit and other post‐employment benefit plans over the past six years. The actuarial information is based upon assumptions made about future events at the time the valuations were performed, and, therefore, the amounts presented are management’s estimates. Also included as part of the RSI, is the Schedule of Claims Development Information for the HCF.
Other Supplemental Schedules Other schedules include detailed information on administrative expenses incurred by CalPERS‐administered funds, as well as investment and other professional services expenses incurred, and schedules of changes for agency funds.
FINANCIAL OVERVIEW OF CalPERS FUNDS Fiduciary Funds
Collectively, the net assets held in trust for all fiduciary funds were a total of $204.7 billion at June 30, 2010, an increase of $23.5 billion (13.0 percent) from $181.2 billion at June 30, 2009.
Additions to net assets held in trust for benefits include employer and member contributions as well as investment income/loss. For the 2009‐10 fiscal year, total additions were $37.3 billion, an increase of $83.2 billion from the 2008‐09 fiscal year. Deductions consist primarily of retirement, death, and survivor benefits, refunds, administrative expenses, participant withdrawals, and OPEB reimbursements. For the 2009‐10 fiscal year, total deductions were $14.1 billion, an increase of $1.2 billion (9.3 percent) from the 2008‐09 fiscal year.
Investments Fiduciary fund investments, excluding securities lending collateral, totaled $206.9 billion at June 30, 2010, which was $20.9 billion (11.2 percent) more than $186.0 billion at June 30, 2009. The increase was due primarily to healthy global equity market returns and robust gains in fixed income and alternative investments.
Total investments held by CalPERS fiduciary funds at June 30, 2010, compared to the 2008‐09 fiscal year end, are as follows: $9.8 billion in short‐term domestic and international securities, a decrease of $2.5 billion (20.3 percent) from $12.3 billion. The decrease was primarily due to the sale of short‐term investments. The proceeds were transferred to cash to meet liquidity needs.
$93.7 billion in domestic and international equity securities, an increase of $12.2 billion (15.0 percent) from $81.5 billion.
$54.3 billion in domestic and international debt securities, an increase of $1.9 billion (3.6 percent) from $52.4 billion. The increase was due primarily to lower yields of debt securities on treasury and non‐treasury bonds.
$5.0 billion in Inflation Linked Asset Class (ILAC), an increase of $0.6 billion (13.6 percent) from $4.4 billion. The increase was due primarily to an increase in investments in the forest land portfolio and domestic U.S. Treasury Securities. The ILAC allocation is as follows: – $1.5 billion in inflation‐linked bonds, an increase of $0.1 billion from $1.4 billion.
– $0.4 billion in infrastructure, an increase of $0.3 billion from $0.1 billion.
– $2.4 billion in forestland, an increase of $0.1 billion from $2.3 billion.
– $0.7 billion in commodities, an increase of $0.1 billion from $0.6 billion.
$28.9 billion in real estate on a gross basis (property value). (The gross value equates to $15.4 billion net of $13.5 billion in related debt.) On a gross basis, the real estate decreased $1.3 billion from $30.2 billion gross at fiscal year end 2008‐09. The decrease was due primarily to declines in the commercial real estate market values.
$28.7 billion in alternative investments, an increase of $6.9 billion from $21.8 billion.
20 | Financial Section | CalPERS Comprehensive Annual Financial Report, Fiscal Year Ended June 30, 2010
20 | Financial Section | CalPERS Comprehensive Annual Financial Report, Fiscal Year Ended June 30, 2010
Proprietary Funds CalPERS total unrestricted net assets for proprietary funds at June 30, 2010 were $300.8 million, an increase of $432.8 million from a negative of $132.0 million at June 30, 2009. The increase was due primarily to a reduction in the estimated liability for future policy benefits in the Long‐Term Care Fund and favorable investment returns.
Operating revenues consist of self insurance premiums, administrative fees, and other miscellaneous additions. For the 2009‐10 fiscal year, total operating revenues were $1.7 billion, a decrease of $0.2 billion (10.5 percent) from the 2008‐09 fiscal year. The decrease was due primarily to two months of premium holiday approved by the Board and given to members of the HCF in fiscal year 2009‐10. Operating expenses consist primarily of claims expense, increase/decrease in estimated liabilities, and administrative expenses. For the 2009‐10 fiscal year, total expenses were $1.6 billion, a decrease of $0.6 billion (27.3 percent) from the 2008‐09 fiscal year. The decrease in total expenses was due primarily to a reduction in the estimated liability for future policy benefits in the LTCF. The LTCF estimated liability for future policy benefits declined as a result of an actuarial valuation as of June 30, 2010 which reflects positive fiscal year 2009‐10 investment returns and Board approved premium rate increases effective July 1, 2010 which were reflected in the June 30, 2010 valuation. The impact of these changes was offset in part by the impact of the decrease in the investment rate of return assumption from 7.79 percent to 6.38 percent. Non‐operating revenues consist of net appreciation (depreciation) in the fair value of investments, interest, dividends and other investment income. Total non‐operating revenues were $400.4 million, an increase in revenues of $743.8 million from the loss of $343.4 million in fiscal year 2008‐09. The increase was primarily due to positive investment results from a robust global equity market.
Investments Proprietary funds investments totaled $3.2 billion at June 30, 2010, which were $0.2 billion (6.7 percent) more than $3.0 billion at June 30, 2009.
Total investments held by CalPERS proprietary funds, compared to the 2008‐09 fiscal year end, are as follows: $156.5 million in highly liquid, short‐term domestic securities, a decrease of $345.7 million from $502.2 million.
$1.2 billion in domestic and international equity securities, an increase of $0.2 billion from $1.0 billion.
$1.7 billion in domestic debt securities, an increase of $0.3 billion from $1.4 billion.
$125.9 million in real estate, an increase of $21.8 million from $104.1 million.
FINANCIAL ANALYSIS OF CalPERS FUNDS Public Employees’ Retirement Fund (PERF)
Plan Net Assets The PERF provides retirement benefits to State of California and other California public agency employees. PERF benefits are funded by member and employer contributions and by earnings on investments. The PERF net assets held in trust for benefits at June 30, 2010 were $201.6 billion, an increase of $22.7 billion (12.7 percent) from $178.9 billion at June 30, 2009.
Additions to PERF net assets held in trust for benefits include employer and member contributions, and investment gains. For the 2009‐10 fiscal year, employer and member contributions totaled $10.3 billion, a decrease of $0.5 billion from the 2008‐09 fiscal year due to salary reductions from budget constraints. The PERF recognized net investment income of $25.6 billion for the 2009‐10 fiscal year, compared with a net investment loss of $57.4 billion for the 2008‐09 fiscal year.
Deductions from PERF net assets held in trust for benefits in the 2009‐10 fiscal year totaled $13.4 billion, an increase of $1.0 billion (8.0 percent) from the 2008‐09 fiscal year. The increase in benefit payments was primarily a result of an increase in the number of beneficiaries from 484,955 to 505,862 and increases in average benefits, including COLA. The costs of administering the PERF benefits amounted to $278.0 million, a decrease of approximately $149.8 million (35.0 percent) from the 2008‐09 fiscal year, due to a significant reduction of information technology expenses which are now being capitalized in accordance with newly adopted GASB Statement No. 51 and decreased personnel services and operating expenses due to mandatory furloughs.
On a per member and beneficiary basis, the cost of administering PERF benefits during the 2009‐10 fiscal year was approximately $171 per individual, a decrease of approximately $93 per individual from the 2008‐09 fiscal year.
Management’s Discussion & Analysis (continued)
CalPERS Comprehensive Annual Financial Report, Fiscal Year Ended June 30, 2010 | Financial Section | 21
At June 30, 2009, the date of the most recent actuarial valuation, the funded status of the PERF was 83.3 percent, which was a 3.6 percentage point decline from the funded status at June 30, 2008. The amount by which PERF actuarial benefit liabilities exceeded actuarial assets was $49.1 billion at June 30, 2009, compared with a $35.1 billion funding deficit at June 30, 2008. This increase relates primarily to the
application of new demographic assumptions adopted by the Board and the recognition of actuarial losses from prior fiscal years when the PERF incurred negative investment returns. Current year gains will affect future years’ funded status and contribution rates using the CalPERS policy of actuarial asset smoothing.
Net Assets — PERF (Dollars in Thousands)
2010 2009Total Percentage
Change
ASSETS
Cash, Cash Equivalents & Total Receivables $2,915,646 $3,891,020 ‐25.1%
22 | Financial Section | CalPERS Comprehensive Annual Financial Report, Fiscal Year Ended June 30, 2010
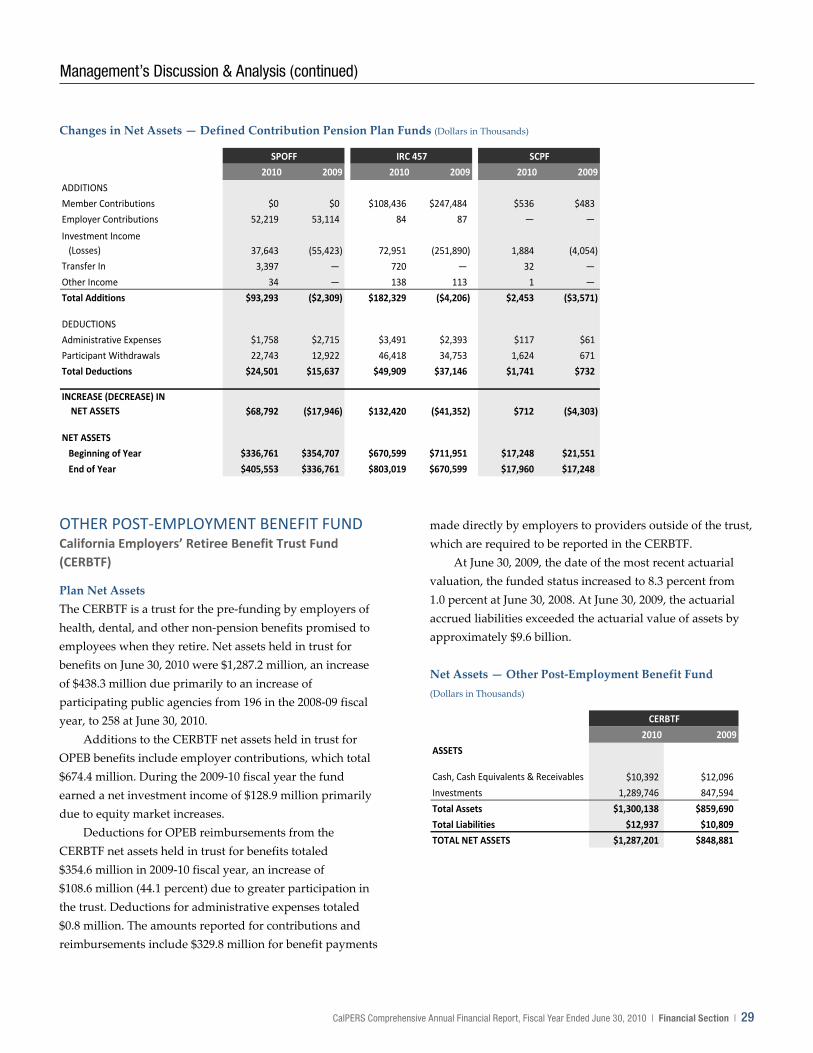
Additions — PERF (Dollars in Thousands)
A. Member ContributionsB. Employer ContributionsC. Investment (Losses) Income & Other
$3,378,867
$6,955,049
$25,577,529
AB
C
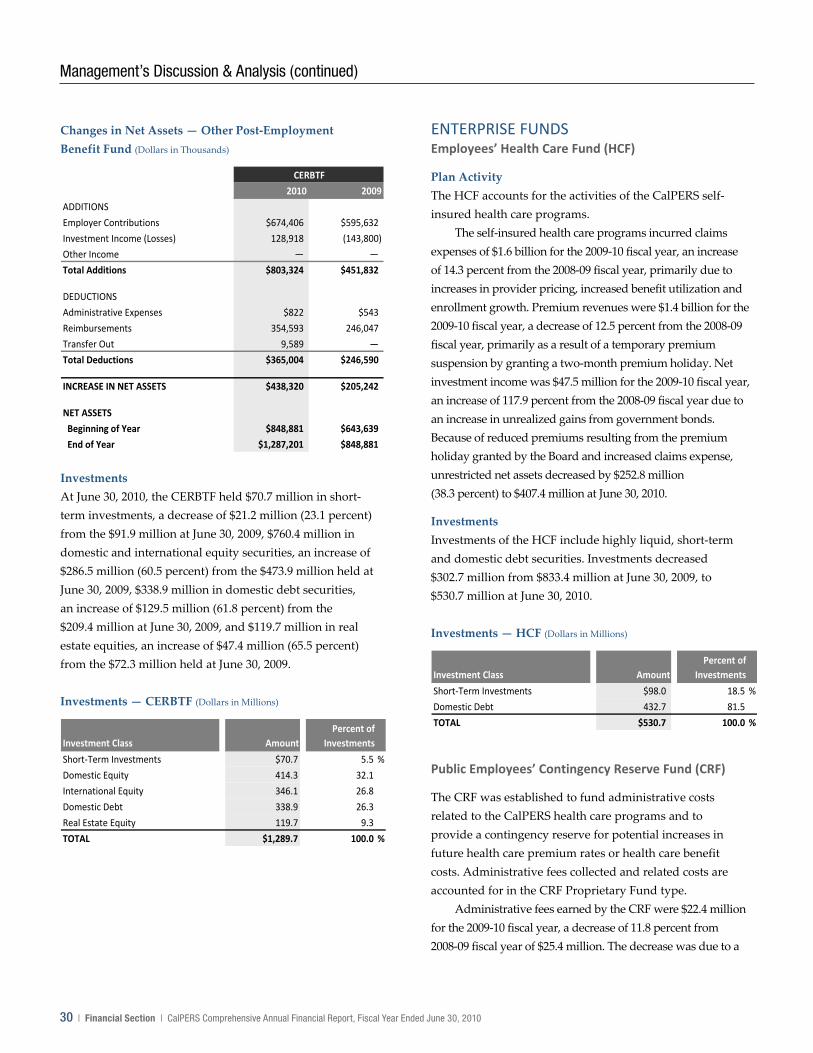
Deductions — PERF (Dollars in Thousands)
A. Retirement BenefitsB. Refund of ContributionsC. Administrative Expenses
$12,972,457
$182,387
$278,036
AB
C
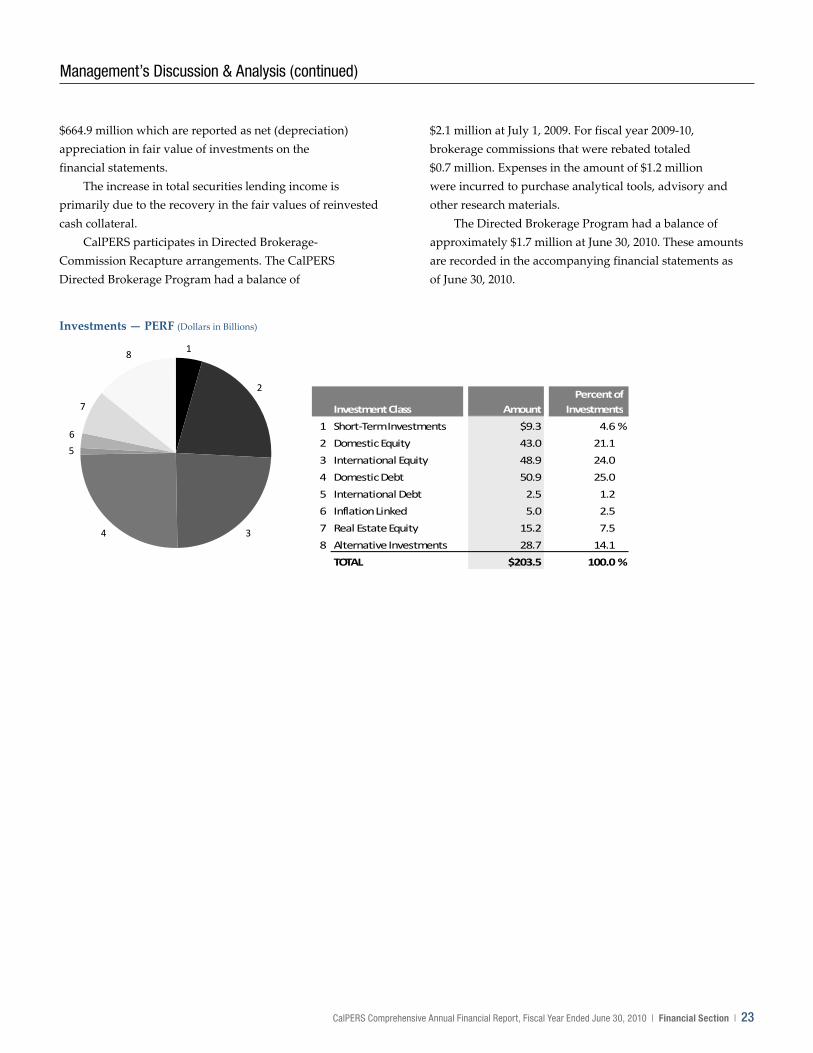
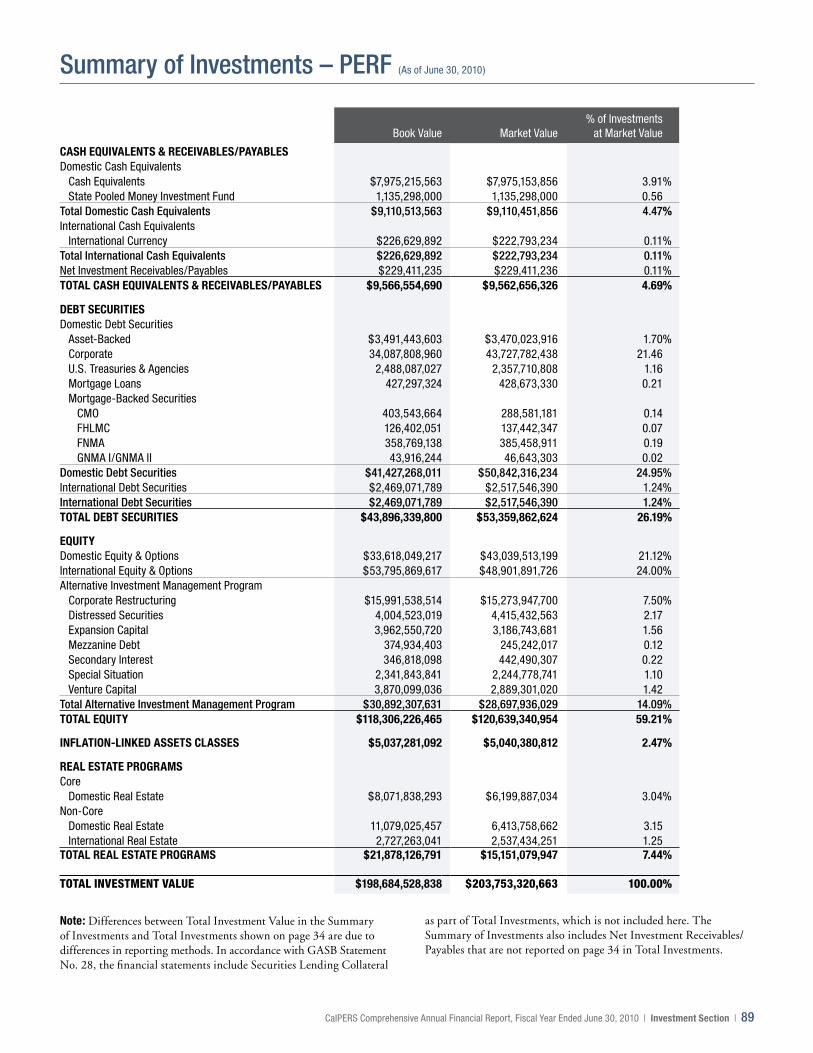
Investments PERF investments, excluding securities lending collateral, totaled $203.5 billion at June 30, 2010, which was $20.0 billion (10.9 percent) more than the $183.5 billion in total PERF investments at June 30, 2009.
At June 30, 2010, the PERF held $91.9 billion in domestic and international equity securities, an increase of $11.7 billion from $80.2 billion at 2008‐09 fiscal year end.
In domestic and international debt securities, the PERF held $53.4 billion at June 30, 2010, an increase of $1.8 billion from $51.6 billion at 2008‐09 fiscal year end.
In real estate investments on a gross basis, the PERF held $28.7 billion at June 30, 2010. The gross value of real estate investments equates to $15.2 billion in real estate value, net of $13.5 billion in real estate related debt. The real estate debt amounts to 47.0 percent of the total gross real estate fair value. On a gross basis, real estate investments decreased $1.4 billion from the $30.1 billion gross real estate investments at the 2008‐09 fiscal year end.
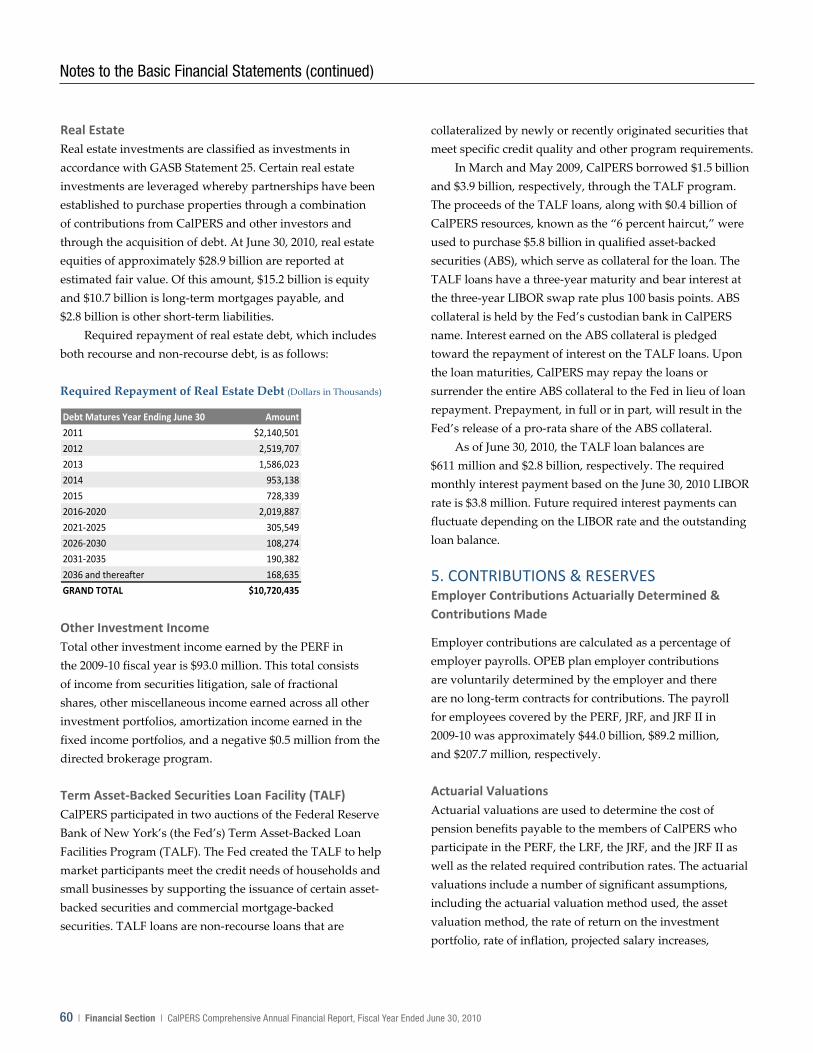
Real estate investments are classified as investments in accordance with GASB Statement 25. Certain real estate investments are leveraged whereby partnerships have been established to purchase properties through a combination of contributions from CalPERS and other investors and through the acquisition of debt.
In addition, the Investment Policy for Equity Real Estate Leverage provides for the use of Credit Accommodations. These accommodations generally refer to a guarantee executed by CalPERS, whereby CalPERS agrees to pay the debt obligation of a real estate partnership entity in the event the entity fails to pay the debt obligation.
The $13.5 billion in real estate debt is made up of $10.7 billion in long‐term mortgages payable and $2.8 billion in other short‐term liabilities.
At June 30, 2010, the Inflation Linked Asset Class (ILAC) held $1.5 billion in inflation‐linked bonds, $0.4 billion in infrastructure, $2.4 billion in forestland, and $0.7 billion in commodities exposure.
In alternative investments, the PERF held $28.7 billion at June 30, 2010, an increase of $6.9 billion from $21.8 billion at the 2008‐09 fiscal year end.
In short‐term investments, the PERF held $9.3 billion at June 30, 2010, a decrease of $2.7 billion from the $12.0 billion at the 2008‐09 fiscal year end.
The PERF earned other investment income of $93.0 million for the 2009‐10 fiscal year. Included in other investment income was income earned from securities litigation, sale of fractional shares, and other miscellaneous income.
The PERF earns additional investment income by lending investment securities. Borrowers pay a fee for the right to borrow securities, and then provide cash collateral to the PERF for 102 percent to 105 percent of the values of the securities borrowed for domestic and international securities, respectively. The over collateralization is an industry standard which minimizes counterparty risk and it ensures the PERF is made whole in the event the borrower fails to return the security. The PERF pays the borrower a rate for holding cash collateral, called a rebate. The PERF invests the majority of cash collateral in short‐term, high credit quality fixed income securities. For the 2009‐10 fiscal year, the total securities lending income amounted to $934 million, compared to the total securities lending losses of $1.2 billion in fiscal year 2008‐09. The current year total securities lending income includes net income of $141.5 million, which is reported in the statement of changes in fiduciary net assets as securities lending income and cost of lending securities. The total income amount also includes unrealized gains of $127.6 million and realized gains of
Management’s Discussion & Analysis (continued)
CalPERS Comprehensive Annual Financial Report, Fiscal Year Ended June 30, 2010 | Financial Section | 23
$664.9 million which are reported as net (depreciation) appreciation in fair value of investments on the financial statements.
The increase in total securities lending income is primarily due to the recovery in the fair values of reinvested cash collateral.
CalPERS participates in Directed Brokerage‐Commission Recapture arrangements. The CalPERS Directed Brokerage Program had a balance of
$2.1 million at July 1, 2009. For fiscal year 2009‐10, brokerage commissions that were rebated totaled $0.7 million. Expenses in the amount of $1.2 million were incurred to purchase analytical tools, advisory and other research materials.
The Directed Brokerage Program had a balance of approximately $1.7 million at June 30, 2010. These amounts are recorded in the accompanying financial statements as of June 30, 2010.
Investments — PERF (Dollars in Billions)
8
7
6
5
4 3
2
1
Investment Class Amount
1 Short‐Term Investments $9.3 4.6%
2 Domestic Equity 43.0 21.1
3 International Equity 48.9 24.0
4 Domestic Debt 50.9 25.0
5 International Debt 2.5 1.2
6 Inflation Linked 5.0 2.5
7 Real Estate Equity 15.2 7.5
8 Alternative Investments 28.7 14.1
TOTAL $203.5 100.0%
Percent ofI InvestmentsI
CalPERS Comprehensive Annual Financial Report, Fiscal Year Ended June 30, 2010 | Financial Section | 23
CalPERS Comprehensive Annual Financial Report, Fiscal Year Ended June 30, 2010 | Financial Section | 23
$664.9 million which are reported as net (depreciation) appreciation in fair value of investments on the financial statements.
The increase in total securities lending income is primarily due to the recovery in the fair values of reinvested cash collateral.
CalPERS participates in Directed Brokerage‐Commission Recapture arrangements. The CalPERS Directed Brokerage Program had a balance of
$2.1 million at July 1, 2009. For fiscal year 2009‐10, brokerage commissions that were rebated totaled $0.7 million. Expenses in the amount of $1.2 million were incurred to purchase analytical tools, advisory and other research materials.
The Directed Brokerage Program had a balance of approximately $1.7 million at June 30, 2010. These amounts are recorded in the accompanying financial statements as of June 30, 2010.
Investments — PERF (Dollars in Billions)
8
7
6
5
4 3
2
1
Investment Class Amount
1 Short‐Term Investments $9.3 4.6%
2 Domestic Equity 43.0 21.1
3 International Equity 48.9 24.0
4 Domestic Debt 50.9 25.0
5 International Debt 2.5 1.2
6 Inflation Linked 5.0 2.5
7 Real Estate Equity 15.2 7.5
8 Alternative Investments 28.7 14.1
TOTAL $203.5 100.0%
Percent ofI InvestmentsI
24 | Financial Section | CalPERS Comprehensive Annual Financial Report, Fiscal Year Ended June 30, 2010
24 | Financial Section | CalPERS Comprehensive Annual Financial Report, Fiscal Year Ended June 30, 2010
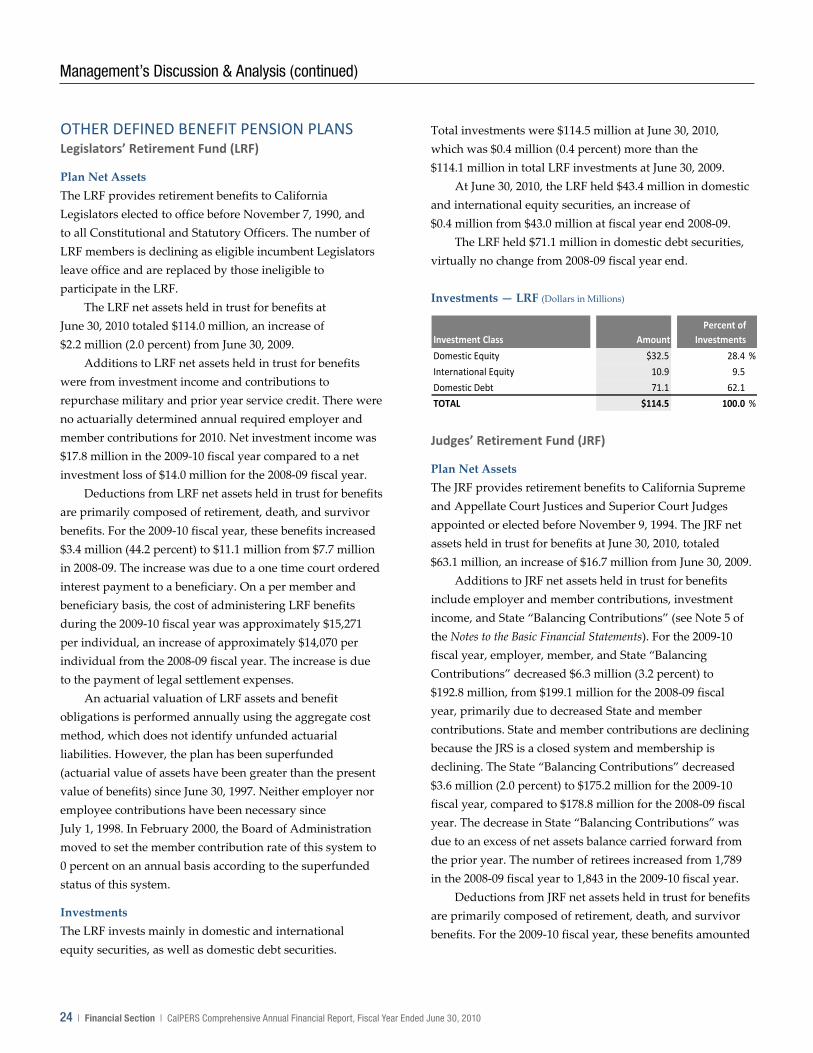
OTHER DEFINED BENEFIT PENSION PLANS Legislators’ Retirement Fund (LRF)
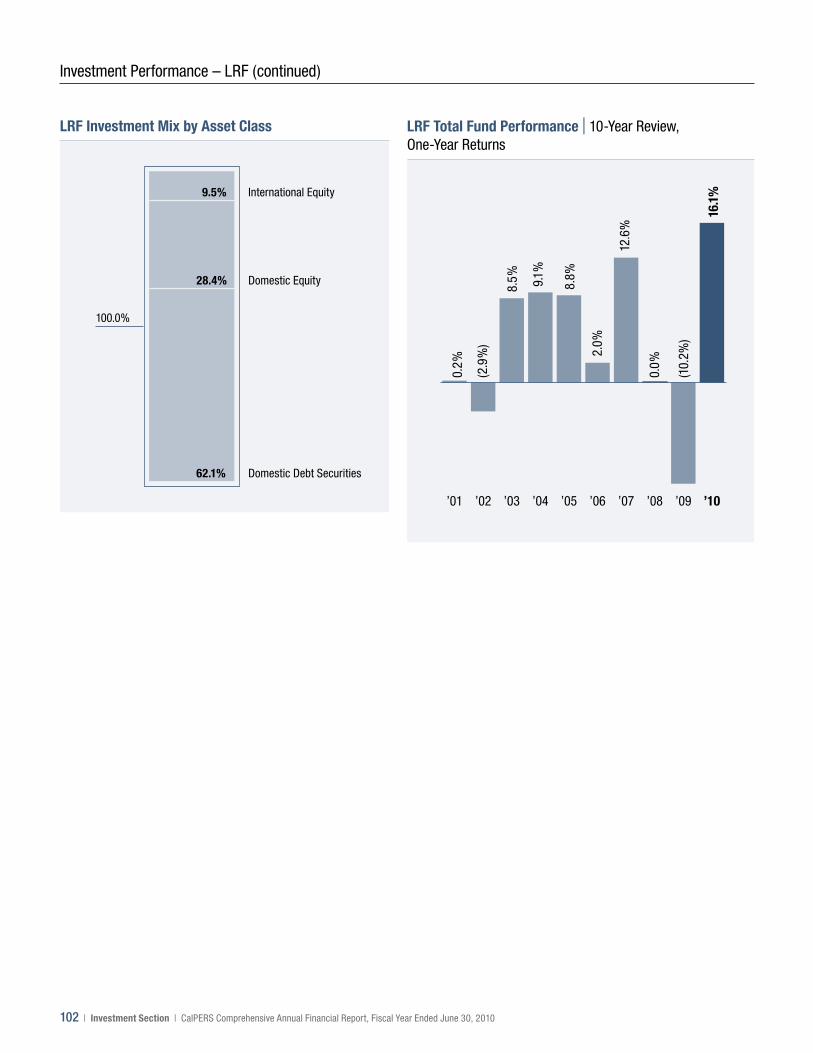
Plan Net Assets The LRF provides retirement benefits to California Legislators elected to office before November 7, 1990, and to all Constitutional and Statutory Officers. The number of LRF members is declining as eligible incumbent Legislators leave office and are replaced by those ineligible to participate in the LRF.
The LRF net assets held in trust for benefits at June 30, 2010 totaled $114.0 million, an increase of $2.2 million (2.0 percent) from June 30, 2009.
Additions to LRF net assets held in trust for benefits were from investment income and contributions to repurchase military and prior year service credit. There were no actuarially determined annual required employer and member contributions for 2010. Net investment income was $17.8 million in the 2009‐10 fiscal year compared to a net investment loss of $14.0 million for the 2008‐09 fiscal year.
Deductions from LRF net assets held in trust for benefits are primarily composed of retirement, death, and survivor benefits. For the 2009‐10 fiscal year, these benefits increased $3.4 million (44.2 percent) to $11.1 million from $7.7 million in 2008‐09. The increase was due to a one time court ordered interest payment to a beneficiary. On a per member and beneficiary basis, the cost of administering LRF benefits during the 2009‐10 fiscal year was approximately $15,271 per individual, an increase of approximately $14,070 per individual from the 2008‐09 fiscal year. The increase is due to the payment of legal settlement expenses.
An actuarial valuation of LRF assets and benefit obligations is performed annually using the aggregate cost method, which does not identify unfunded actuarial liabilities. However, the plan has been superfunded (actuarial value of assets have been greater than the present value of benefits) since June 30, 1997. Neither employer nor employee contributions have been necessary since July 1, 1998. In February 2000, the Board of Administration moved to set the member contribution rate of this system to 0 percent on an annual basis according to the superfunded status of this system.
Investments The LRF invests mainly in domestic and international equity securities, as well as domestic debt securities.
Total investments were $114.5 million at June 30, 2010, which was $0.4 million (0.4 percent) more than the $114.1 million in total LRF investments at June 30, 2009.
At June 30, 2010, the LRF held $43.4 million in domestic and international equity securities, an increase of $0.4 million from $43.0 million at fiscal year end 2008‐09.
The LRF held $71.1 million in domestic debt securities, virtually no change from 2008‐09 fiscal year end.
Investments — LRF (Dollars in Millions)
Investment Class AmountPercent of
Investments
Domestic Equity $32.5 28.4 %
International Equity 10.9 9.5
Domestic Debt 71.1 62.1
TOTAL $114.5 100.0 %
Judges’ Retirement Fund (JRF)
Plan Net Assets The JRF provides retirement benefits to California Supreme and Appellate Court Justices and Superior Court Judges appointed or elected before November 9, 1994. The JRF net assets held in trust for benefits at June 30, 2010, totaled $63.1 million, an increase of $16.7 million from June 30, 2009.
Additions to JRF net assets held in trust for benefits include employer and member contributions, investment income, and State “Balancing Contributions” (see Note 5 of the Notes to the Basic Financial Statements). For the 2009‐10 fiscal year, employer, member, and State “Balancing Contributions” decreased $6.3 million (3.2 percent) to $192.8 million, from $199.1 million for the 2008‐09 fiscal year, primarily due to decreased State and member contributions. State and member contributions are declining because the JRS is a closed system and membership is declining. The State “Balancing Contributions” decreased $3.6 million (2.0 percent) to $175.2 million for the 2009‐10 fiscal year, compared to $178.8 million for the 2008‐09 fiscal year. The decrease in State “Balancing Contributions” was due to an excess of net assets balance carried forward from the prior year. The number of retirees increased from 1,789 in the 2008‐09 fiscal year to 1,843 in the 2009‐10 fiscal year.
Deductions from JRF net assets held in trust for benefits are primarily composed of retirement, death, and survivor benefits. For the 2009‐10 fiscal year, these benefits amounted
Management’s Discussion & Analysis (continued)
CalPERS Comprehensive Annual Financial Report, Fiscal Year Ended June 30, 2010 | Financial Section | 25
to $178.9 million, an increase of $4.0 million (2.3 percent) from the 2008‐09 fiscal year. The increase in benefit payments was mainly a result of a COLA and an increase in the number of retirees and beneficiaries.
On a per member and beneficiary basis, the cost of administering JRF benefits during 2009‐10 was approximately $408 per individual, a decrease of approximately $27 per individual from fiscal year 2008‐09 due to a decrease in the administrative budget.
The JRF is funded on a “pay‐as‐you‐go” basis, where short‐term investments, contributions received during the year, and a State General Fund augmentation are used to provide funding for benefit payments. This funding method is generally more expensive in the long term, as the plan does not have investment returns generated by a funded plan. Without the State General Fund augmentation, the JRF will not be able to pay the accumulated benefit payments due in fiscal year 2010‐11.
Investments The JRF invests only in short‐term securities. Total investments were $61.4 million at June 30, 2010, which was $17.1 million more than the $44.3 million in total investments at June 30, 2009. The increase is due to the General Fund augmentation exceeding expected benefit increases.
Judges’ Retirement Fund II (JRF II)
Plan Net Assets The JRF II provides retirement benefits to California Supreme and Appellate Court Justices, Superior Court Judges, and Municipal Court Judges first appointed or elected after November 9, 1994. Net assets held in trust for benefits at June 30, 2010 were $420.6 million, an increase of $105.1 million (33.3 percent) from June 30, 2009.
Additions to JRF II net assets held in trust for benefits include employer and member contributions, as well as investment income. Contributions increased $3.9 million (7.1 percent), to $58.8 million for the 2009‐10 fiscal year, from $54.9 million for the 2008‐09 fiscal year, primarily as a result of a 7.0 percent increase in active membership from 2009 to 2010. For the 2009‐10 fiscal year, the fund had a net investment income of $50.8 million, compared with a net investment loss of $59.9 million for 2008‐09 fiscal year.
Deductions from JRF II net assets held in trust for benefits are primarily composed of retirement, death,
survivor benefits, and refunds of contributions. For the 2009‐10 fiscal year, non‐refund benefits increased to $1.4 million due to an increase in retirees and beneficiaries. However, contribution refunds decreased $0.5 million from $3.1 million in the 2008‐09 fiscal year to $2.6 million in the 2009‐10 fiscal year (16.1 percent), due to decreasing numbers of judges placing their accumulated contributions with private investment companies.
On a per member and beneficiary basis, the cost of administering JRF II benefits during fiscal year 2009‐10 was approximately $406 per individual, a decrease of approximately $104 per individual from fiscal year 2008‐09, due to increased membership and decreasing direct costs.
An actuarial valuation of the JRF II assets and benefit obligations is performed annually. At June 30, 2009, the date of the most recent actuarial valuation, the funded status decreased to 84.0 percent from 91.3 percent at June 30, 2008. At June 30, 2009, the actuarial accrued liabilities exceeded the actuarial value of assets by approximately $71.9 million, while the amount by which the actuarial accrued liabilities exceeded the actuarial value of assets at June 30, 2008, were approximately $31.6 million. This increase in the unfunded actuarial accrued liability at June 30, 2009 relates primarily to the application of new actuarial assumptions adopted by the Board.
Investments The JRF II invests mainly in short‐term investments, domestic and international equity securities, domestic debt securities, and real estate equities. Total investments amounted to $411.2 million at June 30, 2010, which was $96.4 million (30.6 percent) more than the $314.8 million at June 30, 2009. The increase was due primarily to significant market gains in domestic debt securities and robust global equity market returns.
At June 30, 2010, the JRF II held $213.6 million in domestic and international equity securities, an increase of $54.8 million from $158.8 million at the 2008‐09 fiscal year end.
In domestic debt securities, the JRF II held $157.4 million at June 30, 2010, an increase of $41.2 million from $116.2 million at the 2008‐09 fiscal year end.
In real estate investments, which are comprised of real estate investment trusts, the JRF II held $39.9 million at June 30, 2010, an increase of $10.3 million (34.8 percent) from the $29.6 million at the 2008‐09 fiscal year end as a result of a
CalPERS Comprehensive Annual Financial Report, Fiscal Year Ended June 30, 2010 | Financial Section | 25
CalPERS Comprehensive Annual Financial Report, Fiscal Year Ended June 30, 2010 | Financial Section | 25
to $178.9 million, an increase of $4.0 million (2.3 percent) from the 2008‐09 fiscal year. The increase in benefit payments was mainly a result of a COLA and an increase in the number of retirees and beneficiaries.
On a per member and beneficiary basis, the cost of administering JRF benefits during 2009‐10 was approximately $408 per individual, a decrease of approximately $27 per individual from fiscal year 2008‐09 due to a decrease in the administrative budget.
The JRF is funded on a “pay‐as‐you‐go” basis, where short‐term investments, contributions received during the year, and a State General Fund augmentation are used to provide funding for benefit payments. This funding method is generally more expensive in the long term, as the plan does not have investment returns generated by a funded plan. Without the State General Fund augmentation, the JRF will not be able to pay the accumulated benefit payments due in fiscal year 2010‐11.
Investments The JRF invests only in short‐term securities. Total investments were $61.4 million at June 30, 2010, which was $17.1 million more than the $44.3 million in total investments at June 30, 2009. The increase is due to the General Fund augmentation exceeding expected benefit increases.
Judges’ Retirement Fund II (JRF II)
Plan Net Assets The JRF II provides retirement benefits to California Supreme and Appellate Court Justices, Superior Court Judges, and Municipal Court Judges first appointed or elected after November 9, 1994. Net assets held in trust for benefits at June 30, 2010 were $420.6 million, an increase of $105.1 million (33.3 percent) from June 30, 2009.
Additions to JRF II net assets held in trust for benefits include employer and member contributions, as well as investment income. Contributions increased $3.9 million (7.1 percent), to $58.8 million for the 2009‐10 fiscal year, from $54.9 million for the 2008‐09 fiscal year, primarily as a result of a 7.0 percent increase in active membership from 2009 to 2010. For the 2009‐10 fiscal year, the fund had a net investment income of $50.8 million, compared with a net investment loss of $59.9 million for 2008‐09 fiscal year.
Deductions from JRF II net assets held in trust for benefits are primarily composed of retirement, death,
survivor benefits, and refunds of contributions. For the 2009‐10 fiscal year, non‐refund benefits increased to $1.4 million due to an increase in retirees and beneficiaries. However, contribution refunds decreased $0.5 million from $3.1 million in the 2008‐09 fiscal year to $2.6 million in the 2009‐10 fiscal year (16.1 percent), due to decreasing numbers of judges placing their accumulated contributions with private investment companies.
On a per member and beneficiary basis, the cost of administering JRF II benefits during fiscal year 2009‐10 was approximately $406 per individual, a decrease of approximately $104 per individual from fiscal year 2008‐09, due to increased membership and decreasing direct costs.
An actuarial valuation of the JRF II assets and benefit obligations is performed annually. At June 30, 2009, the date of the most recent actuarial valuation, the funded status decreased to 84.0 percent from 91.3 percent at June 30, 2008. At June 30, 2009, the actuarial accrued liabilities exceeded the actuarial value of assets by approximately $71.9 million, while the amount by which the actuarial accrued liabilities exceeded the actuarial value of assets at June 30, 2008, were approximately $31.6 million. This increase in the unfunded actuarial accrued liability at June 30, 2009 relates primarily to the application of new actuarial assumptions adopted by the Board.
Investments The JRF II invests mainly in short‐term investments, domestic and international equity securities, domestic debt securities, and real estate equities. Total investments amounted to $411.2 million at June 30, 2010, which was $96.4 million (30.6 percent) more than the $314.8 million at June 30, 2009. The increase was due primarily to significant market gains in domestic debt securities and robust global equity market returns.
At June 30, 2010, the JRF II held $213.6 million in domestic and international equity securities, an increase of $54.8 million from $158.8 million at the 2008‐09 fiscal year end.
In domestic debt securities, the JRF II held $157.4 million at June 30, 2010, an increase of $41.2 million from $116.2 million at the 2008‐09 fiscal year end.
In real estate investments, which are comprised of real estate investment trusts, the JRF II held $39.9 million at June 30, 2010, an increase of $10.3 million (34.8 percent) from the $29.6 million at the 2008‐09 fiscal year end as a result of a
26 | Financial Section | CalPERS Comprehensive Annual Financial Report, Fiscal Year Ended June 30, 2010
Total Deductions $15,561 $8,360 $179,861 $175,951 $4,478 $4,892
INCREASE (DECREASE) IN NET ASSETS $2,249 ($22,332) $16,707 $27,140 $105,090 ($9,905)
NET ASSETS
Beginning of Year $111,787 $134,119 $46,386 $19,246 $315,517 $325,422
End of Year $114,036 $111,787 $63,093 $46,386 $420,607 $315,517
LRF JRF JRF II
Management’s Discussion & Analysis (continued)
CalPERS Comprehensive Annual Financial Report, Fiscal Year Ended June 30, 2010 | Financial Section | 27
DEFINED CONTRIBUTION PENSION PLANS State Peace Officers’ & Firefighters’ Defined Contribution Plan Fund (SPOFF)
Plan Net Assets The SPOFF provides supplemental retirement benefits to eligible safety employees. Net assets held in trust for pension benefits increased by $68.8 million (20.4 percent) to $405.6 million at June 30, 2010, from $336.8 million at June 30, 2009.
Contributions were $52.2 million for fiscal year 2009‐10, a decrease of 1.7 percent from fiscal year 2008‐09. The decrease was due to a reduction of participant earned wages. Net investment income was $37.6 million for fiscal year 2009‐10, compared to a loss of $55.4 million for the 2008‐09 fiscal year.
SPOFF participant withdrawals were $22.7 million for the 2009‐10 fiscal year, an increase of $9.8 million (76.0 percent) from 2008‐09 fiscal year, due primarily to the increase in the number of retired participants.
Investments The SPOFF invests mainly in domestic equity and debt securities. Total investments were $402.3 million at June 30, 2010, which was $70.2 million (21.1 percent) more than the $332.1 million at June 30, 2009.
Investments — SPOFF (Dollars in Millions)
Investment Class AmountPercent of
Investments
Short‐Term Investments $47.2 11.7 %
Domestic Equity 192.4 47.8
International Equity 61.3 15.2
Domestic Debt 89.8 22.3
Real Estate Equity 11.6 2.9
TOTAL $402.3 100.0 %
Public Agency Deferred Compensation Plan (IRC 457)
Plan Net Assets The CalPERS Board is the trustee for public agency participant assets in the IRC 457 deferred compensation program. Net assets held in trust for pension benefits at June 30, 2010, were $803.0 million, an increase of $132.4 million (19.7 percent), from $670.6 million at June 30, 2009.
Additions to IRC 457 net assets consist of member contributions of $108.4 million in fiscal year 2009‐10, compared to $247.5 million in 2008‐09. The decrease is attributable to the reduction of wages by local governments within the state. Net investment income amounted to $73.0 million for fiscal year 2009‐10, compared to net investment loss of $251.9 million for fiscal year 2008‐09.
Deductions from the IRC 457 net assets consist primarily of participant withdrawals of $46.4 million, an increase of $11.6 million from the prior fiscal year of $34.8 million.
Investments The IRC 457 investments were $800.5 million at June 30, 2010, which was $133.2 million more than the $667.3 million at June 30, 2009. The increase was primarily due to increased returns on global equities and domestic debt. The IRC 457 asset allocation is participant directed.
In domestic and international equity securities, the IRC 457 held $442.4 million at June 30, 2010, an increase of $91.4 million from $351.0 million at fiscal year end 2008‐09.
In domestic debt securities, the IRC 457 held $317.6 million at June 30, 2010, an increase of $36.6 million from $281.0 million at fiscal year end 2008‐09.
In short‐term investments, the IRC 457 held $34.3 million at June 30, 2010, an increase of $4.4 million from $29.9 million at fiscal year end 2008‐09.
Investments — IRC 457 (Dollars in Millions)
Investment Class AmountPercent of
Investments
Short‐Term Investments $34.3 4.3 %
Domestic Equity 374.0 46.7
International Equity 68.4 8.5
Domestic Debt 317.6 39.7
Real Estate Equity 6.2 0.8
TOTAL $800.5 100.0 %
Supplemental Contributions Program Fund (SCPF)
The SCPF was established effective January 1, 2000, to provide supplemental retirement benefits to members of CalPERS and is entirely member funded. Net assets held in trust for pension benefits increased to $18.0 million at June 30, 2010.
Contribution revenues were $0.5 million for the 2009‐10 fiscal year, unchanged from the 2008‐09 fiscal year.
CalPERS Comprehensive Annual Financial Report, Fiscal Year Ended June 30, 2010 | Financial Section | 27
CalPERS Comprehensive Annual Financial Report, Fiscal Year Ended June 30, 2010 | Financial Section | 27
DEFINED CONTRIBUTION PENSION PLANS State Peace Officers’ & Firefighters’ Defined Contribution Plan Fund (SPOFF)
Plan Net Assets The SPOFF provides supplemental retirement benefits to eligible safety employees. Net assets held in trust for pension benefits increased by $68.8 million (20.4 percent) to $405.6 million at June 30, 2010, from $336.8 million at June 30, 2009.
Contributions were $52.2 million for fiscal year 2009‐10, a decrease of 1.7 percent from fiscal year 2008‐09. The decrease was due to a reduction of participant earned wages. Net investment income was $37.6 million for fiscal year 2009‐10, compared to a loss of $55.4 million for the 2008‐09 fiscal year.
SPOFF participant withdrawals were $22.7 million for the 2009‐10 fiscal year, an increase of $9.8 million (76.0 percent) from 2008‐09 fiscal year, due primarily to the increase in the number of retired participants.
Investments The SPOFF invests mainly in domestic equity and debt securities. Total investments were $402.3 million at June 30, 2010, which was $70.2 million (21.1 percent) more than the $332.1 million at June 30, 2009.
Investments — SPOFF (Dollars in Millions)
Investment Class AmountPercent of
Investments
Short‐Term Investments $47.2 11.7 %
Domestic Equity 192.4 47.8
International Equity 61.3 15.2
Domestic Debt 89.8 22.3
Real Estate Equity 11.6 2.9
TOTAL $402.3 100.0 %
Public Agency Deferred Compensation Plan (IRC 457)
Plan Net Assets The CalPERS Board is the trustee for public agency participant assets in the IRC 457 deferred compensation program. Net assets held in trust for pension benefits at June 30, 2010, were $803.0 million, an increase of $132.4 million (19.7 percent), from $670.6 million at June 30, 2009.
Additions to IRC 457 net assets consist of member contributions of $108.4 million in fiscal year 2009‐10, compared to $247.5 million in 2008‐09. The decrease is attributable to the reduction of wages by local governments within the state. Net investment income amounted to $73.0 million for fiscal year 2009‐10, compared to net investment loss of $251.9 million for fiscal year 2008‐09.
Deductions from the IRC 457 net assets consist primarily of participant withdrawals of $46.4 million, an increase of $11.6 million from the prior fiscal year of $34.8 million.
Investments The IRC 457 investments were $800.5 million at June 30, 2010, which was $133.2 million more than the $667.3 million at June 30, 2009. The increase was primarily due to increased returns on global equities and domestic debt. The IRC 457 asset allocation is participant directed.
In domestic and international equity securities, the IRC 457 held $442.4 million at June 30, 2010, an increase of $91.4 million from $351.0 million at fiscal year end 2008‐09.
In domestic debt securities, the IRC 457 held $317.6 million at June 30, 2010, an increase of $36.6 million from $281.0 million at fiscal year end 2008‐09.
In short‐term investments, the IRC 457 held $34.3 million at June 30, 2010, an increase of $4.4 million from $29.9 million at fiscal year end 2008‐09.
Investments — IRC 457 (Dollars in Millions)
Investment Class AmountPercent of
Investments
Short‐Term Investments $34.3 4.3 %
Domestic Equity 374.0 46.7
International Equity 68.4 8.5
Domestic Debt 317.6 39.7
Real Estate Equity 6.2 0.8
TOTAL $800.5 100.0 %
Supplemental Contributions Program Fund (SCPF)
The SCPF was established effective January 1, 2000, to provide supplemental retirement benefits to members of CalPERS and is entirely member funded. Net assets held in trust for pension benefits increased to $18.0 million at June 30, 2010.
Contribution revenues were $0.5 million for the 2009‐10 fiscal year, unchanged from the 2008‐09 fiscal year.
28 | Financial Section | CalPERS Comprehensive Annual Financial Report, Fiscal Year Ended June 30, 2010
28 | Financial Section | CalPERS Comprehensive Annual Financial Report, Fiscal Year Ended June 30, 2010
Net investment income was $1.9 million for fiscal year 2009‐10, compared to investment losses of $4.1 million for fiscal year 2008‐09.
For fiscal year 2009‐10, participant withdrawals were $1.6 million, an increase of $0.9 million (128.6 percent) from fiscal year 2008‐09.
Investments The SCPF investments were $17.9 million at June 30, 2010, which was $0.7 million more than the $17.2 million in total investments at June 30, 2009.
At June 30, 2010, the SCPF held $10.6 million in domestic and international equity securities, an increase of $0.8 million from $9.8 million at fiscal year end 2008‐09.
In domestic debt securities, the SCPF held $5.2 million at June 30, 2010, an increase of $0.1 million from $5.1 million at fiscal year end 2008‐09.
In short‐term investments, the SCPF held $1.7 million at June 30, 2010, a decrease of $0.2 million from $1.9 million at fiscal year end 2008‐09.
Investments — SCPF (Dollars in Millions)
Investment Class AmountPercent of
Investments
Short‐Term Investments $1.7 9.5 %
Domestic Equity 8.1 45.3
International Equity 2.5 14.0
Domestic Debt 5.2 29.0
Real Estate Equity 0.4 2.2
TOTAL $17.9 100.0 %
Net Assets — Defined Contribution Pension Plan Funds (Dollars in Thousands)
Total Deductions $24,501 $15,637 $49,909 $37,146 $1,741 $732
INCREASE (DECREASE) IN NET ASSETS $68,792 ($17,946) $132,420 ($41,352) $712 ($4,303)
NET ASSETS
Beginning of Year $336,761 $354,707 $670,599 $711,951 $17,248 $21,551
End of Year $405,553 $336,761 $803,019 $670,599 $17,960 $17,248
SPOFF IRC 457 SCPF
OTHER POST‐EMPLOYMENT BENEFIT FUND California Employers’ Retiree Benefit Trust Fund (CERBTF)
Plan Net Assets The CERBTF is a trust for the pre‐funding by employers of health, dental, and other non‐pension benefits promised to employees when they retire. Net assets held in trust for benefits on June 30, 2010 were $1,287.2 million, an increase of $438.3 million due primarily to an increase of participating public agencies from 196 in the 2008‐09 fiscal year, to 258 at June 30, 2010.
Additions to the CERBTF net assets held in trust for OPEB benefits include employer contributions, which total $674.4 million. During the 2009‐10 fiscal year the fund earned a net investment income of $128.9 million primarily due to equity market increases.
Deductions for OPEB reimbursements from the CERBTF net assets held in trust for benefits totaled $354.6 million in 2009‐10 fiscal year, an increase of $108.6 million (44.1 percent) due to greater participation in the trust. Deductions for administrative expenses totaled $0.8 million. The amounts reported for contributions and reimbursements include $329.8 million for benefit payments
made directly by employers to providers outside of the trust, which are required to be reported in the CERBTF.
At June 30, 2009, the date of the most recent actuarial valuation, the funded status increased to 8.3 percent from 1.0 percent at June 30, 2008. At June 30, 2009, the actuarial accrued liabilities exceeded the actuarial value of assets by approximately $9.6 billion.
Net Assets — Other Post‐Employment Benefit Fund (Dollars in Thousands)
30 | Financial Section | CalPERS Comprehensive Annual Financial Report, Fiscal Year Ended June 30, 2010
Changes in Net Assets — Other Post‐Employment Benefit Fund (Dollars in Thousands)
2010 2009
ADDITIONS
Employer Contributions $674,406 $595,632
Investment Income (Losses) 128,918 (143,800)
Other Income — —
Total Additions $803,324 $451,832
DEDUCTIONS
Administrative Expenses $822 $543
Reimbursements 354,593 246,047
Transfer Out 9,589 —
Total Deductions $365,004 $246,590
INCREASE IN NET ASSETS $438,320 $205,242
NET ASSETS
Beginning of Year $848,881 $643,639
End of Year $1,287,201 $848,881
CERBTF
Investments At June 30, 2010, the CERBTF held $70.7 million in short‐term investments, a decrease of $21.2 million (23.1 percent) from the $91.9 million at June 30, 2009, $760.4 million in domestic and international equity securities, an increase of $286.5 million (60.5 percent) from the $473.9 million held at June 30, 2009, $338.9 million in domestic debt securities, an increase of $129.5 million (61.8 percent) from the $209.4 million at June 30, 2009, and $119.7 million in real estate equities, an increase of $47.4 million (65.5 percent) from the $72.3 million held at June 30, 2009.
Investments — CERBTF (Dollars in Millions)
Investment Class AmountPercent of
Investments
Short‐Term Investments $70.7 5.5 %
Domestic Equity 414.3 32.1
International Equity 346.1 26.8
Domestic Debt 338.9 26.3
Real Estate Equity 119.7 9.3
TOTAL $1,289.7 100.0 %
ENTERPRISE FUNDS Employees’ Health Care Fund (HCF)
Plan Activity The HCF accounts for the activities of the CalPERS self‐insured health care programs.
The self‐insured health care programs incurred claims expenses of $1.6 billion for the 2009‐10 fiscal year, an increase of 14.3 percent from the 2008‐09 fiscal year, primarily due to increases in provider pricing, increased benefit utilization and enrollment growth. Premium revenues were $1.4 billion for the 2009‐10 fiscal year, a decrease of 12.5 percent from the 2008‐09 fiscal year, primarily as a result of a temporary premium suspension by granting a two‐month premium holiday. Net investment income was $47.5 million for the 2009‐10 fiscal year, an increase of 117.9 percent from the 2008‐09 fiscal year due to an increase in unrealized gains from government bonds. Because of reduced premiums resulting from the premium holiday granted by the Board and increased claims expense, unrestricted net assets decreased by $252.8 million (38.3 percent) to $407.4 million at June 30, 2010.
Investments Investments of the HCF include highly liquid, short‐term and domestic debt securities. Investments decreased $302.7 million from $833.4 million at June 30, 2009, to $530.7 million at June 30, 2010.
Investments — HCF (Dollars in Millions)
Investment Class AmountPercent of
Investments
Short‐Term Investments $98.0 18.5 %
Domestic Debt 432.7 81.5
TOTAL $530.7 100.0 %
Public Employees’ Contingency Reserve Fund (CRF)
The CRF was established to fund administrative costs related to the CalPERS health care programs and to provide a contingency reserve for potential increases in future health care premium rates or health care benefit costs. Administrative fees collected and related costs are accounted for in the CRF Proprietary Fund type.
Administrative fees earned by the CRF were $22.4 million for the 2009‐10 fiscal year, a decrease of 11.8 percent from 2008‐09 fiscal year of $25.4 million. The decrease was due to a
Management’s Discussion & Analysis (continued)
CalPERS Comprehensive Annual Financial Report, Fiscal Year Ended June 30, 2010 | Financial Section | 31
reduction in administrative fees rates, which decreased from 0.45 percent in 2008‐09 fiscal year to 0.43 percent in 2009‐10 fiscal year. In addition, during fiscal year 2009‐10 the Board approved the PPO holiday and as a result the CRF did not receive administrative fees for two months. Net investment income was $1.1 million for the 2009‐10 fiscal year, a decrease of 70.3 percent from the 2008‐09 fiscal year. Unrestricted net assets decreased by $3.5 million (22.9 percent) to $11.8 million at June 30, 2010.
Public agency health payments and remittances to contracted health care providers are reported in the CRF Agency Fund type. Public agencies remitted approximately $1.8 billion for payments to contracted health care providers in fiscal year 2009‐10.
Investments Investments of the CRF proprietary activity at June 30, 2010 and 2009 included only highly liquid, short‐term securities, as investment balances are used to fund operating cash flows. Investments of the proprietary activities increased $11.3 million from $47.2 million at June 30, 2009, to $58.5 million at June 30, 2010, primarily due to an increase in the number of enrollees in the Medicare Part D Program which resulted in higher subsidies from the Federal Government.
Public Employees’ Long‐Term Care Fund (LTCF) The LTCF, which provides long‐term care insurance to participating members, incurred claims expenses of $133.0 million for the 2009‐10 fiscal year, an increase of 14.5 percent from the 2008‐09 fiscal year, due mainly to an increase in benefit utilization. Premium revenues were $285.9 million for the 2009‐10 fiscal year, a decrease of 3.6 percent from the 2008‐09 fiscal year due to decreased participation. Net investment income amounted to $351.7 million for the 2009‐10 fiscal year, an increase from the losses of $369.0 million for the 2008‐09 fiscal year. The unrestricted net deficits of the Long‐Term Care Program decreased by $693.2 million to $118.4 million during the 2009‐10 fiscal year. The reduction of the fund deficit from the prior year is attributable to the positive investment performance from a robust global equity market and Board approved premium rate increases effective July 1, 2010 which was reflected in the June 30, 2010 valuation. These changes were offset in part by the impact of the decrease in the
investment rate of return assumption from 7.79 percent to 6.38 percent.
Investments Total LTCF investments were $2.6 billion at June 30, 2010, which was $0.5 billion more than the $2.1 billion in total investments at June 30, 2009.
At June 30, 2010, the LTCF held $1.2 billion in domestic and international equity securities, an increase of $0.2 billion from $1.0 billion from fiscal year end 2008‐09.
In domestic debt securities, the fund held $1.3 billion at June 30, 2010, an increase of $0.3 billion from $1.0 billion at 2008‐09 fiscal year end.
In real estate investments, the LTCF held $125.9 million at June 30, 2010, an increase of $21.8 million from $104.1 million at 2008‐09 fiscal year end.
Investments — LTCF (Dollars in Millions)
Investment Class AmountPercent of
Investments
Domestic Equity $722.0 27.7 %
International Equity 477.1 18.3
Domestic Debt 1,284.5 49.2
Real Estate Equity 125.9 4.8
TOTAL $2,609.5 100.0 %
CalPERS Comprehensive Annual Financial Report, Fiscal Year Ended June 30, 2010 | Financial Section | 31
CalPERS Comprehensive Annual Financial Report, Fiscal Year Ended June 30, 2010 | Financial Section | 31
reduction in administrative fees rates, which decreased from 0.45 percent in 2008‐09 fiscal year to 0.43 percent in 2009‐10 fiscal year. In addition, during fiscal year 2009‐10 the Board approved the PPO holiday and as a result the CRF did not receive administrative fees for two months. Net investment income was $1.1 million for the 2009‐10 fiscal year, a decrease of 70.3 percent from the 2008‐09 fiscal year. Unrestricted net assets decreased by $3.5 million (22.9 percent) to $11.8 million at June 30, 2010.
Public agency health payments and remittances to contracted health care providers are reported in the CRF Agency Fund type. Public agencies remitted approximately $1.8 billion for payments to contracted health care providers in fiscal year 2009‐10.
Investments Investments of the CRF proprietary activity at June 30, 2010 and 2009 included only highly liquid, short‐term securities, as investment balances are used to fund operating cash flows. Investments of the proprietary activities increased $11.3 million from $47.2 million at June 30, 2009, to $58.5 million at June 30, 2010, primarily due to an increase in the number of enrollees in the Medicare Part D Program which resulted in higher subsidies from the Federal Government.
Public Employees’ Long‐Term Care Fund (LTCF) The LTCF, which provides long‐term care insurance to participating members, incurred claims expenses of $133.0 million for the 2009‐10 fiscal year, an increase of 14.5 percent from the 2008‐09 fiscal year, due mainly to an increase in benefit utilization. Premium revenues were $285.9 million for the 2009‐10 fiscal year, a decrease of 3.6 percent from the 2008‐09 fiscal year due to decreased participation. Net investment income amounted to $351.7 million for the 2009‐10 fiscal year, an increase from the losses of $369.0 million for the 2008‐09 fiscal year. The unrestricted net deficits of the Long‐Term Care Program decreased by $693.2 million to $118.4 million during the 2009‐10 fiscal year. The reduction of the fund deficit from the prior year is attributable to the positive investment performance from a robust global equity market and Board approved premium rate increases effective July 1, 2010 which was reflected in the June 30, 2010 valuation. These changes were offset in part by the impact of the decrease in the
investment rate of return assumption from 7.79 percent to 6.38 percent.
Investments Total LTCF investments were $2.6 billion at June 30, 2010, which was $0.5 billion more than the $2.1 billion in total investments at June 30, 2009.
At June 30, 2010, the LTCF held $1.2 billion in domestic and international equity securities, an increase of $0.2 billion from $1.0 billion from fiscal year end 2008‐09.
In domestic debt securities, the fund held $1.3 billion at June 30, 2010, an increase of $0.3 billion from $1.0 billion at 2008‐09 fiscal year end.
In real estate investments, the LTCF held $125.9 million at June 30, 2010, an increase of $21.8 million from $104.1 million at 2008‐09 fiscal year end.
Investments — LTCF (Dollars in Millions)
Investment Class AmountPercent of
Investments
Domestic Equity $722.0 27.7 %
International Equity 477.1 18.3
Domestic Debt 1,284.5 49.2
Real Estate Equity 125.9 4.8
TOTAL $2,609.5 100.0 %
32 | Financial Section | CalPERS Comprehensive Annual Financial Report, Fiscal Year Ended June 30, 2010
Total Expenses $1,662,376 $1,547,112 $27,065 $27,288 ($55,495) $604,412 $0 $187
INCREASE (DECREASE) IN UNRESTRICTED NET ASSETS BEFORE TRANSFERS ($252,755) $61,626 ($3,466) $2,051 $693,188 ($676,904) $0 ($110)
Transfer Out $0 $0 $0 $0 $0 $0 ($4,149) $0
NET ASSETS (DEFICIT)
Beginning of year $660,172 $598,546 $15,271 $13,220 ($811,639) ($134,735) $4,149 $4,259
End of year $407,417 $660,172 $11,805 $15,271 ($118,451) ($811,639) $0 $4,149
HCF CRF LTCF DCF
REQUESTS FOR INFORMATION This Financial Report is designed to provide a general overview of CalPERS finances. Questions concerning any of the information provided in this report or requests for additional financial information should be addressed to the CalPERS Fiscal Services Division, P.O. Box 942703, Sacramento, CA, 94229‐2703, or by calling 888 CalPERS (or 888‐225‐7377).
OPEB Plan Transfers To External Trusts — — — — — —
TOTAL DEDUCTIONS $13,432,880 $15,561 $179,861 $4,478 $24,501 $49,909
INCREASE (DECREASE) IN NET ASSETS $22,478,565 $2,249 $16,707 $105,090 $68,792 $132,420
Net Assets Held in Trust for Pension and Other Post‐Employment Benefits Beginning of Year as Previously Reported $178,899,883 $111,787 $46,386 $315,517 $336,761 $670,599
Prior Period Adjustment $237,626 $0 $0 $0 $0 $0
Net Assets as Restated $179,137,509 $111,787 $46,386 $315,517 $336,761 $670,599
End of Year $201,616,074 $114,036 $63,093 $420,607 $405,553 $803,019
CalPERS Comprehensive Annual Financial Report, Fiscal Year Ended June 30, 2010 | Financial Section | 37
Statement of Changes in Fiduciary Net Assets – Fiduciary Funds (continued)Statement of Changes in Fiduciary Net Assets – Fiduciary Funds (continued)
CalPERS Comprehensive Annual Financial Report, Fiscal Year Ended June 30, 2010 | Financial Section | 37
Post‐EmploymentHealth CareTrust Fund Totals
SCPF CERBTF 2010 2009
$536 $0 $3,511,395 $4,154,388
— — 7,060,088 7,016,798
— — 175,242 178,803
— 344,581 344,581 367,232
— 329,825 329,825 228,400
$536 $674,406 $11,421,131 $11,945,621
$1,911 $127,800 $23,859,885 ($58,071,880)
1 41 469,352 642,688
— 1,077 1,132,208 1,479,766
— — 2,303,941 658,269
— — 214,634 102,379
6 — 96,409 91,689
— — 199,004 752,348
— — (57,506) (383,283)
— — (1,944,823) (2,414,067)
(34) — (395,487) (753,688)
$1,884 $128,918 $25,877,617 ($57,895,779)
$32 $0 $4,149 $0
$1 $0 $13,893 $6,842
$2,453 $803,324 $37,316,790 ($45,943,316)
$0 $0 $13,163,792 $12,015,696
— — 185,046 190,141
117 822 290,130 435,506
1,624 — 70,785 48,346
— 24,768 24,768 17,647
— 329,825 329,825 228,400
— 9,589 9,589 —
$1,741 $365,004 $14,073,935 $12,935,736
$712 $438,320 $23,242,855 ($58,879,052)
$17,248 $848,881 $181,247,062 $240,126,114
$0 $0 $237,626 $0
$17,248 $848,881 $181,484,688 $240,126,114
$17,960 $1,287,201 $204,727,543 $181,247,062
The accompanying notes are an integral part of these financial statements.
38 | Financial Section | CalPERS Comprehensive Annual Financial Report, Fiscal Year Ended June 30, 2010
StatementofNetAssets–ProprietaryFundsStatement of Net Assets – Proprietary Funds
38 | Financial Section | CalPERS Comprehensive Annual Financial Report, Fiscal Year Ended June 30, 2010
As of June 30, 2010, with Comparative Totals as of June 30, 2009 (Dollars in Thousands)
HCF CRF LTCF 2010 2009
ASSETS
Current Assets
Cash & Cash Equivalents $214 $0 $96 $310 $2,228
Receivables
Member, Public Agency, State & School $62,070 $1,331 $358 $63,759 $19,006
Interest & Dividends 239 342 — 581 4,301
Due from Other Funds 60,074 3,938 — 64,012 56,808
Due from Federal Government — 12,387 — 12,387 16,105
Other — 426 — 426 450
Total Receivables $122,383 $18,424 $358 $141,165 $96,670
Investments, at Fair Value
Short‐Term Investments:
Domestic $97,968 $58,513 $0 $156,481 $502,229
Equity Securities:
Domestic — — 722,032 722,032 599,232
International — — 477,098 477,098 390,749
Debt Securities:
Domestic 432,751 — 1,284,528 1,717,279 1,432,418
Real Estate Equities — — 125,920 125,920 104,088
Total Investments $530,719 $58,513 $2,609,578 $3,198,810 $3,028,716
TOTAL ASSETS $653,316 $76,937 $2,610,032 $3,340,285 $3,127,614
LIABILITIES
Current Liabilities
Insurance Premiums & Claims in Process of Payment $36,867 $72 $10,634 $47,573 $28,872
Estimated Insurance Claims Due 192,195 — 151,696 343,891 359,797
Management Fees — — — — 2,608
Due to Other Funds 2,025 2,171 856 5,052 3,022
Due to State & Public Agencies 323 — — 323 —
Other 11,992 58,229 14,041 84,262 74,640
Total Current Liabilities $243,402 $60,472 $177,227 $481,101 $468,939
Due to State and Public Agencies 323 — — — 323 (76,946)
Other 3,457 8,094 1,061 — 12,612 1,797
($351,484) $7,439 $116,874 $0 ($227,171) $226,485
$45,578 $0 $355,537 $0 $401,115 ($349,931)
$0 $0 $0 ($4,149) ($4,149) $0
Noncash Change in Fair Value of Investments in Securities
Totals
Estimated Insurance Claims Due
Noncash Investing, Capital & Financing Activities
Insurance Premiums & Claims in Process of Payment
Net Cash Provided by (Used for) Operating Activities
Enterprise Funds
Transfers to the SPOFF, IRC 457 and SCPF
The accompanying notes are an integral part of these financial statements.
CalPERS Comprehensive Annual Financial Report, Fiscal Year Ended June 30, 2010 | Financial Section | 41
NotestotheBasicFinancialStatementsNotes to the Basic Financial Statements
CalPERS Comprehensive Annual Financial Report, Fiscal Year Ended June 30, 2010 | Financial Section | 41
1. GENERAL DESCRIPTION OF THE PLAN The State Employees’ Retirement System, the predecessor to the Public Employees’ Retirement System of the State of California (CalPERS), or the “System,” was created after voters approved a constitutional amendment authorizing legislation to establish a pension system for State employees. Such legislation became effective January 1, 1932. CalPERS has expanded to include, among others, employees of local agencies that elect to participate in the System. At June 30, 2010, the Board of Administration (Board) of CalPERS administers a total of 15 funds, including four defined benefit retirement plans: the Public Employees’ Retirement Fund (PERF), the Legislators’ Retirement Fund (LRF), the Judges’ Retirement Fund (JRF), and the Judges’ Retirement Fund II (JRF II); three defined contribution retirement plans: the State Peace Officers’ and Firefighters’ Defined Contribution Plan Fund (SPOFF), the Public Agency Deferred Compensation Program (IRC 457), and the Supplemental Contributions Program Fund (SCPF); one defined benefit post‐employment health care plan, the California Employers’ Retirement Benefit Trust Fund (CERBTF); one health care plan: the Public Employees’ Health Care Fund (HCF); and six other plans: the Public Employees’ Long‐Term Care Fund (LTCF), the Public Employees’ Deferred Compensation Fund (DCF), the Old Age & Survivors’ Insurance Revolving Fund (OASI), the Public Employees’ Contingency Reserve Proprietary Fund (CRF), the Public Employees’ Contingency Reserve Agency Fund (CRF), and the Replacement Benefit Fund (RBF).
Reporting Entity The basic financial statements of CalPERS include fund financial statements reporting the financial activities of all of the above funds and assets under trust. The CalPERS Board of Administration has plenary authority and fiduciary responsibility for the investment of monies and the administration of the System pursuant to the State Constitution, Article XVI, Section 17. CalPERS is a unit of the State of California State and Consumer Services Agency; however, CalPERS is not subject to administrative direction by any department, commission, board, bureau, or agency of the State. As such, CalPERS is classified as a component unit of the State of California for financial reporting purposes, in
accordance with the provisions of Governmental Accounting Standards Board Statement No. 39.
CalPERS financial statements are included in fiduciary and proprietary funds in the State of California Comprehensive Annual Financial Report.
Defined Benefit Plans The PERF was established in 1932, the LRF in 1947, the JRF in 1937, and JRF II in 1994. The PERF, LRF, JRF, and JRF II are defined benefit pension plans which provide benefits based on members’ years of service, age, final compensation, and benefit formula. In addition, benefits are provided for disability, death, and survivors of eligible members or beneficiaries.
At June 30, 2010, the State of California and 1,543 public agencies and schools (representing more than 2,600 entities) contribute to the PERF, JRF, and JRF II, which are agent multiple employer and cost‐sharing defined benefit pension plans. CalPERS acts as the common investment and administrative agent for the member agencies, including schools (for classified employees). The LRF is a single‐employer defined benefit pension plan for the State of California.
Members of the PERF, LRF, JRF, and JRF II become fully vested in their retirement benefits earned to date after five years (10 years for State Second Tier members) of credited service.
As of June 30, 2010, the number of affiliated employers for the PERF, LRF, JRF, and JRF II are as follows:
Affiliated Employers for the PERF, LRF, JRF, and JRF II
2010
PERF
State 1
School 61
Public Agency 1,482
Total PERF 1,544
LRF 1
JRF 59
JRF II 59
42 | Financial Section | CalPERS Comprehensive Annual Financial Report, Fiscal Year Ended June 30, 2010
Notes to the Basic Financial Statements (continued)Notes to the Basic Financial Statements (continued)
42 | CalPERS Comprehensive Annual Financial Report, Fiscal Year Ended June 30, 2010 | Financial Section
As of June 30, 2010, benefit recipients and members in the PERF, LRF, JRF, and JRF II consisted of the following:
Benefit Recipients and Members in the PERF, LRF, JRF, and JRF II
Survivors &
Fund Retirees Beneficiaries Active Inactive TOTAL
PERF
State 157,493 25,512 253,226 87,346 523,577
School 146,549 20,001 299,927 127,284 593,761
Public Agency 138,454 17,853 251,141 97,120 504,568
Total PERF 442,496 63,366 804,294 311,750 1,621,906
The membership consists of the following categories:
PERF Safety — includes California Highway Patrol, peace officers, firefighters, and other employees whose principal duties are in active law enforcement or fire prevention and suppression work, or who occupy positions designated by law as safety member positions.
Schools — includes non‐teaching, non‐certificated school employees.
State Industrial — includes all employees of the Department of Corrections and the California Youth Authority who are not safety members.
General — includes all other members, defined by statute as “miscellaneous” members.
LRF State Legislators Constitutional Officers Legislative Statutory Officers
JRF Judges — includes Supreme Court, Courts of Appeal, and Superior Courts appointed or elected before November 9, 1994.
JRF II Judges — includes Supreme Court, Courts of Appeal and Superior Courts appointed or elected on or after November 9, 1994.
Financing The benefits for the PERF, LRF, JRF, and JRF II are funded by contributions from members and employers, and earnings from investments. Member and employer contributions are a percentage of applicable member compensation. Member contribution rates are defined by law and depend on the respective employer’s benefit formulas. Employer contribution rates are determined by periodic actuarial valuations or by State statute. Actuarial valuations are based on the benefit formulas and employee groups of each employer. Employer contributions, including lump sum contributions made when agencies first join the Public Employees’ Retirement Fund, are credited with a market value adjustment in determining contribution rates.
The required contribution rates of active plan members are based on a percentage of salary in excess of a base compensation amount ranging from $133 to $863 monthly. For the fiscal year ended June 30, 2010, the required contribution rates for active plan members are as follows:
CalPERS Comprehensive Annual Financial Report, Fiscal Year Ended June 30, 2010 | Financial Section | 43
Notes to the Basic Financial Statements (continued)Notes to the Basic Financial Statements (continued)
CalPERS Comprehensive Annual Financial Report, Fiscal Year Ended June 30, 2010 | Financial Section | 43
Required Contribution Rates for Active Plan Members
Required
Contribution RatesPERFState Employees: Miscellaneous & Industrial 5% or 6% Miscellaneous & Industrial — Second Tier 0% Safety 6% Peace Officers & Firefighters 8% California Highway Patrol 8%Classified School Employees 7%Public Agency Employees 5% to 9%LRF 0%JRF 8%JRF II 8%
These contributions are deposited in a fund established for each entity for the purpose of creating actuarial reserves for future benefits.
All employees in a covered class of employment who work on a half‐time basis or more are eligible to participate in the retirement plans. CalPERS administers several different retirement plans, each providing a monthly allowance based on age, years of credited service, the benefit formula, and highest average compensation over an established period of one year to three years. All plans provide death and disability benefits. In addition, post‐retirement cost of living increases are also provided. Within the PERF, the benefit provisions for the State and school employees are established by statute. The benefits for the public agencies are established by contract with the System, in accordance with the provisions of the Public Employees’ Retirement Law.
The benefits for the LRF are established in accordance with the provisions of the Legislators’ Retirement Law. The benefits for the JRF are established in accordance with the provisions of the Judges’ Retirement Law. The benefits for the JRF II are established in accordance with the provisions of the Judges’ Retirement System II Law.
In November 1990, Article IV, Section 4.5 was added to the State Constitution by adopting Proposition 140. This section effectively prohibited future Legislators from earning State retirement benefits for service in the Legislature on or after November 7, 1990, though it recognized vested pension benefits that had accrued before that date.
Due to the effects of Proposition 140, there are no current legislators eligible to participate in the Legislators’
Retirement Fund. The only active members in the fund are Constitutional Officers (including the Insurance Commissioner and members of the Board of Equalization) and Legislative Statutory Officers.
Costs of administering the funds are financed through contributions and investment earnings of the funds.
Termination Upon permanent separation from the retirement plans, accumulated member contributions are refundable, with interest credited through the date of refund, as required by applicable laws. Withdrawal of such accumulated contributions results in forfeiture of the related vested benefits.
In the event that public agencies elect to terminate their contracts with the retirement plans, accumulated member and employer contributions, interest, and the related liability for benefits may be transferred to the employers. If amounts are not transferred to the employers, sufficient assets required to cover the related liability for benefits are retained in the retirement plans. Excess assets above those required, if any, are returned to the employer, while the employer is billed for any deficiency in assets.
CERBTF The California Employers’ Retiree Benefit Trust Fund (CERBTF) was established by Chapter 331 of the 1988 Statutes and initially funded in 2007. At June 30, 2010, 258 employers had elected to participate in the fund. The purpose of the fund is to receive contributions from participating employers and establish separate employer prefunding accounts to pay for health care or other post‐employment benefits in accordance with the terms of participating employer’s plans. Contributions are voluntarily determined by the employer’s own funding schedule, and there are no long‐term contracts for contributions to the plan. The CERBTF is an agent multiple‐employer plan as defined in Governmental Accounting Standards Board (GASB) Statement No. 43 with pooled administrative and investment functions.
Participating employers may receive disbursements from the fund not to exceed the annual premium and other costs of eligible post‐employment benefits. If the employer’s participation in the fund terminates, all assets in the employer’s prefunding account shall remain in the fund except as otherwise provided. Allowable termination
44 | Financial Section | CalPERS Comprehensive Annual Financial Report, Fiscal Year Ended June 30, 2010
Notes to the Basic Financial Statements (continued)Notes to the Basic Financial Statements (continued)
44 | Financial Section | CalPERS Comprehensive Annual Financial Report, Fiscal Year Ended June 30, 2010
disbursements are to a trustee or as a trustee transfer of assets upon satisfactorily demonstrating to the Board the transfer will satisfy applicable requirements of the Internal Revenue Code and the Board’s fiduciary duties, or the employer substantiates to the Board that all of the employer’s obligations for the payment of post‐employment benefits have been satisfied. At June 30, 2010, there were 107,392 active or inactive members and 41,458 retirees for the miscellaneous plan and 23,576 active or inactive members and 14,787 retirees for the safety plan.
Costs to administer the plan are determined through the CalPERS Board‐approved cost‐allocation plan, where actual direct and indirect costs of administering the System are equitably assessed to each fund.
Defined Contribution Plans
SPOFF The State Peace Officers’ and Firefighters’ Supplemental Plan (SPOFF) is a defined contribution retirement plan established by Chapter 820 of the 1998 Statutes. The Plan is a qualified money purchase pension plan under Section 401(a) of Title 26 of the Internal Revenue Code and is intended to supplement the retirement benefits provided by the PERF to eligible peace officers and firefighters employed by the State of California. Plan provisions are established and may be amended by statute.
SPOFF is administered by CalPERS and a third‐party administrator, ING, who provides record keeping and plan administration services. Contributions to the Plan are funded entirely by the employer, with a contribution rate of 2 percent of the employee’s base pay, not to exceed contribution limits established by the Internal Revenue Code. Contribution requirements are established and may be amended through a Memorandum of Understanding from the State of California Department of Personnel Administration.
The benefits paid to participants will depend on the amount contributed and the earnings/losses attributed to participants’ account. Contributions are invested in the CalPERS Moderate Asset Allocation Fund which includes short‐term, equity and fixed income securities, and real estate. Distributions are allowed only at retirement or permanent separation from all State employment. At June 30, 2010, there were 40,020 active and inactive participants.
IRC 457 The CalPERS Supplemental Income 457 Plan (457 Deferred Compensation Plan) is available to public agencies and school districts within the State of California and is governed by Code Section 21670 through 21685 authorizing the Board of Administration to establish a deferred compensation plan qualified under Section 457 of Title 26 of the United States Code for California Public Employees.
The CalPERS Supplemental Income 457 Plan is administered by CalPERS and a third‐party administrator, ING, who provides record keeping and plan administration services. Plan participation is voluntary to employees of contracting public agencies and school districts, and contributions are intended to supplement the retirement benefits provided by the PERF.
Members may contribute up to the limit established under the Internal Revenue Code and are allowed to change their contribution amount, transfer account balances among 25 investment options, or change the contribution percentages designated to each option on a daily basis. The 25 investment options are: CalPERS Target Retirement Income Fund, CalPERS Target Retirement 2005 Fund, CalPERS Target Retirement 2010 Fund, CalPERS Target Retirement 2015 Fund, CalPERS Target Retirement 2020 Fund, CalPERS Target Retirement 2025 Fund, CalPERS Target Retirement 2030 Fund, CalPERS Target Retirement 2035 Fund, CalPERS Target Retirement 2040 Fund, CalPERS Target Retirement 2045 Fund, CalPERS Target Retirement 2050 Fund, CalPERS Conservative Asset Allocation Fund, CalPERS Moderate Asset Allocation Fund, CalPERS Aggressive Asset Allocation Fund, Stable Value Fund, CalPERS Treasury Inflation Protected Securities Fund, CalPERS Total Return Bond Fund, CalPERS S&P 500 Equity Index Fund, Alliance Bernstein Active Large Cap Equity Value Fund, Turner Active Large Cap Equity Growth Fund, CalPERS Small & Mid Cap Equity Index Fund, The Boston Company Active Small/Mid Cap Growth Fund,
The Boston Company Active Small/Mid Cap Value Fund,
CalPERS Comprehensive Annual Financial Report, Fiscal Year Ended June 30, 2010 | Financial Section | 45
Notes to the Basic Financial Statements (continued)Notes to the Basic Financial Statements (continued)
CalPERS Comprehensive Annual Financial Report, Fiscal Year Ended June 30, 2010 | Financial Section | 45
CalPERS International Index Fund, and Pyramis Select Active International Fund.
In addition, a Self Managed Brokerage Account (SMA)
is an optional provision. Members may access their funds upon retirement, separation from employment, or other distributable events as allowed under the Internal Revenue Code. The CalPERS Board of Administration has authorization under the Government Code of the State of California to establish plan provisions. At June 30, 2010, there were 29,456 active and inactive participants with account balances.
SCPF The Supplemental Contribution Plan (SCP) was established January 1, 2000, by Chapter 307 of the 1999 Statutes. The plan is a qualified plan under Section 401(a) of Title 26 of the United States Code. It is administered by CalPERS and a third‐party administrator, ING, who provides record keeping and plan administration services. After‐tax contributions are intended to supplement the retirement benefits provided by the PERF.
Currently, the Plan is available only to State of California employees who are members of CalPERS. The program is entirely member‐funded and participation is voluntary. Participant contributions are made on an after‐tax basis and are separate from defined benefit contributions. Participants may contribute to a deferred compensation plan in conjunction with SCP, subject to Internal Revenue Code Section 415(c) limits. The 25 investment options available in SCP are: CalPERS Target Retirement Income Fund, CalPERS Target Retirement 2005 Fund, CalPERS Target Retirement 2010 Fund, CalPERS Target Retirement 2015 Fund, CalPERS Target Retirement 2020 Fund, CalPERS Target Retirement 2025 Fund, CalPERS Target Retirement 2030 Fund, CalPERS Target Retirement 2035 Fund, CalPERS Target Retirement 2040 Fund, CalPERS Target Retirement 2045 Fund, CalPERS Target Retirement 2050 Fund, CalPERS Conservative Asset Allocation Fund, CalPERS Moderate Asset Allocation Fund, CalPERS Aggressive Asset Allocation Fund,
Stable Value Fund, CalPERS Treasury Inflation Protected Securities Fund, CalPERS Total Return Bond Fund, CalPERS S&P 500 Equity Index Fund, Alliance Bernstein Active Large Cap Equity Value Fund, Turner Active Large Cap Equity Growth Fund, CalPERS Small & Mid Cap Equity Index Fund, The Boston Company Active Small/Mid Cap Growth Fund,
The Boston Company Active Small/Mid Cap Value Fund, CalPERS International Index Fund, and Pyramis Select Active International Fund.
In addition, a Self Managed Brokerage Account (SMA)
is available. Distributions are allowed only at retirement or permanent separation from employment. The CalPERS Board of Administration has authorization under the Government Code of the State of California to establish plan provisions. At June 30, 2010, there were 687 active and inactive participants in the program.
Other Funds Administered by CalPERS
OASI The Old Age & Survivors’ Insurance Revolving Fund (OASI) was established to consolidate the collection and payment for California public agencies of employee and employer contributions under the provisions of the federal Social Security regulations.
Federal legislation was enacted on October 21, 1986, which required direct remittance of Social Security contributions by individual public agencies and eliminates the intermediary collection and remittance of such contributions by individual public agencies and by State Social Security agencies, such as the OASI. As such, effective January 1, 1987, the OASI stopped receiving contributions from public agencies. Subsequently, CalPERS, the Social Security Administration, and participating local agencies reached agreement on the proper amount of contributions, payments, and refunds. Since then the OASI fund has been utilized to reimburse the PERF for OASI contract management and related services, as provided in Government Code section 22601.
46 | Financial Section | CalPERS Comprehensive Annual Financial Report, Fiscal Year Ended June 30, 2010
Notes to the Basic Financial Statements (continued)Notes to the Basic Financial Statements (continued)
46 | Financial Section | CalPERS Comprehensive Annual Financial Report, Fiscal Year Ended June 30, 2010
HCF The Public Employees’ Health Care Fund (HCF) was established under the Public Employees’ Medical and Hospital Care Act (PEMHCA) as of July 1, 1988. The self‐funded plans, PERS Choice, PERSCare, and PERS Select (the Plans) are risk pools available to all entities that contract for health insurance coverage under PEMHCA. Having all members in a single risk pool spreads catastrophic claims over a large base and minimizes administrative expenses. The Plans retain all the risk of loss of allowable health claims. Fund members are not subject to a supplemental assessment in the event of deficiencies. Premium rates are set by the Board based on a trend analysis of the historic cost, utilization, demographics, and administrative expenses of the HCF to provide for the claims incurred and the actuarially determined required level of reserves.
The Plans rely on operating cash flows and investment income to fund health benefit payments. During the 2009‐10 fiscal year, the Board continued to increase member premiums to mitigate the impact of increasing costs associated with enrollment growth, increases in provider pricing, and increased benefit utilization. The board approved premium increase was offset by a two‐month premium holiday. Management believes that the current sources of funding will be adequate to provide for benefits of the Plans.
Public agencies participating in the Plans are required to make monthly premium payments based on rates established annually by CalPERS. Employer contributions are determined by the public agency through benefit negotiations, subject to minimum contribution levels established through PEMHCA. Public agency employee members pay the difference between the premium rate and the employers’ contribution. Administrative costs are financed through investment earnings.
CRF The Public Employees’ Contingency Reserve Fund (CRF) was established in 1962, with the passage of PEMHCA, to fund administrative costs related to the PEMHCA program, and as a contingency reserve for such items as increases in future rates or in future benefits. PEMHCA was expanded to include local public agency employees on a contract basis in 1967. The CRF is reimbursed by the State and contracting
public agencies for costs incurred for administering the program.
Activity in the CRF is reported in two separate fund types. Administrative fees collected and related costs are accounted for in the CRF enterprise fund. Public agency health payments and remittances to contracted health care providers are reported in the CRF Agency Fund.
PEMHCA establishes eligibility rules for the following: Retirees and beneficiaries receiving health care benefits, Terminated plan members entitled to but not yet receiving benefits, and
Active plan members. Administrative costs include direct costs of the program
and a proportionate share of indirect costs allocated to the CRF enterprise fund by the PERF. The administrative fee is determined as a percentage of insurance premiums paid by the employers. The administrative fee for the year ended June 30, 2010, was 0.43 percent. Administrative rates are reviewed annually and are adjusted, if needed, to cover budgeted administrative costs.
Public agency employers whose employees do not elect PERS Choice, PERSCare, or PERS Select submit the provider‐determined, Board‐approved premiums to the CRF Agency Fund, which in turn submits the premiums to the respective health care provider.
At June 30, 2010, 1,165 entities participated in health insurance coverage under PEMHCA.
LTCF The Public Employees’ Long‐Term Care Fund (LTCF) began providing self‐insured long‐term care plans in 1995. The LTCF operates by providing long‐term care coverage to enrolled members under the Public Employees’ Long‐Term Care Act (PERL, Chapter 15). The fund contracts with a third party service provider to administer the program. Long‐term care coverage is offered to all public employees (active or retired), their spouses, parents, parents‐in‐law, and siblings. The LTCF is a member‐paid program with no contributions from employers. Premium rates are recommended to the Board by an independent, third party program actuary and are set by the Board. Prospective enrollees apply directly to the program for long‐term care coverage.
As of June 30, 2010, there are 159,571 enrollees, of which 4,883 are receiving benefits. As a result of the fund deficit,
CalPERS Comprehensive Annual Financial Report, Fiscal Year Ended June 30, 2010 | Financial Section | 47
Notes to the Basic Financial Statements (continued)Notes to the Basic Financial Statements (continued)
CalPERS Comprehensive Annual Financial Report, Fiscal Year Ended June 30, 2010 | Financial Section | 47
the CalPERS Board of Administration did not approve the application period for 2010; and the LTCF is currently closed to new entrants.
The decrease in the unrestricted net deficit in the LTCF from $811.6 million at June 30, 2009 to $118.5 million at June 30, 2010 is attributable to favorable investment returns since the June 30, 2009 valuation and approved premium rate increases effective July 1, 2010 which were reflected in the June 30, 2010 valuation. The overall decrease in the deficit attributable to investment returns and the premium rate increase was offset in part by the impact of the decrease in the investment rate of return assumption from 7.79 percent to 6.38 percent. The actuarial valuation results are very sensitive to the underlying assumptions utilized, including the investment rate of return and morbidity. The valuation is based on assumed morbidity more favorable than actual program experience. If actual experience continues to emerge as it has to date, valuation results will deteriorate (e.g. a projected deficit would increase) as the credibility attributable to the experience increases. Due to the recently implemented premium rate increases, the June 30, 2010 valuation included projections using the in force data as of September 30, 2010 in order to reflect actual shock lapses and conversions that occurred during the first three months after implementation. LTCF management is continuing to review the impact of the recently implemented premium increases and decrease in investment discount rate assumption to determine if additional corrective actions are necessary.
DCF The Public Employees’ Retirement System Deferred Compensation Fund (DCF) was used to account for revenues and expenses associated with administrative and investment management services provided to other governments by CalPERS staff. The services assisted other governments with their administration of deferred compensation plans. Revenues came from fees charged to various State of California public agencies for managing 19 of the 25 investment portfolios offered in the CalPERS IRC 457 and SCPF plans and the one portfolio in the SPOFF.
The DCF was established by Chapter 1659 of the 1990 Statutes, which added Government Code Sections 21420‐21429. These Government Code Sections were subsequently renumbered to Government Code Sections
21670‐21685 by Chapter 379 of the 1995 Statutes. Operation and initial funding of the DCF commenced July 1991.
Beginning with the 2009‐2010 fiscal year the fees charged to the various State of California public agencies, and the related administrative and management fees paid, are recorded directly in the IRC 457, SPOFF, and SCPF. All residual net assets of the DCF were allocated to the IRC 457, SPOFF, and SCPF at the beginning of the fiscal year. The DCF net asset allocation is reflected in the financial statements as an interfund transfer. Beginning with the 2010‐2011 fiscal year, the DCF will cease to be reported as a proprietary fund in the CalPERS basic financial statements.
RBF The Replacement Benefit Fund (RBF) was established as a custodial fund by Chapter 938 of the 1995 Statutes and initially funded in 1998 to provide benefits to members of the PERF whose retirement benefit exceeds Internal Revenue Code Section 415(b) limits. IRC Section 415(b) imposes a dollar limit on the annual retirement benefits an individual may receive from a qualified defined benefit pension plan.
The RBF is funded on a “pay‐as‐you‐go” basis. That is, money collected from an employer during any calendar year must be paid to the retiree during that same year. Employer contributions must be in amounts “equivalent to” the benefits not paid as a result of the limitations of IRC Section 415(b). CalPERS calculates the member’s retirement allowance based on the member’s choice of retirement option. CalPERS also is responsible for calculating the applicable dollar limit under IRC Section 415(b), and setting the employer rates. At June 30, 2010, there were 236 retirees receiving replacement benefits.
2. SUMMARY OF SIGNIFICANT ACCOUNTING POLICIES Measurement Focus, Basis of Accounting & Basis of Presentation
The accompanying financial statements were prepared in accordance with accounting principles generally accepted in the United States of America (GAAP). In doing so, CalPERS adheres to guidelines established by the Governmental Accounting Standards Board (GASB), as well as accounting policies that comply with applicable laws and regulations.
48 | Financial Section | CalPERS Comprehensive Annual Financial Report, Fiscal Year Ended June 30, 2010
Notes to the Basic Financial Statements (continued)Notes to the Basic Financial Statements (continued)
48 | Financial Section | CalPERS Comprehensive Annual Financial Report, Fiscal Year Ended June 30, 2010
Due to the types of investments held by the CRF agency and enterprise funds, JRF, and RBF, there was no net appreciation (depreciation) in the fair value of investments in fiscal year 2009‐10. The calculation of realized gains and losses is independent of the calculation of the change in the fair value of investments.
The accounts of CalPERS are organized and operated on the basis of funds. CalPERS has the following fund types at June 30, 2010:
Fiduciary funds — including pension trust, other post‐employment trust, and agency funds, account for assets held by CalPERS in a trustee capacity or as an agent on behalf of others. The pension trust funds (PERF, LRF, JRF, JRF II, SPOFF, IRC 457, and SCPF) and the other post‐employment health care fund (CERBTF) are accounted for on the flow of economic resources measurement focus and the accrual basis of accounting. Member contributions for the PERF, LRF, JRF, JRF II, IRC 457, and SCPF are recognized in the period in which the contributions are due. Employer contributions for the PERF, JRF, JRF II, SPOFF, and CERBTF are recognized when due and the employer has made a formal commitment to provide the contributions. Benefits and refunds in the defined benefit plans are recognized when due and payable in accordance with the terms of each plan. The agency funds (OASI, CRF, and RBF) are custodial in nature and do not measure the results of operations. Assets and liabilities are recorded using the accrual basis of accounting.
Proprietary funds — including enterprise funds (HCF, CRF, LTCF, and DCF) are accounted for on the flow of economic resources measurement focus and use the accrual basis of accounting. Under this method, revenues are recorded when earned and expenses are recorded at the time liabilities are incurred. CalPERS applies all applicable GASB pronouncements in accounting and reporting for its proprietary operations, and follows FASB pronouncements issued prior to December 1, 1989, insofar as those standards do not conflict with or contradict guidance of the GASB. CalPERS has elected not to follow FASB pronouncements issued after November 30, 1989. Operating revenues and expenses are distinguished from non‐operating items and generally result from providing services in connection with ongoing operations. The principal operating revenues of the HCF, CRF, and LTCF are derived from self‐insurance premiums and providing administrative services. The DCF
had no operations in fiscal year 2009‐10. Operating expenses include the cost of claims and related administrative expenses. All revenues and expenses not meeting these definitions are reported as non‐operating revenues and expenses.
New GASB Pronouncements
GASB Statement No. 51 Effective July 1, 2009, CalPERS implemented the provisions of GASB Statement No. 51, Accounting and Financial Reporting for Intangible Assets, which establishes accounting and financial reporting requirements for intangible assets in order to reduce inconsistencies, thereby enhancing the comparability of such assets among state and local governments. The impact to CalPERS of the implementation of GASB Statement No. 51 is described in the Capital Assets section of this note.
GASB Statement No. 53 Effective July 1, 2009, CalPERS implemented the provisions of GASB Statement No. 53, Accounting and Financial Reporting for Derivative Instruments, which addresses the recognition, measurement, and disclosure of information in financial statements regarding derivative instruments (derivatives) entered into by state and local governments.
As of June 30, 2010, CalPERS derivative instruments are considered investments and not hedges for accounting purposes. As CalPERS reported all investments, including investment derivative instruments, at fair value in prior fiscal years, the implementation of Statement No. 53 does not have a significant impact on the financial statements for the fiscal year ended June 30, 2010. Disclosure details for investment derivative instruments can be found in the Derivatives section of Note 4.
GASB Statement No. 57 Effective July 1, 2009, CalPERS early implemented the provisions of GASB Statement No. 57, OPEB Measurements by Agent Employers and Agent Multiple‐Employer Plans. Statement 57 requires employers that participate in a governmental multiple employer trust to measure OPEB liabilities and related data as of the same date in each biennial reporting period. Additionally, Statement No. 57 amends in part Statements 43 and 45. Statement No. 57 allows employers that participate in a governmental multiple
CalPERS Comprehensive Annual Financial Report, Fiscal Year Ended June 30, 2010 | Financial Section | 49
Notes to the Basic Financial Statements (continued)Notes to the Basic Financial Statements (continued)
CalPERS Comprehensive Annual Financial Report, Fiscal Year Ended June 30, 2010 | Financial Section | 49
employer trust and that would otherwise be eligible to measure and report OPEB liabilities and related data using the Alternative Measurement Method (AMM), a spreadsheet based calculator, to do so.
The CERBT program adopted the reporting changes required by GASB Statement No. 57 for the fiscal year ended June 30, 2010. The actuarial value of assets (AVA), actuarial accrued liabilities (AAL) and related OPEB data were aligned to a single date of June 30, 2009. CalPERS projected the AVA and AAL as of June 30, 2009 by rolling forward or backward the actuarial data contained in valuations and Alternative Measurement Method (AMM) reports prepared by participating employers as of varying valuation dates. The alignment was achieved by applying methods allowed under Actuarial Standards of Practice and under Generally Accepted Accounting Principles.
At June 30, 2009, the CERBT reported actuarial data for 196 employers using unaligned data derived from valuations prepared over a range of dates. At June 30, 2010, actuarial information in the schedule of funded status in Note 10 and schedule of funding progress in RSI is presented as of June 30, 2009 for all 258 participating employers participating in the trust.
In the future, the alignment of actuarial data will be updated biennially, as required by GASB Statements 43 and 57. The reporting of data aligned to a common date will benefit readers when trying to evaluate the progress made over time by employers working toward funding their OPEB liability.
Investments The majority of the investments held at June 30, 2010, are in the custody of or controlled by State Street Bank, CalPERS master custodian. State statutes and Board policies allow investments consisting of government, corporate and international debt, domestic and international equities, mutual funds, alternative investments, real estate, Inflation Linked Asset Class (ILAC), and other investments.
Investments are reported at fair value. The diversity of the investment types in which CalPERS invests requires a wide range of techniques to determine fair value. The overall valuation processes and information sources by major asset classification are as follows:
Short Term Short‐term investments can consist of U.S. Treasury and Government Sponsored Securities, Money Market Funds, Commercial Paper, Certificates of Deposit, Delivery Versus Payment (DVP) Repurchase Agreements, Asset Backed Securities, Notes and Bonds issued by U.S. corporations, and other allowable instruments that meet short‐term maturity or average life, diversification, and credit quality restrictions. This approach allows for a high level of liquidity and diversification. Assets are reported at fair value or cost or amortized cost that approximates fair value. Fair value is determined based upon quoted market prices. For investments where no readily ascertainable market value exists, management, in consultation with their investment advisors, has determined the fair values for the individual investments.
Debt Securities Debt securities consists primarily of negotiable obligations of the U.S. Government and U.S. Government sponsored agencies, corporations, and securitized offerings backed by residential and commercial mortgages, credit cards, auto and student loans. Certain debt securities, such as U.S. government bonds, have an active market for identical securities. These securities can typically be valued using the close or last traded price on a specific date. The majority of other debt securities are not as actively traded and are thus valued by pricing vendors, which use modeling techniques that include market observable inputs required to develop a fair value. Typical inputs include recent trades, yields, price quotes, cash flows, maturity, credit ratings and other assumptions based upon the specifics of the asset type.
Equities The majority of domestic and international equity securities held by CalPERS are actively traded on major stock exchanges or over‐the‐counter. These exchanges make information on trades of identical securities available daily on a last trade or official close basis. If such information is not available, other pre‐established means are used to determine a price.
In addition, CalPERS holds limited partner positions in corporate governance funds, organized to invest strategically in publicly traded equity securities of companies on major stock exchanges to achieve long‐term capital appreciation. These limited partnerships have been valued using the net asset value (NAV) of the entity, with the most significant input into the NAV being the value of
50 | Financial Section | CalPERS Comprehensive Annual Financial Report, Fiscal Year Ended June 30, 2010
Notes to the Basic Financial Statements (continued)Notes to the Basic Financial Statements (continued)
50 | Financial Section | CalPERS Comprehensive Annual Financial Report, Fiscal Year Ended June 30, 2010
its investment holdings. The general partners obtain prices for their holdings in a manner similar to that described above for CalPERS equity holdings.
CalPERS has invested as a limited partner in various funds which employ specific strategies. The most common investment strategies for these funds include, but are not limited to Directional Trading, Event Driven, Fund of Hedge Funds, Multi‐Process, Security Selection, and Specialist Credit strategies. Involvements in such funds are long term and have limited liquidity. As a result, investors are subject to redemption restrictions which generally limit distributions and restrict the ability of limited partners to exit a partnership investment prior to its dissolution. These partnerships are valued using their respective NAV, and are audited annually. The most significant input into the NAV of such an entity is the fair value of its investment holdings. These holdings are valued by the general partners on a quarterly or semi‐annual basis, in conjunction with management, valuation specialists, and investment advisors. The management assumptions are based upon the nature of the investment and the underlying business. The valuation techniques vary based upon investment type and involve a certain degree of expert judgment.
Alternative Investments CalPERS has invested as a limited partner in various funds which employ specific strategies. The most common investment categories for these funds include leveraged buyouts, venture capital, growth capital, distressed investments and mezzanine capital. The strategies of all such funds are long term and illiquid in nature. As a result, investors are subject to redemption restrictions which generally limit distributions and restrict the ability of limited partners to exit a partnership investment prior to its dissolution. Alternative Investments partnerships are valued using their respective NAV, and are audited annually. The most significant input into the NAV of such an entity is the fair value of its investment holdings. These holdings are valued by the general partners on a quarterly or semi‐annual basis, in conjunction with management and investment advisors, and consultation with valuation specialists. The management assumptions are based upon the nature of the investment and the underlying business. The valuation techniques vary based upon investment type and involve a certain degree of expert judgment.
Real Estate Real estate is held either directly, in separate accounts, or as a limited partner or in a joint venture or commingled fund. Properties owned directly or in a joint venture structure are subject to independent third‐party appraisals performed in accordance with the Uniform Standards of Professional Appraisal Practice once every year. Real estate investments in a commingled fund are long term and illiquid in nature. As a result, investors are subject to redemption restrictions which generally limit distributions and restrict the ability of limited partners to exit a partnership investment prior to its dissolution. Limited partner interest in joint venture and commingled funds are valued by CalPERS using the NAV of the partnership. The most significant input into the NAV of such an entity is the value of its investment holdings. These holdings are valued by the general partners on a continuous basis, audited annually and may be periodically appraised by an independent third party. The valuation assumptions are based upon both market and property specific inputs which are not observable and involve a certain degree of expert judgment.
Inflation Linked Asset Class (ILAC) In December 2007, the CalPERS Board of Administration approved an investment asset allocation that includes a 5 percent allocation in an Inflation Linked Asset Class. The ILAC is Board approved to include commodities, inflation‐linked bonds, infrastructure, forestland, and foreign currency. The commodities and inflation‐linked bonds investments are valued based on quoted market price. The infrastructure and forestland investments are valued in the same manner as described in the Alternative Investments and Real Estate sections of this footnote respectively.
At June 30, 2010, the ILAC held $1.5 billion of inflation‐linked bonds, $0.4 billion in infrastructure, $2.4 billion in forestland, and $0.8 billion in commodities exposure, and $13.0 million in foreign currency. CalPERS presents, in the statement of changes in fiduciary net assets, the net appreciation (depreciation) in the fair value of its investments, which consists of the realized gains and losses and the unrealized appreciation and depreciation on those investments. Purchases and sales are recorded on the trade date. Interest income is recorded on the accrual basis. Dividends are recorded on the ex‐dividend date.
CalPERS Comprehensive Annual Financial Report, Fiscal Year Ended June 30, 2010 | Financial Section | 51
Notes to the Basic Financial Statements (continued)Notes to the Basic Financial Statements (continued)
CalPERS Comprehensive Annual Financial Report, Fiscal Year Ended June 30, 2010 | Financial Section | 51
There are certain market risks, including interest, credit, foreign currency exchange and concentration risk, which may subject the System to economic changes occurring in certain industries, sectors, or geographies.
Capital Assets Capital assets are defined by CalPERS as assets with an initial individual cost of $5,000 or more, or $1 million or more for intangible assets, and an estimated useful life in excess of one year.
Capital assets held by the PERF, consisting of buildings, furniture, equipment, and intangible assets are recorded at cost or, if donated, at their estimated fair market value at the date of donation. Capital assets are depreciated over their estimated useful lives, ranging from one to five years for furniture and equipment, 40 years for buildings, and determined on an asset by asset basis for intangible assets, using the straight‐line method of depreciation.
Effective for the 2009‐10 fiscal year, with the implementation of the provisions of GASB Statement No. 51, CalPERS identified and capitalized outlays incurred for the development of internally generated software.
GASB Statement No. 51 identifies three stages of activities in the development and installation of internally generated computer software: (a) Preliminary Project Stage, (b) Application Development Stage, and (c) Post‐Implementation/Operation Stage. Outlays relating to the Application Development Stage are required to be capitalized. Development costs of internally generated computer software that began prior to the start of the 2009‐10 fiscal year, but still in the Application Development Stage during the 2009‐2010 fiscal year, were retroactively capitalized. The retroactive capitalization of this internally generated computer software is reflected in the Statement of Changes in Fiduciary Net Assets as a restatement of beginning net assets.
The total amount of internally generated software capitalization is $284.1 million, of which the total retroactive restated amount is $237.6 million for capital outlays that occurred in the six prior fiscal years. CalPERS internally generated software includes those relating to the Pension System Resumption (PSR), Financial System Integrity Project (FSIP), Investment Trade Room System Replacement, and other software for various projects. The capital asset relating to PSR alone is $244.7 million. The intangible assets are
included as Capital Assets in the Statement of Fiduciary Net Assets — Fiduciary Funds, net of any Accumulated Amortization.
Use of Estimates in the Preparation of Financial Statements The preparation of financial statements in conformity with accounting principles generally accepted in the United States of America requires management to make estimates and assumptions that affect the reported amounts of net assets held in trust for pension and post‐employment health care benefits and changes therein, incurred but not reported (IBNR), claims payable, LTCF liability, and disclosure of contingent liabilities at the date of the financial statements. Actual results could differ from those estimates.
Comparative Totals The basic financial statements include certain prior‐year summarized comparative information in total but not at the level of detail required for a presentation in conformity with the accounting principles generally accepted in the United States of America. Accordingly, such information should be read in conjunction with CalPERS financial statements for the year ended June 30, 2009, from which the summarized information was derived.
Reclassifications Certain reclassifications have been made to the comparative totals as of and for the year ended June 30, 2009, to conform to the presentation as of June 30, 2010.
3. CASH & CASH EQUIVALENTS Cash and cash equivalents of approximately $668.3 million at June 30, 2010 represent amounts held in the CalPERS general operating accounts with the State Treasury. The underlying investments are not individually identifiable by fund, as CalPERS monies are pooled with the monies of other State agencies and invested by the State Treasurer’s Office.
4. INVESTMENTS For the year ended June 30, 2010, State Street Bank & Trust Company was the master custodian for significantly all CalPERS securities, however, certain securities are held by
52 | Financial Section | CalPERS Comprehensive Annual Financial Report, Fiscal Year Ended June 30, 2010
Notes to the Basic Financial Statements (continued)Notes to the Basic Financial Statements (continued)
52 | Financial Section | CalPERS Comprehensive Annual Financial Report, Fiscal Year Ended June 30, 2010
alternative investment managers. Real estate deeds of trust are held in the name of Limited Liability Corporations and Partnerships. The investments held by the PERF, LRF, JRF II, SPOFF, SCPF, CERBTF, IRC 457, HCF, and LTCF have been commingled and held in internally managed investment pools. The investments are held in a domestic and international equity pool, and a debt securities pool. Each of the nine funds has a different asset allocation based on Board‐approved policy.
In accordance with GASB Statement No. 40, CalPERS discloses investments of all CalPERS managed funds that are subject to certain risks: custodial credit risk, concentration of credit risk, interest rate risk, credit risk and foreign currency risk.
Securities Lending The State Constitution and CalPERS Board policies permit CalPERS to use investments of the PERF to enter into securities lending transactions, collateralized loans of securities to broker‐dealers and other entities with a simultaneous agreement to return the collateral for the same securities in the future. CalPERS has contracted with eSecLending LLC (eSec), State Street Bank & Trust (SSB), and Goldman Sacs Agency Lending as third‐party securities lending agents to loan domestic and international equity and debt securities. Additionally, CalPERS contracts with eSecLending as an administrative agent for CalPERS principal borrowers.
Domestic and international securities are collateralized for cash at 102 percent and 105 percent, respectively, of the loaned securities market value. Management believes CalPERS has minimized credit risk exposure to borrowers by requiring the borrower to provide collateralization greater than 100 percent of the market value of the securities loaned. The securities loaned are priced daily by third party sources and margins are paid/received daily to maintain over collateralized levels. On June 30, 2010, the fair value of the securities on loan was approximately $17.0 billion. The securities lending program experienced an unrealized gain in the re‐invested cash collateral securities of $127.6 million, which is included in the Net (Depreciation) Appreciation in Fair Value of Investments in the Statement of Changes in Fiduciary Net Assets. The unrealized gain represents a partial recovery of fiscal year 2008‐09 unrealized losses of $658.1 million.
In the event that a borrower fails to return the securities or fails to remit income distributions by the securities’ issuers to CalPERS while the securities are on loan, the borrower is responsible for the associated costs. Securities on loan can be recalled on demand by CalPERS or the borrower at anytime. CalPERS may enter into term loan agreements which are evaluated on an individual basis.
The cash collateral is invested in accordance with CalPERS investment guidelines in short‐term, high‐credit quality fixed income securities. At June 30, 2010, certain collateral reinvestments did not comply with CalPERS investment guidelines due to the enforcement actions described in the following paragraph. In addition, credit rating for certain collateral reinvestments did not comply with the investment guidelines due to credit quality downgrades occurring in 2009‐10 and prior fiscal years. Management is monitoring the collateral reinvestments for opportunities to maximize those investments. Currently, eSec, SSB, and CalPERS manage the cash collateral. For the year ended June 30, 2010, the cash collateral invested by SSB, eSec, CalPERS High Quality Libor, CalPERS Internal Collateral, and CalPERS Short Duration, had weighted average maturities of 48, 1,634, 111, 219, and 38 days, respectively.
The large weighted average maturity in the eSec collateral pool is attributed to two Structured Investment Vehicles (SIV’s) within the pool. The SIV’s were purchased as Medium Term Notes between April 2006 and March 2007 (with April 2009 and March 2010 maturity dates) and at the time of purchase met all Cash Collateral Re‐investment Policy guidelines. In 2007 and 2008, both SIV’s went into enforcement, defaulted and eventually re‐structured. The re‐structuring involved CalPERS receiving a pro‐rata in kind share of underlying collateral of the SIV’s. The average maturity on the underlying collateral is substantially longer than the original Medium Term Notes and is considered long term. CalPERS has incurred an unrealized loss of $553.9 million as a result of marking the SIV’s value down to current fair value as of June 30, 2010.
Cash collateral received is reported as Security Lending Obligation on the Statement of Fiduciary Net Assets. Re‐invested cash collateral is reported as Security Lending Collateral on the Statement of Fiduciary Net Assets and is being reported at fair value at June 30, 2010.
CalPERS Comprehensive Annual Financial Report, Fiscal Year Ended June 30, 2010 | Financial Section | 53
Notes to the Basic Financial Statements (continued)Notes to the Basic Financial Statements (continued)
CalPERS Comprehensive Annual Financial Report, Fiscal Year Ended June 30, 2010 | Financial Section | 53
On the following pages, investment risk schedules disclose CalPERS investments subject to certain types of risk, pursuant to GASB Statement 40. Each schedule discloses investments of all funds managed by CalPERS subject to each type of risk.
Custodial Credit Risk CalPERS does not have any funds or deposits that are not covered by depository insurance, which are either uncollateralized, collateralized with securities held by the pledging financial institution, or collateralized with securities held by the pledging financial institution’s trust department or agent, but not in CalPERS name. CalPERS does not have any investments that are not registered in the name of CalPERS and are either held by the counterparty or the counterparty’s trust department or agent, but not in CalPERS name, except for two investment portfolios of the IRC 457 and SCPF, which are held in the name of State Street Global Advisors (SSgA).
Concentration of Credit Risk CalPERS does not have investments in any one issuer which represent 5 percent or more of total fair value of all investments.
Interest Rate Risk Interest rate risk is the risk that changes in interest rates will adversely affect the fair value of an investment. This risk is managed within the portfolios using the effective duration or option‐adjusted methodology. The System’s investment policies require the option‐adjusted duration of the total fixed income portfolio to stay within 20 percent of the option‐adjusted duration of its benchmark (Barclay’s Long Liability Index). All individual portfolios are required to maintain a specified level of risk relative to their benchmark. Risk exposures are monitored daily.
The System invests in securities with contractual cash flows, such as asset backed securities, collateralized mortgage obligations and commercial mortgage backed securities, including securities backed by residential and commercial mortgage loans. The value, liquidity and related income of these securities are sensitive to changes in economic conditions, including real estate value, delinquencies or defaults, or both, and may be adversely
affected by shifts in the market’s perception of the issuers and changes in interest rates.
Credit Risk Credit risk is defined as the risk that an issuer or other counterparty to an investment will not fulfill its obligations. The System’s investment policies establish general as well as specific risk measures for the fixed income portfolio. From the most general perspective, 80 percent of the total fixed income portfolio must be invested in investment‐ grade securities.
Investment‐grade securities are those fixed income securities with a Moody’s rating of AAA to BAA or a Standard & Poor’s rating of AAA to BBB. Each portfolio is required to maintain a specified risk level. Portfolio exposures are monitored daily.
Foreign Currency Risk Foreign currency risk is defined as any deposits or investments that are denominated in foreign currencies, which bear a potential risk of loss arising from changes in currency exchange rates. The System’s asset allocation and investment policies allow for active and passive investments in international securities. The System’s target allocation is to have 50 percent of total global equity assets invested in international equities and 10 percent of total fixed income invested in international securities. Real estate and alternative investments do not have a target allocation for international investments. The System uses a currency overlay program to reduce risk by hedging approximately 25 percent of the developed market international equity portfolio. Currency exposures are monitored daily.
54 | Financial Section | CalPERS Comprehensive Annual Financial Report, Fiscal Year Ended June 30, 2010
Notes to the Basic Financial Statements (continued)Notes to the Basic Financial Statements (continued)
54 | Financial Section | CalPERS Comprehensive Annual Financial Report, Fiscal Year Ended June 30, 2010
CalPERS – Debt Security Investments Subject to Interest Rate Risk (Dollars in Thousands)
PortfolioWeightedAverage
Fair Value Percent of EffectiveJune 30, All Debt Duration
Debt Security Type 2010 Securities (Years)
U.S. Treasuries & Agencies $16,398,745 29.6 % 8.87
Mortgages 12,653,779 22.8 3.23
Corporate 16,261,198 29.3 9.08
Asset Backed 4,692,301 8.5 1.74
International 3,389,483 6.1 7.89
Commercial Paper 326 0.0 3.99
State Street Bank Pool 215,502 0.4 0.08
Commingled 502 0.0 3.74
Municipal 4,589 0.0 12.37
No Effective Duration:
Asset Backed 591,293 1.1 N/A
Commercial Paper 79,633 0.1 N/A
Commingled 635,116 1.1 N/A
Corporate 494,690 0.9 N/A
Municipal 1,694 0.0 N/A
Mortgages 56,425 0.1 N/A
Private Placement 7,851 0.0 N/A
SWAPS 9,614 0.0 N/A
TOTAL 1 $55,492,741 100.0 %
Note: 1 This table represents the fair value of investments in the fixed income portfolios. The debt securities investments line item in the statement of fiduciary net assets and the statement of proprietary net assets are reported at net asset value which includes accruals for certain unitized portfolios.
CalPERS invested in the State Treasury pool and State Street Bank Global Advisors’ (SSgA) short‐term investment fund. These investments are included as part of the short‐term investment line item on the financial statements. At June 30, 2010, the pooled money investment account with the State Treasury totaled approximately $1.6 billion and the short‐term investment fund with SSgA totaled approximately $8.1 billion. The weighted average maturity is 203 days for the State Treasury pool and 30 days for the SSgA short‐term investment fund.
CalPERS – Securities Lending Collateral Subject to Interest Rate Risk (Dollars in Thousands)
PortfolioPercent Weighted
of All AverageFair Value Securities EffectedJune 30, Lending Duration
TOTAL 1 $17,047,678 100.0 % Notes: 1 This table represents the fair value of investments in the securities lending collateral.
2 Of the Money Market Fund total, $312,977 is invested in a SEC registered 2(a)‐7 Money Market Fund with a weighted average maturity of 48 days.
CalPERS – Securities Lending Collateral Subject to Credit Risk (Dollars in Thousands)
Moody'sQuality Rating Fair Value
AAA $9,104,131 53.4 %
AA‐1 81,215 0.5
AA‐2 1,012,287 5.9
AA‐3 910 0.0
A‐2 28,668 0.2
A‐3 275,231 1.6
BAA‐2 28,213 0.2
BAA‐3 20,541 0.1
BA‐2 10,943 0.1
B‐3 3,689 0.0
P‐1 1,875,000 11.0
NR 1, 2 4,606,850 27.0
TOTAL 3 $17,047,678 100.0 %
Percent of TotalDebt SecurityInvestments
Fair Value as a
Notes: 1 NR represents those securities that are not rated. 2 This figure includes the $312,977 invested in a SEC registered 2(a)‐7 Money Market Fund.
3 The above table represents the fair value of investments in the securities lending collateral portfolio.
CalPERS Comprehensive Annual Financial Report, Fiscal Year Ended June 30, 2010 | Financial Section | 55
Notes to the Basic Financial Statements (continued)Notes to the Basic Financial Statements (continued)
CalPERS Comprehensive Annual Financial Report, Fiscal Year Ended June 30, 2010 | Financial Section | 55
CalPERS – Debt Security Investments Subject to Credit Risk (Dollars in Thousands)
Moody'sQuality Rating Fair Value
AAA $20,442,317 36.8 %
AA‐1 130,283 0.2
AA‐2 1,151,763 2.1
AA‐3 570,360 1.0
A‐1 695,125 1.3
A‐2 1,942,311 3.5
A‐3 1,782,126 3.2
BAA‐1 2,862,308 5.2
BAA‐2 2,874,746 5.2
BAA‐3 1,595,171 2.9
BA‐1 974,200 1.8
BA‐2 381,401 0.7
BA‐3 501,446 0.9
B‐1 232,147 0.4
B‐2 389,812 0.7
B‐3 453,143 0.8
CAA 155,061 0.3
CA 52,943 0.1
C 10,859 0.0
CAA‐1 278,894 0.5
CAA‐3 72,359 0.1
NA 1 13,837,296 24.9
NR 2 4,106,670 7.4
TOTAL 3 $55,492,741 100.0 %
Percent of TotalDebt SecurityInvestments
Fair Value as a
Notes: 1 NA represents those securities to which the rating disclosure requirements do not apply.
2 NR represents those securities that are not rated. 3 The above table represents the fair value of investments in the fixed income portfolios. The debt securities investments line item in the statement of fiduciary net assets and the statement of proprietary net assets are reported at net asset value which includes accruals for certain unitized portfolios.
CalPERS invested in the State Treasury pool and State Street Bank Global Advisors’ (SSgA) short‐term investment fund. These investments are included as part of the short‐term investment line item on the financial statements. At June 30, 2010, the pool money investment account with the State Treasury totaled approximately $1.6 billion and the short‐term investment fund with SSgA totaled approximately $8.1 billion. These investment pools are not rated.
Derivatives Under the State Constitution and statutory provisions governing CalPERS investment authority, CalPERS holds investments in swaps, options, futures, rights and warrants and enters into forward foreign currency exchange and to‐be‐announced (TBA) security contracts. The fair value of options, futures, rights and warrants, determined based upon quoted market prices. The fair value of derivative investments that are not exchange traded, such as swaps, and TBA’s is determined by an external pricing service using various proprietary methods, based upon the type of derivative instrument. Futures contracts are marked‐to‐market at the end of each trading day, and the settlement of gains or losses occur on the following business day through variation margins. The fair value of international currency forwards represents the unrealized gain or loss on the related contracts, which is calculated as the difference between the specified contract exchange rate and the exchange rate at the end of the reporting period.
Forward foreign currency exchange contracts are used primarily to hedge against changes in exchange rates related to foreign securities.
Due to the level of risk associated with certain derivative investment securities, it is reasonably possible that changes in the values of investment securities will occur in the near term, and such changes could affect the amounts reported in the financial statements.
CalPERS could be exposed to risk if the counterparties to the contracts are unable to meet the terms of the contracts.
CalPERS investment managers seek to control this risk through counterparty credit evaluations and approvals, counterparty credit limits, and exposure monitoring procedures. CalPERS anticipates that the counterparties will be able to satisfy their obligations under the contracts.
56 | Financial Section | CalPERS Comprehensive Annual Financial Report, Fiscal Year Ended June 30, 2010
Notes to the Basic Financial Statements (continued)Notes to the Basic Financial Statements (continued)
56 | Financial Section | CalPERS Comprehensive Annual Financial Report, Fiscal Year Ended June 30, 2010
CalPERS – Derivative Instruments Summary (Dollars in Thousands)
Total Return Bond Swaps Received Fixed 1%, Pay Fixed .09% $490 $120,872
Total Return Bond Swaps Received Fixed 0%, Pay Fixed .1% 556 137,095
Total Return Bond Swaps Received Fixed .01%, Pay Fixed .14% 377 92,880
Total Return Bond Swaps Received Fixed .1%, Pay Fixed .65% (1,111) 97,483
Total Return Bond Swaps Received Fixed 1%, Pay Fixed .5% (3,217) 126,845
Total Return Bond Swaps Received Fixed 1%, Pay Fixed .65% (1,129) 99,079
Subtotal — Total Return Bond Swaps ($4,034) $674,254
TOTAL $18,236 $9,876,817
58 | Financial Section | CalPERS Comprehensive Annual Financial Report, Fiscal Year Ended June 30, 2010
Notes to the Basic Financial Statements (continued)Notes to the Basic Financial Statements (continued)
58 | Financial Section | CalPERS Comprehensive Annual Financial Report, Fiscal Year Ended June 30, 2010
CalPERS – Derivative Instruments Subject To Credit Risk (Dollars in Thousands)
Percentage of S&P Fitch Moody'sCounterparty Net Exposure Ratings Ratings Ratings
Royal Bank of Canada (UK) 16.71% AA‐ AA Aaa
HSBC Bank PLC 13.87% AA AA Aa3
Barclays Bank PLC Wholesale 13.06% AA‐ AA‐ Aa3
UBS AG London 12.44% A+ A+ Aa3
Bank of America NA 6.30% A+ A+ Aa3
Royal Bank of Scotland PLC 6.00% A+ AA‐ Aa3
Morgan Stanley Capital Services, Inc. 5.34% A A A2
Deutsche Bank AG London 5.32% A+ AA‐ Aa3
Royal Bank of Canada 4.47% AA‐ AA Aaa
Morgan Stanley and Co. International PLC 3.19% A A A2
State Street Bank London 3.12% A+ A+ A1
Citibank NA 3.11% A+ A+ A1
Mellon Bank NA 2.32% AA‐ AA‐ Aa2
UBS AG 1.63% A+ A+ Aa3
Merrill Lynch Pierce Fenner & Smith, Inc. 1.16% A A+ A2
Bank of America Securities, LLC 0.75% A A+ A2
Barclays Capital 0.45% AA‐ AA‐ Aa3
Goldman Sachs International 0.38% A A+ A1
HSBC Bank USA 0.25% AA AA Aa3
Credit Suisse Securities (USA), LLC 0.12% A+ AA‐ Aa1JP Morgan Chase Bank NA 0.01% AA‐ AA‐ Aa1
CalPERS Comprehensive Annual Financial Report, Fiscal Year Ended June 30, 2010 | Financial Section | 59
Notes to the Basic Financial Statements (continued)Notes to the Basic Financial Statements (continued)
CalPERS Comprehensive Annual Financial Report, Fiscal Year Ended June 30, 2010 | Financial Section | 59
CalPERS — International Investment Securities | At Fair Value at June 30, 2010 (U.S. Dollars in Thousands) Investment Securities of all CalPERS managed funds, including derivative instruments that are subject to foreign currency risk.
Alternative Fixed Forward Currency Equity Investments Income Real Estate Cash Contracts Total
Australian Dollar $2,560,685 $64,452 $111,435 $169,373 $19,187 $16,425 $2,941,557
Brazilian Real 1,905,902 — — 374,289 12,071 — 2,292,262
Canadian Dollar 3,356,927 228,363 112,914 148,248 22,199 6,858 3,875,509
Singapore Dollar 685,196 — 26,241 18,795 7,209 (826) 736,615
South African Rand 1,094,762 — — — 1,367 346 1,096,475
South Korean Won 1,754,835 — 24,308 — 4,079 (5,652) 1,777,570
Sri Lanka Rupee — — — — 3 — 3
Swedish Krona 1,056,494 — 19,279 38,996 2,334 1,524 1,118,627
Swiss Franc 2,434,766 — — 2,356 2,443 (17,477) 2,422,088
Thailand Baht 261,862 — — 2,743 4,190 39 268,834
TOTAL $50,470,138 $2,998,831 $2,979,841 $3,377,784 $380,264 $125,562 $60,332,420
Derivative instruments are included in the amounts reported under equities, fixed income, and as forward contracts.
60 | Financial Section | CalPERS Comprehensive Annual Financial Report, Fiscal Year Ended June 30, 2010
Notes to the Basic Financial Statements (continued)Notes to the Basic Financial Statements (continued)
60 | Financial Section | CalPERS Comprehensive Annual Financial Report, Fiscal Year Ended June 30, 2010
Real Estate Real estate investments are classified as investments in accordance with GASB Statement 25. Certain real estate investments are leveraged whereby partnerships have been established to purchase properties through a combination of contributions from CalPERS and other investors and through the acquisition of debt. At June 30, 2010, real estate equities of approximately $28.9 billion are reported at estimated fair value. Of this amount, $15.2 billion is equity and $10.7 billion is long‐term mortgages payable, and $2.8 billion is other short‐term liabilities.
Required repayment of real estate debt, which includes both recourse and non‐recourse debt, is as follows:
Required Repayment of Real Estate Debt (Dollars in Thousands)
Debt Matures Year Ending June 30 Amount
2011 $2,140,501
2012 2,519,707
2013 1,586,023
2014 953,138
2015 728,339
2016‐2020 2,019,887
2021‐2025 305,549
2026‐2030 108,274
2031‐2035 190,382
2036 and thereafter 168,635
GRAND TOTAL $10,720,435
Other Investment Income Total other investment income earned by the PERF in the 2009‐10 fiscal year is $93.0 million. This total consists of income from securities litigation, sale of fractional shares, other miscellaneous income earned across all other investment portfolios, amortization income earned in the fixed income portfolios, and a negative $0.5 million from the directed brokerage program.
Term Asset‐Backed Securities Loan Facility (TALF) CalPERS participated in two auctions of the Federal Reserve Bank of New York’s (the Fed’s) Term Asset‐Backed Loan Facilities Program (TALF). The Fed created the TALF to help market participants meet the credit needs of households and small businesses by supporting the issuance of certain asset‐backed securities and commercial mortgage‐backed securities. TALF loans are non‐recourse loans that are
collateralized by newly or recently originated securities that meet specific credit quality and other program requirements.
In March and May 2009, CalPERS borrowed $1.5 billion and $3.9 billion, respectively, through the TALF program. The proceeds of the TALF loans, along with $0.4 billion of CalPERS resources, known as the “6 percent haircut,” were used to purchase $5.8 billion in qualified asset‐backed securities (ABS), which serve as collateral for the loan. The TALF loans have a three‐year maturity and bear interest at the three‐year LIBOR swap rate plus 100 basis points. ABS collateral is held by the Fed’s custodian bank in CalPERS name. Interest earned on the ABS collateral is pledged toward the repayment of interest on the TALF loans. Upon the loan maturities, CalPERS may repay the loans or surrender the entire ABS collateral to the Fed in lieu of loan repayment. Prepayment, in full or in part, will result in the Fed’s release of a pro‐rata share of the ABS collateral.
As of June 30, 2010, the TALF loan balances are $611 million and $2.8 billion, respectively. The required monthly interest payment based on the June 30, 2010 LIBOR rate is $3.8 million. Future required interest payments can fluctuate depending on the LIBOR rate and the outstanding loan balance. 5. CONTRIBUTIONS & RESERVES Employer Contributions Actuarially Determined & Contributions Made
Employer contributions are calculated as a percentage of employer payrolls. OPEB plan employer contributions are voluntarily determined by the employer and there are no long‐term contracts for contributions. The payroll for employees covered by the PERF, JRF, and JRF II in 2009‐10 was approximately $44.0 billion, $89.2 million, and $207.7 million, respectively.
Actuarial Valuations Actuarial valuations are used to determine the cost of pension benefits payable to the members of CalPERS who participate in the PERF, the LRF, the JRF, and the JRF II as well as the related required contribution rates. The actuarial valuations include a number of significant assumptions, including the actuarial valuation method used, the asset valuation method, the rate of return on the investment portfolio, rate of inflation, projected salary increases,
CalPERS Comprehensive Annual Financial Report, Fiscal Year Ended June 30, 2010 | Financial Section | 61
Notes to the Basic Financial Statements (continued)Notes to the Basic Financial Statements (continued)
CalPERS Comprehensive Annual Financial Report, Fiscal Year Ended June 30, 2010 | Financial Section | 61
post‐retirement benefit increases, and the life expectancy of members and beneficiaries.
The actuarial cost method used for accounting purposes for the PERF, LRF, JRF and JRF II is the Individual Entry Age Normal cost method. The cost method used for funding LRF and JRF and for calculating the Annual Required Contribution is the Aggregate Actuarial Cost method. The CERBTF allows the use of either the Entry Age Normal or the Projected Unit Credit cost method for its participating plans. All these methods are projected benefit cost methods that take into account those benefits that are expected to be earned in the future, as well as those already accrued.
To amortize any unfunded actuarial liabilities, the PERF and the JRF II use the level percentage of payroll method. Employers participating in the CERBTF have the option of either using a level dollar or level percentage of payroll method to amortize their unfunded actuarial liabilities. Since LRF and JRF use the Aggregate Actuarial Cost method for calculating the Annual Required Contribution, the unfunded liability is not separately identified nor amortized.
The significant actuarial assumptions used to determine the 2009‐10 actuarially required contributions (ARC) were different than those used to compute the actuarial accrued liability as of June 30, 2009. In April 2010 the CalPERS Board approved new demographic actuarial assumptions for all plans for use in the June 30, 2009 actuarial valuations and beyond. The new assumptions predict longer life expectancy for males, higher pay raises for long‐term employees, and slightly earlier retirement ages for all plans except local safety members whose retirement ages are slightly later. The 2009 actuarial valuations were used to set the actuarially determined contribution requirements for different fiscal years. For the PERF, the 2009 actuarial valuations were used to set the actuarially determined contribution requirements for the 2010‐11 fiscal year for the State and School employers, while the 2009 valuations were used to set the actuarially determined contribution requirements for the 2011‐12 fiscal year for public agencies. For the JRF, JRF II and LRF, the 2009 actuarial valuations were used to set the actuarially determined contribution requirements for the 2010‐11 fiscal year. The CERBTF uses demographic assumptions similar to the pension plans with the addition of the Health Cost Trend Rate assumption.
In December 2009, the CalPERS Board adopted changes to the asset smoothing method as well as changes to the Board policy on the amortization of gains and losses in order to phase in over a three‐year period the impact of negative 24.0 percent investment returns experienced by CalPERS in fiscal year 2008‐09. The following changes were adopted for all plans: The corridor limits for the actuarial value of assets were increased from 80‐120 percent of market value to 60‐140 percent of market value on June 30, 2009.
The corridor limits for the actuarial value of asset will be reduced to 70‐130 percent of market value on June 30, 2010.
The corridor limits will return to 80‐120 percent of market value for the actuarial value of assets on June 30, 2011 and thereafter.
All gains and losses during the fiscal years 2008‐09, 2009‐10 and 2010‐11 will be isolated and amortized over fixed and declining 30‐year periods (as opposed to the current rolling 30‐year amortization). In addition, in February 2010, the CalPERS Board
adopted a resolution requiring additional contributions for any plan or pool in which cash flows would hamper adequate funding progress by preventing the expected funded status on a market value of assets basis of the plan to either: Increase by at least 15 percent by June 30, 2042 for state and schools, and 2043 for public agencies, or
Reach a level of 75 percent funded by June 30, 2042 for state and schools, and 2043 for public agencies.
Restrictions on Net Assets Available for Benefits Included in the Net Assets Held in Trust for Pension Benefits is a restricted reserve that, by law, is retained in the PERF and LRF as a reserve against deficiencies in interest earned, potential losses under investments, court‐mandated costs, and actuarial losses resulting from terminations, mergers, or dissolutions of contracting agencies. This reserve cannot exceed 0.2 percent of total assets of the PERF and the LRF, and totaled approximately $413.2 million and $231 thousand as of June 30, 2010, for the PERF and LRF, respectively.
62 | Financial Section | CalPERS Comprehensive Annual Financial Report, Fiscal Year Ended June 30, 2010
Notes to the Basic Financial Statements (continued)Notes to the Basic Financial Statements (continued)
62 | Financial Section | CalPERS Comprehensive Annual Financial Report, Fiscal Year Ended June 30, 2010
PERF Actuarial valuations of the PERF are performed annually. The last valuation was performed as of June 30, 2009, for the State, schools, and public agencies.
The total 2009‐10 net retirement contributions for the PERF amounted to approximately $10.3 billion, of which $6.9 billion (the actuarially determined annual required contribution) came from 1,605 employers and approximately $3.4 billion came from nearly 804,000 members. The contributions to the PERF were for the retirement program, the 1959 Survivor Program, and the Group Term Life Insurance Program. For the retirement program, the average employer normal cost is 10.730 percent of covered payroll, and amortization of the unfunded liabilities is 4.956 percent of covered payroll. These figures are averages for all employers. The actual figures vary by each employer’s plan.
LRF The current contribution requirements of the LRF are based on actuarially determined rates promulgated as part of legislation passed in 1977.
Actuarial valuations of the LRF are required to be carried out at least every two years. The Board of Administration utilizes these actuarial valuations to make recommendations to the State for financing the Fund. For the fiscal year ending June 30, 2010, there was no statutory contribution required based on the June 30, 2008 valuation.
JRF Contributions made by the State of California to the JRF are made pursuant to State statute and are not actuarially determined; however, an actuarial valuation of the JRF assets and liabilities is performed every year and is used by CalPERS to make recommendations for financing the JRF. The California law which states that on and after January 1, 2004, the JRF shall be funded and actuarially sound was amended in conjunction with the adoption of the Judges’ Retirement System II Law, which, among other provisions, eliminated the requirement that the JRF be funded and actuarially sound. Recommendations to achieve the necessary level of contributions have been submitted by the CalPERS Board to the Legislature.
As of June 30, 2010, funding was provided from the following sources to meet benefit payment requirements: Member Contributions — 8 percent of applicable member compensation;
Employer Contributions — 8 percent of applicable member compensation;
Filing Fees — Varying amounts depending on fee rate and number of filings;
Investments — Current yield on short‐term investments; State of California “Balancing Contributions” — An amount required by the Judges’ Retirement Law, at least equal to the estimated benefits payable during the ensuing fiscal year less the sum of 1) the estimated member contributions during the ensuing fiscal year and; 2) net assets available for benefits at the beginning of the fiscal year.
Under the “pay‐as‐you‐go” basis, short‐term
investments, as well as contributions received during the year and a State General Fund augmentation, are used to provide funding for benefit payments. This funding method is generally more expensive in the long term, as the fund does not have investment returns generated by a funded plan. Without the State General Fund augmentation, the JRF will not be able to pay the accumulated benefit payments due in 2011. Management and legal counsel believe the State of California is legally required to provide these required contributions to fund the benefits.
For the year ended June 30, 2010, the actual contributions made by the State to the JRF were approximately $185.4 million, which is significantly less than the actuarially determined annual required contribution of approximately $1.2 billion.
Because current contributions are used to make benefit payments, the fund does not retain the accumulated contributions of active members. The cumulative contributions for all currently active members since inception were approximately $169.2 million at June 30, 2010, which exceeded Net Assets Held in Trust for Pension Benefits by approximately $106.1 million at June 30, 2010.
JRF II Actuarial valuations for the JRF II are required to be carried out annually. The legislated State contribution rate will be adjusted periodically as part of the annual Budget Act in order to maintain or restore the actuarial soundness of the fund. The last actuarial valuation was performed as of June 30, 2009.
For the year ending June 30, 2010, the statutory employer contribution rate was 20.358 percent based on
CalPERS Comprehensive Annual Financial Report, Fiscal Year Ended June 30, 2010 | Financial Section | 63
Notes to the Basic Financial Statements (continued)Notes to the Basic Financial Statements (continued)
CalPERS Comprehensive Annual Financial Report, Fiscal Year Ended June 30, 2010 | Financial Section | 63
the June 30, 2008 actuarial valuation. Therefore, for the year ended June 30, 2010, the contributions made by the State to the fund were approximately $42.6 million, which is less than the actuarially determined required contributions of approximately $44.8 million.
CERBTF The actuarial valuations for the CERBTF are conducted by outside actuarial firms engaged by participating employers that must base their valuations on the CalPERS OPEB Assumption Model. This model requires the use of actuarial methods and assumptions similar to those employed for the PERF, except in addition to Entry Age Normal, the use of Projected Unit Credit is allowed. An additional assumption used for the CERBTF is the health care cost trend rate. The actuarial valuation estimates the cost of future health and other post‐employment benefit insurance premiums for current and retired participating employees. Employers with less than 100 plan members may use the alternative measurement method as permitted by GASB Statement No. 57.
The total 2009‐10 actual net OPEB employer contributions from 258 participating employers was $674.4 million, compared to the actuarially determined annual required contribution of 9.4 percent of covered payroll, or $870.8 million. This amount includes the $344.6 million in contributions made to the CERBTF, plus an additional $329.8 million in retiree health care premiums paid by employers directly to providers, implicit rate subsidies, and other GASB 45 compliant costs recognized by employers as contributions toward the ARC. CERBTF actuarial valuations are based upon plan benefits in effect at the time of the valuations, either defined by the employer or by the Public Employees Hospital Care Act (PEMHCA), for employers participating in that program. The projection of benefits for financial reporting purposes does not explicitly incorporate the potential effects of legal or contractual funding limitations on the pattern of future employer and employee cost sharing.
6. COMMITMENTS At June 30, 2010, CalPERS total capital commitments was $91.9 billion. Of this amount, $27.4 billion remained unfunded and is not recorded on the CalPERS Statement of Fiduciary Net Assets. The following table depicts the total
commitments and unfunded commitments, respectively, by asset class.
Total Commitments and Unfunded Commitments by Asset Class (Dollars in Thousands)
Total UnfundedAsset Class Commitments Commitments
Equity (Corporate Governance) $4,783,851 $628,799
Inflation Linked 3,047,700 477,196
Real Estate 26,485,283 7,362,493
Alternative Investments 57,597,443 18,968,387
TOTAL $91,914,277 $27,436,875 7. CONTINGENCIES CalPERS has entered into agreements with a number of issuers of non‐taxable debt to provide payment of principal and interest in the event of non‐payment. CalPERS is paid an annual fee over the term of the agreement for each transaction. The majority of the transactions are supported by collateral, letters of credit from banks or bond insurers for repayment. As of June 30, 2010, the credit enhancement program had contingent liabilities of approximately $1.9 billion and net fee income of approximately $11.0 million.
CalPERS is a defendant in litigation involving individual pension and health benefit payments and participant eligibility issues arising from its normal activities. In the event of an adverse decision, any payments awarded by the courts would be recovered by CalPERS through prospective adjustments to the employer contribution rate. Based upon consultation with legal counsel, management believes there will be no material adverse effect on the basic financial statements as a result of the ultimate outcome of these matters.
8. HEALTH CARE FUND Basis for Estimated Liabilities
The Public Employees’ Health Care Fund (HCF) establishes claim liabilities based on estimates of the ultimate costs of claims (including future claim adjustment expenses) that have been reported but not settled and of claims that have been “incurred but not reported” (IBNR). The estimated claims liability was calculated by Blue Cross, the HCF’s third‐party administrator, at June 30, 2010, using a variety of actuarial and statistical techniques and adjusted for actual
64 | Financial Section | CalPERS Comprehensive Annual Financial Report, Fiscal Year Ended June 30, 2010
Notes to the Basic Financial Statements (continued)Notes to the Basic Financial Statements (continued)
64 | Financial Section | CalPERS Comprehensive Annual Financial Report, Fiscal Year Ended June 30, 2010
experience to produce current estimates that reflect recent settlements, claim frequency, and other economic and social factors. Adjustments to claims liabilities are charged or credited to expense in the periods in which they are made. The estimated claims liability of $192.2 million is carried at its face amount, and no interest discount is assumed. The IBNR portion represents an estimate for claims that have been incurred prior to June 30, 2010, but have not been reported to the HCF.
Anticipated Investment Income and Reinsurance Anticipated investment income is not included in the annual premium requirement for HCF members. Also, the HCF has not entered into any reinsurance or excess insurance agreements.
The following represents changes in the aggregate estimated claims liabilities of the HCF for the years ended June 30, 2010 and 2009.
Changes in the Aggregate Estimated Claims Liabilities of the HCF for PERSCare, PERS Choice and PERS Select (Dollars in Thousands)
For the Year Ending June 30 2010 2009
TOTAL ESTIMATED CLAIMS AT
BEGINNING OF FISCAL YEAR $216,584 $188,048
INCURRED CLAIMS & CLAIM
ADJUSTMENT EXPENSES
Provision for Insured Events
of Current Fiscal Year $1,654,214 $1,530,264
Decrease in Provision for
Insured Events of Prior Years (99,640) (76,117)
Total Incurred Claims &
Claim Adjustment Expenses $1,554,574 $1,454,147
PAYMENTS
Claims & Claim Adjustment Expenses
Attributable to Insured Events of
Current Fiscal Year $1,444,509 $1,306,227
Claims & Claim Adjustment Expenses
Attributable to Insured Events of
Prior Fiscal Year 134,454 119,384
Total Payments $1,578,963 $1,425,611
TOTAL ESTIMATED CLAIMS AT END OF FISCAL YEAR $192,195 $216,584
9. LONG‐TERM CARE FUND The Public Employees’ Long‐Term Care Fund (LTCF) estimate of the funding level to provide for the payment of future claim benefits is predicated upon participation levels that are expected to be achieved by the program. The premiums from the LTCF are recognized during the period covered.
The LTCF establishes the liability for future policy benefits based on the present value of future benefits and expenses less the present value of future premiums. The liability for future policy benefits was calculated by the fund’s actuary, using a variety of actuarial and statistical techniques as part of their actuarial review as of June 30, 2010. The actuarial valuations are very sensitive to the underlying actuarial assumptions, including a discount rate of 6.38 percent (the average rate of assumed investment yields in effect for the current year), morbidity, disability continuance, mortality, voluntary termination, and claims expense. The total estimated liability for future policy benefits as of June 30, 2010, was $2.7 billion. Of that amount, $151.7 million is expected to be paid in the 2010‐11 fiscal year and is included in current liabilities.
The following represents changes in the aggregate estimated claims liabilities of the LTCF for the years ended June 30, 2010 and 2009.
Changes in the Aggregate Estimated Claims Liabilities of the LTCF (Dollars in Thousands)
For the Year Ending June 30 2010 2009Total Estimated Liability at the Beginning of Fiscal Year $2,899,800 $2,430,000
Incurred Claims and Adjustments (76,292) 584,268
Claims Paid ($131,908) ($114,468)TOTAL ESTIMATED LIABILITY AT THE END OF FISCAL YEAR $2,691,600 $2,899,800
Long‐Term Care Program
CalPERS Comprehensive Annual Financial Report, Fiscal Year Ended June 30, 2010 | Financial Section | 65
Notes to the Basic Financial Statements (continued)Notes to the Basic Financial Statements (continued)
CalPERS Comprehensive Annual Financial Report, Fiscal Year Ended June 30, 2010 | Financial Section | 65
10. PERF, LRF, JRF, JRF II, AND CERBTF FUNDED STATUS The following represents the funded status of the CalPERS pension trust funds and the post‐employment health care fund as of June 30, 2009. These actuarial valuations involve estimates of the value and probability assumptions of events far into the future, and these amounts and assumptions are subject to continual revision as actual results are compared to past expectations. Calculations are based on the benefits provided under the terms of the plan in effect and the pattern of cost sharing between employees and the employer. The projection of benefits does not explicitly
incorporate the potential effects of legal or contractual funding limitations on the pattern of cost sharing. These actuarial calculations reflect long‐term perspectives and use techniques that are designed to reduce short‐term volatility.
Fiscal year 2008‐09 investment losses have been recognized in the unfunded actuarial accrued liability (UAAL) of the PERF in accordance with actuarial methods adopted by the Board. The PERF’s UAAL as of June 30, 2009 does not reflect the impact of deferred investment losses, which may negatively impact the PERF’s future funded status unless those losses are offset by future investment gains or other favorable experience.
Funded Status1 of the PERF, LRF, JRF, JRF II, and CERBTF (Dollars in Millions)
Actuarial Unfunded AAL Annual UAAL as a %Actuarial Actuarial Value Accrued Liability (UAAL) ‐ (Funding Funded Covered of Covered
Fund Valuation Date of Assets (AAL) ‐ Entry Age Excess) Ratio Payroll Payroll
CERBTF 6/30/09 2 873 10,462 9,589 8.3 9,307 103.0 Notes: 1 The Schedule of Funding Progress immediately following the notes to the financial statements presents multi‐year trend information about whether the actuarial value of plan assets is increasing or decreasing relative to the actuarial accrued liability for benefits over time.
2 The amounts reported as of June 30, 2009 represent the individual actuarial valuations of 258 employers participating in the CERBTF as of June 30, 2010, aligned to a measurement date of June 30, 2009 in compliance with GASB Statement No. 57. The CERBT program adopted the reporting changes required by
GASB Statement No. 57 for the fiscal year ended June 30, 2010. CalPERS projected the data as of June 30, 2009 in the table above by rolling forward or backward the actuarial data contained in OPEB valuations and Alternative Measurement Method (AMM) reports prepared by participating employers as of varying valuation dates. The alignment was achieved by applying methods allowed under Actuarial Standards of Practice and under Generally Accepted Accounting Principles.
3 The actuarial accrued liability of the LRF reflects the impact of a legal settlement involving past due payments of $7.6 million.
66 | Financial Section | CalPERS Comprehensive Annual Financial Report, Fiscal Year Ended June 30, 2010
Notes to the Basic Financial Statements (continued)Notes to the Basic Financial Statements (continued)
66 | Financial Section | CalPERS Comprehensive Annual Financial Report, Fiscal Year Ended June 30, 2010
Actuarial Information | Assumptions and Methods Used in the Most Recent Actuarial Valuations
PERF LRF JRF JRF II CERBTFFunded Status Valuation Date June 30, 2009 June 30, 2009 June 30, 2009 June 30, 2009 June 30, 2009 5
Adoption Date Various Various Various Various —Actuarial Cost Method
Individual Entry Age Normal Cost
Individual Entry Age Normal Cost
4 Individual Entry Age Normal Cost
4 Individual Entry Age Normal Cost
Entry Age Normal or Projected Unit Credit
Amortization Method
Level Percentage of Payroll None 2 None 2 Level Percentage of Payroll
Varies 5
Amortization Approach
Closed (Open for Gains and Losses except
FY's 2008/09 through 2010/11)
None 2 None 2 Closed Varies 5
Remaining Amortization Period
Not Available 3 None 2 None 2 26 years Varies 5
Asset Valuation Method
Smoothing of Market Value, Temporary Increase in 20%
Market Value Corridor to 40% for 6/30/2009 valuation 30% in
6/30/2010 valuation.
Smoothing of Market Value
Market Value Smoothing of Market Value
Varies 5
ACTUARIAL ASSUMPTIONS
Net Investment Rate of Return
7.75% 7.00% 4.50% 7.25% 7.75%
Projected Salary
Increases1Varies, based on
duration of service
3.25% 3.25% 3.25% 3.25%
Post Retirement Benefit Increase
For State and Schools, 2% or 3% compounded annually
For Public Agencies, 2% to 5% compounded annually,
depending on the agency plan provisions
3.00% 3.25% 3.00% —
HEALTH CARE COST TREND RATES:
Select Period — — — — 0 – 10 Years
Initial Rate — — — — 4.00 – 12.00%
Ultimate Rate — — — — 4.00 – 6.00%
Notes: 1 Includes inflation at 3.0 percent for all funds. 2 The Aggregate Cost Method does not identify or separately amortize unfunded actuarial liabilities.
3 Calculations not yet completed for June 30, 2009 valuations. 4 For funding purposes and the calculation of annual required contributions, the Aggregate Cost Method is used.
5 The CERBTF schedule of funded status was based on 258 individual actuarial valuations and Alternative Measurement
Method (AMM) reports aligned to June 30, 2009, using both closed and open amortization methods and with most valuations using the current market value of assets and a few smoothing the market value of assets. For the vast majority of the valuations, the unfunded liability is amortized over 30 years, and the remainder use periods range between 1 year and 29 years.
CalPERS Comprehensive Annual Financial Report, Fiscal Year Ended June 30, 2010 | Financial Section | 67
Notes to the Basic Financial Statements (continued)Notes to the Basic Financial Statements (continued)
CalPERS Comprehensive Annual Financial Report, Fiscal Year Ended June 30, 2010 | Financial Section | 67
Actuarial Information | Assumptions and Methods Used in the Most Recent Actuarial Valuations
PERF LRF JRF JRF II CERBTF
ARC Valuation Date
June 30, 2008: State and Schools
June 30, 2007: Public Agencies June 30, 2008 June 30, 2008 June 30, 2008 June 30, 2009 3
Adoption Date Various Various Various Various —Actuarial Cost Method
Individual Entry Age Normal Cost
Modified Aggregate Cost
Aggregate Cost Aggregate Entry Age Normal
Entry Age Normal or Projected Unit Credit
Amortization Method
Level Percentage of Payroll None 2 None 2 Level Percentage of Increasing Payroll
Varies 3
Amortization Approach Closed
(Open for Gains and Losses)
None 2 None 2 Closed Varies 3
Remaining Amortization Period
27 Years for Schools, average of 20 years for Public Agencies,
and 21 to 28 years for the State plans
None 2 None 2 Average of 30 years Varies 3
Asset Valuation Method
Smoothing of Market Value, 20% Corridor
Smoothing of Market Value, 20% Corridor
Market Value Smoothing of Market Value
Varies 3
ACTUARIAL ASSUMPTIONS
Net Investment Rate of Return
7.75% 7.00% 4.50% 7.25% 7.75%
Projected Salary
Increases1Varies, based on
duration of service
3.25% 3.25% 3.25% 3.25%
Post Retirement Benefit Increase
For State and Schools, 2% or 3% compounded annually
For Public Agencies, 2% to 5% compounded
annually, depending on the agency
plan provisions
3.00% 3.25% 3.00% —
HEALTH CARE COST TREND RATES:
Select Period — — — — 0 – 10 Years
Initial Rate — — — — 4.00 – 12.00%
Ultimate Rate — — — — 4.00 – 6.00% Notes: 1 Includes inflation at 3.0 percent for all funds. 2 The Aggregate Cost Method does not identify or separately amortize unfunded actuarial liabilities.
3 The CERBTF schedule of funded status was based on 258 individual actuarial valuations and Alternative Measurement Method (AMM) reports aligned to June 30, 2009, using both closed and open amortization methods and with most valuations using the current market value of assets and a few smoothing the market value of assets. For the vast majority of the valuations, the unfunded liability is amortized over
30 years, and the remainder use periods range between 1 year and 29 years.
68 | Financial Section | CalPERS Comprehensive Annual Financial Report, Fiscal Year Ended June 30, 2010
70 | Financial Section | CalPERS Comprehensive Annual Financial Report, Fiscal Year Ended June 30, 2010
ScheduleofFundingProgress—PensionTrustandOPEBFunds(Unaudited)Schedule of Funding Progress — Pension Trust and OPEB Funds (Unaudited)
70 | Financial Section | CalPERS Comprehensive Annual Financial Report, Fiscal Year Ended June 30, 2010
(Dollars in Millions)
Actuarial Actuarial Accrued Unfunded AAL (UAAL) Funded Ratio – Actuarial Valuation Date Actuarial Value of Assets Liability (AAL) – Entry Age (Funding Excess) Value of Assets Basis8
(1) (2) (2) ‐ (1) (1) ÷ (2)PERF
6/30/04 $169,899 $194,609 $24,710 87.3%
6/30/05 183,680 210,301 26,621 87.3%
6/30/06 199,033 228,131 29,098 87.2%
6/30/07 216,484 248,224 31,740 87.2%
6/30/08 233,272 268,324 35,052 86.9%
6/30/09 244,964 294,042 49,078 3 83.3%
LRF 4
6/30/07 $142 $102 ($40) 139.2%
6/30/08 142 103 (39) 137.9%
6/30/09 134 112 (22) 119.6%
JRF 4,5
6/30/07 $12 $2,714 $2,702 0.4%
6/30/08 19 3,607 3,588 0.5%
6/30/09 41 3,583 3,542 1.1%
JRF II
6/30/04 $129 $138 $9 93.5%
6/30/05 168 178 10 94.4%
6/30/06 213 220 7 96.8%
6/30/07 268 295 27 90.8%
6/30/08 335 367 32 91.3%
6/30/09 379 451 72 84.0%
CERBTF 6
6/30/07 $11 $24 $13 45.8%
6/30/08 48 4,845 4,797 1.0%
6/30/09 7 873 10,462 9,589 8.3% Notes: 1 The market value of assets is used in the June 30, 2009 actuarial valuations and is different from the fair value of assets as described in the footnote 1 to the Supplemental Schedule of Differences in the Actuarial Section.
2 The funded status on a market value of assets basis is reported since it represents the true measure of the plan’s ability to pay benefits at a given point in time. The actuarial value of assets is used only for purposes of setting the employer contribution rates and keeping them as smooth as possible from year to year. The unfunded liability and funded status on an actuarial value of assets basis represent the unfunded liability/(surplus) that was taken into account when establishing employer rates.
3 The Unfunded Actuarial Accrued Liability (the total Actuarial Liability in excess of Actuarial Value of Assets) of the PERF by major employer group from the June 30, 2009 valuation is as follows: 1) $23,483 for the State of California, 2) $5,777 for schools, and 3) $19,818 for public agencies.
4 LRF and JRF are funded using the Aggregate Actuarial Cost Method. The Aggregate Cost Method does not identify actuarial accrued liabilities and funded ratios. For this reason, no funding progress information is available for either the LRF or JRF prior to June 30, 2007. Beginning with the June 30, 2007 actuarial valuation, CalPERS is complying with GASB Statement 50, which
requires the funding progress to be disclosed using the Entry Age Actuarial Cost Method.
5 The actuarial assumption for the investment rate of return was reduced from 7.0 percent in the June 30, 2007 valuation to 4.5 percent in the June 30, 2008 valuation to reflect the funding of the JRF on a pay‐as‐you‐go basis.
6 Only three years of funding progress information is shown because the CERBTF did not exist prior to the 2006‐07 fiscal year.
7 The amounts previously reported as of June 30, 2009 in the fiscal year 2008‐09 financial statements were revised to reflect the valuation results for new plan participants and to align the valuation dates of all plan participants. The revised data reflects the individual actuarial valuations of 258 employers participating in the CERBTF as of June 30, 2010, aligned to a measurement date of June 30, 2009 in compliance with GASB Statement 57.
8 In April 2010 the CalPERS Board approved new demographic actuarial assumptions for all plans for use in the June 30, 2009 actuarial valuations and beyond. The new assumptions predict longer life expectancy for males, higher pay raises for long‐term employees, and slightly earlier retirement ages for all plans except local safety members whose retirement ages are slightly later.
CalPERS Comprehensive Annual Financial Report, Fiscal Year Ended June 30, 2010 | Financial Section | 71
Schedule of Funding Progress – Pension Trust and OPEB Funds (Unaudited) (continued)
Schedule of Funding Progress – Pension Trust and OPEB Funds (Unaudited) (continued)
Financial Section | CalPERS Comprehensive Annual Financial Report, Fiscal Year Ended June 30, 2010 | 71
UAAL as a % of Market Value1 Funded Ratio – MarketAnnual Covered Payroll Covered Payroll of Assets Value of Assets Basis2
(3) [(2) ‐ (1)] ÷ (3) (4) (4) ÷ (2)
$35,078 70.4% $167,110 85.9%
36,045 73.9% 189,103 89.9%
38,047 76.5% 211,188 92.6%
40,864 77.7% 251,162 101.2%
44,236 79.2% 238,041 88.7%
45,100 108.8% 178,860 60.8%
$2 ‐2000.0% $142 139.2%
2 ‐1950.0% 134 130.1%
2 ‐1100.0% 112 100.0%
$119 2270.6% $12 0.4%
111 3232.4% 19 0.5%
97 3651.5% 41 1.1%
$99 9.1% $129 93.5%
112 8.9% 172 96.6%
125 5.6% 219 99.5%
156 17.3% 291 98.6%
175 18.3% 325 88.6%
199 36.2% 316 70.1%
$37 35.1% $11 45.8%
5,092 94.2% 48 1.0%
9,307 103.0% 845 8.1% The changes in actuarial assumptions will increase State contributions by approximately 1.0 percent to 2.4 percent and school employer contributions by approximately 0.42 percent in fiscal year 2010‐11. The impact of changes in actuarial assumptions varies by plan for public agency employers. In December 2009, the CalPERS Board adopted changes to the asset smoothing method as well as changes to the Board policy on the amortization of gains and losses in order to phase in over a three‐year period the impact of negative 24 percent investment returns experienced by CalPERS in fiscal year 2008‐09. The following changes were adopted for all plans: The corridor limits for the actuarial value of assets were increased from 80‐120 percent of market value to 60‐140 percent of market value on June 30, 2009.
The corridor limits for the actuarial value of asset will be reduced to 70‐130 percent of market value on June 30, 2010.
The corridor limits will return to 80‐120 percent of market value for the actuarial value of assets on June 30, 2011 and thereafter.
All gains and losses during the fiscal years 2008‐09, 2009‐10 and 2010‐11 will be isolated and amortized over fixed and declining 30‐year periods (as opposed to the current rolling 30‐year amortization).
The new smoothing methods adopted by the Board have mitigated the impact of fiscal year 2008‐09 investment losses.
In addition, in February 2010, the CalPERS Board adopted a resolution requiring additional contributions for any plan or pool in which cash flows would hamper adequate funding progress by preventing the expected funded status on a market value of assets basis of the plan to either: Increase by at least 15 percent by June 30, 2043, or Reach a level of 75 percent funded by June 30, 2043 As a result of the additional contribution criteria adopted by the Board, additional State contributions are expected to be required in fiscal year 2010‐11. The actuarial cost method for the JRF II was changed to Individual Entry Age Normal in the June 30, 2009 valuation from the Aggregate Entry Age Normal method used in prior valuations.
72 | Financial Section | CalPERS Comprehensive Annual Financial Report, Fiscal Year Ended June 30, 2010
ScheduleofEmployerContributions–PensionTrustFunds(Unaudited)Schedule of Employer Contributions – Pension Trust Funds (Unaudited)
72 | Financial Section | CalPERS Comprehensive Annual Financial Report, Fiscal Year Ended June 30, 2010
% of Required % of RequiredYear Ended Annual Required Contributions Annual Required ContributionsJune 30 Contribution Made Contribution Made
Notes: 1 The 2008 actuarial valuation was used to set the fiscal year 2009‐10 PERF Annual Required Contributions for the State and Schools. The 2007 actuarial valuations were used to set the fiscal year 2009‐10 Annual Required Contributions for Public Agencies.
2 Based on the June 30, 2008, 2007, 2006, 2005, 2004, and 2003 actuarial valuations, the annual required contributions for the years ended June 30, 2010, 2009, 2008, 2007, 2006, and 2005 were $0.
% of Required % of Required % of RequiredYear Ended Annual Required Contributions Annual Required Contributions Annual Required ContributionsJune 30 Contribution Made Contribution Made Contribution Made 3
Notes: 1 Prior to fiscal year 2007 a variation of the Aggregate Cost Method was used to determine the ARC. Effective fiscal year 2007 the Traditional Aggregate Cost Method was used to determine ARC.
2 The 2007‐08, 2008‐09, and 2009‐10 contributions made toward the ARC excludes $48.9 million, $10.4 million, and $4.4 million respectively, that were contributed to the CERBTF, but were treated as pre‐existing assets for purposes of calculating the ARC.
3 Beginning with fiscal year 2007‐08, the required contributions made include retiree health premiums paid directly to health carriers, OPEB related administrative costs paid outside the CERBTF, and implicit rate subsidy.
4 The 2008 valuation was used to determine the 2009‐10 Annual Required Contributions for the JRF and JRFII.
CalPERS Comprehensive Annual Financial Report, Fiscal Year Ended June 30, 2010 | Financial Section | 73
ScheduleofClaimsDevelopmentInformation(Unaudited)Schedule of Claims Development Information (Unaudited)
Financial Section | CalPERS Comprehensive Annual Financial Report, Fiscal Year Ended June 30, 2010 | 73
The table on the next page presents the Health Care Fund’s (HCF) earned revenues and investment income as well as losses and other expenses over the last 10 years. Rows one through six contain the following information:
1. This line shows the total earned premium revenues and investment revenues for each fiscal year.
2. This line shows other HCF operating costs, including overhead and claims expense not allocable to individual claims, for each fiscal year.
3. This line shows the HCF’s incurred claims and allocated claim adjustment expenses (both paid and accrued) as reported at the end of the policy year. The policy year is the first year in which the triggering event under the contract occurred.
4. This section shows the cumulative amounts paid as of the end of each policy year and years succeeding the policy year.
5. This section shows re‐estimated incurred claims as of the end of each policy year and years succeeding the policy year. Re‐estimates are based on new information received on known claims, as well as information on new claims not previously reported.
6. This line compares the amount of the re‐estimated incurred claims to the amount initially established (line 3), and shows whether the re‐estimate is greater or less than projected. As data mature for individual policy years, the correlation between initial estimates and re‐estimates is used to evaluate the accuracy of incurred claims currently recognized.
74 | Financial Section | CalPERS Comprehensive Annual Financial Report, Fiscal Year Ended June 30, 2010
Schedule of Claims Development Information (Unaudited) (continued)Required Supplemental Schedule of Claims Development Information (continued)
74 | Financial Section | CalPERS Comprehensive Annual Financial Report, Fiscal Year Ended June 30, 2010
Public Employees’ Health Care Fund — June 30, 2010 (Dollars in Thousands)
Apollo Real Estate Investment Fund V, LP 34,832 1,011
ARA Asia Dragon, Ltd. 290,934 7,500
Bridge Urban Infill 34,062 339
Buchanan II 94,461 2,985
CAL Special Urban Housing 81,984 5,799
CalEast LaSalle 1,827,206 12,400
California Smart Growth Fund IV 33,325 737
CalSmart, LLC 189,761 2,265
CalWest RREEF 234,035 1,744
Canyon Johnson Urban Fund III, LP 5,026 4,219
Capmark Structured Real Estate Partners 14,068 906
Capri Urban Capital I, LLC 55,338 1,967CB Richard Ellis Strategic Partners Europe Fund III, US 57,029 914CB Richard Ellis Strategic Partners UK Fund III, TE 23,915 899CB Richard Ellis Strategic Partners, UK II (7,259) 966
CIM CA Urban Real Estate 420,543 3,125
CIM Core Urban REIT, LLC 397,760 4,146
CIM Fund III 90,909 7,389
Cityview America Fund I, LLC 69,314 4,153
Cityview LA Urban Fund I, LP 2,531 625
CUIP (SCG) (23,050) 167
CWP — Bishop Square (623) 634
DB International Fund 1A 1,264 (31)
DB International Fund 1B 30,616 123
Fifth St. Properties CWP 46,849 3,646
Fillmore East Fund 1,207 (164)
Fortress Holiday 62,109 577
Fortress Investment Fund Deutschland, LP 43,898 885
Fortress Investment Fund IV 74,864 576
Fortress RIC Coinvestment Fund 10,270 84
GI Partners Fund II 530,573 4,963
GI Partners Fund III 66,996 4,195
Global Innovation Partners 126,564 233
Global Retail Investors 394,607 3,912
Guggenheim Structured III 58,857 521
Net AssetsManaged atFair Value Fees
Hampshire Companies $21,185 $360
Harbert European Real Estate Fund II, LP 54,646 988
Hearthstone Housing Partners II, LLC 131,865 1,414
Hearthstone Housing Partners III, LLC 28,679 292
Hearthstone MS II (1,040) 3
Hearthstone MS III (5,799) 14
Hines CalPERS Brazil Fund 55,669 429
Hines CalPERS Brazil Fund II 128,685 831
Hines CalPERS China Fund 2,568 864
Hines CalPERS Green 187,560 2,725
Hines CalPERS Mexico Fund II (46,374) 630
Hines European Development Fund (9,016) 321
Hines European Development Fund II (28,101) 322Hines Mexico Development Fund (HCM Holdings) 95,135 520
Hines Residential Sunbelt Spain Fund 3,197 (2,128)
Hollywood Park CoInvestment (Stockbridge) 101,648 735
IHP Fund II LP A+D 22,853 231
IHP Investment Fund III 382,054 7,632
IL & FS India Realty Fund II 106,037 2,500
IL & FS India Realty Fund, LLC 143,837 1,500
Institutional Housing Partners, LP 176,411 803
Institutional Mall Investors 1,570,651 9,558
Integral Urban Fund I, LP 4,003 576
IXIS AEW (European Property Investors) 34,306 815
JER Europe Fund III 13,881 166
JER Latin America Fund I — 500
JER US Debt Co‐Investment 93,377 1,579
Johnson Macfarland Partners — 2,091
Karec CA Development Program, LLC 189,143 1,296
Kennedy Wilson Property Fund II, LP 36,722 781
KSC Affordable Housing 26,827 641
LaSalle Asia Opportunity Fund III 22,805 2,651
LaSalle French Fund II, G.P., LLC 39,902 996
LaSalle Japan Logistics II 5,756 928
Lowe Resort Community Fund, LLC 1,620 18
Market Street Capital Partners, LP 58,425 1,019
Meriwether Farms, LLC 40,776 860
MGP Asia Fund II 73,285 1,028
MGP Europe Parellel Fund II 54,511 1,061
MW Housing Partners III, LP — (10,341)
National Office Partners 575,101 3,739
Newland National Partners, LP 262,643 6,441
Next Block Medical 41,910 1,250
80 | Financial Section | CalPERS Comprehensive Annual Financial Report, Fiscal Year Ended June 30, 2010
82 | Financial Section | CalPERS Comprehensive Annual Financial Report, Fiscal Year Ended June 30, 2010
Other Investment Consultants (continued) (Dollars in Thousands)
Consultant Fees (continued) Fees
Standard & Poor's Corporation, LOC No. 2 $78Stanfield Systems, Inc. 559Strategic Economic Decisions, Inc. 15Thomson Financial/Nelson‐Datastream 75Thomson Reuters Markets, LLC 1Trinity Technology Group, Inc. 8TSX Group 4VELAH Group 10Wendy Alexander 4Wiley Price & Radulovich, LLP 2Wilshire Associates, Inc. 2,226Yardeni Research, Inc. 30Yardi Systems, Inc. 30Zeno Consulting Group 40Zephyr Associates, Inc. 43Total Consultant Fees $42,145
Attorneys and Master Custodian (Dollars in Thousands) Fees
Mckinsey & Company, Inc. 572 Strategic Management & Business Consulting Services
Medstat Group 1,162 Health Care Decision Support Consulting Services
Mercer Health and Benefits 288 Actuarial Consulting for Health Program
Metavista Consulting Group 88 Enterprise Transition Management (ETM) Analyst for Project Transition Management
Michael Strategic Analysis 16 Surveys & Other Services
Milliman, Inc. 257 Consulting Services for Healthcare Management
Mindstorm 57 Video & Web Design Services
Moore Wallace Business Communications Services 500 Open Enrollment Processing Services
National Data Services 183 Vendor Services
Nexlevel Information Technology, Inc. 11 Management Support Services for Public Employer Readiness Team (PERT) Planning & Project Management Operation Support
North Highland Company 1,220 Enterprise Transition Management (ETM) Organizational Change/Organizational Design
Oce North America, Inc. 130 Acceptance Testing & Producer/Reprint Installation
Office Workouts 80 Fitness Instruction & Program
Ogilvy Public Relations 135 Media Training
Other 134
Pacific Business Group on Health 31 Internet‐Based Health Plan Chooser Tool; Management & Maintanance Services
Pacific Satelite Connection, Inc. 33 Video Production
Parent Video Production Pool ‐ PAOF 287 Parent Account
Pasanna Consulting Group, LLC 142 Consulting Services for My/CalPERS Integration
Peters Shorthand Reporting Corporation 38 Transcripts Service
PM/CM Services, Inc. 150 Construction Project Management Services
CalPERS Comprehensive Annual Financial Report, Fiscal Year Ended June 30, 2010 | Financial Section | 85
Consultant and Professional Services Expenses — PERF (continued)Consultant and Professional Services Expenses — PERF (continued)
CalPERS Comprehensive Annual Financial Report, Fiscal Year Ended June 30, 2010 | Financial Section | 85
(Dollars in Thousands)
Individual or Firm Fees Nature of Service
Princeton Solutions Group, Inc. $194 Enterprise Technical Architecture/Infrastructure Services
Propoint Technology, Inc. 101 Automated Real Estate Investment System (AREIS) Project & Internal Equity Portfolio Construction (LEPC) Project Management Services
Prosci 28 Change Management Training
Public Sector Consultants, Inc. 165 Business Process Re‐Engineering
R & G Associates 163 (ETM) Project Business Communication & Change Management Support Consulting Services
Regents of the University of California 234 Training Courses
Results Group 98
Consulting Services for Organizational & Leadership Development; Strategic & Operational Business Planning; Performance Management & Program Evaluation & Management Analysis
Runyon, Saltzman & Einhorn, Inc. 11 Media Training
Russbo, Inc. 146 Consulting Services for Enterprise Privacy & Security Office
Saba Software, Inc. 39 Saba Learning Management System
Saber Software, Inc. 194 Corporate Oracle Database Services
Sapphire Technologies, Inc. 203 FSIP Oracle Database Services
Sas International, Inc. 591 Application Server Administration Services
Segula Technologies 467 FSIP PeopleSoft Financials System Administration/Security Support
Senn‐Delaney Leadership 547 Strategic Planning, Training & Culture‐Shaping to Support PSR Implementation Process
Shooting Star Solutions, LLC 859 Risk Assessment & Management Plan (RAMP) Assistance to the Information Security Office
Sign Language Interpreting Service Agency 49 Interpreting Services
Softsol Resources, Inc. 1,685 Pension System Resumption (PSR) Project Architecture ‐ Technical, Stress, Load, & Performance Test
Software Ag, Inc. 50 Agreement for Professional Services
Sophus Consulting 95 Legal Office Case Document Management System Replacement Project
LIABILITIESPremiums Due to Carriers: Active $3,412 $1,418,635 $1,422,047 $0 Retired 999 354,164 351,786 3,377Health Premium Claims Filed: Active — 1,400,635 1,280,510 120,125 Retired — 318,271 290,417 27,854Due to HCF: Active 36,205 374,520 372,546 38,179 Retired 18,502 202,018 199,266 21,254Due to Public Agency: Active 20,764 15,378 20,764 15,378 Retired 6,557 1,241 6,557 1,241TOTAL LIABILITIES $86,439 $4,084,862 $3,943,893 $227,408
BalanceJune 30, 2009 Additions Deductions
BalanceJune 30, 2010
ASSETSCash Held by State Treasurer $5,724 $0 $33 $5,691TOTAL ASSETS $5,724 $0 $33 $5,691
LIABILITIESDue to State of California General Fund $20 $0 $0 $20Due to Public Agencies 5,670 — 163 5,507Due to Other Funds 34 164 34 164TOTAL LIABILITIES $5,724 $164 $197 $5,691
88 | Investment Section | CalPERS Comprehensive Annual Financial Report, Fiscal Year Ended June 30, 2010
We believe proxy access will hold corporate boards more accountable and help restore investor confidence in the capital markets.
For the first time in the history of our Corporate Governance program we did not publish a Focus List. This decision came after 14 of the 15 identified companies improved their performance and governance practices. A Wilshire Associates study validated the long-term success of the Focus List by showing that our engagement efforts significantly contributed to superior financial results.
Though California faces many economic challenges, we continue to prudently invest significant capital in our home state. As the fiscal year closed, we had approximately $21 billion invested or committed to businesses in California. In addition, we have devoted considerable effort to support our corporate board member diversity and emerging manager initiatives.
Finally, we bolstered our placement agent disclosure requirements and created a website to accept proposals from investment managers interested in managing assets from CalPERS. The CalPERS Board and Investment Office Staff also reviewed our approach on capital alloca-tion and capital market assumptions in preparation for further policy discussions in the next fiscal year.
In the upcoming fiscal year we will finalize the procurement for master custodian services, strengthen our internal systems and operational processes, and continue to bolster our risk management framework.
Our Investment Office staff, pension consultant Wilshire Associates, and State Street Bank & Trust, our master custodian, compiled the investment data presented on the next pages as required by the Public Employees’ Retirement Law. We remain committed to provide our members, beneficiaries and employers with superior risk-adjusted returns to support their long-term financial needs.
Joseph A. DearChief Investment Officer
On behalf of CalPERS Investment Office, I am pleased to report on CalPERS investment performance, operations, and initiatives for the one-year period ending on June 30, 2010. The CalPERS Fund earned a net 13.3 percent return this fiscal year, a strong rebound that saw the market value of our portfolio climb to $200.5 billion. Overall, the fund outperformed its benchmark by 0.37 percent. These results were driven by positive returns in all asset classes with the exception of global real estate, a sector still suffering from the worldwide economic downturn.
Specifically, our total Global Equity portfolio increased 14.42 percent. Global Fixed Income grew by 20.35 percent, and the Alternative Investment Management Program (private equity) was up 23.88 percent. Commodities, infrastructure, forestland, and inflation-linked bonds grew a combined 8.70 percent. CalPERS real estate values declined by 10.76 percent as we continued to experience a tough climate for housing and commercial properties. To address this, we are restructuring the real estate portfolio, focusing on income-generating properties and reducing leverage ratios.
We successfully led and completed numerous initia-tives this fiscal year, including management fee reductions, financial market reform, and a total fund risk assessment. The Investment Office negotiated with our external managers to better align our interests and decrease their fees. In fiscal year 2009-10 we reduced management fees approximately $100 million that will accrue over the next several years and anticipate additional fee reductions in fiscal year 2010-11.
CalPERS strongly advocated for the creation of the Dodd-Frank Wall Street Reform and Consumer Protection Act, which was ratified this year. This legislation represents a historic advancement in financial market reform and authorizes the Securities and Exchange Commission to implement proxy access, a longtime CalPERS goal.
June 30, 2010
The Board of Administration of the California Public Employees’ Retirement System
ChiefInvestmentOfficer’sLetter
CalPERS Comprehensive Annual Financial Report, Fiscal Year Ended June 30, 2010 | Investment Section | 89
as part of Total Investments, which is not included here. The Summary of Investments also includes Net Investment Receivables/Payables that are not reported on page 34 in Total Investments.
REal EStatE PRogRamSCore Domestic Real Estate $8,071,838,293 $6,199,887,034 3.04%Non-Core Domestic Real Estate 11,079,025,457 6,413,758,662 3.15 International Real Estate 2,727,263,041 2,537,434,251 1.25total REal EStatE PRogRamS $21,878,126,791
$15,151,079,947
7.44 %
ToTal InvesTmenT value $198,684,528,838 $203,753,320,663 100.00%
SummaryofInvestments–PERF(As of June 30, 2010)
note: Differences between Total Investment Value in the Summary of Investments and Total Investments shown on page 34 are due to differences in reporting methods. In accordance with GASB Statement No. 28, the financial statements include Securities Lending Collateral
A. Short-Term Investments
B. Domestic Equity
C. International Equity
D. Domestic Debt Securities
PERf Investment Returns
0.3%
16.3%13.6%
21.7%
7.4%
(10.8%)
23.9%
A D EB C
F
G
E. International Debt Securities
F. Real Estate
G. Alternative Investments
90 | Investment Section | CalPERS Comprehensive Annual Financial Report, Fiscal Year Ended June 30, 2010
InvestmentPerformance–PERF
CalPERS returns for domestic and international equity securities for fiscal year 2009-10 were 16.3 percent and 13.6 percent, respectively. CalPERS uses a Custom Wilshire 2500 Index to provide a benchmark for the domestic equity investment returns, and the FTSE All-World ex US Index for international equity investment returns. These benchmarks are representative of the returns that could be expected in a similar investing environment, and reflect the overall market conditions.
Alternative investments incurred a return of approximately 23.9 percent for the 2009-10 fiscal year, compared to a negative return of 25.9 percent for fiscal year 2008-09. The Policy Benchmark for the AIM program is the Wilshire 2500 plus a 300 basis point risk premium on a one-quarter lag basis.
Domestic debt securities returned approximately 21.7 percent, and international debt securities returned approximately 7.4 percent for the 2009-10 fiscal year, compared to 0.2 percent and 1.7 percent, respectively for fiscal year 2008-09. CalPERS benchmark returns were 13.4 percent and 2.2 percent, respectively. CalPERS uses the Barclays Long Liability Index and the Barclays International Fixed Income Index to provide a benchmark for fixed income investment returns. These benchmarks are representative of the returns that could be expected in a similar investing environment.
CalPERS benchmark for real estate return for fiscal year 2009-10 was negative 2.9 percent. CalPERS uses the 90% of NCREIF +2% and 10% of FTSE NAREIT Global Index to provide a benchmark for real estate investment returns. The NCREIF is a property-level performance benchmark for institutionally owned real estate held in a fiduciary environment.
Short-term investments returned approximately 0.3 percent for the 2009-10 fiscal year, compared to 1.4 percent for fiscal year 2008-09. CalPERS uses the SSGA Custom STIF as a benchmark for short-term investments.
Wilshire Associates, the Board’s pension consultant, prepares a Quarterly Report of Investment Performance for the Fund based on performance calculations made by the Fund’s custodian, State Street Bank & Trust. Shown on the following page are the 1-year, 3-year, 5-year, and 10-year time-weighted rates of return for the year ended June 30, 2010.
Per guidelines recommended by the Chartered Financial Analyst Institute, the Master Custodian for CalPERS computes monthly returns for portfolios, composites, and total plan. For periods greater than a month, a time series of linked monthly returns is used, producing a time-weighted effect.
Additional information about CalPERS investment policies, operations, investment results, and detailed asset information can be found in the accompanying 2010 Operations Summary, and on the CalPERS website at www.calpers.ca.gov.
CalPERS Comprehensive Annual Financial Report, Fiscal Year Ended June 30, 2010 | Investment Section | 91
PERf Portfolio Comparisons
Category1-Year Return
3-YearReturn
5-YearReturn
10-YearReturn Index
1-YearReturn
3-YearReturn
5-YearReturn
10-YearReturn
total funD 13.3% (6.5%) 1.7% 2.6% Asset Allocation Policy Index 1 13.0% (2.6%) 3.8% 3.3%
Actuarial Rate 7.8% 7.8% 7.8% 7.9%
Trust Universe Comparison Service (TUCS) Public Fund Median
notes:1 The current allocation percentages differ from investment
asset percentages presented in the MD&A and Statement of Net Assets as a result of different methodologies used for categorizing investment assets for investment purposes versus financial statement presentation purposes.
2 Differences between investment values above and the values on the Summary of Investments on page 89 are due to differences in reporting methods. The Summary of Investments includes Net Investment Receivables/Payables.
CalPERS Comprehensive Annual Financial Report, Fiscal Year Ended June 30, 2010 | Investment Section | 93
9 International Business Machines Corporation 3,618,702 446,837
10 AT&T, Incorporated 18,195,535 440,150
largest bond holdings (Dollars in Thousands)
Rank Company Par Value Market Value
1 Chase Issuance Trust 1.8997% due 04/15/14 $2,965,000 $3,031,9742 United States Treasury WI N/B 3.3750% due 11/15/19 2,349,018 2,432,8543 United States Treasury N/B 3.6250% due 08/15/19 2,008,799 2,123,9234 United States Treasury N/B 4.6250% due 02/15/40 613,171 689,4075 Citibank Credit Card Issuance Trust 2.0997% due 3/17/14 630,935 646,7626 United States Treasury N/B 3.6250% due 02/15/20 585,798 618,8967 United States Treasury N/B 2.5000% due 03/31/15 521,810 540,7058 United States Treasury WI N/B 3.2500% due 03/31/17 439,567 463,1159 United States Treasury Bonds 4.3750% due 02/15/38 409,071 442,332
10 Citigroup Commercial Mortgage Trust 5.8880% due 12/10/49 404,952 414,980
A complete list of portfolio holdings is available upon request.
note:1 CalPERS no longer produces
a separate Annual Investment Report. All the information previously included in that separate volume is now contained in this report and the accompanying Operations Summary. A complete listing of portfolio holdings is available on the CalPERS website at www.calpers.ca.gov.
94 | Investment Section | CalPERS Comprehensive Annual Financial Report, Fiscal Year Ended June 30, 2010
ScheduleofCommissions&Fees–PERF(Dollars in Thousands)
BrokerNumber of
Shares Traded
Base Commission
& Fees Amount
Abel Noser Corporation 15,609,841 $247ABN Amro Hoare Govett Asia Ltd., Seoul 79,548 18ABN Amro Asia Ltd. 5,935,161 32ABN Amro Bank NV, Hong Kong 15,176,537 57ABN Amro Bank NV 49,826,489 133ABN Amro Securities (USA), Inc. 1,463,100 42Antique Stock Broking, Ltd. 477,407 12Aviate Global, LLP 470,838 23Baird, Robert W., and Company, Inc. 847,883 29Banco De Investimentos Credit 1,068,550 41Banco Itau SA 3,125,960 92Banco Pactual SA 1,298,222 24Banco Santander Central Hispano SA 3,438,424 82Banque Paribas Frankfurt 753,479 14Barclays Capital 1,741,853 42Barclays Capital, Inc./LE 40,638,326 981Batlivala & Karani Securities India Pvt., Ltd. 724,643 17BMO Capital Markets 1,231,024 38BNP Equities France 2,459,887 28BNP Paribas Peregrine Securities 69,546,773 246BNP Paribas Peregrine Securities, PT 11,006,200 22BNY Brokerage 1,035,019 20BNY Convergex 71,334,767 1,023BNY Convergex LJR 6,688,206 188Boe Securities, Inc./Broadcort Cap. Corp. 425,109 13Boenning-Scattergood, Inc. 1,450,900 15Bradesco SA CTVM 1,492,513 23Brockhouse-Cooper, Inc., Montreal 20,897,373 145CA LB Investment Bank AG 5,822,160 29Cabrera Capital Markets 13,534,177 231Canaccoro Adams, Inc. 576,084 26Cantor Fitzgerald and Company/ CastleOak Sec. 572,290 17Cantor Fitzgerald and Company 26,793,970 408Capital Institutional Svcs, Inc., Equities 9,991,941 151Cargary Securities, Ltd. 3,981,665 17Cazenove and Company 6,233,590 33Cazenove Asia, Ltd. 4,368,800 26Celfin Capital SA Corredores De Bolsa 117,272,453 55Centrum Broking Private, Ltd. 171,593 13Chase Manhattan Bank 4,370,082 12China Int'l. Capital Corp. Hong Kong Securities, Ltd. 27,968,007 106Cibc World Mkts., Inc. 496,900 17Cimb-Gk Securities PTE., Ltd. 9,078,916 15Citation Group 1,728,030 57Citigroup Global Marktet Korea Secs., Ltd. 1,780,749 45Citigroup Global Markets Australia, Pty. 2,078,331 44Citigroup Global Markets, Inc., Salomon Brothers 12,161,130 2,735Citigroup Global Markets, Inc. 231,624,604 1,809Citigroup Global Markets India 1,706,287 44Citigroup Global Markets, Ltd. 73,570,851 755
BrokerNumber of
Shares Traded
Base Commission
& Fees Amount
Citigroup Global Markets UK Equity, Ltd. 7,754,148 $33CLSA Securities Korea, Ltd. 431,621 36CLSA Singapore Pte, Ltd. 36,861,732 97Commerce Intl. Merchant Bankers 3,652,100 17Cowen And Company, LLC 1,677,289 61Credit Agricle Indosuez 620,004 16Credit Agricole Indosuez Cheuvreux 5,140,061 93Credit Lyonnais Capital Indonesia 8,727,300 36Credit Lyonnais Securities (Asia) 126,667,811 312Credit Lyonnais Securities (USA), Inc. 144,669,561 159Credit Lyonnais Securities India 5,218,718 103Credit Suisse First Boston 51,452,491 119Credit Suisse First Boston (Europe) 766,660 39Credit Suisse First Boston SA CTVM 6,556,166 149Credit Suisse Secs India Private, Ltd. 23,914,229 261Credit Suisse Securities (Europe), Ltd. 132,804,564 914Credit Suisse Securities (USA), LLC 579,138,613 2,317Credit USA 875,529 24CS First Boston (Hong Kong), Ltd. 37,691,264 85CSFB Australia Equities, Ltd. 3,489,421 27Cuttone and Company, Inc. 1,264,434 38Daewoo Securities Company, Ltd. 392,491 23Daishin Securities Co., Ltd. 314,491 16Daiwa Securities (HK), Ltd. 36,547,117 37Daiwa Securities America, Inc. 3,107,265 44Danareska Securities, PT 3,968,767 14Deutsche Bank AG London 83,275,984 442Deutsche Bank Securities, Inc. 152,560,396 1,038Deutsche Eq In Prvt LIM DB 4,643,601 80Deutsche Morgan Grenfell Secs 1,800,178 33Deutsche Securities Asia, Ltd. 84,885,784 190Direct Trading Institutional, Inc. 4,189,988 32Dongwon Securities 286,227 34DSP Merrill Lynch, Ltd. 6,292,114 162Dundas Unlu Securities, Inc. 11,551,068 84Enam Securities Pvt., Ltd. 714,172 40Evolution Beeson Gregory, Ltd. 1,201,811 17Exane SA 2,967,444 36Fator-Doria Atherino SA, CV 852,743 18Fidelity Capital Markets 5,301,527 92Finacorp Securities 16,541,902 245Finsettle Services Pty., Ltd. 1,169,318 43Friedman Billings-Ramsey 496,955 20Fubon Securities Co., Ltd. 6,682,000 27G Trade Services, Ltd. 9,764,535 50Garantia Dtvm SA 1,782,200 31Gardner Rich and Company 426,146 12Gk Goh Ometraco PT 11,501,300 26Goldman Sachs and Company 788,095,205 3,329Goldman Sachs (Asia), LLC 35,612,282 152Goldman Sachs (India) 1,658,615 28Goldman Sachs International 58,672,728 605Great Pacific Securities, Inc. 19,867,335 280GunnAllen Financial 18,352,077 219Guzman and Company 23,226,044 358
CalPERS Comprehensive Annual Financial Report, Fiscal Year Ended June 30, 2010 | Investment Section | 95
BrokerNumber of
Shares Traded
Base Commission
& Fees Amount
HC Istanbul 4,214,371 $33Hoare Govett (India) Securities Pvt., Ltd. 2,101,884 38Hong Kong And Shanghai Banking Corp. 309,163,600 268HSBC Bank Brasil Sa Banco Multiplo 1,652,985 39HSBC Bankplc 62,956,049 641HSBC James Capel Seoul 11,954,812 169HSBC Securities (USA), Inc. 345,865,823 728HSBC Securities India Holdings 275,163 12Hyundai Securities Co., Ltd. 1,331,555 68Icap Securities, Ltd. 1,199,766 24India Infoline, Ltd. 3,264,113 78Ing Bank NV 1,320,676 29Ing Barings Corporation 611,412 35Instinet 57,911,367 827Instinet Australia Clearing Services Pty., Ltd. 20,641,592 18Instinet Canada 2,848,367 17Instinet, LLC 11,187,764 120Instinet Pacific, Ltd. 88,487,769 96Instinet UK, Ltd. 304,396,903 787Intermonte Securities SIM Spa 4,224,151 32Investec Securities 1,918,226 13Investment Technology Group, Inc. 44,609,341 690Investment Technology Group, Ltd. 168,455,575 460ISI Group, Inc. 849,443 25Itau USA Securities, Inc. 474,293 21ITG Australia, Ltd. 8,892,760 14ITG Canada 24,153,061 126ITG, Inc. 4,359,527 44ITG Securities (HK), Ltd. 35,850,914 71JB Were and Son 1,061,123 25JP Morgan India Private Ltd. 311,069 15JP Morgan Securities Inc. 33,146,953 468JP Morgan Clearing Corp. 48,677,950 375JP Morgan Securities (Taiwan) Ltd. 12,706,778 44JP Morgan Securities, Ltd. 65,881,567 687JP Morgan Securities (Far East), Ltd.- Seoul 942,108 118Janney Montgomery, Scott, Inc. 967,869 38Jefferies and Company, Inc. 11,827,666 186JM Morgan Stanley Secs. Pvt., Ltd. 11,721,333 64JMP Securities 259,111 12Jones Trading Institutional Services, LLC 24,490,515 355JP Morgan Chase Bank 8,064,965 19JP Morgan Securities (Asia Pacific), Ltd. 167,243,864 449JP Morgan Securities (Australia), Ltd. 3,701,757 24JP Morgan Securities (Singapore) 5,891,200 16KBC Financial Products UK, Ltd. 1,278,440 16Keefe, Bruyette, and Woods, Inc. 698,586 23Kepler Equities Sucursal En Espana 697,950 16Kim Eng Securities 12,150,794 46Knight Securities 19,734,812 266Kotak Securities 2,470,974 68Labranche Financial Service, SL 788,631 24Lazard Capital Markets, LLC 588,880 19
BrokerNumber of
Shares Traded
Base Commission
& Fees Amount
Liquidnet Europe, Ltd. 2,696,900 $19Liquidnet, Inc. 11,767,182 207Loop Capital Mkts, LLC 2,026,213 83M. Ramsey King Securities, Inc. 13,283,747 138Macquarie Securities, Ltd. 477,665,868 688Macquarie Bank, Ltd. 3,113,628 63Macquarie Equities, Ltd. (Sydney) 94,623,203 155Macquarie Securities (India) Pvt., Ltd. 6,126,248 139Macquarie Securities (Singapore) 50,594,148 78Macquarie Securities, Ltd.-Seoul 3,544,930 146Magavceo Lee and Company 24,964,560 372Magna Securities Corp. 5,029,940 85Merrill Lynch International 71,278,772 605Merrill Lynch Peirce Fenner and Smith 253,893,350 2,028Mischler Financial Group, Inc.-Equities 5,515,467 99Mitsubishi UFJ Securities International, PLC 253,384 17Mizuho Securities Asia, Ltd. 2,540,742 24Mizuho Securities USA, Inc. 1,056,352 15Monument Securities, Ltd. 3,333,710 13Morgan Keegan & Co., Inc. 713,113 27Morgan Stanley and Co., International Taipei Metro 26,738,303 61Morgan Stanley and Co., International 102,746,170 337Morgan Stanley and Co., Inc. 408,464,251 2,580Morgan Stanley Securities, Ltd. 4,306,069 35Motilal Oswal Securities, Ltd. 5,100,414 130Mr. Beal and Company 2,395,120 66Natexis Bleichroeder, Inc. 621,389 13National Financial Services Corp. 2,590,880 138National Securities Corp. 8,520,559 28Nesbitt Burns 395,143 12Nomura Financial Advisory and Securities India 36,205,698 367Nomura International (Hong Kong), Ltd. 8,957,004 30Nomura International, PLC 67,956,997 253Nomura Intl (HK), Ltd., Seoul Br 633,286 23Nomura Securities Co., Ltd. 96,402,966 89Nomura Securities International, Inc. 131,925,292 553Nordic Partners 737,720 12O’Neil, William and Co., Inc./BCC CLRG 490,012 19Oien Securities, Inc. 13,233,526 190Oppenheimer and Co., Inc. 2,393,846 105Pacific American Securities, LLC 2,643,291 59Pacific Crest Securities 525,734 23Penserra Securities, LLC 47,400,434 289Pershing DLJ, SL 48,219,014 311Pershing, LLC 51,266,754 411Pershing Securities, Ltd. 2,917,619 23Pipeline Trading Systems, LLC 15,802,711 314Piper Jaffray 2,373,823 74Princeton Securities 1,042,700 21Pulse Trading, LLC 2,850,125 82Rabobank Nederland 1,150,028 20Raymond James and Associates, Inc. 968,400 30
Schedule of Commissions & Fees – PERF (continued) (Dollars in Thousands)
96 | Investment Section | CalPERS Comprehensive Annual Financial Report, Fiscal Year Ended June 30, 2010
BrokerNumber of
Shares Traded
Base Commission
& Fees Amount
RBC Capital Markets 23,580,388 $359RBC Dominion Securities 13,080,065 159RBS Securities, Inc. 5,204,340 20Redburn Partners, LLP 405,826 22Renaissance Capital Group 382,012 13Renaissance Capital, Ltd. 713,861 14Ridge Clearing and Outsourcing Solutions 7,456,260 104Roberts and Ryan Investments, Inc. 692,772 21Rochdale Securities Corp. (CLS Thru 443) 667,059 14Rosenblatt Securities, LLC 4,425,733 51S.S Kantilal Ishwarlal Securities 2,724,994 58Salomon Smith Barney, Inc. 28,824,143 63Samsung Securities Co., Ltd. 396,201 99Sanders Morris Harris 14,849,842 175Sanford C. Bernstein, Ltd. 1,520,924 38Sanford C. Bernstein Co., LLC 13,593,016 173Seslia Securities 25,811,148 373SG Americas Securities, LLC 10,859,183 88SG Securities HK 40,042,960 146Sidoti and Company, LLC 295,999 15Skandinaviska Enskilda Banken, London 5,797,477 75Smifs Securities, Ltd. 3,540,636 93Societe Generale 6,210,254 25Societe Generale London Branch 22,944,059 219Stifel Nicolaus and Co., Inc. 3,570,216 114
BrokerNumber of
Shares Traded
Base Commission
& Fees Amount
Stuart Frankel and Co., Inc. 34,523,005 $507TD Waterhouse CDA 806,610 28The Royal Bank of Scotland NV, UK Equities 24,943,680 82Thomas Weisel Partners, LLC 1,177,478 32Troika Dialog (UK), Ltd. 1,101,392 19UBS Ag 151,656,317 616UBS Ag London 1,986,498 56UBS Securities Asia, Ltd. 69,452,527 228UBS Securities Canada, Inc. 872,011 31UBS Securities, LLC 32,122,545 642UBS Warburg, LLC 2,752,101 53Unx, Inc. 9,446,578 144Utendahl Capital Partners, LP 5,798,053 87Various Brokers 169,336,448 1,154VTB Bank Europe, PLC 1,553,741 26Wachovia Capital Markets, LLC 1,349,819 37Wedbush Morgan Securities, Inc. 360,450 14Weeden and Co. 7,624,726 122William Blair and Company, LLC 749,154 31William Smith Securities 19,155,833 219Williams Capital Group, LP (The) 701,437 21Woori Investment Securities 607,074 37Yamner and Co., Inc. (CLS Thru 443) 1,164,171 12Yuanta Core Pacific Securities 8,950,130 25total 8,342,458,206 $50,434
Schedule of Commissions & Fees – PERF (continued) (Dollars in Thousands)
CalPERS Comprehensive Annual Financial Report, Fiscal Year Ended June 30, 2010 | Investment Section | 97
Fund Name 2009 Fees & Costs 1
1818 Fund II, LP $20,470 Aberdare Ventures IV, LP 975,229 Aberdare Ventures III, LP 515,496 Acon-Bastion Partners II, LP 1,302,853 Advent Global Private Equity IV, LP 47,333 Advent International GPE V-D, LP 708,097 Advent International GPE VI, LP 7,353,394 Advent Japan Private Equity Fund, LP 3,468,966 Advent Latin America Private Equity Fund IV, LP 3,476,581 Advent Latin American Private Equity Fund III, D, LP 753,167 Affinity Asia Pacific Fund III, LP 2,629,830 Aisling Capital II, LP 717,675 Aisling Capital III, LP 1,875,761 Alta V Limited Partnership 26,088 American River Ventures I, LP 500,159 AP Investment Europe, Ltd. 501,417 APA Excelsior IV, LP 6,630 Apollo Alternative Assets, LP 464,776 Apollo Asia Opportunity Fund, LP 1,305,691 Apollo European Principal Finance Fund, LP 2,606,474 Apollo Investment Fund III, LP 36,067 Apollo Investment Fund IV, LP 200,090 Apollo Investment Fund V, LP 334,778 Apollo Investment Fund VI, LP 1,578,574 Apollo Investment Fund VII, LP 9,575,343 Apollo Special Opportunities Managed Account, LP 13,590,510 Apollo/Artus Investors 2007-I, LP 120,840 ArcLight Energy Partners Fund II, LP 779,899 ArcLight Energy Partners III, LP 3,150,630 ArcLight Energy Partners IV, LP 4,618,775 Ares Corporate Opportunities Fund II, LP 1,772,969 Ares Corporate Opportunities Fund III, LP 5,433,330 Ares Corporate Opportunities Fund, LP 690,482 Ares Special Situations Fund, LP 1,149,395 Asia Alternatives Capital Partners II, LP 3,176,306 Asia Alternatives Capital Partners, LP 997,073 Asia Recovery Fund, LP 122,302 Audax Credit Opportunities Fund, LP 608,484 Audax Mezzanine Fund II, LP 1,432,587 Audax Private Equity Fund II, LP 1,113,212 Audax Private Equity Fund III, LP 2,493,801 Aurora Equity Partners II, LP 222,111 Aurora Equity Partners III, LP 2,084,264 Aurora Equity Partners, LP 6,401 Aurora Resurgence Fund (c), LP 7,483,363 Avenue Asia Special Situations Fund III, LP 514,413 Avenue Asia Special Situations Fund IV, LP 6,525,958 Avenue Europe Special Situations Fund, LP 3,447,744 Avenue Special Situations Fund II, LP 6,017 Avenue Special Situations Fund III, LP 4,258 Avenue Special Situations Fund IV, LP 2,072,198 Avenue Special Situations Fund V, LP 6,015,392 Bank of America CA Community Venture Fund, LP 119,800 Baring Vostok Private Equity Fund IV, LP 1,680,228
Fund Name 2009 Fees & Costs 1
Baring Vostok Private Equity Fund IV, LP $125,618 Birch Hill Equity Partners (US) III, LP 1,771,603 Blackstone Capital Partners II, Merchant Banking Fund, LP 456,661 Blackstone Capital Partners III, LP 200,588 Blackstone Capital Partners V, LP 1,809,010 Blackstone Communications Partners I, LP 560,058 Blackstone Mezzanine Partners, LP 469,226 Bridgepoint Europe II 179,536 Bridgepoint Europe III, LP 434,772 Bridgepoint Europe IV, LP 1,477,398 California Emerging Ventures II, LLC 777,381 California Emerging Ventures III, LLC 416,809 California Emerging Ventures IV, LLC 1,575,583 California Emerging Ventures, LLC 2,490,040 Candover 1997 Fund 4,861 Candover 2001 Fund 266,132 Candover 2005 Fund US No. 1, LP 989,804 Candover 2008 Fund 846,269 Capital Link Fund II, LP 2,800,000 Capital Link, LLC 1,606,944 Carlyle Asia Growth Partners III, LP 1,669,752 Carlyle Asia Growth Partners IV, LP 2,732,332 Carlyle Asia Partners II, LP 2,204,095 Carlyle Asia Partners, LP 615,188 Carlyle Asia Partners III, LP 5,457,279 Carlyle Asia Venture Partners II, LP 525,972 Carlyle Europe Partners II, LP 503,470 Carlyle Europe Partners III, LP 6,489,666 Carlyle Europe Technology Partners II, LP 2,228,956 Carlyle Global Financial Services Partners, LP 3,423,775 Carlyle High Yield Partners 2008, Ltd. 2,254,787 Carlyle Japan International Partners II, LP 3,526,080 Carlyle Mexico Partners, LP 564,191 Carlyle Partners II, LP 18,186 Carlyle Partners III, LP 256,834 Carlyle Partners IV, LP 1,694,358 Carlyle Partners V, LP 12,983,727 Carlyle Realty Qualified Partners III, LP 7,048 Carlyle Strategic Partners II, LP 1,426,936 Carlyle Strategic Partners, LP 220,355 Carlyle Venture Partners II, LP 608,375 Carlyle Venture Partners III, LP 1,478,204 Carlyle/Riverstone Global Energy and Power Fund II, LP 184,437 Carlyle/Riverstone Global Energy and Power Fund III, LP 30,843 Carlyle/Riverstone Renewable Energy Infrastructure Fund I, LP 1,344,780 Central Valley Fund, LP, The 8,111 China Privatization Fund (DEL), LP 2,614,773 Clarus Lifesciences I, LP 817,121 Clarus Lifesciences II, LP 1,434,994 Clearstone Venture Partners III-A, LP 679,758 Clearwater Capital Partners Fund II Holdings, LP 1,618,637
note:1 Fees and costs for the 1-year period ending December 31, 2009.
ScheduleofFees&CostsforPrivateEquityPartners–PERF
98 | Investment Section | CalPERS Comprehensive Annual Financial Report, Fiscal Year Ended June 30, 2010
Fund Name 2009 Fees & Costs 1
Clearwater Capital Partners Fund III, LP $4,215,537 Clearwater Capital Partners I, LP 1,625,087 Clessidra Capital Partners 1,047,187 Clessidra Capital Partners II, LP 3,227,191 Coller International Partners III, LP 538,503 Coller International Partners IV, LP 638,470 Coller International Partners V, LP 3,966,319 Court Square Capital Partners II, LP 2,016,825 Craton Equity Investors I, LP 634,398 CVC Capital Partners Asia Pacific II, LP 966,928 CVC Capital Partners Asia Pacific III, LP 2,412,494 CVC European Equity Partners II, LP 178,359 CVC European Equity Partners III, LP 48,867 CVC European Equity Partners IV, LP 1,145,959 CVC European Equity Partners Tandem Fund (B), LP 3,929,886 CVC European Equity Partners V, LP 8,015,496 CVC European Equity Partners, LP 4,045 Darby Converging Europe Mezzanine Fund, LP 1,043,151 DFJ Element, LP 599,243 DFJ Frontier Fund, LP 348,220 EM Alternatives 1,000,000 Emergence Capital Partners, LP 352,956 EnerTech Capital Partners III, LP 178,644 ESP-Golden Bear Europe Fund, LP 5,955,866 Essex Woodlands Health Ventures VIII, LP 2,689,408 Ethos Private Equity Fund III, LP 30,579 Falconhead Capital Partners II, LP 2,581,353 Fenway Partners Capital Fund, LP 116,893 First Reserve Fund IX, LP 7,566 First Reserve Fund X, LP 271,640 First Reserve Fund XI, LP 2,365,981 First Reserve Fund XII, LP 1,353,810 Francisco Partners II, LP 552,617 Francisco Partners, LP 210,955 FS Equity Partners III, LP 12,637 FS Equity Partners V, LP 28,243 Garage California Entrepreneurs Fund, LP 159,097 Generation Capital Partners, LP 118,981 Giza Venture Fund IV, LP 154,737 Gleacher Mezzanine Fund I, LP 100,102 Gleacher Mezzanine Fund II, LP 937,085 Golden State Investment Fund, LLC 4,001,507 Golder, Thoma & Cressey Fund IV, LP 1,715 Granite Global Ventures II, LP 48,012 Granite Global Ventures III, LP 1,468,258 Green Capital Partners (GCP) California Fund, LP 980,400 Green Credit Investors, LP 424,658 Green Equity Investors II, LP 190 Green Equity Investors III, LP 315,307 Green Equity Investors IV, LP 18,357 Green Equity Investors V, LP 3,898,525 GSO Capital Opportunities Fund, LP 2,385 Health Evolution Partners, LLC 3,252,886 Health Evolution Partners Growth, LP 10,428,428
Fund Name 2009 Fees & Costs 1
Hellman & Friedman Capital Partners II, LP $3,174 Hellman & Friedman Capital Partners IV, LP 21,155 Hellman & Friedman Capital Partners V, LP 821,941 Hellman & Friedman Capital Partners VI, LP 8,401,175 Huntsman Gay Capital Partners, LP 2,592,771 ICV Partners II, LP 528,709 ICV Partners, LP 7,991 Information Technology Ventures II, LP 1,692 Insight Venture Partners V Coinvestment Fund, LP 199,000 Insight Venture Partners V, LP 418,863 Insight Venture Partners VI, LP 1,452,399 Ironbridge Capital 2003/4, LP 727,292 Ironbridge Fund II, LP 1,454,679 KB Mezzanine Fund II, LP 52,475 Khosla Ventures III, LP 2,055,649 Khosla Ventures Seed, LP 1,452,712 KKR 2006 Fund, LP 4,454,719 KKR Asian Fund 2,752,932 KKR European Fund II, LP 1,036,744 KKR European Fund III, LP 5,000,034 KKR European Fund, LP 135,824 KKR Millennium Fund, LP 83,949 Kline Hawkes California, LP 33,953 Vicente Capital Partners Growth Equity Fund, LP (fka: Kline Hawkes Growth Equity) 726,731 Kline Hawkes Pacific, LP 558,765 KPS Special Situations III, LP 1,093,496 Levine Leichtman Capital Partners Deep Value Fund, LP 1,251,983 Levine Leichtman Capital Partners, LP 29,372 Levine Leichtman Capital Partners II, LP 394,418 Levine Leichtman Capital Partners III, LP 302,098 Levine Leichtman Capital Partners IV, LP 1,245,257 Lexington Capital Partners II, LP 45,014 Lexington Capital Partners III, LP 287,030 Lexington Capital Partners IV, LP 514,099 Lexington Capital Partners V, LP 1,461,854 Lexington Middle Market Investors, LP 546,520 Lightspeed Venture Partners VI, LP 749,000 Lightspeed Venture Partners VII, LP 834,623 Lime Rock Partners III, LP 168,810 Lime Rock Partners IV, LP 615,450 Lime Rock Partners V, LP 1,686,745 Lion Capital Fund II, LP 4,121,324 Lombard Asia III, LP 1,088,842 Lombard Thailand Partners, LP 30,551 Lombard/Pacific Partners, LP 255,441 Madison Dearborn Capital Partners II, LP 18,516 Madison Dearborn Capital Partners III, LP 10,670 Madison Dearborn Capital Partners IV, LP 72,585 Madison Dearborn Capital Partners V, LP 2,076,975 Madison Dearborn Capital Partners, LP 7,071 Magnum Capital, LP 1,859,680 Markstone Capital Partners, LP 1,337,124
Schedule of Fees & Costs for Private Equity Partners – PERF (continued)
note:1 Fees and costs for the 1-year period ending December 31, 2009.
CalPERS Comprehensive Annual Financial Report, Fiscal Year Ended June 30, 2010 | Investment Section | 99
Fund Name 2009 Fees & Costs 1
Media/Communications Partners II, LP $6,073 MHR Institutional Partners IIA, LP 434,848 MHR Institutional Partners III, LP 5,704,763 New Enterprise Associates 12, LP 611,740 New Mountain Partners II, LP 1,595,320 New Mountain Partners III, LP 6,234,009 Newbridge Asia III, LP 852,311 Newbridge Asia IV, LP 1,516,086 NGEN II, LLC 298,446 Nogales Investors Fund I, LP 67,591 Nogales Investors Fund II, LP 970,839 Oak Hill Capital Partners II, LP 979,429 Oak Hill Capital Partners III, LP 5,542,317 Oaktree Capital Management (OCM) Opportunities Fund, LP 43,017 Opportunity Capital Partners IV, LP 258,493 Pacific Community Ventures Investments Partners II, LP 264,918 Palladium Equity Partners III, LP 4,011,388 Parish Capital I, LP 451,663 Parish Capital II, LP 661,220 PCG Clean Energy & Technology 4,000,000 PCG Corporate Partners Fund II 7,680,636 PCG Corporate Partners, LP 1,489,952 PCGI Global Opportunities Fund 2, LLC 3,750,000 PCGI Global Opportunities Fund, LLC 2,211,000 Permira Europe I 22,672 Permira Europe III 627,547 Permira U.K. Venture IV 21,669 Perseus-Soros Biopharmaceutical Fund, LP 261,823 Pharos Capital Partners II-A, LP 481,194 Pinnacle Ventures II-B, LP 1,157 Polish Enterprise Fund IV, LP 162,250 Polish Enterprise Fund V, LP 705,726 Polish Enterprise Fund VI, LP 2,909,060 Prospect Venture Partners II, LP 1,415,674 Prospect Venture Partners III, LP 1,235,657 Providence Equity Partners V, LP 177,928 Providence Equity Partners VI, LP 3,430,133 Q Street/Century, LLC 2,541,306 Quadrangle Capital Partners II, LP 1,906,644 Resolute Fund II, The 2,820,768 RFG Private Equity, LP No. 1 289,267 Rhône Partners III, LP 2,262,069 Richardson Capital Private Equity, LP No. 2 679,427 Ripplewood Partners II, LP 309,286 Riverstone/Carlyle Global Energy & Power Fund IV 4,936,171 Riverstone/Carlyle Renewable and Alternative Energy Fund II, LP 4,511,114 RockPort Capital Partners II, LP 168,939 Rosewood Capital Associates V, LP 1,377,860 Sacramento Private Equity Partners, LP 1,500,000 SAIF Partners III, LP 1,762,712 Silver Lake Credit Fund, LP 4,855,610
Fund Name 2009 Fees & Costs 1
Silver Lake Partners II, LP $502,795 Silver Lake Partners III, LP 6,626,362 Silver Lake Partners, LP 5,761 Silver Lake Sumeru Fund, LP 3,971,582 SpaceVest Fund, LP 12,816 T3 Partners II, LP 111,220 TA Subordinated Debt Fund II, LP 437,101 TA X, LP 2,206,037 Tailwind Capital Partners, (PP) LP 670,134 TCW Special Credits Fund V - The Principal Fund 3,988 Technology Partners Fund V, LP 4,552 Technology Partners Fund VI, LP 164,685 Thomas H. Lee Equity Fund IV, LP 32,297 Thomas H. Lee Equity Fund V, LP 2,723,557 Thomas H. Lee Equity Fund VI, LP 320,678 TowerBrook Investors II, LP 3,292,746 TowerBrook Investors III, LP 4,538,647 TowerBrook Investors, LP 101,341 TPG Asia V, LP 6,615,097 TPG Biotechnology Partners II, LP 1,987,460 TPG Biotechnology Partners III, LP 2,130,333 TPG Biotechnology Partners, LP 701,800 TPG Credit Strategies, LP 92,098 TPG Partners III, LP 143,355 TPG Partners IV, LP 320,513 TPG Partners V, LP 2,344,321 TPG Partners VI, LP 11,012,932 TPG Star, LP 3,211,779 TPG Ventures, LP 4,459,841 Tricor Pacific Capital Partners IV, LP 1,667,988 Trinity Ventures IX, LP 534,173 VantagePoint CleanTech Partners, LP 22,876 VantagePoint Venture Partners 2006 (Q), LP 1,073,637 W Capital Partners II, LP 2,550,444 W Capital Partners, LP 254,665 Warburg, Pincus Investors, LP 4,335 Wayzata Opportunities Fund, LLC 1,139,223 Wayzata Opportunities Fund II, LLC 4,591,965 Welsh, Carson, Anderson & Stowe IX, LP 373,327 Welsh, Carson, Anderson & Stowe VI, LP 5,330 Welsh, Carson, Anderson & Stowe VII, LP 1,765 Welsh, Carson, Anderson & Stowe VIII, LP 45,258 Welsh, Carson, Anderson & Stowe X, LP 274,500 Welsh, Carson, Anderson & Stowe XI, LP 773,824 WLR Recovery Fund II, LP 271,858 WLR Recovery Fund III, LP 1,288,809 WLR Recovery Fund IV, LP 5,808,346 WLR Recovery Fund, LP 15,599 Yucaipa American Alliance Fund I, LP 381,944 Yucaipa American Alliance Fund II, LP 8,047,485 Yucaipa American Special Situations Fund I, LP 21,875 Yucaipa Corporate Initiatives Fund I, LP 257,815 Yucaipa Corporate Initiatives Fund II, LP 1,922,339
total $510,081,743
Schedule of Fees & Costs for Private Equity Partners – PERF (continued)
note:1 Fees and costs for the 1-year period ending December 31, 2009.
100 | Investment Section | CalPERS Comprehensive Annual Financial Report, Fiscal Year Ended June 30, 2010
Fund Name Management Fees1 Performance Fees1
Aspect Alternative Fund, LLC $1,808,959.00 $811,183.27 Atticus Global, LP 3,602,352.00 — Black River Commodity Multi-Strategy Fund, LLC 2,645,981.87 650,977.03 Black River Fixed Income Relative Value Opportunity Fund, Ltd. 4,665,046.25 14,538,509.90 Black River, CTF 1,662,153.25 — Brookside Capital Partners Fund, LP 2,814,244.00 — BlueTrend Fund, LP 2,499,546.48 1,229,040.86 Canyon Special Opportunities 1,364,000.00 — Canyon Value Realization Fund, LP 1,707,000.00 — Chatham Asset High Yield Offshore Fund, Ltd. 4,253,374.00 19,235,000.00 Chatham Asset Leveraged Loan Offshore Fund, Ltd. 3,056,539.00 8,640,000.00 CRG Partners, LP 2,037,157.03 — Deephaven Market Neutral, LLC 1,341,196.08 — Farallon Capital Offshore Investors, Inc., Class E 475,572.00 — Lansdowne European Strategic Equity Fund, LP 3,197,367.52 1,648,812.40 O'Connor Global Quantitative Equity, LLC 550,100.45 — O'Connor Global Fundamental Market Neutral Long Short, LLC 935,064.05 840,638.04 OZ Domestic Partners II, LP 8,737,006.00 10,626,046.00 PFM Diversified Fund, LP 7,398,284.62 11,769,221.70 PFM Diversified Eureka Fund 260,531.09 — Rhapsody Fund, LP 1,323,711.30 11,951,260.96 SuttonBrook Capital Partners, LP 2,593,344.24 77,319.45 Tennenbaum Multi-Strategy Fund, LLC 452,292.34 — The Marquee Fund, LP 2,467,768.84 394,982.08 Tosca — 627,496.08 Tremblant Partners, LP 2,233,597.00 3,969,428.00 Wayzata Recovery Fund, LLC 1,907,562.00 — PAAMCO Blue Diamond 1,316,554.17 — Sparx Blue Diamond Fund, LP 773,047.00 — Vision Blue Diamond Fund, LP 1,536,719.15 — Ermitage Highbury Fund, LP 662,950.48 — AIS Highbury Fund, LP 684,026.03 — ERAAM Highbury Fund, LP 1,468,897.56 — 47 Degrees North New Generation 1848 Fund, LP 1,003,738.09 — Rock Creek 1848 Fund, LP 1,034,681.13 — PAAMCO 1848 Fund, LP 1,263,926.88 —
CalPERS Comprehensive Annual Financial Report, Fiscal Year Ended June 30, 2010 | Investment Section | 101
notes:1 The Weighted Policy Benchmark returns for the LRF are based on
asset class index returns, weighted by asset class policy targets.2 The Trust Universe Comparison Service (TUCS) is a universe of
more than 1,000 client portfolio returns, subdivided by client type and asset class.
3 The Custom Tobacco-Free S&P 500 Index is used as the bench-mark for the U.S. equity segments of the LRF, starting with the February 2001 performance.
Domestic and international equity securities incurred returns of approximately 14.4 percent and 7.6 percent for fiscal year 2009-10 respectively, compared to the negative 26.4 percent and negative 31.1 percent for fiscal year 2008-09. CalPERS benchmark returns for the fiscal year 2009-10 were 14.4 percent and 7.6 percent. CalPERS uses the Custom S&P 500 Index and FTSE Developed World ex US & Tobacco Index (net of dividends), to provide a benchmark for the domestic and international equity investment returns, respectively. These benchmarks are representative of the returns that could be expected in a similar investing environment and reflect the overall market conditions.
Domestic debt securities returned 19.2 percent for fiscal year 2009-10, compared to 2.1 percent for fiscal year 2008-09. CalPERS benchmark return for fiscal year 2009-10 was 13.4 percent. CalPERS uses the Barclays Long Liability Index to provide a benchmark for our fixed
InvestmentPerformance–LRF
lRf Portfolio Comparisons
Category1-Year Return
3-Year Return
5-Year Return Index
1-Year Return
3-Year Return
5-Year Return
total funD 16.1% 1.4% 3.7% Weighted Policy Benchmark1 13.1% 1.2% 3.7%Actuarial Rate 7.0% 7.0% 7.0%Trust Universe Comparison Service (TUCS) Public Fund Median2 12.7% (3.3%) 3.0%
International Equity 7.6% (12.1%) 1.9%FTSE Developed World ex US & Tobacco Index 7.6% (12.1%) 1.9%
Domestic Debt Securities 19.2% 9.2% 5.6% Barclays Long Liability Index 13.4% 9.0% 6.0%
income investment returns. This benchmark is representa-tive of the returns that could be expected in a similar investing environment, and reflects the overall market characteristics.
Wilshire Associates, the Board’s pension consultant, prepares a Quarterly Report of Investment Performance for the Legislators’ Retirement Fund based on performance calculations made by the Fund’s custodian, State Street Bank & Trust. Below are the 1-year, 3-year, and 5-year time-weighted rates of return for the year ended June 30, 2010.
Per guidelines recommended by the Chartered Financial Analyst Institute, the Master Custodian for CalPERS computes monthly returns for portfolios, composites, and total plan. For periods greater than a month, a time series of linked monthly returns is used, producing a time-weighted effect.
lRf Investment mix by asset Class lRf total fund Performance | 10-Year Review, One-Year Returns
62.1% Domestic Debt Securities
9.5% International Equity
100.0%
28.4% Domestic Equity
’10’09’08’07’06’05’04’03’02’01
16.1
%
(10.
2%)
0.0%
12.6
%
2.0%
8.8%9.1%
8.5%
0.2%
(2.9
%)
102 | Investment Section | CalPERS Comprehensive Annual Financial Report, Fiscal Year Ended June 30, 2010
Investment Performance – LRF (continued)
CalPERS Comprehensive Annual Financial Report, Fiscal Year Ended June 30, 2010 | Investment Section | 103
Real estate investments returns were approximately 30.9 percent, compared to negative 45.2 percent for fiscal year 2008-09. CalPERS benchmark return for real estate investments for fiscal year 2009-10 was 30.9 percent. CalPERS uses the Custom REIT index to provide bench-mark for real estate investment returns. These benchmarks are representative of the returns that could be expected in a similar investing environment, and reflect the overall market environment.
Wilshire Associates, the Board’s pension consultant, prepares a Quarterly Report of Investment Performance for the Judges’ Retirement Fund II based on performance calculations made by the Fund’s custodian, State Street Bank & Trust. The 1-year, 3-year, and 5-year time- weighted rates of return for the year ended June 30, 2010, are shown below.
Per guidelines recommended by the Chartered Financial Analyst Institute, the Master Custodian for CalPERS computes monthly returns for portfolios, composites, and total plan. For periods greater than a month, a time series of linked monthly returns is used, producing a time-weighted effect.
Domestic and international equity securities incurred returns of approximately 14.4 percent and 7.6 percent, respectively, for fiscal year 2009-10, compared to the negative returns of 26.4 percent and 31.1 percent, respec-tively, for fiscal year 2008-09. CalPERS benchmark returns for fiscal year 2009-10 were 14.4 percent and 7.6 percent, respectively. CalPERS uses the Custom S&P 500 Index and FTSE Developed World ex US & Tobacco Index, respectively, to provide a benchmark for our domestic and international equity investment returns. These benchmarks are representative of the returns that could be expected in a similar investing environment, and reflect the overall market characteristics.
Domestic debt securities returned approximately 19.2 percent for the 2009-10 fiscal year, compared to 2.1 percent for fiscal year 2008-09. CalPERS benchmark return for fiscal year 2009-10 was 13.4 percent. CalPERS uses the Barclays Long Liability Index to provide a benchmark for fixed income investment returns. This benchmark is representative of the returns that could be expected in a similar investing environment.
InvestmentPerformance–JRFII
JRf II Portfolio Comparisons
Category1-Year Return
3-Year Return
5-Year Return Index
1-Year Return
3-Year Return
5-Year Return
total funD 16.6% (3.7%) 2.2% Weighted Policy Benchmark1 14.7% (3.6%) 2.5%Actuarial Rate 7.3% 7.3% 7.3%Trust Universe Comparison Service (TUCS) Public Fund Median2 12.7% (3.3%) 3.0%
notes:1 The Weighted Policy Benchmark returns for the JRF II are based
on asset class index returns, weighted by asset class policy targets.2 The Trust Universe Comparison Service (TUCS) is a universe of
more than 1,000 client portfolio returns, subdivided by client type and asset class.
3 The Custom Tobacco-Free S&P 500 Index is used as the bench-mark for the U.S. equity segments of the JRF II, starting with the February 2001 performance.
JRf II Investment mix by asset Class JRf II total fund Performance | 10-Year Review, One-Year Returns
’10’09’08’07’06’05’04’03’02’01
16.6
%
(6.4
%)
15.8
%
7.8%9.
7%
13.8
%
4.9%
(4.7
%)
(19.
7%)
(4.7
%)
100.0%
0.1% Short-Term Investments
9.7% Real Estate
19.3% International Equity
32.6% Domestic Equity
38.3% Domestic Debt Securities
104 | Investment Section | CalPERS Comprehensive Annual Financial Report, Fiscal Year Ended June 30, 2010
Investment Performance – JRF II (continued)
CERbtf Investment mix by asset Class CERbtf total fund Performance | Three-Year Review, One-Year Returns
26.3% Domestic Debt Securities
32.1% Domestic Equity
26.8% International Equity
9.3% Real Estate
5.5% Short-term
100.0%
’10’09’08
15.9
%
(4.7
%)
(23.
0%)
CalPERS Comprehensive Annual Financial Report, Fiscal Year Ended June 30, 2010 | Investment Section | 105
InvestmentPerformance–CERBTF
2009-10 was 13.4 percent. CalPERS uses the Custom Long Liability Index to provide a benchmark for our fixed income investment returns.
Real estate investments returns were approximately 30.5 percent, compared to negative 44.4 percent for fiscal year 2008-09. CalPERS benchmark return for real estate investments for fiscal year 2009-10 was 30.9 percent. CalPERS uses the Custom REIT Index to provide a benchmark for real estate investment returns.
These benchmarks are representative of the returns that could be expected in a similar investing environment, and reflect the overall market environment.
Domestic and international equity securities had returns of approximately 14.4 percent and 7.6 percent for the 2009-10 fiscal year, compared to the losses of 26.4 percent and 31.1 percent for fiscal year 2008-09. CalPERS benchmark for fiscal year 2009-10 was 14.4 percent and 7.6 percent. CalPERS uses the PERS Blended S&P 500 ex Tobacco Index and FTSE Developed World ex US & Tobacco Index to provide a benchmark for domestic and international equity investment returns.
Domestic debt securities returned approximately 19.2 percent, compared to 2.1 percent for fiscal year 2008-09. CalPERS benchmark return for fiscal year
CERbtf Portfolio Comparisons
Category1-Year Return
3-Year Return
5-Year Return Index
1-Year Return
3-Year Return
5-Year Return
total funD 15.9% (5.3%) —% CERBTF Policy Benchmark 14.8% (5.9%) —%Actuarial Rate 7.8% 7.8% 7.8%
hCf Investment mix by asset Class hCf total fund Performance | Two-Year Review, One-Year Returns
81.5% Domestic Debt Securities
100.0%
18.5% Short-term
’10’09
11.8
%
3.4%
106 | Investment Section | CalPERS Comprehensive Annual Financial Report, Fiscal Year Ended June 30, 2010
Investments of the HCF at June 30, 2010, include highly liquid, short-term securities and domestic debt securities. These securities yielded a return of 11.8 percent.
InvestmentPerformance–HCF
hCf Portfolio Comparisons
Category1-Year Return
3-Year Return
5-Year Return Index
1-Year Return
3-Year Return
5-Year Return
total funD 11.8% 7.1% —% Barclays Capital Aggregate Index 9.5% 7.6% —%
CalPERS Comprehensive Annual Financial Report, Fiscal Year Ended June 30, 2010 | Investment Section | 107
High yield securities returned approximately 28.7 percent for the 2009-10 fiscal year. CalPERS benchmark return for the fiscal year 2009-10 was 25.6 percent. TIPS securi-ties returned approximately 9.2 percent for the 2009-10 fiscal year. CalPERS benchmark return for the fiscal year 2009-10 was 9.5 percent.
Real estate investments returned approximately 31.0 percent, compared to negative 45.5 percent for fiscal year 2008-09. CalPERS benchmark return for real estate investments for fiscal year 2009-10 was 31.1 percent. CalPERS uses the Wilshire RESI Index to provide a benchmark for real estate investment returns.
These benchmarks are representative of the returns that could be expected in a similar investing environment, and reflect the overall market environment.
Domestic and international equity securities had returns of approximately 14.4 percent and 7.6 percent for the 2009-10 fiscal year, compared to the negative returns of 26.4 percent and 31.1 percent for fiscal year 2008-09. CalPERS benchmark returns for fiscal year 2009-10 were 14.4 percent and 7.6 percent. CalPERS uses the Custom S&P 500 Index and FTSE Developed World ex US & Tobacco Index to provide a benchmark for domestic and international equity investment returns.
Domestic debt securities consist of fixed income, high yield and TIPS securities. Fixed income securities returned approximately 19.2 percent for the 2009-10 fiscal year. CalPERS benchmark return for the fiscal year 2009-10 was 13.4 percent. CalPERS uses the Barclays Long Liability Index for fixed income investment returns.
InvestmentPerformance–LTCF
ltCf Portfolio Comparisons
Category1-Year Return
3-Year Return
5-Year Return Index
1-Year Return
3-Year Return
5-Year Return
total funD 16.6% (1.8%) 3.2% Weighted Policy Benchmark1 14.8% (1.8%) 3.2%Actuarial Rate 6.4% 7.8% 7.8%Trust Universe Comparison Service (TUCS) Public Fund Median2 12.7% (3.3%) 3.0%
International Equity 7.6% (12.1%) 1.8%FTSE Developed World ex US & Tobacco Index 7.6% (12.1%) 1.9%
Domestic Debt Securities Fixed Income 19.2% 9.2% 5.7% Barclays Long Liability Index 13.4% 9.0% 5.9%
High Yield 28.7% 5.3% 6.9%Barclays Long Liability Index High Yield 25.6% 6.0% 6.7%
TIPS 9.2% 8.0% 4.9% Barclays Long Liability Index TIPS 9.5% 7.6% 4.7%Real Estate 31.0% (15.3%) (3.7%) Wilshire RESI Index 31.1% (15.5%) (3.9%)
TUCS Real Estate Median (7.0%) (11.3%) —%
notes:1 The Weighted Policy Benchmark returns for the LTCF are based
on asset class index returns, weighted by asset class policy targets.2 The Trust Universe Comparison Service (TUCS) is a universe of
more than 1,000 client portfolio returns, subdivided by client type and asset class.
3 The Custom Tobacco-Free S&P 500 Index is used as the bench-mark for the U.S. equity segments of the LTCF, starting with the February 2001 performance.
ltCf Investment mix by asset Class ltCf total fund Performance | 10-Year Review, One-Year Returns
18.3% International Equity
49.2% Domestic Debt Securities
27.7% Domestic Equity
4.8% Real Estate
100.0%
’10’09’08’07’06’05’04’03’02’01
(16.
2%)
16.6
%
(6.1
%)
15.2
%
7.1%8.6%
14.2
%
5.3%
(8.2
%)
(3.1
%)
108 | Investment Section | CalPERS Comprehensive Annual Financial Report, Fiscal Year Ended June 30, 2010
110 | Actuarial Section | CalPERS Comprehensive Annual Financial Report, Fiscal Year Ended June 30, 2010
presented in the Financial Section by Governmental Accounting Standards Board Statements No. 25 and No. 43. In our opinion, the actuarial assumptions are internally consistent and produce results which are reasonable in the aggregate.
The valuations are based on the member and financial data as of the valuation date, extracted from the various CalPERS databases. Both the membership and financial data are subject to extensive tests for reasonableness.
Further, information has been provided by us for the completion of (i) the trend data schedules (Required Schedule of Funding Progress and Schedule of Employer Contributions) in the Financial Section, and (ii) Exhibits A through H in the Actuarial Section of the CAFR.
Alan Milligan, F.S.A., F.C.I.A., M.A.A.A., F.C.A.Chief Actuary, CalPERS
As authorized, the CalPERS actuarial staff perform annual actuarial valuations of the CalPERS State, schools, and public agency defined benefit pension plans; the latest such valuations are as of June 30, 2009.
The funding objective for each of these plans is to accumulate assets equal to 100 percent of the accrued liability as measured by the Entry Age Normal Cost method in a manner that keeps contributions approxi-mately level as a percentage of payroll. Unfunded actuarial liabilities or surplus assets (excess assets) are amortized pursuant to Board policy such that the amortization payment is not less than that required to amortize an unfunded liability over 30 years.
The actuarial assumptions and methods used for funding purposes meet the parameters set for disclosures
June 30, 2010
The Board of Administration of the California Public Employees’ Retirement System
ActuarialCertification
Note: Actuarial reports and supporting documents for the State, schools, and local agencies can be obtained through the CalPERS Actuarial and Employer Services Division, PO Box 942709, Sacramento, CA 94229-2709.
CalPERS Comprehensive Annual Financial Report, Fiscal Year Ended June 30, 2010 | Actuarial Section | 111
ActuarialMethods&Assumptions
ACTUARIAL METHODSThe ultimate cost that a retirement system such as CalPERS incurs is equal to benefits paid plus the expenses resulting from administration and financing. These costs are paid through contributions to the plan and investment earnings on the System’s assets.
The actuarial valuations rely upon data extracted from central databases maintained by CalPERS. These databases are created from data supplied by the individual employers. The data was not audited by the actuarial staff, but appears to be reasonable for valuation purposes. Summary information regarding plan membership data for various groups is provided in Exhibits F through H.
Using each plan’s schedule of benefits, member data described above, and a set of actuarial assumptions, the plan’s actuary estimates the cost of the benefits to be paid. Then, using a particular actuarial funding method, the actuary allocates these costs to the fiscal years within the employee’s career.
In the case of the CalPERS plans with pay-related benefits, the financial objective is to fund in a manner which keeps contribution rates approximately as a level percentage of payroll from generation to generation, while accumulating sufficient assets over each member’s working career. The primary funding method used to accomplish this objective is the Entry Age Normal Cost Method. This method is used for all defined benefit pay-related plans within CalPERS and for the Judges’ Retirement System II (JRS II). It is also used for the Indexed Level of 1959 Survivor Benefits. The Public Employees’ Retirement System uses the level dollar Aggregate Cost Method for those pay-related plans which are closed and declining in membership. This method is used for the Legislators’ Retirement System (LRS) and the Judges’ Retirement System (JRS).
For CalPERS non-pay-related plans, the financial objective is to produce annual costs that coincide with the value of benefits earned for that year. The Term Insurance Cost Method is used for the plans within the 1959 Survivor Program that are not indexed and for the State Group Term Life Insurance Program.
Annual actuarial valuations are performed each June 30 using these methods. This report contains information through the most recent valuation date of June 30, 2009.
Progress in financing can be found in the Summary of Funding Progress, Exhibits A and B.
The actuarial assumptions and methods used for funding purposes meet the parameters set for disclosures presented in the Financial Section by Governmental Accounting Standards Board Statement No. 25 and No. 43.
Entry Age Normal Cost MethodUnder the Entry Age Normal Cost Method, projected benefits are determined for all members. For active members, liabilities are spread in a manner that produces level annual costs as a percent of pay in each year from the age of hire (entry age) to the assumed retirement age. The cost allocated to the current fiscal year is called the normal cost. The actuarial accrued liability for active members is then calculated as the portion of the total cost of the plan allocated to prior years.
The actuarial accrued liability for members currently receiving benefits, for active members beyond the assumed retirement age, and for inactive members entitled to deferred benefits is equal to the present value of the benefits expected to be paid. No normal costs are applicable for these participants.
The excess of the total actuarial accrued liability over the value of plan assets is called the unfunded actuarial accrued liability.
The required contribution is then determined by adding the normal cost and an amortization of the unfunded liability as a level percentage of assumed future payroll.
In the CalPERS case, the unfunded liability is broken down into components, or bases, according to their date of origin and the cause that gave rise to that component. A component of the unfunded liability that arose due to a change in plan provisions or in actuarial methods or assumptions is separately tracked and amortized over a declining 20-year period.
The actuarial assumptions discussed in this section are used to determine projected benefits. The effect of differences between those assumptions and the actual experience of the plan is calculated each year when the annual actuarial valuation is performed. These differences are actuarial gains or losses. Gains and losses are tracked separately and amortized over a rolling 30-year period.
112 | Actuarial Section | CalPERS Comprehensive Annual Financial Report, Fiscal Year Ended June 30, 2010
A maximum 30-year amortization payment on the entire unfunded liability is enforced on the amortization methods described above. In addition, for those plans in which the amortization methods described above result in either mathematical inconsistencies or unreasonable actuarial results, all unfunded liability components are combined into a single base and amortized over a period of time, as determined by the CalPERS Chief Actuary. There is a minimum employer contribution equal to normal cost, less 30-year amortization of surplus (negative unfunded liability), if any.
Term Insurance Cost MethodThe actuarial funding method for non-indexed levels of the 1959 Survivor Program is a modified Term Insurance Cost Method. Under this method, there is no actuarial accrued liability for active members; all liability is due to current beneficiaries. The normal cost is calculated as the amount needed to provide benefits to survivors of deaths expected in the next one-year period.
The Term Insurance Cost Method is also used for the State Group Term Life Insurance Program. The required contributions are calculated as one and one-half times the expected life insurance payments for the coming year less the current assets available to pay those benefits, but not less than zero.
Aggregate Cost MethodThe Aggregate Cost Method is used for the LRS and JRS systems. Under this method, the difference between the present value of projected benefits and the assets of the plan is allocated over a specified period of time as a level dollar amount. The amount allocated to the current fiscal year is called the normal cost. There is no actuarial accrued liability calculated using the Aggregate Cost Method.
Asset Valuation MethodIn order to dampen the effect of short-term market value fluctuations on employer contribution rates, the following asset smoothing technique is used. First an Expected Value of Assets would be computed by bringing forward the prior year’s Actuarial Value of Assets and the contributions received and benefits paid during the year at the assumed actuarial rate of return. The Actuarial Value of Assets
would then be computed as the Expected Value of Assets plus one-fifteenth of the difference between the actual Market Value of Assets and the Expected Value of Assets as of the valuation date. Finally, the Actuarial Value of Assets is restricted to no less than 80 percent and no more than 120 percent of the Market Value of Assets. This methodol-ogy is used in the valuations for all programs except the JRS, which uses an Actuarial Value of Assets equal to the Market Value of the Fund plus accrued interest.
In December 2009, the CalPERS Board adopted changes to the asset smoothing method in order to phase in over a three-year period the impact of the negative 24.0 percent investment loss experienced by CalPERS in fiscal year 2008-09. The following changes were adopted for all public agency, the State and School plans:• For the June 30, 2009 valuation increase the corridor
limits for the actuarial value of assets from 80-120 percent to 60-140 percent of the market value of assets.
• For the June 30, 2010 valuation reduce the corridor limits for the actuarial value of assets to 70-130 percent of the market value of assets.
• And in the June 30, 2011 valuation and thereafter return to the 80-120 percent of market value corridor limits for the actuarial value of assets.
ACTUARIAL ASSUMPTIONSThe actuarial assumptions used in determining actuarial liabilities and required employer contributions include both economic and non-economic assumptions. These assump-tions represent the actuary’s best estimate of anticipated future experience and are reviewed in depth periodically.
Economic AssumptionsThe economic assumptions include an assumed inflation assumption of 3.0 percent compounded annually. The inflation assumption is a component of assumed invest-ment return, assumed wage growth, and assumed future post-retirement cost-of-living increases.
Based upon the asset allocation of the Public Employees’ Retirement Fund (PERF), the assumed investment return (net of administrative and investment expenses) is 7.75 percent per year, compounded annually. Different asset allocations and lower assumed investment returns apply to LRF, JRF, and JRF II.
Actuarial Methods & Assumptions (continued)
CalPERS Comprehensive Annual Financial Report, Fiscal Year Ended June 30, 2010 | Actuarial Section | 113
The assumed investment returns for these three plans are 7.0 percent, 4.5 percent, and 7.25 percent, respectively.
For plans within CalPERS, the overall payroll is assumed to increase 3.25 percent annually. This is based upon the 3.0 percent inflation assumption and a 0.25 percent per annum productivity increase assumption. The overall payroll growth assumption is used to project future payroll over which the unfunded liability is amortized.
For plans within CalPERS, the assumed growth in an individual employee’s future pay is composed of the 3.0 percent inflation component, an additional 0.25 percent per annum productivity component, and an annual merit increase based on the member’s length of service. The service-based merit increase in an individual’s salary recognizes that larger salary increases tend to occur earlier in an employee’s career. Pay increase assumptions for individual members are shown for sample lengths of service in Exhibit C.
Non-Economic AssumptionsNon-economic assumptions for plans within the PERF are based upon demographic studies covering the period June 30, 1997 through June 30, 2007. The probabilities of service retirement, withdrawal from service, non-industrial disability, industrial disability, and death-in-service are shown for sample ages in Exhibit D. Individuals hired on or before June 30, 1982, are entitled to subsidized optional benefits. Certain valuation liabilities are increased to reflect this subsidy.
Post-retirement mortality tables are based on CalPERS experience. These tables are used to estimate the value of benefits expected to be paid for service and disability retirements. For disability retirements, impaired longevity is recognized by a separate table. Sample life annuity values based on these tables are shown in Exhibit E.
ChANgES SiNCE Prior VAluAtioNChanges in Actuarial MethodsIn December 2009, the CalPERS Board adopted changes to the asset smoothing method as well as changes to the Board policy on the amortization of gains and losses in order to phase in over a three-year period the impact of the negative 24.0 percent investment loss experienced by CalPERS in fiscal year 2008-09. The following changes were adopted for all plans:
• Increase the corridor limits for the actuarial value of assets from 80-120 percent of market value to 60-140 percent of market value on June 30, 2009.
• Reduce the corridor limits for the actuarial value of assets to 70-130 percent of market value on June 30, 2010.
• Return to the 80-120 percent of market value corridor limits for the actuarial value of assets on June 30, 2011 and thereafter.
• Isolate and amortize all gains and losses during fiscal year 2008-09, 2009-10 and 2010-11 over fixed and declining 30-year periods (as opposed to the current rolling 30-year amortization).
In addition, in February 2010, the CalPERS Board adopted a resolution requiring additional contributions for any plan if their cash flows hampered adequate funding progress by preventing the expected funded status on a market value of assets basis of the plan to either:• Increase by at least 15 percent by June 30, 2043; or • Reach a level of 75 percent funded by June 30, 2043.
Changes in Actuarial AssumptionsIn April 2010, the CalPERS Board approved new demo-graphic actuarial assumptions for all plans for use in the June 30, 2009 actuarial valuations and beyond. The new actuarial assumptions were based on an experience study of CalPERS membership data for the 10-year period ending on June 30, 2007.
Overall, the new actuarial assumptions predict:• Longer post-retirement life expectancy. The life
expectancy of males at retirement is increasing on average by a full year while it is increasing on average by about 0.3 year for females.
• Slightly earlier retirement ages overall.• Higher salary increases for members with longer service.• Mixed results for other assumptions.
Changes in Plan ProvisionsPublic agencies can make changes to their plan provisions, and such changes occur on an ongoing basis. A summary of the plan provisions that were used for a specific plan can be found in Appendix B of the plan’s annual valuation report.
Actuarial Methods & Assumptions (continued)
114 | Actuarial Section | CalPERS Comprehensive Annual Financial Report, Fiscal Year Ended June 30, 2010
UNFUNDED LIABILITY & FUNDED RATIOSFor the plans in CalPERS, unfunded actuarial accrued liabilities are the difference between Entry Age Normal Accrued Liabilities and the assets of the Fund. It is required that these unfunded liabilities be financed systematically over future years.
Because of inflation, comparing the dollar amounts of assets, benefits paid, member salaries, and unfunded actuarial accrued liabilities can be misleading. While no one or two measures can fully describe the financial condition of a plan, the ratio of a pension plan’s actuarial value of assets to its liabilities provides a meaningful index. However, a better measure is the funded ratio based on the market value of assets. This is the true measure of a plan’s
ability to pay benefits. The higher this ratio, the stronger the plan and observation of this ratio over a period of years can give an indication as to the financial strength of the system. Both these measures are presented in Exhibit A.
SOLVENCY TESTExhibit B, Funding Progress — Solvency Test, demonstrates System solvency as measured under the Governmental Accounting Standards Board Statement No. 25.
INDEPENDENT REVIEWTo ensure the quality of its valuations, CalPERS contracts with independent consulting actuaries to review the valuations on a triennial basis.
SummaryofFundingProgress
CalPERS Comprehensive Annual Financial Report, Fiscal Year Ended June 30, 2010 | Actuarial Section | 115
Notes:1 The funded ratio based on the market value of assets is the true
measure of the plan’s ability to pay benefits.2 The Unfunded Actuarial Accrued Liability (the total Actuarial
Liability in excess of actuarial value of assets) of the PERF by major employer group from the June 30, 2009 valuation is as follows: 1) $23,483 for the State of California, 2) $5,777 for schools, and 3) $19,818 for public agencies.
3 The amounts previously reported as of June 30, 2009 in the fiscal year 2008-09 financial statements were revised to reflect the valuation results for new plan participants. The revised data reflects the individual actuarial valuations of 258 employers participating in the CERBTF as of June 30, 2010, aligned to a measurement date of June 30, 2009 in compliance with GASB Statement 57.
116 | Actuarial Section | CalPERS Comprehensive Annual Financial Report, Fiscal Year Ended June 30, 2010
Reconciliation Between the Net Assets Held in Trust for Pension Benefits and the Net Assets Allocated to Fund the Pension Benefit Obligation or the Actuarial Liability – June 30, 2009.
CalPERS Comprehensive Annual Financial Report, Fiscal Year Ended June 30, 2010 | Actuarial Section | 117
The funding objective for a retirement system is to be able to pay long-term benefit promises through contributions that remain approximately level from year to year as a percent of salaries earned by members. In this way, members and employers in each year pay their fair share for retirement services accrued in that year by the retire-ment system’s members.
If a system follows level contribution rate financing principles, it will pay all promised benefits when due — the ultimate test of financial soundness.
A short-term solvency test is one means of checking a system’s funding progress. In a short-term solvency test, the plan’s present assets (investments and cash) are com-pared with 1) member contributions on deposit, 2) the liabilities for future benefits to persons who have retired
or terminated, and 3) the liabilities for projected benefits for service already rendered by active members. In a system that has been following the discipline of level contribution rate financing, the liabilities for member contributions on deposit (liability 1) and the liabilities for future benefits to present retirees (liability 2) will be fully covered by present assets, except in rare circumstances.
In addition, the liabilities for service already rendered by members (liability 3) will be partially covered by the remainder of present assets. Generally, if the system has been using level contribution rate financing, the funded portion of liability 3 will increase over time.
Exhibit B illustrates the progress of funding liability of the PERF, JRF, JRF II, and LRF.
Exhibit B: Funding Progress – Solvency Test
Accrued Liability
Portion of Actuarial AccruedLiabilities Covered by
CalPERS Comprehensive Annual Financial Report, Fiscal Year Ended June 30, 2010 | Actuarial Section | 119
3 State Miscellaneous Tier 2 members have the right to convert their Tier 2 service to Tier 1 service provided that they make up the shortfall in their accumulated contributions with interest. The assumption is that all Tier 2 members will elect to convert to Tier 1 service.
Notes: 1 Age for Termination with Refund and Termination with Vested
Deferred Benefits means Entry Age. For all other decrements, age means Attained Age.
2 Years of service.
ExhibitD:SampleNon-EconomicAssumptions
State Miscellaneous First Tier | Probability of an active member leaving due to:
NoTE: Counts of members included in the valuation are counts of the records processed by the valuation. Multiple records may exist for those who have service in more than one valuation group. This does not result in double counting of liabilities.
130 | Actuarial Section | CalPERS Comprehensive Annual Financial Report, Fiscal Year Ended June 30, 2010
Exhibit G: Members in Valuation (continued)
State Safety | By Attained Age & Years of Service – June 30, 2009
Attained Age
Distribution of Active Members by Age & Service Years of Service at Valuation Date
TotalTotal
Valuation Payroll0-4 5-9 10-14 15-19 20-24 25 & up
Note: Counts of members included in the valuation are counts of the records processed by the valuation. Multiple records may exist for those who have service in more than one valuation group. This does not result in double counting of liabilities.
CalPERS Comprehensive Annual Financial Report, Fiscal Year Ended June 30, 2010 | Actuarial Section | 131
Exhibit G: Members in Valuation (continued)
School | By Attained Age & Years of Service – June 30, 2009
Attained Age
Distribution of Active Members by Age & Service Years of Service at Valuation Date
TotalTotal
Valuation Payroll0-4 5-9 10-14 15-19 20-24 25 & up
Note: Counts of members included in the valuation are counts of the records processed by the valuation. Multiple records may exist for those who have service in more than one valuation group. This does not result in double counting of liabilities.
132 | Actuarial Section | CalPERS Comprehensive Annual Financial Report, Fiscal Year Ended June 30, 2010
Exhibit H: Schedule of Retirees & Beneficiaries Added to/and Removed from Rolls
Year Ended
Added to Rolls Removed from Rolls Rolls - End of Year% Increase in Annual
Note: These total counts and allowances are for service, disability, and industrial retirement, special death, 1957 Survivor, Pre-Retirement Option 2, and 1959 Survivor beneficiaries and non-members. This information was reviewed by the CalPERS Actuarial staff and appears to be reasonable.
CalPERS Comprehensive Annual Financial Report, Fiscal Year Ended June 30, 2010 | Actuarial Section | 133
JUDGES’ RETIREMENT SYSTEM
May 2010
Actuarial CertificationAs authorized by the CalPERS Board of Administration, we perform an annual actuarial valuation of the Judges’ Retirement System; the latest such valuation is as of June 30, 2009.
To the best of our knowledge, the report is complete and accurate and contains sufficient information to fully and fairly disclose the actuarial funded condition of the Judges’ Retirement System, as of June 30, 2009. Based on the employee data provided by the CalPERS Judges’ and Legislators’ Office, the statement of assets provided by the CalPERS Fiscal Services Division, and the benefits as outlined in Appendix B, it is our opinion that the valua-tion has been performed in accordance with generally accepted actuarial principles and that the assumptions and methods, as prescribed by the CalPERS Board of Administration, are reasonable for the System.
Further, information has been provided by us for the completion of (i) the trend data schedules (Required Schedule of Funding Progress and Schedule of Employer Contributions) in the Financial Section, and (ii) Exhibits A through H in the Actuarial Section of the CAFR.
Gale D. Patrick, F.S.A., M.A.A.A.Enrolled ActuarySenior Pension Actuary, CalPERS
Alan Milligan, F.S.A., F.C.I.A., M.A.A.A., F.C.A.Chief Actuary, CalPERS
JUDGES’ RETIREMENT SYSTEM II
May 2010
Actuarial CertificationAs authorized by the CalPERS Board of Administration, we perform an annual actuarial valuation of the Judges’ Retirement System II; the latest such valuation is as of June 30, 2009.
To the best of our knowledge, the report is complete and accurate and contains sufficient information to fully and fairly disclose the actuarial funded condition of the Judges’ Retirement System II, as of June 30, 2009. Based on the employee data provided by the Judges’ Retirement System administrative staff at CalPERS, the statement of assets provided by the CalPERS Fiscal Services Division, and the benefits as outlined in Appendix B, it is our opinion that the valuation has been performed in accor-dance with generally accepted actuarial principles and that the assumptions and methods are reasonable for this plan.
Further, information has been provided by us for the completion of (i) the trend data schedules (Required Schedule of Funding Progress and Schedule of Employer Contributions) in the Financial Section, and (ii) Exhibits A through H in the Actuarial Section of the CAFR.
May Shuang Yu, A.S.A., M.A.A.A.Senior Pension Actuary, CalPERS
Alan Milligan, F.S.A., F.C.I.A., M.A.A.A., F.C.A.Chief Actuary, CalPERS
ActuarialCertifications–OtherSystems
Note: The actuarial report and supporting documents for the Judges’ Retirement System, Judges’ Retirement System II, and Legislators’ Retirement System can be obtained through the CalPERS Actuarial and Employer Services Division, P.O. Box 942709, Sacramento, CA 94229-2709.
134 | Actuarial Section | CalPERS Comprehensive Annual Financial Report, Fiscal Year Ended June 30, 2010
LEGISLATORS’ RETIREMENT SYSTEM
May 2010
Actuarial CertificationAs authorized by the CalPERS Board of Administration, we perform an annual actuarial valuation of the Legislators’ Retirement System; the latest such valuation is as of June 30, 2009.
To the best of our knowledge, the report is complete and accurate and contains sufficient information to fully and fairly disclose the actuarial funded condition of the Legislators’ Retirement System. Based on the employee data provided by the CalPERS Judges’ and Legislators’ Office, the statement of assets provided by the CalPERS Fiscal Services Division, and the benefits plans as outlined in Appendix B, it is our opinion that the valuation has been performed in accordance with generally accepted actuarial principles and that the assumptions and methods are reasonable for the System.
Further, information has been provided by us for the completion of (i) the trend data schedules (Required Schedule of Funding Progress and Schedule of Employer Contributions) in the Financial Section, and (ii) Exhibits A through H in the Actuarial Section of the CAFR.
David Clement, A.S.A., M.A.A.A.Enrolled ActuarySenior Pension Actuary, CalPERS
Alan Milligan, F.S.A., F.C.I.A., M.A.A.A., F.C.A.Chief Actuary, CalPERS
Actuarial Certifications – Other Systems (continued)
Note: The actuarial report and supporting documents for the Judges’ Retirement System, Judges’ Retirement System II, and Legislators’ Retirement System can be obtained through the CalPERS Actuarial and Employer Services Division, P.O. Box 942709, Sacramento, CA 94229-2709.
Statistical Section
136 IntroductiontotheStatisticalSection
136 ExpensesbyType–RetirementPrograms
138 RevenuesbySource–RetirementPrograms
140 ChangesinNetAssets–RetirementPrograms
142 Membership&RetirementData–RetirementPrograms
144 ProgramData
152 PublicAgencyEmployers
166 Judges’RetirementSystemProgramData
169 Judges’RetirementSystemIIProgramData
172 Legislators’RetirementSystemProgramData
136 | Statistical Section | CalPERS Comprehensive Annual Financial Report, Fiscal Year Ended June 30, 2010
The Statistical section provides additional historical information to assist in using the Basic Financial Statements, Notes to the Basic Financial Statements, and Required Supplementary Schedules to understand the economic condition of the California Public Employees’ Retirement System.
The schedules presented contain information on finan-cial trends, analysis, and additional analytical information
TOTAL MEMBERS 1,216 1,134 993 926 844 757 696 627 532 463
Notes:1 Starting with the June 30, 2006 Comprehensive Annual
Financial Report, CalPERS changed the mechanism for reporting this category.
2 This total differs from Total Benefit Recipients on pages 42 and 149. Total Benefit Recipients shown here include Active Death Benefits paid as a result of a member death prior to retirement.
144 | Statistical Section | CalPERS Comprehensive Annual Financial Report, Fiscal Year Ended June 30, 2010
ProgramData
PRIMARY BENEFITSBenefits are paid according to the category of employment and the type of benefit coverage provided by an employer. Local agencies have variations in benefits due to their specific contract obligations with CalPERS.
The four categories of membership are:• Miscellaneous Members – staff, operational, supervisory,
and all other eligible employees who are not in special membership categories.
• Safety Members – California Highway Patrol officers, police officers, firefighters, and other employees whose principal duties are in active law enforcement or fire prevention and suppression work, or who occupy positions designated by law as safety member positions.
• State Industrial Members – employees of the Department of Corrections and the California Youth Authority who have the same service retirement and other benefits as miscellaneous members, but who also have industrial death and disability benefits under certain limited circumstances.
• State Peace Officer/Firefighter Members – State employees who are involved in law enforcement, firefighting and fire suppression, public safety, protective services, or the management and supervision thereof, whose positions are defined as State peace officer/firefighter members in the Government Code or by the Department of Personnel Administration.
SEPARATION FROM EMPLOYMENT/REFUNDSAt permanent separation from employment, members may either leave their contributions on deposit and defer retirement 1 or terminate membership by electing to take a refund of member contributions plus interest (compounded annually). With a refund election, CalPERS is required to deduct federal withholding of 20 percent from the untaxed portion of the refund, unless the taxable portion is directly rolled over to a qualified plan or IRA.
SERVICE RETIREMENTState Miscellaneous & State Industrial Members (First Tier), School Members & University Members 2 Percent at 55 Formula• Service not coordinated with Social Security – A guaran-
tee of 2 percent of final compensation2 at age 55 for each year of service credit. Retirement may begin at age 50
with a reduced benefit rate, or after age 55 with an increased benefit rate to age 63.
• Service coordinated with Social Security – Same basic benefit rate; however, there is a reduction of $133.33 from the final compensation before benefits are determined.
School members with service credit rendered after January 1, 2001: final compensation will not be reduced by $133.33.
State Miscellaneous & State Industrial Members Separated from Service Prior to January 1, 2000, 2 Percent at 60 Formula• Service not coordinated with Social Security – A guaran-
tee of 2 percent of final compensation at age 60 for each year of service credit. Retirement may begin at age 50 with a reduced benefit rate, or after age 60 with an increased benefit rate to age 63.
• Service coordinated with Social Security – Same basic benefit rate; however, there is a reduction of $133.33 from the final compensation before benefits are determined.
State Miscellaneous & State Industrial Members (Second Tier) 1.25 Percent at 65 Formula A guarantee of 1.25 percent of final compensation at age 65 for each year of service credit. Retirement may begin at age 55, or as early as age 50 (if there is a combination of First Tier and Second Tier service; a reduced benefit rate will apply).
Local Miscellaneous Members 2 Percent at 60 Formula• Service not coordinated with Social Security – A guaran-
tee of 2 percent of final compensation at age 60 for each year of service credit. Retirement may begin at age 50 with a reduced benefit rate, or after age 60 with an increased benefit rate to age 63.
Notes:1 A member who has less than the required amount of service
credit must return to CalPERS-covered employment to obtain the minimum service credit required to be eligible for retirement.
2 The term “final compensation” appears throughout this section. It means the average payrate and special compensation over the last one year or three consecutive years of employment unless the member elects a different period with a higher average.
CalPERS Comprehensive Annual Financial Report, Fiscal Year Ended June 30, 2010 | Statistical Section | 145
Program Data (continued)
• Service coordinated with Social Security – Same basic benefit rate; however, there is a reduction of $133.33 from the final compensation before benefits are determined.
Local Miscellaneous Members 2 Percent at 55 Formula• Service not coordinated with Social Security – A guaran-
tee of 2 percent of final compensation at age 55 for each year of service credit. Retirement may begin at age 50 with a reduced benefit rate, or after age 55 with an increased benefit rate to age 63.
• Service coordinated with Social Security – Same basic benefit rate; however, there is a reduction of $133.33 from the final compensation before benefits are determined.
Local Miscellaneous Members 2.5 Percent at 55 Formula• Service not coordinated with Social Security – A guaran-
tee of 2.5 percent of final compensation at age 55 for each year of service credit. Retirement may begin at age 50 with a reduced benefit rate.
• Service coordinated with Social Security – Same basic benefit rate; however, there is a reduction of $133.33 from the final compensation before benefits are determined.
Local Miscellaneous Members 2.7 Percent at 55 Formula• Service not coordinated with Social Security – A guaran-
tee of 2.7 percent of final compensation at age 55 for each year of service credit. Retirement may begin at age 50 with a reduced benefit rate.
• Service coordinated with Social Security – Same basic benefit rate; however, there is a reduction of $133.33 from the final compensation before benefits are determined.
Local Miscellaneous Members 3 Percent at 60 Formula• Service not coordinated with Social Security – A guaran-
tee of 3 percent of final compensation at age 60 for each year of service credit. Retirement may begin at age 50 with a reduced benefit rate.
• Service coordinated with Social Security – Same basic benefit rate; however, there is a reduction of $133.33 from the final compensation before benefits are determined.
Local Safety Members 2 Percent at 50 Formula2 percent of final compensation for each year of service for retirement at age 50, with an increased benefit rate to
age 55. The maximum allowance payable is 90 percent of final compensation.
State Safety Members & Local Safety Members 2 Percent at 55 Formula2 percent of final compensation for each year of service for retirement at age 55. The maximum allowance payable is 80 percent of final compensation for State safety members and 90 percent for local safety members. Retirement may begin at age 50 with a reduced benefit rate.
Local Safety Members Half Pay at 55 FormulaThis benefit is no longer available as a contract amend-ment. Only a small number of local agencies are still covered under this formula which guarantees one-half of final compensation at age 55 with 20 or more years of service credit. Retirement may begin at age 50 with a reduced benefit rate.
State Safety Members & Local Safety Members 2.5 Percent at 55 FormulaThis benefit is no longer available as a contract amend-ment. It provides 2.5 percent of final compensation for each year of service for retirement at age 55. The maxi-mum allowance payable is 80 percent of final compensa-tion for State safety members and 90 percent for local safety members. Retirement may begin at age 50 with a reduced benefit rate.
State Patrol Members, Local Safety Members & State Peace Officer/Firefighter Members 3 Percent at 50 Formula3 percent of final compensation for each year of service for retirement at age 50. The maximum allowance payable is 90 percent of final compensation for State patrol members, local safety members, and State peace officer/firefighters.
State Peace Officer/Firefighter Members & Local Safety Members 3 Percent at 55 Formula3 percent of final compensation for each year of service for retirement at age 55. The maximum allowance payable is 90 percent for State peace officer/firefighter members and local safety members. Retirement may begin at age 50 with a reduced benefit rate.
146 | Statistical Section | CalPERS Comprehensive Annual Financial Report, Fiscal Year Ended June 30, 2010
DISABILITY RETIREMENTFor Most MembersA monthly allowance of 1.8 percent of final compensation for each year of service, improved under certain conditions to 33 1 ⁄3 percent of final compensation, applicable to members with at least five years of service credit.
By Contract Amendment Only for Local AgenciesA monthly allowance of 30 percent of final compensation, plus an additional 1 percent for each year of service over five years to a maximum of 50 percent.
For State Second Tier MembersA monthly allowance of 1.125 percent of final compensa-tion for each year of service, improved under certain conditions to 33 1 ⁄3 percent of final compensation, applicable to members with at least 10 years of service credit or five years if credited as of January 1, 1985.
For Certain Local Public Agency MembersA monthly allowance of 1.35 percent of final compensation for each year of service, improved under certain conditions to 33 1 ⁄3 percent of final compensation, applicable to members with at least five years of service credit.
INDUSTRIAL DISABILITY RETIREMENTFor Most MembersA monthly allowance of 50 percent of final compensation, applicable to patrol members, State and local safety members, State peace officer/firefighter members, State industrial members, local miscellaneous members (by contract amendment only), and certain State miscellaneous members defined by law. The injury or illness must be job related and the member must be serving in one of these categories at the time the industrial disability occurs. California Highway Patrol members may be entitled to an enhanced benefit if specific qualifying factors are met.
By Contract Amendment Only for Local AgenciesA monthly allowance of 75 percent of final compen sation, if found totally disabled.
By Contract Amendment Only for Local AgenciesA monthly allowance of 50 percent to 90 percent of final compensation, depending on the disability rating by the Workers’ Compensation Appeals Board.
DEATH BENEFITS (BEFORE RETIREMENT)Basic Death Benefit – All Members Except State EmployeesEligible to retire or not – A return of member contribu-tions plus interest (compounded annually) and an employer-paid portion equal to one month’s compensation earnable for each year of current service to a maximum of six months.
Basic Death Benefit – State Employees OnlyEligible to retire or not eligible to retire with 20 years or more of State service credit – A return of member contributions plus interest (compounded annually) and a State-paid portion equal to six months’ pay (50 percent of the member’s earnable pay for the 12 months prior to the member’s death).
Not eligible to retire with less than 20 years of State service credit – A return of only the member contributions plus interest (compounded annually).
Insurance Benefit – State Employees OnlyEligible to retire or not eligible to retire with 20 years or more of State service credit – $5,000 in a lump sum.
Not eligible to retire with less than 20 years of State service credit – $5,000 in a lump sum plus six months’ pay (50 percent of annual compensation).
Alternate Death Benefit 1 – For State Members in Bargaining Units Contracting for this Benefit, Who are Not Eligible to Retire, With 20 Years or More of State Service CreditA monthly allowance payable to a surviving spouse or registered domestic partner until death, then to children under age 18. It is calculated similarly to pre-retirement
Note:1 The surviving spouse or registered domestic partner of other
than a State member, or a guardian of a minor child, may elect the Basic Death Benefit or the 1957 Survivor Benefit. The surviving spouse or registered domestic partner of a State member may elect the Basic Death Benefit or the Pre-Retirement Option 2W Death Benefit.
Program Data (continued)
CalPERS Comprehensive Annual Financial Report, Fiscal Year Ended June 30, 2010 | Statistical Section | 147
Option 2W (if the beneficiary is a spouse or registered domestic partner), or like a 1957 Survivor Benefit (if the beneficiary is a minor child), as though the member had been old enough to retire. A spouse or registered domestic partner or minor child may receive continued health and dental insurance with the Alternate Death Benefit.
Alternate Death Benefit for Firefighters – Local Agency Employ-ers Contracting for this Benefit, With 20 Years or More of Total Service CreditA monthly non-job-related allowance payable to a surviv-ing spouse or registered domestic partner until death, then to children under age 18. It is calculated similarly to Pre-Retirement Option 2W (if the beneficiary is a spouse or registered domestic partner, even if the agency does not contract separately for the Pre-Retirement Option 2W benefit), or like a 1957 Survivor Benefit (if the beneficiary is a minor child), as though the member had either been old enough to retire (if the member died before reaching retirement age), or based on the member’s actual age if the member was eligible to retire at the time of death. This benefit applies to all service credit earned by the member, including service that may have been earned with a local agency that does not contract for the Alternate Death Benefit, as long as the member was employed at the time of death by a local agency that provides this benefit in their contract.
Pre-Retirement Option 2W Benefit – Local Agencies by Contract, Married, or Registered Domestic PartnershipA monthly allowance payable to the surviving spouse or registered domestic partner until death, then to children under age 18, equal to what the deceased member would have received had they retired on the date of their death and elected Option 2W.
Pre-Retirement Option 2W Benefit 1 – For All State Members, Married, or Registered Domestic PartnershipA monthly allowance payable to the surviving spouse or registered domestic partner until death, then to children under age 18, equal to what the deceased member would have received had they retired on the date of their death and elected Option 2W.
1957 Survivor Benefit 1 – Local & School Members, Married, or Registered Domestic PartnershipFor all members eligible to retire who are married or in a registered domestic partnership, a monthly allowance payable to the surviving spouse or registered domestic partner until death, then to children under age 18, equal to one-half of the highest allowance (unmodified) the member would have received had they retired on the date of death.
1957 Survivor Benefit 1 – All Members, Not Married, or No Registered Domestic Partnership For all members eligible to retire who are not married or in a registered domestic partnership, a monthly allowance payable to the unmarried surviving minor children until age 18, equal to one-half of the highest allowance (unmod-ified) the member would have received had they retired on the date of death. Once allowance stops, the total allow-ance paid is compared to the Basic Death Benefit amount, and any difference is paid in a lump sum to all of the member’s surviving children.
1959 Survivor Benefit – State & School Members & by Contract Option, Local Agency Members Not Coordinated With Social SecurityA monthly benefit paid to survivors of deceased members who died prior to retirement. This benefit is similar to the Social Security Survivor Benefit and is paid in addition to any other applicable pre-retirement death benefit, except the Special Death Benefit.
Note:1 The surviving spouse or registered domestic partner of other
than a State member, or a guardian of a minor child, may elect the Basic Death Benefit or the 1957 Survivor Benefit. The surviving spouse or registered domestic partner of a State member may elect the Basic Death Benefit or the Pre-Retirement Option 2W Death Benefit.
Program Data (continued)
148 | Statistical Section | CalPERS Comprehensive Annual Financial Report, Fiscal Year Ended June 30, 2010
Special Death Benefit 1 – Survivors of Patrol, State & Local Safety, State Industrial & State Peace Officer/Firefighter Members, State Miscellaneous 2 & Local Miscellaneous by Contract Amendment 2
A monthly allowance equal to 50 percent of final compensation payable to the surviving spouse or registered domestic partner until death, or if no spouse, to natural or adopted unmarried children up to age 22. The monthly allowance is recalculated annually on October 1 based on the salary rates for employees who work in the position the member held at the time of death until such time as the member would have attained age 50.
Special Death Benefit 1 – Violent DeathProvides increased benefits (up to 75 percent of final compensation) based upon the number of surviving children, if the member’s death is the result of external violence or physical force.
DEATH BENEFITS (AFTER RETIREMENT)Retired Death Benefit – State Members OnlyA $2,000 lump sum payable in addition to any optional settlement elected.
Retired Death Benefit – School Members OnlyA $2,000 lump sum payable in addition to any optional settlement. The amount may be increased to $3,000, $4,000, or $5,000 depending on the employer contract.
Retired Death Benefit – Local & School MembersA $500, $600, $2,000, $3,000, $4,000, or $5,000 lump sum (depending on the employer contract) payable in addition to any optional settlement elected.
Survivor Continuance Benefit – State Members, School Members & by Contract Option, Local Agency Members• Service not coordinated with Social Security – 50 percent
of the deceased member’s unmodified retirement allowance amount will continue to an eligible survivor.
• Service coordinated with Social Security – 25 percent of the deceased member’s unmodified retirement allow-ance amount will continue to an eligible survivor.
OPTIONAL SETTLEMENTSFor All MembersAll the disability and service retirement allowances discussed in this section are the highest (unmodified) allowances payable to a retired member. There are six optional settlements to allow a member to reduce their allowance to provide a benefit to a named beneficiary at the member’s death. Under two of these options, if the beneficiary predeceases the member, the member’s allowance will be increased to the higher (unmodified) amount.
COST-OF-LIVING ADJUSTMENTS (COLA)For All Members – Except State Second TierA maximum of 2 percent compounded annually (up to 5 percent maximum as a contract option for retired members of local agencies). Note: Does not apply to the Pre-Retirement 1959 Survivor Death Benefit.
For State Second Tier Members OnlyA fixed 3 percent compounded annually.
Program Data (continued)
Notes:1 The Special Death Benefit is payable if the member’s death is
job related.2 The survivor of a State or local miscellaneous member qualifies
for the Special Death Benefit if the member was killed or fatally injured while performing their official duties.
CalPERS Comprehensive Annual Financial Report, Fiscal Year Ended June 30, 2010 | Statistical Section | 149
Benefit Recipients by Employer Category 4
Employer/Category Retired
MembersSurvivors &
Beneficiaries Total
State Miscellaneous – First Tier 111,626 20,059 131,685State Miscellaneous – Second Tier 2,513 490 3,003State Industrial – First Tier 4,395 592 4,987State Industrial – Second Tier 132 18 150Highway Patrol 6,228 955 7,183State Safety 29,172 3,147 32,319Peace Officer/Firefighter 3,427 251 3,678TOTAL STATE 157,493 25,512 183,005
School – Miscellaneous 146,549 20,001 166,550School – Safety — — —TOTAL SCHOOL 146,549 20,001 166,550
Public Agency – Miscellaneous 101,148 13,393 114,541Public Agency – Safety 37,306 4,460 41,766TOTAL PUBLIC AGENCY 138,454 17,853 156,307
TOTAL 442,496 63,366 505,862
Notes:1 The Alternate Retirement Program (ARP) is a mandated savings
plan for State miscellaneous and industrial members hired after August 11, 2004, during their first two years of employment. While contributing to ARP during that period, they are also “non-contributing” CalPERS members.
2 The number of University of California members continues to decline since new employees must join the University of California Retirement System (UCRS).
3 These payments were made from the Purchasing Power Protection Account, which is structured to maintain current benefit levels and to restore CalPERS allowances to 75 percent of their original purchasing power (80 percent for public agencies).
4 The actual number of benefit recipients is by the employer category from which they retired, regardless of whether they had service in other employer categories. The total includes only those recipients receiving a monthly allowance, and does not include recipients of one-time only payments.
Program Data (continued)
Active & Inactive Members
Employer/Category Active Inactive Total
State Miscellaneous – First Tier 145,530 47,375 192,905 State Miscellaneous – Second Tier 7,945 23,234 31,179 State Industrial – First Tier 10,670 1,128 11,798 State Industrial – Second Tier 831 995 1,826 State ARP 1 12,399 4,078 16,477 Highway Patrol 7,320 269 7,589 State Safety 24,521 4,784 29,305 Peace Officer/Firefighter 44,008 5,429 49,437 University of California 2 2 54 56 TOTAL STATE MEMBERS 253,226 87,346 340,572
School – Miscellaneous 299,337 127,152 426,489 School – Safety 590 132 722 TOTAL SCHOOL MEMBERS 299,927 127,284 427,211
Public Agency – Miscellaneous 202,242 87,309 289,551 Public Agency – Safety 48,899 9,811 58,710 TOTAL PUBLIC AGENCY MEMBERS 251,141 97,120 348,261
TOTAL MEMBERS 804,294 311,750 1,116,044
Benefit Payments by Type
Category Amount Paid
Service Retirement $10,886,413,443 Disability Retirement 540,419,698 Industrial Disability Retirement 1,276,846,198 PPPA Payments 3 51,590,524 TOTAL $12,755,269,863
Basic Death Benefit/Group Term Life Insurance $42,385,815 1957 Survivor Benefit 69,745,915 1959 Survivor Benefit 33,158,971 Industrial Death Allowance 37,042,156 Option 1, Temporary Annuity, Other Lump-Sum Death Benefits & Other Prior Year Adjustments 34,855,181 TOTAL $217,188,038
GRAND TOTAL $12,972,457,901
150 | Statistical Section | CalPERS Comprehensive Annual Financial Report, Fiscal Year Ended June 30, 2010
GRAND TOTAL $13,154,845,524 $12,018,619,512 $11,066,832,280 $10,252,129,496 $9,407,002,930 $8,589,355,052
Note:1 Includes “penalty interest” of $2,767 for pre-retirement and
$6,098 for post-retirement death payments. Penalty interest is required when CalPERS is unable to pay death benefits within 45 days of receiving all documents establishing entitlement. The penalty interest rate is paid for each day exceeding the 45-day time limit, based on the interest crediting rate or the net earnings rate (including capital gains and losses) whichever is greater.
CalPERS Comprehensive Annual Financial Report, Fiscal Year Ended June 30, 2010 | Statistical Section | 151
Program Data (continued)
Average Benefit Payments – As of June 30, 2009 | Six-Year Review
152 | Statistical Section | CalPERS Comprehensive Annual Financial Report, Fiscal Year Ended June 30, 2010
TWO YEARS OF ADDITIONAL SERVICE CREDIT – “GOLDEN HANDSHAKE”Contracting agencies may amend their contracts to provide additional service credit if there are impending mandatory transfers, layoffs, or demotions. Eligible employees who retire within a 90- to 180-day window period established by the employer receive two years additional service credit. The County Offices of Education may also contract for this benefit when there is an impending curtailment of, or change, in the manner of performing services, and their best interest would be served by granting the additional service credit. Once the contract is amended, the employer may establish additional window periods.
In the 2009-10 fiscal year, 34 public agencies amended their contracts to provide the two years of additional service credit and 42 additional window periods were established. The County Offices of Education established 35 additional window periods for the Golden Handshake benefit.
POPULAR BENEFIT AMENDMENTS
BenefitNumber of
amendments
2.5% at 55 Miscellaneous Formula 7
2.7% at 55 Miscellaneous Formula 3
One Year Final Compensation 6
Fourth Level of 1959 Survivor Benefits 6
2% at 55 Miscellaneous Formula 1
3% at 50 Safety Formula 5
3% at 55 Safety Formula 1
Pre-Retirement Optional Settlement 2 Death Benefit 4
Different Level of Benefits 17
PublicAgencyEmployers
CONTRACT ACTIONS SUMMARYOn June 30, 2010, 1,543 public agency contracts provided retirement, death, and survivor benefits for participants of 57 County Offices of Education; four school district offices; 449 cities and towns; 36 counties; and 997 districts and other public agencies. Agencies that have zero partici-pants were excluded. The 57 County Offices of Education contracts provide benefits for 1,490 school districts and charter schools, bringing the total number of public agency employers to 3,033.
Added Merged Terminated Total
County Offices of Education (for 1,490 school districts and charter schools) — — — 57Los Angeles City Schools and Community College Districts — — — 2Los Angeles County Superintendents of Schools and San Diego County Superintendent of Schools — — — 2Cities/Towns — — — 449
Counties — — — 36Districts and Other Public Agencies 7 -1 -2 997
TOTAL PUBLIC AGENCY CONTRACTS 7 -1 -2 1,543
AMENDMENTSPublic agency contracts vary depending upon the member categories covered, the formula the agency elects to provide, and the optional benefit provisions selected from the group of approximately 51 benefits. These optional benefits may be provided at the time the original contract is established or they may be added later through the contract amendment process.
During the 2009-10 fiscal year, 112 benefit changes were made through 91 contract amendments. The benefit formula changes for public agencies included: 7 to provide the 2.5 percent at 55 formula for active miscellaneous members; 3 to provide the 2.7 percent at 55 formula for active miscellaneous members; 1 to provide 2 percent at 55 for miscellaneous members; 5 to provide 3 percent at 50 formula for safety members; and 1 to provide 3 percent at 55 formula for safety members.
CalPERS Comprehensive Annual Financial Report, Fiscal Year Ended June 30, 2010 | Statistical Section | 153
Public Agency Employers (continued)
MERGERS• Los Angeles County Housing Authority merged into the
Community Development Commission of Los Angeles County effective September 18, 2004.
• City of Burlingame and Town of Hillsborough merged their fire functions to create a new agency called Central County Fire Department. The contract was merged effective June 21, 2010.
TERMINATIONS• West End Communications Authority effective
January 1, 2008.• Niland Fire District effective May 10, 2010.
LARGEST PARTICIPATING EMPLOYERS
EmployerNumber of Employees
State of California 340,572Los Angeles County Office of Education 107,525Los Angeles Unified School District 45,402San Diego County Office of Education 36,354Orange County Office of Education 31,909County of Riverside 24,471San Bernardino County Office of Education 24,468Riverside County Office of Education 22,742County Office of Santa Clara 20,585Santa Clara County Office of Education 19,186
NEW CONTRACTSDuring the 2009-10 fiscal year, 7 additional agencies contracted with CalPERS for retirement, death, and survivor benefits. The new contracting agencies are:
Effective Date Public Agency
Misc. Member Formula
Safety Member Formula
9/6/09 Children and Families Commission of San Luis Obispo County
2% @ 55 —
10/1/09 South County Support Services Agency
2% @ 55 —
10/1/09 Peninsula Health Care District 2% @ 60 —10/4/09 Local Agency Formation
Commission of Solano County2.7% @ 55 —
11/9/09 Phelan Pinon Hills Community Services District
2.5% @ 55 —
4/3/10 Lee Lake Water District 2% @ 60 —6/21/10 Central County Fire Department 2.5% @ 55 3% @ 55
RECIPROCAL SYSTEMSReciprocity is a valuable addition to the CalPERS benefit package. Its purpose is to encourage career public service, by allowing members to move between employers under different public retirement systems without losing their retirement and related benefits. The following retirement systems have reciprocity with CalPERS.
Counties Under the County Employees’ Retirement Law of 1937• Alameda • Sacramento• Contra Costa • San Bernardino• Fresno • San Diego• Imperial • San Joaquin• Kern • San Mateo• Los Angeles • Santa Barbara• Marin • Sonoma• Mendocino • Stanislaus• Merced • Tulare• Orange • Ventura
The University of California Retirement Plan (UCRP)
Reciprocal Public Retirement Systems• Concord, City of• Contra Costa Water District• Costa Mesa, City of (safety only)• East Bay Municipal Utility District• East Bay Regional Park District (safety only)• Fresno, City of• Los Angeles City Employees’ Retirement Plan• Los Angeles County Metropolitan Transportation
Authority (Non-Contract Employees’ Retirement Income Plan)
• Oakland, City of (non-safety only)• Pasadena, City of (fire and police only)• Sacramento, City of• San Clemente, City of (non-safety only)• San Diego, City of• San Francisco, City and County of• San Jose, City of • San Luis Obispo, County of
154 | Statistical Section | CalPERS Comprehensive Annual Financial Report, Fiscal Year Ended June 30, 2010
Systems with Limited Reciprocity• Judges’ Retirement System• Judges’ Retirement System II• Legislators’ Retirement System• California State Teachers’ Retirement System
PARTICIPATING PUBLIC AGENCIES BY TYPEThe total number includes active and inactive participants excluding retirees. In most cases, a participant is only counted once. A participant could be counted more than once if he/she were actively employed by more than one employer on the report effective date.
Other Public Agencies that Contract with CalPERS for Retirement Benefits (997 total) (School districts contracting for school safety staff and/or AB 616 miscellaneous formula are included in this category.)
Other Public Agencies that Contract with CalPERS for Retirement Benefits (continued)
166 | Statistical Section | CalPERS Comprehensive Annual Financial Report, Fiscal Year Ended June 30, 2010
PRIMARY BENEFITSThe Judges’ Retirement System (JRS) was established in 1937. The operational activities of the JRS were transferred from the State Controller’s Office to CalPERS in 1979. Benefits payable through the JRS are financed by the General Fund, the payroll contributions of members, and the State’s contribu tion as an employer. Both employer and members contribute at the rate of 8 percent of compensation.
MEMBERSHIPThe Judges’ Retirement System provides retirement, death, health, and dental benefits for Supreme and Appellate Court Justices, Superior Court Judges, and beneficiaries.
SERVICE RETIREMENTRetirement AgeMembers must be at least age 60 with 20 years of service, or age 70 with at least 10 years of service.
Retirement Benefit FormulaThe retirement allowance is a percentage of the current salary of the last judicial office held and is increased proportionally with active judicial salaries. The allowance is based on a member’s age and years of service as follows:
Judges can work as long as they want and receive their full pension of either 65 percent or 75 percent (depending on credited service). In addition, a surviving spouse benefit of at least one-half of the judge’s allowance is provided.
Deferred RetirementJudges are eligible for deferred retirement at any age if they have at least five years of service. However, judges are not paid the allowance until they reach the age they would be eligible for normal retirement if they had remained in office. A judge must be at least age 63, or age 60 with 20 years of service, to receive a retirement allowance. The allow ance is based on years of service multiplied by a percentage of the judge’s final salary — varying from 2 percent for five years to 3.75 percent for 12 or more years of service. The maximum benefit they can receive is 75 percent of salary.
DISABILITY RETIREMENT (NON-WORK RELATED)Judges must apply to the Commission on Judicial Performance to receive a disability retirement. There is no age requirement.
The service requirement is four years. The retirement allowance is 65 percent of the judge’s final salary, or 75 percent of their final salary if the judge has 20 or more years of service.
DISABILITY RETIREMENT (WORK RELATED)Judges receive the same amount as those for a non-work related disability. Any person becoming a judge between January 1, 1980 and December 31, 1988, must have at least two years of judicial service; or after January 1, 1989, must have four years of judicial service, unless the disabil-ity is a result of injury or disease arising out of and in the course of judicial service.
Judges’RetirementSystemProgramData
CalPERS Comprehensive Annual Financial Report, Fiscal Year Ended June 30, 2010 | Statistical Section | 167
JRS ACTIVE MEMBERS & FORMER JUDGES ON DEFERRED RETIREMENT
Active 478Deferred Retirement 50TOTAL ACTIVE & DEFERRED MEMBERS 528
Service Retirement $138,543,915 Disability Retirement 5,481,845 Beneficiary Death Benefits/Life Allowance 34,835,723TOTAL $178,861,483
DEATH BENEFITS (BEFORE RETIREMENT)Not Eligible to RetireSpouses or registered domestic partners can receive 25 percent of a current active judge’s salary for life or return of contributions plus one month’s salary, for each year of service not to exceed six months; or the surviving spouse or registered domestic partner can elect a monthly allowance for life, if the judge had paid an extra $2 per month and had 10 to 20 years of service. This allowance would be equal to 1.625 percent of the salary multi plied by the number of years of service.
Eligible to RetireSpouses or registered domestic partners receive one-half of what the retirement allowance would have been if the judge had retired on date of death.
DEATH BENEFITS (AFTER RETIREMENT)Spouses or registered domestic partners receive one-half of the retirement pension for life, if the member retired with the standard retire ment benefit formula, or on disability.Judges may elect to take a reduced retirement allowance in order to enhance the survivor benefits to their spouse, registered domestic partner, or a designated beneficiary.
COST-OF-LIVING ADJUSTMENTS (COLA)The allowance increases are based on the current salary of an active judge. Retirees receive the same increase as active judges.
Judges’ Retirement System Program Data (continued)
168 | Statistical Section | CalPERS Comprehensive Annual Financial Report, Fiscal Year Ended June 30, 2010
JRS Average Benefit Payments – As of June 30, 2009 | Six-Year Review 1
Notes:1 CalPERS began reporting Average Benefit Payments in the
June 30, 2006 Comprehensive Annual Financial Report.Additional information is added each year as it becomes available to provide a six-year review.
2 These averages and totals are for retired members, beneficiaries, and community property recipients.
Judges’ Retirement System Program Data (continued)
CalPERS Comprehensive Annual Financial Report, Fiscal Year Ended June 30, 2010 | Statistical Section | 169
PRIMARY BENEFITSThe Judges’ Retirement System II (JRS II) was established in 1994 to create a fully funded, actuarially sound retire-ment system for judges appointed or elected on or after November 9, 1994. This system provides a unique combi-nation of two basic types of retirement benefits: a defined benefit plan and a monetary credit plan. The defined benefit plan provides a lifetime monthly retirement allowance of up to 75 percent of final compensation. The monetary credit plan allows for a refund of member contributions, a portion of the employer contributions, and interest. Members contribute at the rate of 8 percent of compensation.
MEMBERSHIPThe JRS II provides retirement, death, health, and dental benefits for Supreme and Appellate Court Justices, and Superior Court Judges, first appointed or elected after November 9, 1994, and their beneficiaries.
SERVICE RETIREMENTRetirement AgeJudges must be at least age 65 with 20 years of service or age 70 with a minimum of five years of service to receive the defined benefit plan. Judges must have at least five years of service to receive the monetary credit plan.
RETIREMENT FORMULADefined Benefit PlanThis option provides a defined benefit of 3.75 percent of the highest 12-month average salary per year of service, up to 75 percent for judges reaching age 65 with at least 20 years of service. Optional settlements are available which reduce a judge’s retirement allowance to provide a lifetime benefit for a surviving spouse upon death of the judge.
Monetary Credit PlanThis option provides a cash payment in a single lump sum, or the member may elect to receive an annuity at retirement based on the accumulated contributions of
Judges’RetirementSystemIIProgramData
the employee and the employer. To receive the annuity a judge must meet the minimum qualifications required under the defined benefit plan. Lifetime benefits are not provided under this plan.
DISABILITY RETIREMENT (NON-WORK RELATED)Judges who have five years of service and become perma-nently disabled because of a mental or physical disability may apply to the Commission on Judicial Performance for disability retirement.
An allowance is based on the judge’s age and will be the amount equal to the lower of the following:• the monthly benefit of 3.75 percent of the final
compen sation multiplied by the number of years of service the judge would have been credited had the judge continued to work until the age the judge would have first been eligible to retire, or
• 65 percent of the judge’s average monthly salary during the 12 months preceding the retirement date.
DISABILITY RETIREMENT (WORK RELATED)Judges receive 65 percent of their average monthly salary during the 12 months preceding their retirement date, regardless of age or length of service.
DEATH BENEFITS (BEFORE RETIREMENT)Eligible for the Defined Benefit PlanSpouses or registered domestic partners receive either the monthly retirement allowance equal to one-half of the judge’s defined benefit plan allowance or the judge’s monetary credits. At any time while in office, a judge may make an irrevocable election for their eligible surviving spouse or registered domestic partner to receive the maximum survivor benefit (Option 2) in the event of the judge’s pre-retirement death.
Eligible for the Monetary Credit PlanSpouses or registered domestic partners receive the judge’s monetary credits or three times the annual salary at the time of death, whichever is greater.
170 | Statistical Section | CalPERS Comprehensive Annual Financial Report, Fiscal Year Ended June 30, 2010
DEATH BENEFITS (AFTER RETIREMENT)Defined Benefit PlanJudges retiring on the defined benefit plan are offered the choice of one of four optional settlement benefits to increase the survivor benefits to their eligible surviving spouse or registered domestic partner.
Monetary Credit PlanIf the judge elected to receive the monetary credit plan in a lump sum, there are no survivor benefits. If the judge elected monetary credit plan in an annuity, the spouse or registered domestic partner receives a lump sum payment of the remaining funds at the time of the judge’s death.
COST-OF-LIVING ADJUSTMENTS (COLA)The retirement allowance of retired judges who have elected the defined benefit plan will be adjusted every January after the judge has been retired six months. The adjustment is based on the United States city average of the Consumer Price Index For All Urban Consumers, as published by the United States Bureau of Statistics. This adjustment will not be less than 1 percent or more than 3 percent.
Service Retirement $441,021 Disability Retirement 619,888 Beneficiary Death Benefits 133,279 Beneficiary Death Benefits/Life Allowance 197,340 TOTAL $1,391,528
Judges’ Retirement System II Program Data (continued)
CalPERS Comprehensive Annual Financial Report, Fiscal Year Ended June 30, 2010 | Statistical Section | 171
Judges’ Retirement System II Program Data (continued)
JRS II Average Benefit Payments – As of June 30, 2009 | Six-Year Review 1
Notes:1 CalPERS began reporting Average Benefit Payments in the
June 30, 2006 Comprehensive Annual Financial Report. Additional information is added each year as it becomes available to provide a six-year review.
2 These averages and totals are for retired members, beneficiaries, and community property recipients.
172 | Statistical Section | CalPERS Comprehensive Annual Financial Report, Fiscal Year Ended June 30, 2010
PRIMARY BENEFITSCalPERS has administered the Legislators’ Retirement System (LRS) since its inception in 1947. The duties of the Board with respect to admin is tering the LRS are the same as for CalPERS on such items as determining membership and benefit rights, making investments, crediting interest, and obtaining information necessary for administration.Benefits payable by the LRS are financed through member contributions, the State’s contribution as an employer, and interest earned on investments. The employer statutory contribution rate was eliminated in January 2000, and the CalPERS Board is now authorized to establish actuarially determined rates.
When the actuarial value of the assets exceeds the present value of benefits, resulting in a 0 percent employer contribution rate, the Board may reduce the member contribution rates for the same fiscal year in which the State rate is 0 percent. For fiscal year 2007-08, the Board has determined that both the employer rate and the member rate will be 0 percent. Interest credited to the member’s accounts is the net earnings rate of investments.
PROPOSITION 140Proposition 140, the Political Reform Act of 1990, requires that Legislators (Senators and Members of the Assembly) first elected after November 7, 1990 participate in the federal Social Security program and in no other retire ment system.
MEMBERSHIPMembers of the Legislature serving prior to November 7, 1990, elected Constitutional Officers, and Legislative Statutory Officers are eligible for benefits.
SERVICE RETIREMENTRetirement AgeThe retirement age is 60, with four or more years of service credit, or any age with 20 or more years. The retirement age for Legislative Statutory Officers is 55, or any age with 20 years or more of service credit.
Members of the Legislature Benefit FormulaThe retirement formula consists of three separate formulas that are totaled together to provide the members with their allowance. The first part of the formula consists of 5 percent of the first $500 of salary up to 15 years of service. The second part is 3 percent per year of the same $500 of salary for years in excess of 15 years. And finally, total years of service is multiplied by 3 percent per year of their salary above $500. In no case may a member receive more than two-thirds of their salary.
Constitutional Officers’ Benefit FormulaFive percent per year of service up to eight years (40 percent) of their highest salary. If the member has 24 or more years of service, the retirement allowance is 60 percent of their final salary.
Statutory Officers’ Benefit FormulaStatutory Officers receive 3 percent per year of service, not to exceed 66 percent of final monthly compensation.
Early Retirement Options for Members of the Legislature & Constitutional OfficersLegislators and Constitutional Officers may retire before age 60 with 15 years of service. However, their retirement allowance is reduced by 2 percent for each year they retire before age 60.
DISABILITY RETIREMENTDisability retirement uses the same formula as service retirement. There is no reduction if retirement is before age 60 for members of the Legislature.
DEATH BENEFITS (BEFORE RETIREMENT)Not Eligible to RetireOne month’s salary for each year of service, plus the return of the member’s contributions with interest payable to a survivor.
Legislators’RetirementSystemProgramData
CalPERS Comprehensive Annual Financial Report, Fiscal Year Ended June 30, 2010 | Statistical Section | 173
Legislators’ Retirement System Program Data (continued)
Eligible to RetireIf the member has elected one of the optional settlements, their beneficiary will receive the benefit provided by the option selected, calculated as if the date of death had been the date of retirement. In lieu of this benefit, the benefi-ciary may elect an allowance of one-half the unmodified retirement allowance, payable until death or remarriage.
DEATH BENEFITS WHILE IN OFFICEBeneficiaries receive a lump sum benefit in an amount equal to the annual compensation of an LRS member during the 12 months preceding the member’s death, regardless of whether the member was eligible to retire.
DEATH BENEFITS (AFTER RETIREMENT)Members choose between one of four options. The level of survivor benefit is based on the option chosen, without a reduction in allowance for members of the Legislature. Constitutional Officers and Statutory Officers receive a reduced allowance based on their age at time of retirement and the option they choose. Beneficiaries also receive a $600 lump sum payment.
COST-OF-LIVING ADJUSTMENTS (COLA)The annual COLA is determined by the Consumer Price Index.
LRS ACTIVE & INACTIVE MEMBERS
Category Active Inactive TOTAL
Members of the Legislature 2 13 15Constitutional Officers 7 10 17Legislative Statutory Officers 4 — 4TOTAL 13 23 36
LRS BENEFIT RECIPIENTS BY RETIREMENT TYPE
CategoryRetired
LRSSurvivors &
Beneficiaries TOTAL
MembersofLegislatureService Retirement 111 103 214Disability Retirement 1 8 9Pre-Retirement Option 2 — (1) (1)TOTAL MEMBERS OF LEGISLATURE 112 110 222
Service Retirement $7,165,253 Disability Retirement 180,794 Beneficiary Death Benefits 3,000 Beneficiary Death Benefits/Allowance 3,732,009 Prior Year Adjustments 1,224 TOTAL $11,082,280
174 | Statistical Section | CalPERS Comprehensive Annual Financial Report, Fiscal Year Ended June 30, 2010
Legislators’ Retirement System Program Data (continued)
LRS Average Benefit Payments – As of June 30, 2009 | Six-Year Review 1
CalPERS SUPPLEMENTAL INCOME 457 PLANDesignedwithhighstandardsofqualityandservice,theCalPERSSupplementalIncome457Planisawayforparticipantstodeferaportionofpre-taxsalaryintoinvestmentsofanindividual’schoosing.Itallowsboththeamountdeferredandtheamountearnedontheinvestmenttobeprotectedfromincometaxuntilthemoneyistakenoutduringretirement.Theplansupple-mentstheretirementbenefitplansofferedbyCalPERS.AllCaliforniapublicagenciesandschooldistrictsmayadoptthe457Planforthebenefitoftheiremployees.
Cities 107Counties 17Community College Districts, School Districts & County Offices of Education 152Districts & Other Public Agencies 293Police & Fire Districts 54Water Districts 84
SIP FUND LINEUPTheCalPERSSupplementalIncome457PlanandSupplementalContributionsPlan2009-10investmentline-upallowsparticipantstochoosefromtwostylesofassetallocationfunds,orbuildtheirownportfoliowiththe11corefunds.