21
PhUSE News Summer 2016 Share / Contribute / Advance
| Date post: | 16-Mar-2018 |
| Category: |
Documents |
| Upload: | vuongxuyen |
| View: | 226 times |
| Download: | 1 times |

PhUSE News | Summer 2016 1
PhUSE NewsSummer 2016
Share / Contribute / Advance

2 PhUSE News | Summer 2016 PhUSE News | Summer 2016 3
Dear Colleagues,
Here in the UK we’re preparing ourselves for a rollercoaster of media throughout the first part of June, as we move towards the EU referendum. Likewise, the weather has an ‘anything could happen’ feel to it, experiencing both snow and sunshine with 20°+ heat within the space of a week. Our cousins across the pond are faring no better, as they gear up for the finishing straight of the presidential elections. So, as confusion reigns, whether in wardrobe choice or which box to cross on a voting form, one thing is clear: PhUSE has been busy.
In this exciting edition of the Newsletter, we have reports from many different events that have taken place over the past three months. On pages 18 to 22, we hear about Single Day Events. Read about the Utrecht SDE, where the theme was ‘Data Visualisation’. The focus was on programming best practices in San Diego; the SDE at Chennai had the theme ‘Focus on Quality – Right First Time Delivery’; and the event in Indianapolis looked at technical leadership. We have reports on the activities at the Computational Science Symposium on pages 24 to 30.
Of course, we don’t just look back at PhUSE, we look forward too. Find out more about the upcoming Annual Conference from the PhUSE Conference Chair and Co-Chair on page 6; discover more about the host city on page 8; and read information about the Conference streams on page 12. Following the success of the Computational Science Symposium in the United States, the CSS is coming to Europe – learn more about this exciting event in Basel on page 14.
So what else? Find out the latest on the PhUSE Future Forum on page 23; meet Lovita Fernandes on page 4 in our regular 10 Questions hot seat; and our newest newsletter team member, Chris Hurley, puts us in the picture with what’s new on page 16. Catch up with the Board of Directors on page 32; and get more SAS hints and tips in Kirk’s Korner on page 34. All in all, a packed edition!
We love to hear from our members. If you have something to say or contribute, please feel free to get in touch at [email protected]. Best regards,Diana
4 10 Questions with Lovita Fernandes
5 Looking Forward
6 PhUSE Annual Conference 2016 6 About the Conference 8 Welcome to Barcelona 12 Conference Streams
14 PhUSE EU CSS 2016
16 What's New, PhUSE?
18 SDE Recaps 18 Utrecht 20 San Diego 21 Chennai 22 Indianapolis
23 PhUSE Future Forum Webinar
24 PhUSE CSS 2016 24 The Collaboration
Has Grown Up 30 Poster Session
32 PhUSE Board of Directors
34 Kirk's Korner
36 Welcome to Our New Members
38 Advertising Costs and Member Figures
Contents
Welcome
From the Editor
Diana StuartNewsletter Editor
Contact us PhUSE Office, Kent Innovation Centre, Millennium Way, Broadstairs, Kent CT10 2QQ, England, UK
Tel: +44 1843 609600 Fax: +44 1843 265850 USA: +1 609 514 5105
[email protected] www.phuse.eu @phusetwitta /phuse linkedin.com/phuse
Fast Track to Approval: Speed and EfficiencyBarcelona 20169th–12th OctoberPrincesa Sofia Gran Hotel, Barcelona
Conference Chair Åsa Carlsheimer, TrialbeeConference Co-Chair Jules van der Zalm, OCS ConsultingFor more information visit the PhUSE website phuse.eu/annual-conference.aspx
Annual Conference

4 PhUSE News | Summer 2016 PhUSE News | Summer 2016 5
What attracted you to your current position?My current job with Accenture gives me ample opportunity to collaborate with the industry. It gives me access to a vast repository of learning and the opportunity to sharpen my skills within the job, bettering myself, and in turn my productivity, within the organisation.
What is the most enjoyable part of your job? I get to think outside the box, and let my colleagues know about it. There are many times when my ideas have been put into action, and coming up with innovative ideas is actually a mandate for everyone at Accenture.
And the least enjoyable?Often we work on the analysis, get involved with the drug in question and give the whole development process our mind and soul only to let it go to Sales and Marketing, who enjoy all the limelight when the drug is launched and goes on to become a blockbuster!
If you could only eat one food for the rest of your life, what would it be?Pani puri (a round, hollow unleavened deep–fried Indian bread – pictured below), fried crisp and filled with a mixture of flavoured water (pani), tamarind chutney, chilli, chaat masala, potato, onion and chickpeas.
What – to you – is the most irritating industry buzzword? “Data scientist”. Pharmaceutical programmers have been analysing data for years, and suddenly there is a buzz to call them data scientists. In pharmaceutical/clinical programming, it’s of the utmost importance to know your domain as well as you do your data.
If you weren’t doing this job, then what would you be doing? I would most probably be training young students and professionals on how to use SAS for various analysis.
If you could give your 18-year-old self one piece of advice, what would it be? It's not important to know the answers to every question but where and how to find them.
Describe yourself in three words.Collaborative, communicative, expressive.
Name one item you cannot live without.My attitude.
What is your musical guilty pleasure? Flute Song by Remo Fernandes, The Great Gig in the Sky by Pink Floyd, Bryan Adams' Here I am, and Jaane Tu Ya Jaane Na by A R Rahman.
10 Questions with... Lovita Fernandes
Getting to know you Upcoming events
It's not important to know the answers to every question, but where and how to find them
Looking ForwardUpcoming PhUSE events
September CDISC International
Interchange Bethesda, MD 26th–30th September
October PhUSE Annual
Conference Barcelona, Spain 9th–12th October
August USA SDE
Frenchtown, NJ 4th August Japan SDE Tokyo 4th August
June USA SDE
Gaithersburg, MD 2nd June
Denmark SDE Copenhagen 15th June India SDE Hyderabad 18th June EU CSS Basel, Switzerland 21st–22nd June
November China SDE
Shanghai 4th November
USA SDE Durham, NC 10th November
December Japan SDE
Tokyo 1st December
India SDE Mumbai 3rd December
July China SDE
Beijing 8th July USA SDE Deerfield, IL 21st July
India SDE Trivandrum 30th July
6 PhUSE News | Summer 2016 PhUSE News | Summer 2016 7
Annual Conference 2016
Fast Track to Approval: Speed and Effi ciency
Barcelona 2016
9th–12th October
Princesa Sofi a Gran Hotel, Barcelona
Conference Chair Åsa Carlsheimer, Trialbee
Conference Co-Chair Jules van der Zalm, OCS Consulting
For more information visit the PhUSE website phuse.eu/annual-conference.aspx
Annual Conference
#12227 PhUSE Barcelona 2016 Poster June 2015 A4 v4.indd 1
16/02/2016 13:06
Fast Track to Approval: Speed and Effi ciencyBarcelona 20169th–12th OctoberPrincesa Sofi a Gran Hotel, Barcelona
Conference Chair Åsa Carlsheimer, Trialbee
Conference Co-Chair Jules van der Zalm, OCS Consulting
For more information visit the PhUSE website phuse.eu/annual-conference.aspx
Annual Conference
#12227 PhUSE Barcelona 2016 Poster June 2015 A4 v4.indd 1
16/02/2016 13:06
Annual Conference 2016
PhUSE Annual ConferenceBarcelona 2016
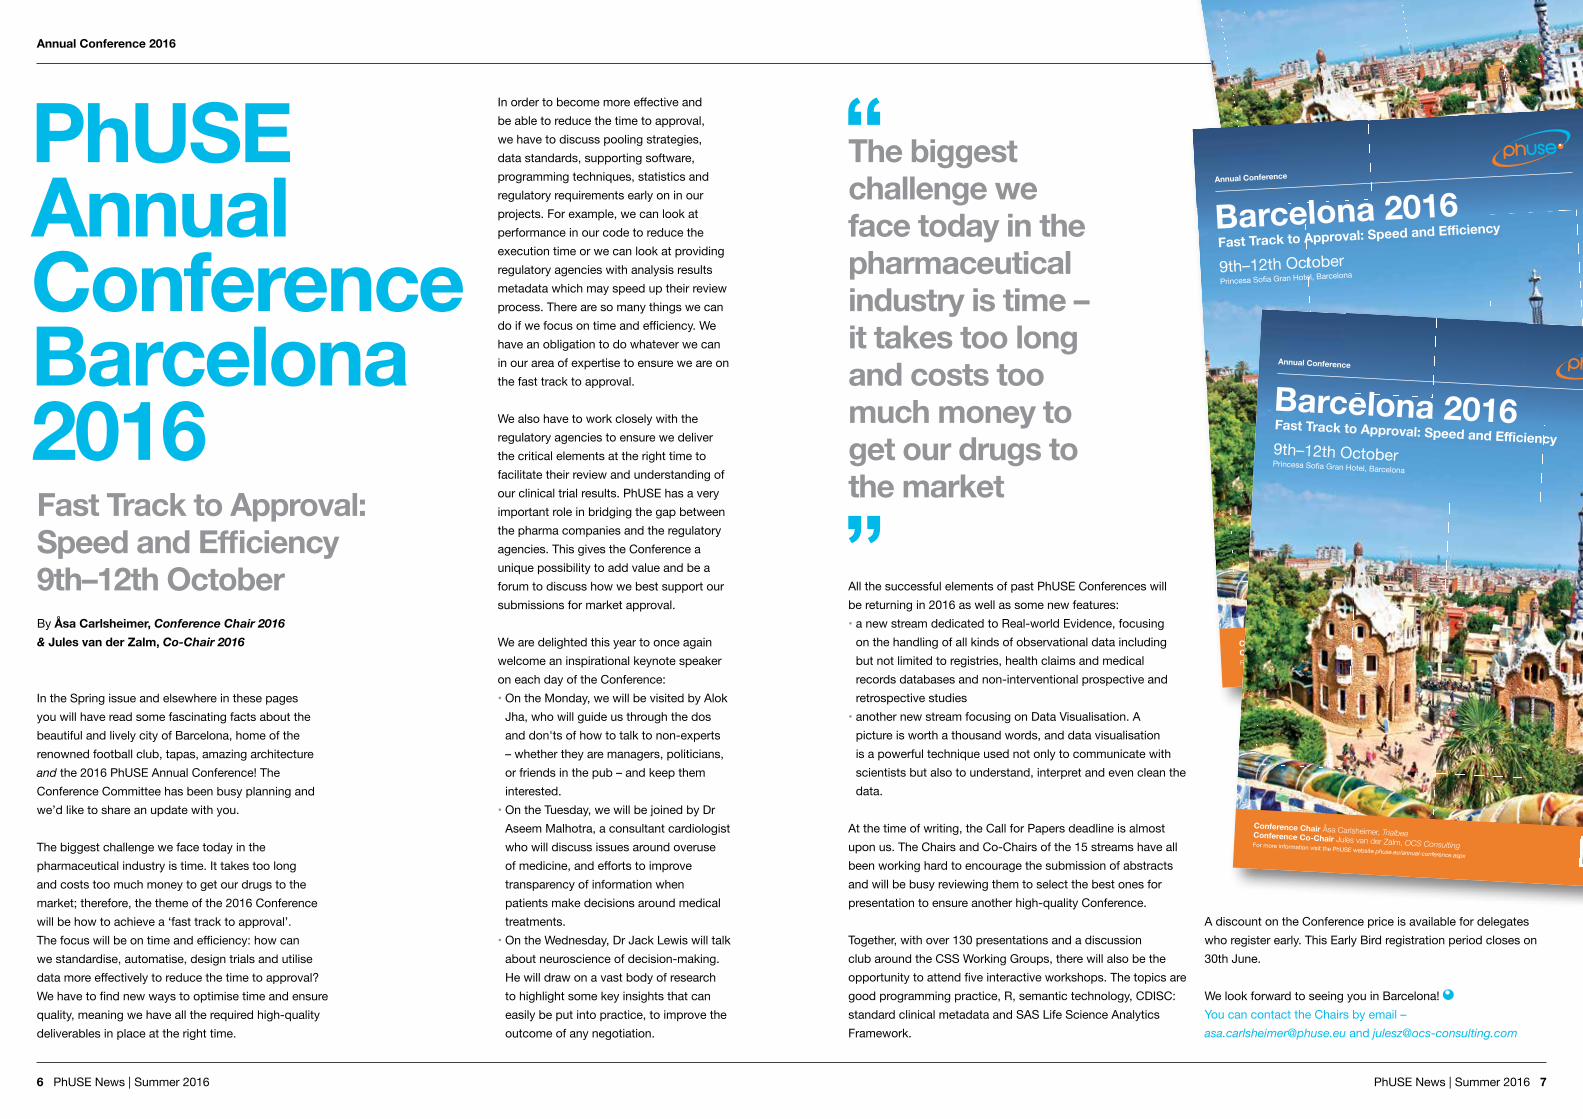
All the successful elements of past PhUSE Conferences will be returning in 2016 as well as some new features:• a new stream dedicated to Real-world Evidence, focusing
on the handling of all kinds of observational data including but not limited to registries, health claims and medical records databases and non-interventional prospective and retrospective studies
• another new stream focusing on Data Visualisation. A picture is worth a thousand words, and data visualisation is a powerful technique used not only to communicate with scientists but also to understand, interpret and even clean the data.
At the time of writing, the Call for Papers deadline is almost upon us. The Chairs and Co-Chairs of the 15 streams have all been working hard to encourage the submission of abstracts and will be busy reviewing them to select the best ones for presentation to ensure another high-quality Conference.
Together, with over 130 presentations and a discussion club around the CSS Working Groups, there will also be the opportunity to attend five interactive workshops. The topics are good programming practice, R, semantic technology, CDISC: standard clinical metadata and SAS Life Science Analytics Framework.
A discount on the Conference price is available for delegates who register early. This Early Bird registration period closes on 30th June.
We look forward to seeing you in Barcelona! You can contact the Chairs by email – [email protected] and [email protected]
In order to become more effective and be able to reduce the time to approval, we have to discuss pooling strategies, data standards, supporting software, programming techniques, statistics and regulatory requirements early on in our projects. For example, we can look at performance in our code to reduce the execution time or we can look at providing regulatory agencies with analysis results metadata which may speed up their review process. There are so many things we can do if we focus on time and efficiency. We have an obligation to do whatever we can in our area of expertise to ensure we are on the fast track to approval.
We also have to work closely with the regulatory agencies to ensure we deliver the critical elements at the right time to facilitate their review and understanding of our clinical trial results. PhUSE has a very important role in bridging the gap between the pharma companies and the regulatory agencies. This gives the Conference a unique possibility to add value and be a forum to discuss how we best support our submissions for market approval.
We are delighted this year to once again welcome an inspirational keynote speaker on each day of the Conference:• On the Monday, we will be visited by Alok
Jha, who will guide us through the dos and don'ts of how to talk to non-experts – whether they are managers, politicians, or friends in the pub – and keep them interested.
• On the Tuesday, we will be joined by Dr Aseem Malhotra, a consultant cardiologist who will discuss issues around overuse of medicine, and efforts to improve transparency of information when patients make decisions around medical treatments.
• On the Wednesday, Dr Jack Lewis will talk about neuroscience of decision-making. He will draw on a vast body of research to highlight some key insights that can easily be put into practice, to improve the outcome of any negotiation.
In the Spring issue and elsewhere in these pages you will have read some fascinating facts about the beautiful and lively city of Barcelona, home of the renowned football club, tapas, amazing architecture and the 2016 PhUSE Annual Conference! The Conference Committee has been busy planning and we’d like to share an update with you.
The biggest challenge we face today in the pharmaceutical industry is time. It takes too long and costs too much money to get our drugs to the market; therefore, the theme of the 2016 Conference will be how to achieve a ‘fast track to approval’. The focus will be on time and efficiency: how can we standardise, automatise, design trials and utilise data more effectively to reduce the time to approval? We have to find new ways to optimise time and ensure quality, meaning we have all the required high-quality deliverables in place at the right time.
The biggest challenge we face today in the pharmaceutical industry is time – it takes too long and costs too much money to get our drugs to the marketFast Track to Approval:
Speed and Efficiency9th–12th OctoberBy Åsa Carlsheimer, Conference Chair 2016 & Jules van der Zalm, Co-Chair 2016
Fast Track to Approval: Speed and Effi ciency
Barcelona 20169th–12th OctoberPrincesa Sofi a Gran Hotel, Barcelona
Conference Chair Åsa Carlsheimer, TrialbeeConference Co-Chair Jules van der Zalm, OCS ConsultingFor more information visit the PhUSE website phuse.eu/annual-conference.aspx
Annual Conference
#12227 PhUSE Barcelona 2016 Poster June 2015 A4 v4.indd 1
16/02/2016 13:06

8 PhUSE News | Summer 2016 PhUSE News | Summer 2016 9
This year the PhUSE Conference will be held at the Gran Hotel Princesa Sofia, in the beautiful city of Barcelona. Whether mention of this city brings to mind Freddie Mercury and Montserrat Caballé, 11 men in red, blue and gold tops or one of the world’s most visited (and beautiful) building sites, there is something for everyone.
As with many cities with long histories, Barcelona has a selection of famous sights that you will have heard of, even though you may have yet to visit the city. In the case of Barcelona, this includes La Rambla, Camp Nou and the large number of architectural delights produced by Antoni Gaudí.
My recommendation, if you are short for time, is to purchase a ticket for one of the ‘hop-on, hop-off’ bus tours. These tours will take you to many of the main sights of Barcelona, including some of the following...
La Sagrada FamíliaWork on this decorative building commenced in 1882, and is still ongoing today. It is forecast to be largely complete by 2032, and has an immense annual budget, raised through entrance ticket sales, to keep the mortar coming. Largely designed by Gaudí, the basilica was no more than 25% complete at the time of his death in 1926. Currently, building is about 70% complete. It is
one of the most well-known symbols of Barcelona, and you will see its silhouette printed everywhere. The design of this building is so complex and, for want of another word, twiddly, you could spend a week walking around trying to take in all the detail.
La RamblaOr Las Ramblas as it’s known locally, is well known and popular, but in my opinion overrated. You can see that it is an attractive pedestrian area, but due to the large number of tourists it has too many souvenir shops and has suffered from the attention of pickpockets. Go if you must, but don’t stay long and move to somewhere more interesting!
Port OlímpicThis marina is recommended as a great place to go for a jog, or a stroll with a stop for coffee and a bite to eat. Given that the weather is unlikely to be too chilly, you may consider a spot of sailing, windsurfing, kayaking or paddle-boarding.
Casa BatllóThis centrally located house is hard to miss. Originally a very ordinary property, Josep Batlló wanted an architect that would design a house that was like no other and stood out as being audacious and creative. Well, his aspiration was fulfilled: the colourful modernist building is one of the city’s most recognisable sites. It is a wavy affair with mosaic tiles and an arched roof that looks a lot like a dragon.
Passeig de GràciaIf shopping is your thing, this is the place to head to, a ‘shopping mile’ filled with international chains and brands. It is also lined with stunning modernist buildings, so remember to pay attention to the surroundings as you bash your credit card. It is also a very attractive place to wander through at night.
Park GüellThis UNESCO World Heritage Site is located on El Carmel Hill and affords some lovely views across the city. Another of Gaudí’s contributions to the city, there is much to see, starting with the two buildings in his distinctive style, along with a multicoloured mosaic salamander that welcomes you to the park. In addition to the weird and wonderful sights within the park, there is the house that Gaudí lived in from 1906 to 1926, which is now the Gaudí House Museum.
Camp Nou (New Field)Built in 1957 and with a capacity of over 99,000, Camp Nou is Europe’s largest stadium and home to FC Barcelona.
The stadium is on the doorstep of the conference hotel.
Museu PicassoThis museum is five adjoining medieval palaces which house one of the most extensive collections of artworks by Pablo Picasso. The museum has one of the most complete permanent collections of his works.
Whilst these, plus plenty more of the usual suspects, are indeed sights to be seen, Barcelona has many other attractions which are a little less obvious and may not be featured in your tourist guide. For example, if you do head to Park Güell, why not continue up the twisting street to El Carmel Hill for a quieter and even better view of the city. Above you, you may notice bunkers, a legacy of the civil war. Below Park Güell there is evidence of the local authority’s redevelopment measures in the form of escalators. That’s right, if you don’t fancy the walk up a hill, just hop on an escalator.
Barcelona has three funicular railways, so if you want to get up high, making the journey would be worthwhile. The most
Annual Conference 2016 Annual Conference 2016
Welcome to Barcelona
Below Park Güell there is evidence of the local redevelopment measures – if you don’t fancy the walk up a hill, just hop on an escalator
By Diana Stuart, PhUSE Newsletter Editor
Above: Casa Batlló, one of Antoni Gaudí's masterpieces
Diana Stuart delves further into the Catalonian capital in part two of her guide to our host city...
8 PhUSE News | Summer 2016

10 PhUSE News | Summer 2016 PhUSE News | Summer 2016 11
Annual Conference 2016 Annual Conference 2016
well known is the Funicular del Tibidabo, which attracts many tourists; however, if you would like to get off the tourist trail, head to the Funicular de Vallvidrera for which you don’t have to buy a special (more expensive) ticket, and can use a zone 1 transport ticket. If you are using public transport a fair amount, it is worthwhile purchasing a T10 ticket, which gives you 10 journeys. At the top it is possible to walk to neighbouring Tibidabo in about 15 minutes, and there is the Collserola mountain trail should you wish to hike. The other funicular railway is the Funicular de Montjuïc, the upper station of which is adjacent to the lower station of the Montjuïc Cable Car, a gondola lift that continues uphill to a terminal near the Montjuïc Castle at the summit.
Cereria SubiràBarcelona’s oldest surviving shop, located in Baixada de Llibreteria in the gothic quarter. It is a candle shop, but it is no Wax Lyrical. Here, you step back in time to the 18th century and will find only handmade candles.
There’s a first time for everything, and there had to be a first time for Antoni Gaudí, and a first time for Art Nouveau. Casa Vicens is where both come together. This was Gaudí’s first paid commission, which qualified him as an architect.
The Cactus GardensTucked away behind the Hotel Miramar, these gardens are home to over 800 types of cacti.
If you fancy art of a different variety, namely street art, there is a place you can go. Not unsurprisingly, La Escocesa is not in the most upmarket area of the city, in a section of Carrer Pere IV which has large derelict areas. La Escocesa is a former dye works that the city authorities have handed over to artists to use for free. This sort of strategy is becoming
more common across Europe and has been reasonably successful in reducing the amount of unwanted graffiti. The other legal place artists can spray is on the metal shutters protecting the city’s shops; as a result, you may notice that the metro in Barcelona has very little graffiti.
A note about safety: Barcelona is a wonderful city to visit, and I don’t want to imply that it is not safe. The sad fact is that there is a problem with petty crime; however, if you act sensibly you can safeguard against being picked as an obvious target. So, please do not stand in the middle of La Rambla with a map and your bag gaping open. As with any large city, it makes sense to look like you are paying attention and to pay attention. There are some good tips on the internet that are worthwhile reading to prepare you for a day of tourism.
I have but scratched the surface of what is on offer in this city, and at the end of the day all that may interest you is a cocktail in one of the bars on Barcelona’s four kilometres of beach. I hope you get to enjoy at least part of the city on your visit whilst at the Conference.
Below: Passeig de Gràcia is Barcelona's ‘shopping mile’, lined with modernist architecture
La Escocesa is a former dye works that the city authorities have handed over to street artists to use for free
Keep up to date with events and more at PhUSE.eu
Visit us online and enjoy the resources on offer, including...
• PhUSE Wiki• PhUSE Code Repository • Communication Library
• Archive Newsletters• Archive Conference Material
• Keynote Videos• CS Working Group Deliverables
• Webinar Presentation Slides• PhUSE Membership Brochure
• Exhibitor & Sponsor Information

12 PhUSE News | Summer 2016 PhUSE News | Summer 2016 13
Annual Conference 2016 Annual Conference 2016
PhUSE Annual Conference Barcelona 2016 Conference StreamsApplication & Software Development (AD) Papers within the AD stream typically cover the development (including implementation and integration into existing environments and processes) of applications and software designed to assist us in our daily job, either directly or indirectly. Papers can also cover migration projects and specific applications, current software development methodologies (e.g. Agile), and techniques.Chair Stephen Griffiths | Co-Chair Christelle Le Beaudour
Coder’s Corner (CC)Coder’s Corner is dedicated to brief presentations on real-life code, programming tips, efficiency techniques, undocumented features, useful algorithms, macros and other creative uses of software. Chair Paul Jenkins | Co-Chair John van Bemmelen
CDISC & Industry Standards (CD)The CDISC organisation has established standards to support the acquisition, exchange, analysis, submission and archival of clinical data and metadata.The stream focuses on:• explanation and interpretation of the standards• processes and development of how to implement
these data standards • the use of CDISC standards in eSubmissions. Chair Frans Wald | Co-Chair Michael Knoessl
Coding Solutions (CS)Coding Solutions papers concentrate on validated or documented single scripts or macros that are not coding language specific. Solutions presented will cover different programming needs, complex algorithms, standardisation and/or solving recurrent issues. Chair Alistair Dootson | Co-Chair Katja Glass
Data Handling (DH)The Data Handling stream is dedicated to many aspects of data handling and database management in life sciences and the pharmaceutical industry. These aspects include extraction and transformation of raw data, metadata definition and handling, data quality, validation and acceptance, analysis data processing, data de-identification and transparency, data mining, master data management and clinical data warehousing. Chair Joerg Guettner | Co-Chair John Moone
Data Visualisation (DV)A picture is worth a thousand words! For centuries, people have depended on visual representations, such as charts and maps, to understand information more easily and quickly. We collect massive amounts of data during the course of a clinical study, which cannot be digested just by looking at tables and listings. How do we communicate information clearly and efficiently to users? Data visualisation is a powerful technique used not only to communicate with scientists but also to understand, interpret and even clean the data. The DV stream focuses on data visualisation examples, tools and techniques which can be used within our field to leverage data to better support drug development. Chair Vincent Buchheit | Co-Chair Terek Peterson
Industry Starters (IS)Industry Starters offers a great opportunity for either colleagues new to the industry to gain experience presenting at conferences, or the more experienced to present papers that are of interest to colleagues with three or less years’ experience. The focus is to provide a warm welcome to the industry and to ask questions in a more informal atmosphere whilst offering a diverse range of presentations that are of interest to all.Chair Edwin van Stein | Co-Chair Kelly Mewes
Management (MA)The MA stream focuses on discussing current challenges and opportunities that are faced by programming managers within our industry. The session will be interactive, with experienced managers introducing a topic and inviting the audience to participate in a discussion to share the collective experience and knowledge. Contribution is by invitation only. Chair Beate Hientzsch | Co-Chairs Matt Jones & Kevin Kane
Non-specificThis stream is in place for those papers that do not fit directly with any of the established Conference streams so that the Conference Chair and Co-Chair can take the decision on where they would be best presented. The focus is to provide a storage point for the paper until an actual stream has been determined and agreed with the author(s).Chair Åsa Carlsheimer | Co-Chair Jules van der Zalm
Professional Development & Training (PD)The Professional Development and Training stream showcases a diverse range of presentations. New challenges in our daily working life need us to react to changing skill sets, working practices, areas of research and technology. This stream delves into the range of soft skills required by a programmer to thrive in this changing environment. Chair Lynn Clipstone | Co-Chair Kathryn Wright
Poster Presentations (PP)Posters cover a wide variety of topics in a poster board rather than a formal lecture. Posters are ideal for presentations that include graphics, source code, statistical concepts or thought-provoking concepts that invite participants to review at their own pace. Chair Jinesh Patel | Co-Chair Johanna Mursic
Regulatory (RG)The healthcare industry is governed by constantly evolving rules, standards and regulations on data transparency and protection, GxP, ICH, 21 CRF Part 11 compliance, validation, version control, process management and continuous improvement processes. We are also regulated on all aspects of submission-related activities including interactions with health authorities, site inspections and audits. This stream invites you to share your experiences and have open discussion on the challenges and benefits of working in a highly regulated industry. Chair Stephen Harrison | Co-Chair Michael Harris
Real-world Evidence (RW)The Real-world Evidence stream will be dedicated to the handling and analysis of all kinds of observational data including but not limited to registries, health claims and medical records databases and non-interventional prospective and retrospective studies. The stream will focus on a programmer’s perspective on the challenges the analysis of real-world data holds, such as extremely large data sets, dealing with dirty data, and issues with regard to validation and standardisation. These challenges need to be dealt with and require specific analysis methods and programming techniques, such as matching algorithms, propensity scores and various kinds of sensitivity analyses.Chair Berber Snoeijer | Co-Chair Knut Mueller
Software Demonstrations (SD)Software Demonstrations focuses on the demonstration of new or recently released software and tools. It may include new programming platforms, reporting systems or data management tools and new innovative applications utilising a variety of new and established technologies. Each demonstration has the goal of highlighting potential for enhanced optimisation, increased efficiency or user-friendliness in the day-to-day undertaking of biometrics processes and tasks. Chair Rob Horton | Co-Chair Angelo Tinazzi
Statistics & Pharmacokinetics Programming (SP)The Statistics and Pharmacokinetics stream is designed to allow members to share ideas on the interface between statistics and computing. This can be software-related, for example how statistical or computing packages can be used to resolve statistical issues within the clinical trial field. It can also be statistical in nature, such as improving programmers’ understanding of statistical methods. Chair Martin Gregory | Co-Chair Corinna Miede
Trends & Technology (TT)Trends and Technology papers concentrate on the many new and emerging trends within life sciences that have an impact on those working with data. These could include hot topics driven by external factors such as public opinion and the application of new technologies in the life sciences sector.Chair Geoff Low | Co-Chair Cathal Gallagher
Hands-on Workshops & Discussion Clubs Management of the Hands-on Workshops and Discussion Clubs. Chair Paula Finch | Co-Chair Mark Foxwell

14 PhUSE News | Summer 2016 PhUSE News | Summer 2016 15
PhUSE Annual Conference 2016EU CSS 2016
PhUSE EU CSS 2016
Following the success and progress of the PhUSE Computational Science Symposium (CSS) in Silver Spring, Maryland over the last five years, PhUSE is excited to announce the first European CSS in Basel, Switzerland. The Computational Science (CS) Working Groups and associated Working Group Projects are the cornerstone of the CSS and will be carried over to the European meeting. This two-day meeting will give attendees the opportunity to participate, on an interactive level, in a number of cutting-edge projects within the CS Working Groups.
Experiences with Statistical Computing Environments This project sits within the Emerging Trends and Technologies Working Group and explores industry and regulatory expectations for a statistical computing environment (SCE) including sharing experiences regarding implementation, compliance, and the relationship between an SCE and metadata repositories and clinical data repositories. The project will use the Symposium to continue exploring requirements for an ideal SCE.
Evaluate and Prototype Alternative Transport Formats for SubmissionThis Emerging Trends and Technologies Working Group project addresses the challenges with the SAS v5 transport format currently required by the United States Food and Drug Administration as part of a regulatory submission. The project will identify potential alternative transport formats, instantiate the alternative format(s) and evaluate the feasibility of adoption against a pre-defined set of criteria. It will use the Symposium to finalise the criteria by which alternative formats will be evaluated and will draft a survey for circulation to industry and regulatory stakeholders.
De-identification of ADaM DatasetsThe De-identification of ADaM Datasets project continues the work of the PhUSE Data Transparency initiative. The initiative, a collaboration between sponsor companies, CROs, technology providers and academia, defined a set of rules for industry to consistently de-identify SDTM data sets. The project will use the Symposium to continue their work defining a set rules for industry to consistently de-identify ADaM data sets.
Nonclinical Roadmap and Impacts on Implementation Working Group The Nonclinical Roadmap and Impacts on Implementation Working Group executes projects to improve nonclinical assessments and regulatory science by identifying key needs and challenges, then establishing an innovative framework for addressing them in a collaborative manner. The Working Group will use the Symposium to address several different topics including:• Working Group plans for 2016/17• regulatory and industry perspectives on
SEND implementation strategies• European SEND implementation needs.
SDTM Implementation FAQThe SDTM Implementation FAQ project within the Optimizing the Use of Data Standards Working Group is a joint PhUSE/CDISC activity incubated at the 2016 CSS in Silver Spring, MD. The project provides a forum for industry, regulatory agencies, and CDISC to address common SDTM implementation challenges in an open, collaborative manner. The project will use the Symposium to continue to collect common issues and, as applicable, formulate responses.
PhUSE Future Forum: Process Optimization The Process Optimization project within the PhUSE Future Forum defines optimal processes that enable new ways of working and increasing collaboration, as well as identifying opportunities for clinical programmers to lead and add value. The project will use the Symposium to further develop the position paper that was produced in 2015 by the Future Forum Leadership Meeting.
Basel, Switzerland21st–22nd JuneBy Stephen Bamford, Joseph Rowley & Scott Bahlavooni, Conference Co-Chairs
Computational Science Symposium21st–22nd June 2016Novartis, Basel Switzerland
phuse.eu/css
PhUSE EU CSS
Basel Cathedral

16 PhUSE News | Summer 2016 PhUSE News | Summer 2016 17
Happenings Happenings
What’s New, PhUSE?By Chris Hurley, MMS Holdings
achieve altitude, the controls on our systems, well-ordered with traditional inputs and outputs, entries and exits, are simply not suited for the rapidly expanding horizon of data in front of us. This is like the difference between driving on a highway and flying in open air. Once you leave the ground, there is an exponential increase in visibility, capabilities required, directions, rules, consequences, and most importantly, the need to process data, create information and make decisions very quickly.
In our future reality, an expanding vista of data includes an ecosystem with a focus on individual data, thereby strengthening the power of the consumer. What we can see ahead are some megatrends that were discussed at the recent PhUSE Webinar Future Forum – The Vision of Clinical Data Science (youtube.com/watch?v=tFChNDFrTl0):• the future health ecosystem will be evidence-based and
outcomes-driven• integrating currently dispersed data sources will provide new
insights into health issues, providing new product and service opportunities
• aligning strategic agendas between ecosystem stakeholders, collaboration and co-creation with different stakeholders will become keys for success
• consumer engagement and change in behaviour will move healthcare towards prevention.
The implication of these trends is that the centre of gravity of the health ecosystem will be elevated to the individual patient and no longer the doctor or hospital. A new set of challenges will need to be addressed – and PhUSE is ready.
Six new Working Groups have been commissioned by the PhUSE Future Forum which will tap into this expanse and enable adaptability and flexibility in the new world of healthcare. The leaders of these groups are just forming their strategies and teams. Here are some excerpts from the webinar regarding the vision for each team:
There was an impressive number of new members in attendance at the March 2016 PhUSE Computational Science Symposium. Of course, that shouldn’t come as a surprise given the rapid growth of membership, which, as of writing, is currently around 6,000. Our expanding base of members and volunteers has given us the ability to collaborate on many issues, and create Working Groups to develop solutions which will advance the field of data science and ultimately benefit patients waiting for new therapies and cures for disease. Dear Reader, as a new member or otherwise, climb aboard, take your seat and get ready to be taken on a new journey, as we take a look at the PhUSE Future Forum and briefly observe how we are getting ready to take data science to new heights.
You glanced at the moniker on the plane as you boarded – “Collaboration” – and thought to yourself, that’s an appropriate name and represents what we do with regards to regulatory, industry and academia. Well, you have only scratched the surface of the collaboration needed in the next ten years. The ability to capture data, in this very near future, will be unbound by the constraints of our current reality. As we climb and
• Data Could include a greater move to evidence-based medicine and outcomes-based evaluations. This would move us to a continuous process of data gathering across all clinical development.
• Analytics This could be where the true value of the data is, depending on the insights that one can extract from it by applying powerful data analytics. Clinical research can move beyond the lab and through various testing and in-human trials to have a higher chance of being right first time.
• Interoperability Aggregated data can lead us to tremendous insights into health and disease. This team may look to identify and help define robust platforms to cope with the vast amount of data from research, clinical trials and healthcare.
• Technology As the paradigm shifts from treatment to prevention and cure of disease, this group may play a big part in easing the collection of many forms of data that come through new technologies such as sensors and wearables.
• Process This group may change the way we design clinical trials to adapt to the future vision. We are already seeing some conditional approvals, and there is likely to be an extension on the number of real-life trials that are needed in the next 10 to 15 years.
• People This group may help define and refine a whole set of different skills. Companies need to decide on where they want to be in the market and align their business model appropriately. They will need to ensure that they have the right skills and culture to be the company that they strive to be. A few years ago, data transparency and de-identification of data was a little-known skill in our industry. PhUSE has a Working Group dedicated to this, and many companies are developing a strong skill set in this area.
New skills for this future reality will revolve around “Life Science & Medical Entrepreneurship”. As an individual, you can contribute through creativity, collaboration and courage and as a volunteer for one of our PhUSE Working
Groups. Organisations can acquire and develop talent that encompasses the new set of competencies required to steer their ship and navigate through this new world of healthcare. Winners will be able to stake their claim, connect the data, derive information and capitalise in this new world.
New skills for the new world: Life Science/Medical Entrepreneurship Winners will look for contributions to:• embracing the healthcare change agenda• mastering the cost/benefit alongside safety/efficacy• recognising where profit goes and why/
plug leaks in the healthcare system• creating value for customers and collecting
proof of that value, using RWE• demonstrating the worth of your products
with RWE and outcomes• stakeholder engagement (team sport!)• running effective alliance and collaboration models.
You’ve read about the expanse of data ahead of us. If used and analysed appropriately, this data gives great promise to the future of healthcare. PhUSE has a vision forward and is looking for volunteers to contribute and share their talent in our Working Groups, as we advance to this new realm of healthcare. Individual and organisational leadership will drive contributions and provide winners in the future reality. For more information, please contact a Future Forum team member at phuse.eu/Future_Forum.aspx.
As mentioned earlier, PhUSE has a Working Group dedicated to protecting personally identifiable information. Data sharing and realising the benefits of data aggregation place a strong need for protecting the privacy of the individual patient. There will be an article in the Autumn Newsletter that will discuss how PhUSE is addressing this topic.

18 PhUSE News | Summer 2016 PhUSE News | Summer 2016 19
SDE Recap Utrecht
Single Day Events
By Jules van der Zalm, OCS Consulting & Paul Vervuren, Nutricia Research
This was the first Single Day Event in the Netherlands and it was a great success! The theme for this event was ‘Data Visualisation’, which has become key in understanding and interpreting the structure and analysis of biomedical data. Driven by the growing volume and complexity of data, the need for visual representations of biomedical data and statistics is growing rapidly. At the same time, the possibilities to develop and apply visuals have increased through compelling software currently on the market. The event covered a variety of perspectives on the topic of data visualisation, ranging from clinical metadata to statistical analysis from both the developer and the user perspective.
After that, it was time for a PhUSE update, starting with Stephen Bamford talking about the PhUSE organisation from a board perspective, followed by Jules van der Zalm with a few words on the PhUSE Annual Conference 2016 in Barcelona. Before the lunch break, Egbert Biesheuvel from Danone Nutricia Research familiarised the audience with the PSDM network.
A great and diverse lunch was followed by two presentations on the topic of Visual Analytics, starting with Raymond Ebben from OCS Consulting, who presented ‘SAS Visual Analytics To Go: The Power of Portable BI’, followed by Stijn Rogiers from SAS Institute talking about ‘The Next Generation of Visualisation: Using SAS to Analyse Healthcare Data’. SAS JMP was present as well and Valérie Nedbal spoke about ‘Why Modern CDISC Data Visualisation Matters in Clinical Trials’, demonstrating the advantages of SAS JMP.
The Single Day Event, on 4 February 2016, took place at the Nutricia Research offices in Utrecht, the Netherlands. SDE Chairs Paul Vervuren (Nutricia Research) and Jules van der Zalm (OCS Consulting) had enlisted the support of many experienced presenters from a variety of organisations across Western Europe.
The event kicked off with a welcome from Paul Vervuren and Jules van der Zalm. Gérald Neveu from Danone Nutricia Research started a full day of presentations with ‘Implementation of Clinical Data and Metadata Dashboards’, showing the audience the strength of Spotfire.
This was followed by what were probably the most programming-related presentations: Carolyn Nixon from Roche presented ‘Graphics in R – A Shiny Way to Program’ and, after a short break for coffee, Phil Holland from Holland Numerics presented ‘Converting Plots from SAS/GRAPH to ODS Graphics’ in the passionate way we all know from Phil Holland.
After another break for coffee to energise everyone for the remainder of the day, Peter van Reusel from Business & Decision Life Sciences presented ‘How a Visual Representation Can Help Us to Understand the Potential of Clinical Metadata’. He was followed by Jimmy Fernandes from Novartis Healthcare with the last presentation of the day about ‘Condensing High Volumes of Statistical Information into Powerful Graphs’.
The event was closed by Paul Vervuren and Jules van der Zalm, thanking all presenters for their great effort. Many attendees stayed for some informal drinks and finger food and had the opportunity to network with their peers.
We would like to thank all presenters and attendees for the interesting discussions, challenging questions and for inspiring us all.
Below: Post-event drinks at Nutricia Research
Top: Presenter Peter Van Reusel, Business & Decision Life Sciences and event attendeesAbove: Mark Lambrecht, SAS InstituteBelow: Presenters and delegates
Single Day Events

20 PhUSE News | Summer 2016 PhUSE News | Summer 2016 21
SDE Recap San Diego
Single Day Events
By Chris Hurley, MMS Holdings
Our PhUSE Single Day Event, with the theme of ‘Programming Best Practices’, was held on 22nd February, at Pfizer in La Jolla, CA. In the US, this time of year, where the casual sports fan goes bonkers over the game of college basketball – ‘March Madness’ we call it – a simple quote comes to mind from one of the greatest basketball players ever to play the game. Michael Jordan really captured the theme of our event when he once said, “The minute you get away from fundamentals – whether it’s proper technique, work ethic or mental preparation – the bottom can fall out of your game, your schoolwork, your job, whatever you’re doing”.
As programmers in our field, we are required to create perfect data sets and high-quality summaries, graphs and listing outputs with programming that is both validated and easy to understand. Validated code and timely deliveries are a must. Given the time constraints of our project work, making your programs easy to understand becomes a real challenge. Through the repetitive use of good programming practices, one can balance the constraints of time and quality to consistently produce deliverables with good programming that is easy to maintain.
Our speakers did a marvellous job, thoroughly painting the picture of best practices in programming through a number of thought-provoking presentations, walking us through a very creative poster, and including a very entertaining analogy with the
nursery story of the Three Little Pigs. During our panel discussion we came up with a short list containing some of the worst and best things to do when programming.
Some of the worst things to do...• hardcode (understand what is
acceptable)• copy each other’s code (when double
programming)• not temper the desire to have parallel
programmers match vs. getting it right• have too many working data sets• not use “where” statements• not utilise testing plans• not account for the strengths of an
organisation – if there is not a lot of SQL knowledge, stay with data steps.
Some of the best things to do...• Keep the code in one place• Design code to do certain standard
processes (data sets, shells, etc.) put in a shareable library
• Headers, documentation and versioning are important, so make sure these are right
• Use checklists so nothing falls through the cracks
• Program defensively to handle the hiccups that will typically arise
• Have code “walk-throughs” in a group setting
• Pay attention to the scope changes and make sure you understand how to match back to original output.
We would like to thank our venue sponsor, Pfizer, and Ren-Yu Tzeng for hosting the event, and all of our sponsors, speakers, attendees and organisers at PhUSE for their part in creating this wonderful event. We love our sponsors, members and volunteers! We would especially like to thank our Co-Chairs, Micky Salgado-Gomez and Joan Bailey, who worked diligently prior to the event and all through the day to ensure everything went smoothly for our speakers and attendees. Finally, special thanks to Christian Gomez, who helped with some of the coordination and set-up during the day.
Below: Kirk Lafler from Software Intelligence Corporation
Single Day Events
Above: Panellists and presenters from the event
SDE Recap ChennaiBy Sarvesh Singh, Senior Director, ICON
With the theme ‘Focus on Quality – Right First Time Delivery’, the Chennai SDE was co-chaired by Pam Howard (Vice President and Global Head Biostatistics & Programming) from ICON and Palani (Director, Clinical Programming) from PRA. Professionals from 15 companies were present at this Single Day Event, and all the speakers gave excellent speeches, with plenty of brainstorming on how to improve the overall quality of deliverables.The event was kick-started with a warm welcome by Sarvesh Singh (Senior Director, Statistical Programming) from ICON. Sarvesh provided a general overview of PhUSE and reported on the various activities of the recent PhUSE/FDA Computational Science Symposium (CSS). He said that India can become a Centre of Excellence if programmers focus on quality of deliverables. Following this, there was a keynote speech by Pam Howard, who explained that the theme of this event was quality, one of the pillars of the project management triangle of cost, time and quality. “Right first time” is a quality management concept that
focuses on defect prevention being more advantageous and cost-effective than defect detection and associated rework. The benefits of getting work right first time should be apparent in terms of customer satisfaction, staff satisfaction and cost control, yet can we honestly say that within the statistical programming domain that we have resolved the issue? Pam then went on to explain how we can use Lean Sigma in statistical programming. Her presentation was very well received and was followed by an enjoyable Q&A session.
This was followed by the presentation from Palani, who said that for any regulatory submission it is intended that the statistical reports with tables and figures are the true reflection of the clinical trial data. He then explained in detail the importance of quality. Manali
from Sciformix explained to us the various ways of improving the quality of deliverables. During the break there were a lot of lively discussions around the presentations. The next presentation was on “Basic Quality Checks by Primary Programmers to Produce Accurate Outputs” by Sridevi from inVentiv.After this, we heard from Tyagi from Ephicacy who explained that everyone involved in clinical trials has to be mindful of quality. This was followed by a very well-received presentation from Erika from ICON on the statistician’s approach to output review. Erika said that developers and validators are more concerned about matching the output rather than thinking whether output is correct or not. This was followed by a presentation by Tamilselvi and Vidya from GRMSITC. After lunch, Jayapandian from Novartis spoke at length on the importance of quality and best practices on improving the quality of deliverables. This was followed by the panel discussion featuring Pam, Palani and Erika. They answered many questions from an engaged audience.The event concluded with closing remarks from Sarvesh, as he thanked everyone for making this SDE a great success. He gave special thanks to Mahesh Ganupooru and Senthil for all their effort in organising the event. The day provided everyone with a very good understanding of the tools, processes and procedures which can be used for improving the quality of deliverables. The panel discussion was very impressive, and I was amazed by the knowledge of those sitting on the panel. The SDE provided an excellent opportunity for networking and gaining more insight into the kind of work other companies do. There was a lot of interaction among the participants and this led to a great exchange of knowledge. I was glad to be part of this SDE and am now looking forward to the next one!

22 PhUSE News | Summer 2016 PhUSE News | Summer 2016 23
SDE Recap Indianapolis
Single Day Events
By Teresa Milner, Eli Lilly and Company & Mark Matthews, GCE Solutions
The theme for this event, held at Lilly Corporate Center on April 21 2016, revolved around technical leadership. The day started with a wonderful keynote address by Bala Dhungana of Eli Lilly and Company. A PhUSE overview was given by PhUSE Membership Director, Frank Senk. This was immediately followed by a discussion from our US Events Director, Chris Hurley, on the most current activities with the PhUSE Future Forum. The balance of the day included eight accomplished leaders sharing their lessons learned, and coaching skills, from direct experience with highly technical and/or widely dispersed teams. The event capped off with a round-table session,
which included polling the audience with a smartphone app that feeds responses directly into a PowerPoint slideshow.
We had a good turnout, with more than 50 people in attendance. Attendees were actively engaged over the course of the day, especially during the final round of panel discussions. There was a strong consensus that technical leadership can happen at any level and this is an important skill to develop. The topics on leadership, managing, mentoring, coaching and communicating were all very thought-provoking and appreciated.
As the co-hosts for this event, we wish to thank all the speakers, attendees, event sponsors, organisers and PhUSE representatives for making this event a great success. We look forward to supporting future PhUSE SDEs at the Crossroads of America!
Below: Event Chairs Mark Matthews, Teresa Milner, and Isaac Swanson, with Chris Hurley and Frank Senk from PhUSE on the left and right
Future Forum
PhUSE Future Forum Webinar
By Sascha Ahrweiler, PhUSE Communications Director & Stephen Bamford, PhUSE EU Events Director
In our PhUSE News 2015 Winter issue, we reported on the inaugural PhUSE Future Forum meeting, where industry thought leaders discussed upcoming industry challenges. After this kick-off in August 2015, the Future Forum attendees divided up into five different Working Groups and defined their vision on topics such as technology and interoperability, analytics, processes and people. PhUSE organised a webinar, where the Working Group leads presented their ideas and visions about the upcoming industry challenges and how PhUSE can help to overcome these challenges.
Over 125 members from PhUSE, regulatory agencies and standards organisations attended the webinar held during February. A recording of the webinar is available on the PhUSE YouTube channel www.bit.ly/PhUSETube, which has been viewed close to 100 times already. Slides from the webinar are available on the PhUSE website in the Future Forum section of Clinical Data Science.
The feedback that PhUSE received following the webinar, both formal and informal, was really positive and the whole project was very well received. Attendees thought it provided great insight into what we can expect in the near future in the clinical data science field and how a clinical data scientist can take a lead role in the multiple initiatives bound to revolutionise the way our industry will function.
As a follow-up to the webinar, and after an analysis of the webinar poll and successive surveys, another Future Forum meeting took place on 7th March, to discuss the next phase of the programme. Feedback from PhUSE members and a plan for the next six to nine months was agreed. During the meeting, four projects were presented and the team had to decide which two would be taken forward.
The Steering Board considered feedback from the webinar attendees, and the decision was made to combine the Interoperability and Technology topic into a single Working Group Project due to the high level of overlap. New healthcare technology such as wearables produces a huge amount of data and could be integrated into clinical trials. This evolving healthcare landscape will drive new systems and will increase the amount of available clinical data and information in many forms. New technology and its interoperability will have a direct impact on our industry in the short and medium term. This WGP will help to define how PhUSE can support to manage the future.
The second project chosen was Process. New technology and new amounts of clinical data sources, such as genomics or real live data, will have to come along with new ways of working and increased collaboration across multiple players. The Steering Board felt that these two projects together give a strong balance of different aspects of the skills that are required for our industry.
The Steering Board would like to enlist the help of the PhUSE Membership to move the projects forward into the next phase. We are looking for volunteers (around 15 people + two Co-Leads per project) to be part of the Working Groups. Both projects will build on the output from the Steering Board that has already been produced.
Interested PhUSE volunteers expressed their interest via the Future Forum – Call for Volunteers section on the PhUSE webpage. By the time this newsletter is released, the two project groups will have commenced and, depending on progress, we expect Steering Board feedback during the PhUSE Annual Conference in Barcelona this autumn.
Sharing the Vision of Clinical Data Science
Future Forum The Vision of Clinical Data ScienceWhere will we be in 2025?
Stat
istic
al
Com
putin
g En
viro
nmen
ts
Open Source Tools
Out
sour
cing Globalisation of Resources and Talent Development
Health Outcomes
Real Life Data
eSource
Rem
ote
Patie
nt M
onito
ring Wearables
Inso
urci
ng
Life Licensing
HEO
R
Patient Engagement
Adaptive Trials
Pers
onal
ised
Tx
In-life TrialsOff-shoring
Collaborative R&D Models
Regulatory Compliance
Con
ditio
nal
Appr
oval
s
Increased Risk Averseness
www.phuse.eu/Future_Forum.aspx
Soph
istic
ated
Tria
ls
#12141 PhUSE Visionary Data Science Forum May 2015 Poster A3 v3.indd 1
05/05/2016 15:35
I attended the PhUSE Future Forum webinar
and thoroughly enjoyed it. Informative and
resourceful, it provided great insight into what
we can expect in the very near future in the
CDS field and how a clinical programmer/
analyst can take a lead role towards multiple
initiatives that are bound to revolutionise the way
the pharma/biotech industry will function.
Once again, thank you very much for letting us
have the opportunity to attend such an
insightful and thought-provoking webinar!

24 PhUSE News | Summer 2016 PhUSE News | Summer 2016 25
CSS 2016 CSS 2016
By Chris Decker, PhUSE/FDA Liaison
From 13th to 15th March, over 300 people from PhUSE, the FDA, CDISC, and industry gathered together in Silver Spring, Maryland for the 5th annual Computational Science Symposium (CSS), including over 50 colleagues from various regulatory agencies. This event and ongoing collaboration is unique within our industry as it brings together key stakeholders from across the product development and review process to solve issues, explore new ideas, and work together to improve the product life cycle. Over the last five years, the CSS has grown from its infant years, passed through adolescence and matured into a successful collaboration leading to innovation within our industry.
The meeting kicked off on the Sunday evening with a welcome and introduction to the great work being done across the five Working Groups and over 25 projects. Steve Wilson from the FDA said, “The collaboration is the only environment where
again emphasised that this conference was different – it was a collaborative working environment. He asked attendees to “move beyond their stake, roll up their sleeves, and use their expertise to seek solutions”.
After the opening session, the Working Groups charged ahead, coming together in the afternoon to work on existing projects and generate new ideas. Most Groups started by describing what had been accomplished over the last year and the new topics that would be discussed, and this provided an opportunity for brainstorming new ideas, setting objectives, and identifying challenges industry and regulatory agencies face during the development and review of products. The first day rounded off with time for attendees to network over drinks, food and an engaging poster session. Over 30 posters were presented on a variety of topics, from optimising the use of standards to using specific tools to making processes more efficient. The second day began with the Working Groups continuing their discussions, and narrowing their focus on specific topics, defining deliverables, and discussing next steps. In addition, a number of Working Groups proposed new projects, and volunteers were energised to move forward with those ideas.
By the end of the Computational Science Symposium, there was significant excitement about current projects and the new projects that were kicking off innovative ideas. While all attendees understood the challenges identified are not easy to solve, everyone was eager to roll up their sleeves and execute what could be achieved through collaboration. As one new attendee said after the event, “The collaboration among industry, regulatory agencies, and standards organisations was a formula for success. I could see everyone working together to solve problems and explore new concepts, and the amount
individuals can come together to work together and improve the drug development process”. Each group then spent a few moments describing the deliverables produced and the work planned for the meeting and the upcoming year. Working Group volunteers had opportunities to network with their fellow colleagues, put names to faces, and look forward to the next two days. Also that evening, the first-ever ‘Semantics 101 for Pharma’ workshop helped bridge the gap between legacy clinical data processes and the introduction of innovative ways to look at clinical information. Thirty people registered and over fifty attended, showing the significant interest in this topic.
On the Monday morning, the annual FDA session introduced us to real things happening within the FDA, including an update on the guidance, the reality of what is being seen in the CDISC data being received, and the importance of the data reviewer guides published by PhUSE projects. Steve Wilson once
of progress the small groups made in a short timeframe was extraordinary”.
On the next page, you will read a summary of what each Working Group is tackling and will continue to work on throughout the year. At any time, you can visit the PhUSE Wiki (phusewiki.org) and select the CSS Working Groups to learn more about contacting Group Leads and how you can join a Group!
Working Group UpdatesWorking Group: Optimizing the Use of Data StandardsThe mission of the Optimizing the Use of Data Standards is to identify specific gaps that prevent the FDA and industry from optimising the use of data standards, by collaborating to close these gaps.
Over the last year, this Working Group has been very active, releasing a number of best practice white papers, templates and other deliverables to improve the implementation of data standards. Below is a list of just some of the work done at the 2016 event:• Standards Implementation Nuances (by version): brainstorming
sessions focusing on the nuances of each version of the standard and define, a new joint project between CDISC and PhUSE to define FAQs for the implementation of SDTM and ADaM
• Define v2.0 Implementation Recommendations: collaborative sessions discussing the creation of “Completion Guidelines", focusing on best practices for content and the development of recommendations for a stylesheet
• Study Data Standardization Plan (SDSP): review of the final draft and working through the process for delivering to the FDA for formal review
PhUSE Computational Science Symposium 2016The Collaboration Has Grown Up

26 PhUSE News | Summer 2016 PhUSE News | Summer 2016 27
28 PhUSE News | Summer 2016 PhUSE News | Summer 2016 29
• Legacy Data Conversion Plan & Report (LDCP): review of the updated SDRG template which will be sent to the FDA PhUSE Working Group for review
• Reviewer’s Guide & Define.xml Alignment: discussions outlining the current overlap and drafted skeleton for the future white paper
• Standardizing Data within the Inspection Site Selection Process: analysis of gaps between FDA expectations and CDISC standards near completion; collaborative discussions between the PhUSE project team, CDISC and the Standard Scripts for Reporting and Analysis Working Group, to address the gaps.
Working Group: Nonclinical Roadmap and Impacts on ImplementationThe mission of the Nonclinical Working Group is to improve nonclinical assessments and regulatory science by identifying key needs and challenges in the field and then establishing an innovative framework for addressing them in a collaborative manner.
Throughout 2015, the Nonclinical Working Group continued to be one of the strongest and most productive Working Groups, with a broad range of dedicated volunteers. Over the year, they have completed a number of key projects, and have exciting plans for this coming year. The Group had their highest attendance, with over 60 contributors from the FDA, PMDA and sponsors and nine projects.
During this year’s event, they evaluated an assessment of the current state of SEND readiness, had extensive discussions around data visualisation and analysis, and won the collaboration poster award for the Nonclinical SDRG. Moving forward in 2016, the Group has proposed a number of new projects within two categories:• SEND Implementation: continued growth of the SEND
Implementation user group, finalisation of the Nonclinical Study Data Reviewer’s Guide, and annual SEND Implementation survey, and a forum for test submissions
• Visualisation and Analysis: exploring application of SEND data for analysis, visualisation of group differences in histopathology data, and the development of nonclinical analysis scripts.
Working Group: Semantic TechnologyThe mission of the Semantic Technology Group is to investigate how formal semantic standards can support the clinical and nonclinical trial data life cycle from protocol to submission.This Working Group continues to evolve and initiate new and exciting projects. This year, the Group developed and facilitated the successful Semantics 101 for Pharma workshop, as described above. This workshop will be updated and delivered
again at future events. The Group came out of the CSS 2016 with four projects moving forward: • Analysis Results and Metadata: the project will finalise their
white paper in June and then begin to leverage the use cases from the Clinical Data Review Template, to show real-world examples of using the work done within the project;
• Clinical Program Design: review of their draft white paper which will be published in July and then the move towards prototyping open-source tools for some of the components described in the white paper;
• Regulations to RDF: defining and reviewing key words for 2 CFR and how to map those words in a graph. The team will explore development of a review tool and link 21 CFR to relevant FDA guidance;
• Use Cases for Linked Data: a list of use cases were collected at the 2016 meeting, which will lead to the development of a draft white paper and potential development of proof of concept.
Working Group: Standard Scripts for Reporting and AnalysisThe mission of the Standard Scripts for Reporting and Analysis Working Group is to establish a platform for the collaborative development of white papers and program code to be used as analytical tools for clinical trial research, reporting and analysis.
The Standards Scripts Group has worked diligently over the last few years to establish a platform for storing and sharing scripts to be used for standard analyses, as well as aligning industry stakeholders to develop white papers describing standard analyses. At the CSS, the Group revisited their vision, objectives and progress to align the group on the way forward. Breakout sessions focused on the continued development of analysis white papers and the implementation of the GitHub repository including the qualification process, review of FDA scripts in the repository, the end-user experience and processes for naming and version control.
Over the next year, the Group will promote and present the FDA JumpStart content, look towards collaborating with the JumpStart group, develop and qualify a full analysis package, partner with the Semantics Technology Analysis Results and Metadata project to show how the analysis they are developing can really be metadata-driven, and continue to develop a number of new white papers.
Working Group: Emerging Trends and TechnologiesThe mission of the Emerging Trends and Technologies Working Group is to provide a forum for identifying new opportunities for recognising and leveraging new or emerging technologies and computational tools or under-utilised existing technologies.
This Group was originally formed at the 2012 CSS, from a Group who wanted to not only discuss gaps and issues we have in the product life cycle but also new and innovative ideas. In the first year, this Group explored the use of semantic technology, how to define and leverage metadata, and the barriers to cloud adoption. The semantics technology work gained traction to the point that a whole new Working Group was formed.
In 2015, this Group had a number of interesting and cutting-edge projects exploring how we can use new technology and processes to change the way we work. Below is a short description of the Group’s projects:• Alternative Transport Formats: The industry has continued
to push for an alternative to the current delivery format in submissions. This project focused on developing a set of criteria for evaluating transport formats and the issues within each option for both transport and content. The Group is going to finalise the criteria and release a white paper for evaluating different options.
• Cloud Adoption: One of the Group’s original projects, they continue to create a well-defined framework, and have interacted with the EMA on the work they have done.
• Data Visualisation: This project regrouped at the meeting and agreed on a future direction which includes breaking down the Group into risk-based monitoring reporting, implementation of data visualisation, safety graphics, comparisons of technology and interactive versus static visualisations.
• Statistical Computing Environments: This project was initiated in 2015, and over the past year they have developed a white paper summarising a survey of over 30 sponsors, developed a framework for describing user requirements, and created a list of requirements. Moving forward, they plan to finalise the framework, develop best practices and share a robust set of requirements.
Where to Find Information and How to Get InvolvedPhUSE CS Dashboard overview of active projects PhUSE Catalog of WG Deliverables finalised work packagesPhUSE WG Deliverables Under Review draft work packages available for public review
Need more information? Visit the PhUSE Wiki for more detailed Working Group and project information.Ready to join? Email the Working Group Leads or join a Working Group Mailing List.Have an idea? Submit a new project request today!
Join our Technical Team and provide Wiki support, collaboration tool support, distribution list/emails, and other technical needs. Contact [email protected] to help.
CSS 2016 CSS 2016
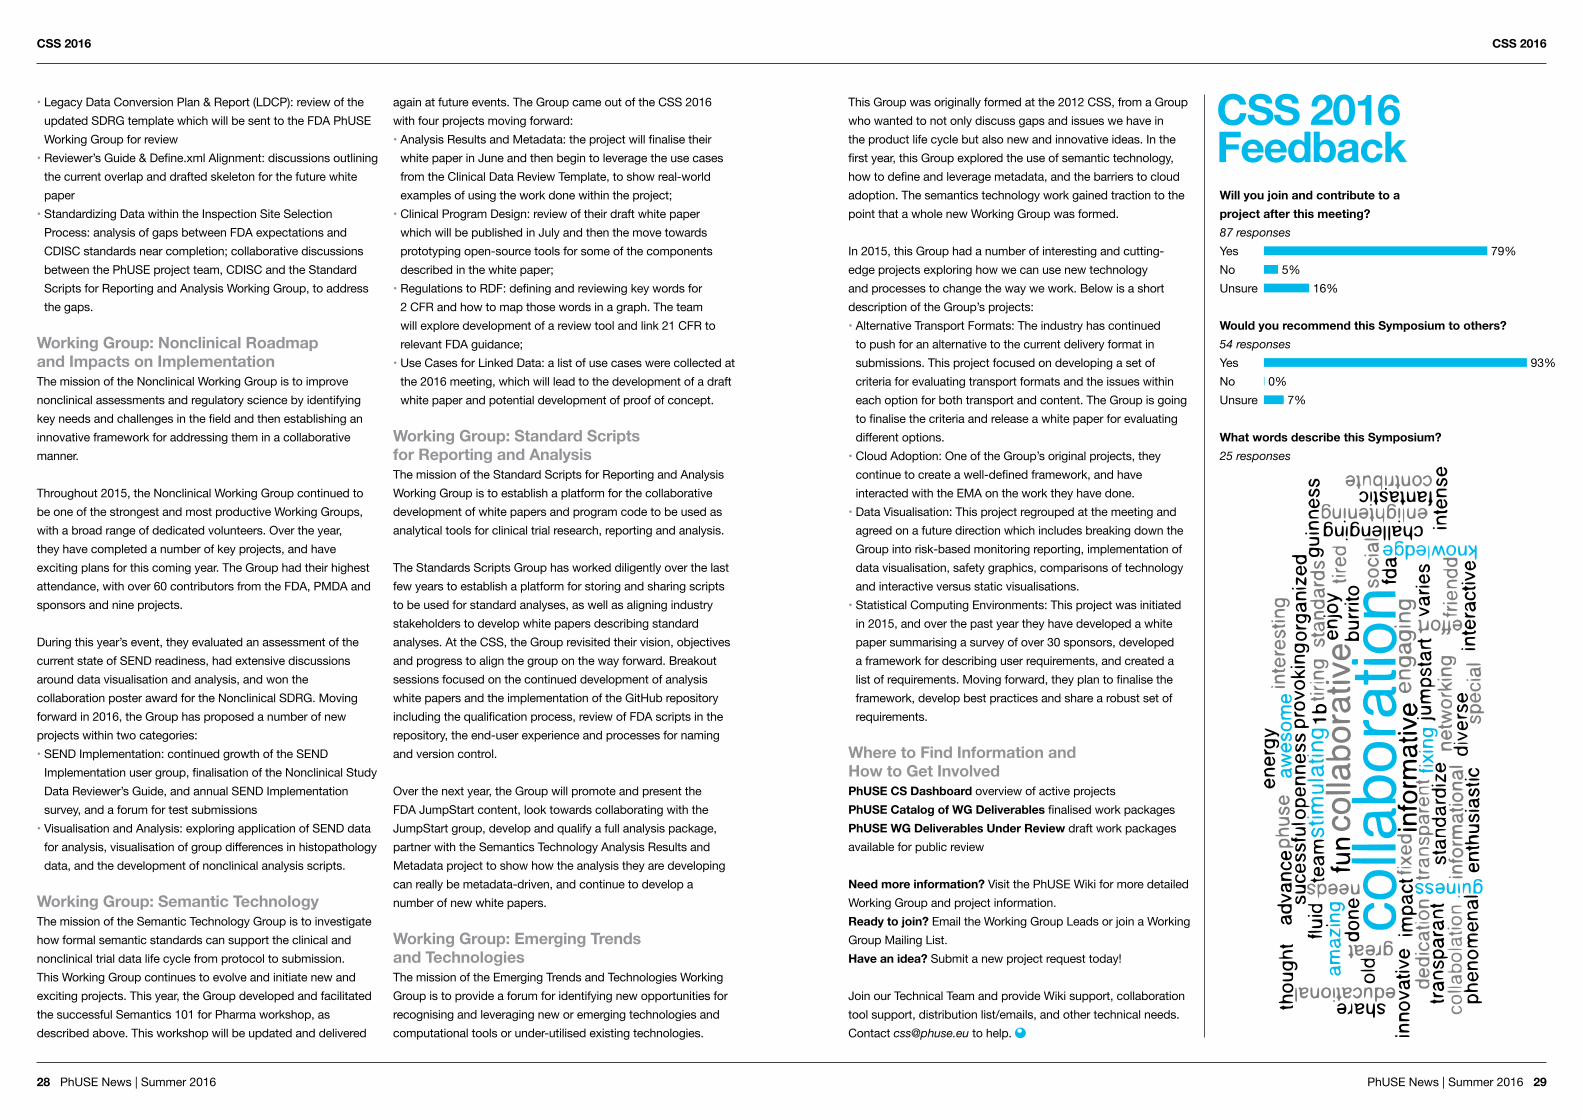
CSS 2016 FeedbackWill you join and contribute to a project after this meeting?87 responsesYesNoUnsure
Would you recommend this Symposium to others?54 responsesYesNoUnsure
What words describe this Symposium?25 responses
79%5%
0%
16%
7%
93%

30 PhUSE News | Summer 2016 PhUSE News | Summer 2016 31
CSS 2016 CSS 2016
PhUSE 2016 Computational Science SymposiumPoster SessionBy Sascha Ahrweiler, PhUSE Communications Director & John Salter, PhUSE Operations Director
As in previous years, the poster session of the PhUSE Computational Science Symposium (CSS) was one of the highlights of the Working Group meeting. Industry and the FDA had a chance to share the results of their discussions and research topics. Along with snacks and drinks, the poster session is also a great opportunity for the PhUSE CSS Working Groups to present summaries of their work!
In 2016, 30 posters were submitted and presented at the PhUSE CSS. The four poster judges Helen Sile, Vaishali Popat (both FDA), John Salter and Sascha Ahrweiler (both PhUSE) had to evaluate all the posters and rate them according to content and presentation style. As in the previous year, the quality of the submitted posters was very good, which presented the four judges with a challenge in picking the very best one from both industry and the FDA. After
long discussions, we finally decided to pick three posters as winners.
The FDA-winning poster (PP19) “Standard Endpoints, Standardized Data and Subgroup Outcomes in Diabetes: A Patient-Level Meta-Analysis of Cardiovascular” presented by Tejaskumar Patel and other FDA members gave a really good summary on how reviewers can overcome limitations of single trials to assess the safety and efficacy of various subgroups by means of meta-analysis of standardised data within one NDA. In their poster, they presented the meta-analyses of diabetes clinical trials to assess cardiovascular events within age, gender and racial subgroups, using an endpoint customised by FDA reviewers.
The industry-winning poster (PP08) “De-Identification Standards of CDISC Data Models”, presented by Kelly Mewes (Roche) and Jean-Marc Ferran (Qualiance), is an outcome of the PhUSE Data Transparency Working Group. The de-identification standards aim to facilitate the identification of direct and quasi identifiers of patients in a clinical trial database following CDISC standards. In their poster, Kelly and Jean-Marc provided rules to apply together with technical guidelines. The outcome of the Working Group, which is also available as a white paper, will ensure consistent approaches across companies.
The poster (PP15) “The Nonclinical Study Data Reviewer’s Guide”, presented
Above: Winner Kelly Mewes and her poster, PP08
The winning posters, clockwise from above left: PP19, PP08, and PP15
De-Iden'fica'onStandardsforCDISCDataModels
PhUSEDataTransparencyWorkingGroup
KellyMewes,RocheProductsLimited
Jean-MarcFerran,Qualiance
ThePhUSEDataTransparencyWorkingGroup&DataSharing
InthiseraofDataTransparencyandsharingdatawithrese
archers,companiesaredefiningtheirprocessesandde-ide
n9fica9onguidance inordertocomplywithdataprivacyr
egula9ons. Inpar9cular, it ispossible forresearcherstore
questaccesstodataacross
sponsorsandboththedifferenceofdatamodelsandde-ide
n9fica9ontechniquesmaymaketheanalysescumbersome
anderror-prone.AstheCDISCdatamodelsarenowadopted
intheindustry,PhUSElaunchedinJuly2014adedicatedW
orkingGrouptodefinede-
iden9fica9onstandardsforCDISCdatamodelsstar9ngwith
SDTM.Par9cipantsfromPharmaceu9cals,CROs,SoRwareVen
dors,CDISCspecialists,DataPrivacyspecialistsandAcademi
ahavejoinedforcestodefineasetofrulesagainstSDTMto
providetheindustrywith
aconsistentapproachtodatade-iden9fica9onandincrease
consistencyacrossanonymizeddatasets.Eachdomainand
variablesholdingpoten9allyPersonallyIden9fyingInforma
9on(PII)havebeenratedintermsofimpactondataprivac
y.Basedonthatra9ngthe
variablesareallocatedstandardrulesofde-iden9fica9on,al
ongwiththera9onaleandtheimpactondatau9litybeingd
ocumented.
PhUSEDe-Iden'fica'onStandardforSDTM
EverydomainandvariabledefinedinSDTMIG3.2isassesse
dandvariablesthatholdPIIwereevaluatedintermsofdat
a
privacyandwhatrulestoapply.Dataprivacyisdefinedacro
ss3levels,DirectIden9fiers,Level1quasiIden9fiersandLe
vel
2quasiIden9fiersofdecreasingimpactondataprivacyand
riskoverpa9entre-iden9fica9on.Forthesevariables,rules
to
applyarerecommended.Insomecases,itisrecommended
tokeepthem‘as-is’astheyholdcri9caldataforanalysis(e
.g.
Sex) or an alterna9ve rule issuggested to address differen
t cases (e.g. a device numbermay need to be recoded in
a
medicaldevicestudywhilenotholdinganydatau9lityinan
on-devicestudy,whereitcanberemoved).
PleasevisithMp://www.phuse.eu/Data_Transparency.aspxtodownloadthelatestversion.
DataDe-Iden'fica'on
OffsetDates
All 9me-related informa9onis important in clinical rese
arch, in par9cular dates, and they present
themselves in two forms, date and rela9ve days. Confor
ming with CDISC standards (both dates and
rela9vedaysarepresent),itispreferablefromadatau9lit
yperspec9vetokeepbothtypesofdates,but
tooffsetactualdates,andkeepstudydayandotherrela9
vedates‘as-is’.Fullandpar9aldatesmustbe
offset(guidance isprovidedinAppendix1ofdeliverable[3]
)whilerela9vedatessuchStudyDaycanbe
kept‘as-is’inthedatasets.Thefigurebelowdescribesadat
eoffsetalgorithmthatenablestheoffsetdates
tobekeptwithintherangeofpossiblestudydates.
ResidualRiskAssessment
HandlingFree-TextIn general, free-text data
must be deleted as it is
consideredtobeadirectIden9fier,asitcanholdanydata
includingPII. If there isnoassociatedcoded informa9on
availableinthedatasetthatcanbeusedinstead,free-text
data must be considered for review and redac9on of
values with PII. However such a measure needs to be
balancedwith the cri9calityof such variables for future
research and as an alterna9ve rule, a non-recoded free-
textvariablecanberemovedfromthedataset.
OtherAreas
SummaryThissetofrulesdefinedforC
DISCSDTMIG3.2iswribenwiththegoalofbothfacilita9n
gtheassessmentofdirectandquasiiden9fiersinSDTM
datasets and ensuring consistency in anonymized data sh
ared across sponsors. The defini9ons of direct and quasi-
iden9fiers represent the
consensusoftheworkinggroup.
However, the rules described here do not guarantee an a
cceptable or very small residual risk of re-iden9fica9on in
the data and it is the
responsibilityofthesponsorstodefineandmeasurewhatth
eresidualriskisanddefineanacceptableriskthreshold.
SDTMbeingalsoanormalizeddatamodel,notalldirectnor
quasiiden9fiersmaybecapturedinthisdeliverableanditis
theresponsibilityofthe
sponsortoensurethatsuchassessmentisconductedandrev
iewedaccordingtodefinedinternalprocedures.
Iden9fyingaspecificsetofvariablesthatneedtobemodifi
ed
as per the general SafeHarbor approach does not guaran
tee
that the risk of re-iden9fica9on is always sufficiently smal
l,a
second step of residual risk analysis is generally
recommendedifanyofthefollowingcondi9onsaremet:
• Dataisnotreleasedthroughasecureportal
• ResearchersdonotsignaDataSharingAgreement
• Rarediseasetrial• Extremeorknown/observablev
aluesorseriousevents
• Thedatacontainsextensivedemographic,socioeconomicor
detailedmedicalhistories.
The evalua9on of residual ris
k is a quan9ta9ve exercise and
involves4generalsteps:
1. Assessingthecontextofthedatasharing.
2. Sefnganacceptablethresholdforanonymiza9on.
3. Measuringtheactualprobabilityofre-iden9fica9on.
4. Adjus9ngdatade-iden9fica9onifnecessary.
Popula'ontoconsider:
• Studypopula9on• SimilarClinicalStudiespopula9o
n
• Geographicalpopula9onRiskMetricstoconsider:
• Averageriskforcontrolleddisclosure
• Maximumriskforpublicdisclosure
ItwasalsodecidedthatdateofDeathmustbeoffsetasin
anyotherdatehandling,duetoitsimportance
inclinicalresearch.WhilstdateofBirthmustbederivedint
o“Ageatbaseline”andpa9entsover89years
oldmustbeaggregatedintoonecategory.Itisalsopossible
asanalterna9veruletoderiveintoagefolds
(10-15,15-20,20-25etc.,18-20,20-22,22-24,etc.)tobedefi
nedbythesponsor.
ExtensiontoCDISCADaM
ThePhUSEDe-Iden9fica9onS
tandardforSDTMIG3.2wasreleasedon15May2015and
anumberofcompaniesarecurrently implemen9ng itor
conduc9ngpilots.Basedontheini9alfeedbackthatwillbe
providedthroughthisprocess,aversion1.1ofthestandard
willbedevelopedtofurther
clarifythedifferentconceptsandrules.
Anaturalstepfortheworkinggroupwouldbetodevelopa
similarde-iden9fica9onstandardforanalysisdatasetsandC
DISCADaMinpar9cular.
Whilemostconceptsdevelopedforde-iden9fyingSDTMda
tasetscanbereusedandmostSDTMdataisavailableinAD
aM,anumberofchallenges
maybeposed:
• Ensuringconsistencybetweende-iden9fiedSDTMandADaMd
atasets
• Developmechanismtoevaluateandde-iden9fyderivedinform
a9onthatmaycontaindataatriskwhilstpreservingdatau9
lity
• PreservetraceabilitybetweenSDTMandADaMdatalayers
ThePhUSEde-iden9fica9onstandardsaimto:
• Facilitatetheiden'fica'onofdirectandquasiiden9fiers
• Providerulestoapplytogetherwithtechnicalguidelines.
• Ensureconsistencyindatade-iden9fica9onacrosssponsors.
• Provideguidanceines9ma9ngresidualriskinde-iddata.
400+downloads!
• RecodingofUniqueIden9fiers
• GeographicalLoca9on
• LowFrequency&RareEvents
• Sensi9veData
• QuasiIden9fierstoKeep(e.g.Sex)
• PIIofThirdParty
+1300variables
STANDARD ENDPOINTS, STANDARDIZED DATA AND SUBGROUP OUTCOMES IN DIABETES: A PATIENT-LEVEL META-ANALYSIS OF CARDIOVASCULAR OUTCOMES Patel T1, Tesfaldet B1, Sviglin H1, Charles J2, Soukup M2, Pucino F3, Chowdhury, I3, Rosario L1, Bull J4, Navarro-Almario E1 1 FDA, CDER, Office of Translational Sciences, Office of Computational Science,
2 FDA, CDER, Office of Biostatistics, 3 FDA, CDER, Office of New Drugs, Division of Metabolism and Endocrinology Products, 5 FDA, Office of the Commissioner, Office of Minority Health
The following criteria were used to select trials for subject-level meta-analyses performed across NDAs within the TZD class.
1. Control: We selected trials with a unique control arm, i.e., different doses of the investigational product were not considered as control.
2. Blinding: We preferentially selected double-blind trials.
3. Randomization/Parallel follow-up: Randomized control trials were selected in which treatment arms were studied in parallel. 4. Sample size/trial durations: We omitted trials with durations exceeding two years or sample sizes exceeding 1000 patients. These were larger trials with longer duration of exposure, and thus patients within these trials are more likely to develop CV events than those within the shorter duration efficacy trials. These trials were analyzed separately.
Good clinical review requires that efficacy and safety outcomes be assessed by relevant intrinsic patient factors that could modify dose-response or toxicity. Further, section 907 of the Food and Drug Administration Safety and Innovation Act (FDASIA) requires FDA to report on clinical trial participation, as well as safety and efficacy outcomes in relevant demographic subgroups (age, gender, race and ethnicity). However, the clinical trial participation of patients of different genders, ages, races or ethnic groups in submitted new drug applications (NDAs) are often insufficient to enable the required safety and efficacy analyses by subgroup. One possible way to overcome this limitation is to aggregate data from clinical trials across an NDA or across multiple NDAs within the same drug class. The Office of Translational Sciences (OTS) in the Center for Drug Evaluation and Research (CDER) at the FDA converted legacy data from 51 pivotal diabetes clinical trials for 10 NDAs into the Study Data Tabulation Model (SDTM) data. These studies were originally submitted in diverse formats and were not designed a priori to support a specific meta-analytic intent. The legacy conversion mapped all adverse events to the Medical Dictionary for Regulatory Activities (MedDRA) version 13, and reference start day was harmonized to the first day of treatment. In this poster, we present meta-analyses of diabetes clinical trials with thiazolidinediones (TZDs) to assess cardiovascular events within age, gender, and racial subgroups, using an endpoint customized by FDA reviewers and utilized in previous FDA meta-analyses.
• To obtain insightful information on the safety of new drugs in patient subgroups by aggregating patient-level data from clinical trials across an NDA or across multiple NDAs with TZDs.
• To estimate the risks of major adverse cardiac event (MACE) by age, gender and race in aggregated clinical trials of patients with type 2 diabetes (T2D) who receive TZDs through a meta-analytic approach.
Disclaimer: The views expressed in this poster are those of the authors and do not represent the policy of FDA. Acknowledgements: We would like to thank the FDA Office of Translational Sciences and the FDA Office of Minority Health for supporting this research.
INTRODUCTION
OBJECTIVES
TRIAL SELECTION CRITERIA
The primary analysis for MACE endpoint was an on-study analysis based on the intention-to-treat (ITT) population, defined as all randomized subjects. Additional sensitivity analysis (on-treatment analysis based on the ITT population) was conducted as well (results not shown here). This primary and sensitivity analyses were based on a cox proportional hazards model stratified by study with a fixed effect for treatment. Due to missing information about event dates, we developed algorithms (Figure 1), which utilized available dates of related events like disposition date, laboratory test dates, etc. as proxy to calculate person-time at risk to first MACE per patient in each trial. For MACE, the number of patients with the event, the time to an event or censoring (for patients without an event), the incidence rate (IR), and the hazard ratio (HR) with 95% confidence interval (CI) stratified by study were calculated.
METHODS The baseline demographics and clinical characteristics (Table 1) were well-balanced between both treatment groups in both meta-analyses. Overall, the populations included in the meta-analyses of TZD trials was predominantly White, male and <65 years of age. Treatment exposure for TZD trials was similar between TZD group and comparator group for subjects who had both start and end dates of treatment recorded, as illustrated by the violin plot in Figure 2.
Subgroup analyses of the on-study meta-analyses illustrated in Figure 3 and 4 showed that the HR for the MACE endpoint associated with TZDs versus comparators was not affected by the following factors: age, sex and race. The results of on-treatment subgroup analyses (not shown here) are consistent with the results of on-study subgroup analyses.
RESULTS
Figure 1: Algorithm for missing and incomplete event dates for time-to-event analysis for MACE
Table 1: Baseline demographics and clinical characteristics
Figure 2: Split violin plots of treatment exposure Small Trials Large Trials
0 500 1000 1500 2000 2500
0
Treatment Exposure time in days
Smoo
thed
Den
sity
ComparatorProduct
Both TZD meta-analyses (12465 T2D patients from three large TZD trials and 2945 T2D patients from seven phase-3 clinical trials) showed that the treatment with TZDs did not significantly increase or decrease the risk of MACE compared to comparator (placebo or active comparator). Similarly, subgroup analyses of the on-study meta-analyses showed that the treatment with TZDs was not associated with either a decrease or increase in the risk of MACE endpoint within age, sex and racial subgroups.
Strength of these meta-analyses: • Inclusion of patient-level data, as it facilitates time-to-event analyses and analyses by patient subgroups of interest. • PTs in all 51 trials were harmonized to the same version of MedDRA, which facilitates the use of same endpoint definition. • Standardized data facilitates the aggregation of trials across NDAs, and it also allows creating algorithms to handle missing dates making it possible to calculate person-time at risk to first MACE event per patient in each trial.
Limitations of these meta-analyses: • These trials were not prospectively designed to support a specific meta-analytic intent. We selected trials using specific criteria, but additional variation in study design, sample size, randomization ratio, duration of exposure, and period of observation could have influenced the observed event rates in the meta-analyses. • Among the trials included in these meta-analyses, individual patient exposure was up to one year (except three large TZD trials where individual patient exposure was approximately three years), so the time available for the development of CV events was limited. • Endpoints were not adjudicated in any trial, allowing for misclassifications.
DISCUSSION
• Populations enrolled in the aggregated database do not reflect the full range of patients with diabetes in the US. • Heterogeneity in event rates observed in trials needs to be explored and understood. • There is limited representation from some of the minority racial subgroups (American Indian/Alaskan Natives, Asians, and Blacks) to draw conclusions. Even after using the aggregated dataset, under representation prevents a comparison of rates by subgroups. To resolve this issue, future trials need to have a balanced representation of patients with diabetes. This is particularly relevant as the risk of cardiovascular events differs across race groups.
CONCLUSION
Figure 4: Meta-analysis of large TZD trials: Forest plot of subgroup analyses - MACE (On-study ITT)
Abbreviations: AEENDTC, Adverse Event end date; AESI, Adverse Event of Special Interest; AESTCTC, Adverse Event start date; BMI, Body Mass Index; DSSTDTC, Disposition start date; HbA1c, Glycated hemoglobin; LBDTC, Lab date; RFENDTC, Subject reference end date; SD, Standard Deviation; TZD, Thiazolidinedione; yr, years.
Note: IRs represent crude incidence rates, not stratified by study.
ENDPOINT Time from randomization to the first MACE, where MACE is defined as a composite of cardiovascular death (CV death), non-fatal myocardial infarction (MI) or non-fatal stroke based on MedDRA preferred terms and AE outcomes of death and hospitalization.
Figure 3: Meta-analysis of small TZD trials: Forest plot of subgroup analyses - MACE (On-study ITT)
Note: IRs represent crude incidence rates, not stratified by study.
0 100 200 300 400 500 600
0
Treatment Exposure time in days
Smoo
thed
Den
sity
ComparatorProduct
Note: The opinions expressed in this poster are those of the authors and do not necessarily represent the opinions of their respective companies
Gitte FrausingCatherine RoyData Standards Decisions [email protected] [email protected]
The Nonclinical Study Data Reviewer’s GuideGitte Frausing, Data Standards Decisions, DK; Catherine Roy, Merck, NJ; PA; Sue DeHaven, Sanofi, Bridgewater, NJ
PP15
According to FDA’s Study Data Technical Conformance Guide v2.2 (June2015), preparation of a Study Data Reviewer’s Guide (SDRG) isrecommended as an integral part of a CDISC standards-compliant studydata submission. An SDRG template, completion guidelines, andexamples for clinical studies have been available since May 2013.Recently, the PhUSE / FDA Nonclinical SDRG Working Group, withrepresentation from Pharma, CROs, and SEND solution vendors, hasdeveloped an SDRG for nonclinical studies with inputs and feedbackfrom the FDA.These materials can be found at:http://phusewiki.org/wiki/index.php?title=Nonclinical_SDRG_Template_and_GuideThe nonclinical SDRG should describe for each study any specialconsiderations that may facilitate review of the dataset by FDA reviewersand data managers. These include clarification of any differencesbetween study report and SEND datasets; identification of SENDstandards, controlled terminologies and versions used in the datasets; asummary of included domains; conformance observations relating toFDA SEND validator rules; and decisions related to data standardsimplementations including deviations and errors where applicable. TheSDRG should include a high-level summary of the process by which theSEND datasets were created from study data. Each SDRG should bespecific to a particular study to enable effective use by FDA reviewersand data managers. Highlights of recommendations for authoring anonclinical SDRG form the basis of this poster presentation.Note: it is critical for an SDRG author to have sufficient flexibility tofocus on what is important for a particular study.
1. Introduction2. Study Design3. Standards, Formats, Terminologies, and their Versions4. Description of Study Datasets5. Data Standards, Validation Rules, Versions, and Conformance6. Sponsor Decisions Related to Data Standards Implementations
The SDRG Table of Contents comes from recommendations in FDA’s Study Data Technical Conformance Guide (most recent version, October 2015).
This section should include high-level information for a reviewer tobecome familiarized with the study submission package:• Study ID Information• SEND dataset creation process• Statement that SEND datasets accurately represent data in the studyreport and, if needed, where in the SDRG any differences are noted
Abstract
SDRG Table of Contents
1. Introduction
Example1.IntroductionThis document provides context for the SEND tabulation datasetsand terminology for Study 54321, in addition to what is provided inthe define.xml file, to facilitate the FDA reviewer’s and datamanager’s use of the datasets.
1.1 Study Protocol Title, Number, and Report Version
1.2 Summary of SEND Dataset Creation ProcessAll in-life, clinical pathology, and postmortem data were collectedusing LIMS 1 (Vendor). Bioanalytical data were determined usingLIMS 2 (Vendor). Toxicokinetic parameters were calculated usingLIMS 3 (Vendor). Input from the each of the LIMS via LIMS-specificadaptors was processed by SEND solution XXX (Vendor) toproduce one integrated SEND dataset, define.xml and PDF files,and a validation report. SEND solution XXX and the LIMS-specificadaptors are Part 11 compliant.1.3 SEND Dataset VerificationData in the SEND datasets are an accurate representation of datain the study report for Study No. 54321. Any differences betweenthe datasets and the report are described in section 6.2.
Study Title A 13-week Oral Toxicology Study in Dogs with C1234 followed by an 8-week Recovery PeriodStudy Number 54321Report Version Final. There have been no report amendments.
This section provides a brief orientation to the study and additionalcontext about the Trial Design Datasets.
This section documents the SEND version, controlled terminologyversion, validation rule version and dictionary version used in the studyand the rationale for the selection.
This section provides an overview of all domains included in the SENDdataset including the Trial Design datasets. Additional text in section 4.2should be provided for any domains that require additional explanation.
All significant conformance findings should be documented in Section 5 to a detail that will provide a reviewer or data manager a quick and clear overview of any issues with the data package and the rationale for their presence.
6.1 Sponsor-Defined Standardization Descriptions such as:• Explanation for why certain data elements could not be fully standardized, if applicable• Comments on inclusion of any derived values6.2 Differences Between SEND Datasets and Study Report such as:• Data included in report but not datasets or vice versa• Differences in study day numbering
6.3 Nonstandard Electronic Data Submitted such as:• Data collected using different terminologies• Electronic data that do not conform to SDTM6.4 Legacy Data Conversion
If data was not collected with a specific standard in mind, this section should outline the legacy data conversion plan for such data.
• Public review, announced through PhUSE, ended October 30, 2015 –All comments have been addressed• FDA informal review of Nonclinical SDRG Package was positive – no comments• A Federal Register announcement is expected for broader public review of the Nonclinical SDRG Package
4. Description of Study Datasets (continued)Example
4.2 Dataset Explanations4.2.1 DS DomainThe DSDECOD of UNPLANNED TERMINAL SACRIFICE wasused for animals in the high-dose treatment group that wasterminated early by protocol amendment. Other animals in thatgroup were terminated prior to issuance of the protocolamendment and were assigned a DSDECOD of MORIBUNDSACRIFICE.
4.3 Supplemental QualifiersDataset Name Associated Dataset Qualifiers UsedSUPPMI MI (Microscopic
Findings)Modifiers from MIORRES for which SEND 3.0 variables have not yet been developedSUPPMA MA (Macroscopic
Findings)Modifiers from MAORRES for which SEND 3.0 variables have not yet been developed
5. Data Standards Validation Rules, Versions, & Conformance
Example5.1 Validation Outcome SummaryOf a total of 31,682 records, there were 0 errors and 1807 warnings. None of the warnings were relevant to this SEND submission for the reasons provided in Section 5.4. 5.2. FDA SEND Validation Rules VersionOpenCDISC Validator version 2.0.1, which includes all FDA SEND validation rules Version 2.0, was used to evaluate conformance to SEND 3.0.
5.3 ErrorsNo errors were reported.5.4 WarningsThe Warnings for Study 54321 resulted from a small number ofFDA SEND validation rules as shown in the table following.
FDA Rule Message Domain Count ExplanationFDAN212 Duplicate Records FW 1347 The validation rule is incorrectly configured because it does not consider FWORRES.FDAN164 Missing value for LBSTRESU when LBSTRESC is provided
LB 79 The value for LBSTRESC is albumin / Globulin ratio, which is not associated with units. Accordingly, LBSTRESU should not be populated, and the validation rule is incorrectly configured.
6. Sponsor Decisions Related to Data Standards Implementations
Status of Nonclinical SDRG Package
2. Study Design
Example2.1 Study Design SummaryIn study 54321, 6 dogs/sex/group were dosed by oral gavage once daily for 13 weeks at doses of 0, 100, and 500 mg/kg C1234. At the end of the treatment period, 4 dogs/sex/group underwent terminal sacrifice. The remaining 2 dogs/sex/group were placed on an 8-week recovery period followed by sacrifice.
2.2 Trial Design Domain Overview
Example3.1 Standards Used
3.2 Rationale for Standards SelectionThe versions listed were the most current ones defined in FDA’sStudy Data Standards Catalog and supported by the company atthe time the study started.3.3 Nonstandard TerminologyNonstandard terminology was used in the EG domain as shown following:
Dataset Component Standard or Dictionary VersionTabulation Datasets CDISC SEND 3.0Data Definition File CDISC DEFINE.XML 1.0Controlled Terminology (CT) CDISC SEND CT 2015-6-24
Dataset Abbreviation
Variable TermUsed
MeaningEG EGTEST Beat-to-
beatQT/TQ ratio
A measure of the ability of the heart to recover from one beat to the next by examining the relationship between action potential duration (QT interval) and diastolic interval (TQ)
3. Standards, Formats, Terminologies, & their Versions
4. Description of Study Datasets
Example4.1 Dataset SummaryDataset Dataset Label Supplemental
Qualifiers?Related using RELREC?
Observation ClassTA Trial Arm
Trial DesignTE Trial ElementsTrial DesignTS Trial SummaryTrial DesignTX Trial SetsTrial DesignDS DispositionEventsDM DemographicsSpecial PurposeSE Subject ElementsSpecial PurposeEX ExposureInterventionsEG ECG Test ResultsFindingsLB Laboratory Test
Results FindingsMA Macroscopic X X FindingsMI Microscopic X X Findings
PhUSE Nonclinical SDRG Working Group (in addition to authors)Jennifer Feldman, Instem Christy Kubin, MPI Research Maureen Rossi, RocheDebra Oetzman, Instem Steve Polley, GlaxoSmithKline Laura Kaufmann, PDS Life SciencesWilliam Houser, Bristol Meyers Squibb Nicola Robertson, GlaxoSmithKline Tania Strimple, Covance
by Gitte Frausing (Data Standards Decisions), Catherine Roy (Merck) and Sue deHaven (Sanofi) won the award for the best collaboration poster. It described the Nonclinical SDRG, which includes templates, completion guidelines and examples. As announced during the CSS opening session, the FDA announced on the Federal Register its intent to review the Nonclinical SDRG. This is further great proof of the high-value output of the PhUSE Working Groups.
Congratulations to the winners of the best poster awards and a big thank you to all poster presenters. The three winning posters can be found in this issue of the PhUSE News. All posters of the PhUSE CSS can be accessed via the PhUSE website.
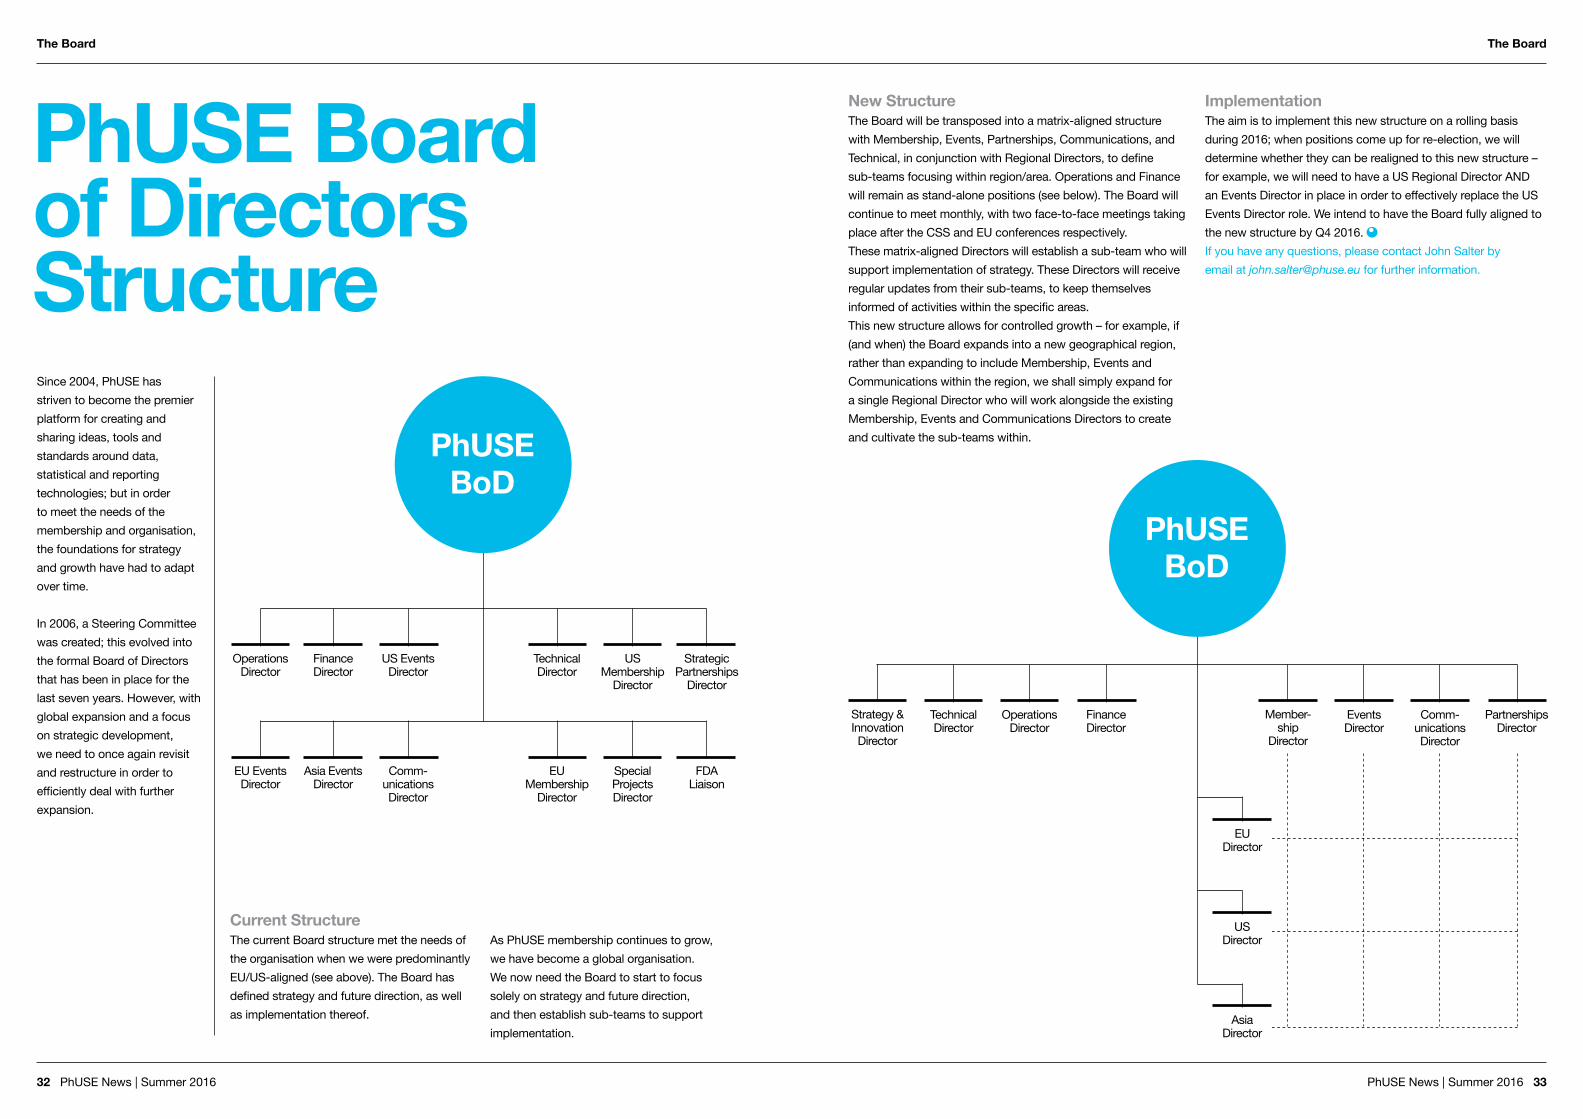
32 PhUSE News | Summer 2016 PhUSE News | Summer 2016 33
The Board The Board
PhUSE Board of Directors StructureSince 2004, PhUSE has striven to become the premier platform for creating and sharing ideas, tools and standards around data, statistical and reporting technologies; but in order to meet the needs of the membership and organisation, the foundations for strategy and growth have had to adapt over time.
In 2006, a Steering Committee was created; this evolved into the formal Board of Directors that has been in place for the last seven years. However, with global expansion and a focus on strategic development, we need to once again revisit and restructure in order to efficiently deal with further expansion.
Current StructureThe current Board structure met the needs of the organisation when we were predominantly EU/US-aligned (see above). The Board has defined strategy and future direction, as well as implementation thereof.
As PhUSE membership continues to grow, we have become a global organisation. We now need the Board to start to focus solely on strategy and future direction, and then establish sub-teams to support implementation.
New StructureThe Board will be transposed into a matrix-aligned structure with Membership, Events, Partnerships, Communications, and Technical, in conjunction with Regional Directors, to define sub-teams focusing within region/area. Operations and Finance will remain as stand-alone positions (see below). The Board will continue to meet monthly, with two face-to-face meetings taking place after the CSS and EU conferences respectively.These matrix-aligned Directors will establish a sub-team who will support implementation of strategy. These Directors will receive regular updates from their sub-teams, to keep themselves informed of activities within the specific areas.This new structure allows for controlled growth – for example, if (and when) the Board expands into a new geographical region, rather than expanding to include Membership, Events and Communications within the region, we shall simply expand for a single Regional Director who will work alongside the existing Membership, Events and Communications Directors to create and cultivate the sub-teams within.
ImplementationThe aim is to implement this new structure on a rolling basis during 2016; when positions come up for re-election, we will determine whether they can be realigned to this new structure – for example, we will need to have a US Regional Director AND an Events Director in place in order to effectively replace the US Events Director role. We intend to have the Board fully aligned to the new structure by Q4 2016. If you have any questions, please contact John Salter by email at [email protected] for further information.
PhUSE BoD
Strategy & Innovation Director
Member-ship
Director
EU Director
US Director
Asia Director
Technical Director
Events Director
Operations Director
Comm-unications Director
Finance Director
Partnerships Director
PhUSE BoD
Operations Director
EU Events Director
Finance Director
Asia Events Director
US Events Director
Comm-unications Director
Technical Director
EU Membership
Director
Strategic Partnerships
Director
FDA Liaison
US Membership
Director
Special Projects Director

34 PhUSE News | Summer 2016 PhUSE News | Summer 2016 35
7 Quick Tips to Building an Interactive DashboardUsing SAS® Base SoftwareA growing number of organizations are using dashboards as a standard mechanism to communicate information. As data sizes continue to grow and the technologies that create dashboards increase in popularity, there is supporting evidence to show best practices are being used in the construction of today’s dashboard designs. The result is a user-friendly and affordable dashboard that users actually enjoy using.
For a dashboard to be useful, it should have the ability to access data from a number of sources, prep and organize the data, a simple-to-use interface, and the capability to display meaningful information including, graphics, tables, statistics, metrics, and other content on a single screen. In the search for building the perfect dashboard, organizations may be confronted with a number of decisions about their information requirements, including:• What are the best ways to handle large
amounts of information?• How should analytical data be
processed?• What choices are available for building
the most effective information delivery mechanisms?
• How should analytical data and results be displayed?
• How frequent should dashboard data be refreshed or updated?
To help answer these and other questions, here are 7 quick tips to building an interactive dashboard using SAS® Base software.
Tip #1 | Define the Organization’s Objectives and Requirements for the DashboardSpend the necessary time researching, identifying and defining as many dashboard objectives and requirements as you can.
Tip #2 | Define the Dashboard Audience and the Type of Dashboard to BuildIdentify who will be using the dashboard – this is your audience. Define everything about your audience including what their information needs are, what decisions do they make, what information do they use on a daily or weekly basis, what level of data do they need, are they familiar with industry abbreviations and acronyms, are they familiar with key performance metrics, do they understand the data, are they prone to making wrong assumptions about the data, and would they know if they saw problems with the data.
Tip #3 | Work with Users and “Key” Team Members to Develop a Simple Dashboard DesignPut together a design team consisting of “key” users in the organization. The design team will essentially be stakeholders in the design and finished dashboard. Develop a simple dashboard design, avoiding complexity every step of the
way. The members of the design team serve as the architects for the dashboard design and will help champion the dashboard design when it is complete. The final dashboard design should be simple to use, be intuitive and be without clutter.
Tip #4 | Define the Organization’s Data Sources, Data Access Methods, Data Segments and Prep DataTake the time to learn your organization’s data sources, any specific access methods, data segments and data preparation requirements. Incorrect or the wrong data can present huge issues for your organization, your users and your dashboard.
Tip #5 | Define the Visuals to display on your DashboardAlways remember to keep the target audience in mind. Define the visuals to display on the dashboard including, metrics, numbers, statistics, gauges, etc. Identifying the perfect metric is an essential task. The perfect metric is actionable, credible, easy to calculate, and easy to comprehend by the dashboard users. If gauges or alerts are used, they should represent common interpretable information with a simple glance. For example, a gauge or alert that shows green-yellow-red indicators should easily convey
“proceed-caution-stop” conditions or a blue-red color indicator should convey “cool-hot” conditions, respectively.
Tip #6 | Use SAS® Base software to Access your Data Sources, build your Dashboard and Dashboard Elements, Metrics, Charts, Tables, Statistics and Drill-downsBuilding dashboards, dashboard elements, metrics, charts, tables, statistics, and drill-downs can all be accomplished using DATA steps, PROC FORMAT, PROC SORT, PROC PRINT, PROC REPORT, PROC SQL, PROC FREQ, PROC MEANS, PROC UNIVARIATE, Output Delivery System (ODS), ODS HTML tagset, PROC TEMPLATE, Statistical Graphics, Macros, and a myriad of other SAS Base software constructs and coding techniques. When coding, it’s always advisable to document your code adding useful comments as necessary, utilize structured coding techniques, and apply best practice programming techniques to permit a dashboard to scale.
Tip #7 | Rollout your organization’s Dashboard to team members and the user communityThe rollout of your dashboard is an exciting time, but it doesn’t necessarily mean the end of user support. As your audience uses your dashboard, understand that dashboards are designed by humans and can fall prey to the assortment of problems associated with errors, data issues, and hiccups of one sort or another. So, from time to time, a dashboard may need a checkup, a tune-up, or a modification or two to fix an identified issue or bug. If you’re interested in the SAS code and table used to create this tip’s interactive dashboard, email [email protected].
Tech tips Tech tips
Quick and Simple Tips Kirk’s Korner
Kirk Paul Lafler@sasNerd Software Intelligence Corporation
Kirk Paul Lafler has been using SAS since 1979 and is consultant and founder of Software Intelligence Corporation. He is a SAS Certified Professional, application and tool developer, provider of IT consulting services, trainer to SAS users around the world, mentor, and sasCommunity.org emeritus Advisory Board member. As the author of six books including Google® Search Complete (Odyssey Press. 2014); PROC SQL: Beyond the Basics Using SAS, Second Edition (SAS Press. 2013); and PROC SQL: Beyond the Basics Using SAS (SAS Press. 2004), Kirk has written more than five hundred papers and articles, been an invited speaker and trainer at four hundred-plus SAS International, regional, special-interest, local, and in-house user group conferences, educational forums, and meetings, and is the recipient of 23 “Best” contributed paper, hands-on workshop (HOW) and poster awards.E-mail [email protected] LinkedIn linkedin.com/in/KirkPaulLafler Twitter @sasNerdTrademark Citations SAS and all other SAS Institute Inc. product or service names are registered trademarks or trademarks of SAS Institute Inc. in the USA and other countries. ® indicates USA registration. Other brand and product names are trademarks of their respective companies.
Senior SAS Consultant, Application Developer, Data Scientist, Trainer and Author Software Intelligence Corporation

36 PhUSE News | Summer 2016 PhUSE News | Summer 2016 37
Welcome to our New MembersNew members New members
We have previously mentioned, with delight, the growing number of PhUSE members, and if you look at the membership numbers on page 38, you can see from the distribution we truly are a global organisation.
The Newsletter team thought it would be nice to hear from some of our new members, and here you can see who they are and where they are located. The Newsletter team always like to hear from our members, and we encourage you to contact us with any articles. With new members comes a wealth of new experience.
Anitha BalakrishnanICON, India
Nicolas PhilippePointCross Life Sciences, France
Ramesh VishwakarmaICON, India
Christine FleemanUCB BioSciences Inc., USA
Lakshmi MallelaJohnson & Johnson, USA
Cilie W. HansenNovo Nordisk A/S, Denmark
Eric BrinsfieldMeridian Analytics, USA
Amy GillespieMerck & Co Inc., USA
Neeraj UpadhyayICON Clinical Research, India
Sai Srinivas Kumar PoosariaDOCS Global, India
Pritesh SolankiMerck & Co Inc., USA
Abdul GhaziKvalito AG, Switzerland
Rainer RichterGrunenthal GmbH, Germany
Jared SlainMPI Research, USA
Bandi RamanjineyuluGlaxoSmithKline Pharmaceuticals Ltd, India
Sujit KhuneNovo Nordisk A/S, Denmark
Roel HoboDanone Nutricia Research, Netherlands
Varun DebbetiCytel Inc, USA
Magdalena KurpierzKvalito AG, Switzerland
Alassane DoumbiaBayer, Germany
By Diana Stuart, Veramed

38 PhUSE News | Summer 2016 PhUSE News | Summer 2016 39
Useful information
If a company signs up for four consecutive issues, they will only be invoiced for the first three.
Advertising will be accepted for PhUSE Monthly eMailshots to all PhUSE members. This will comprise one of the following:• a small banner in the body of the email, which will link to a page on the
advertising company’s website• a brief description of a job advertised, with a link to the full job
advertisement on the company’s website.
The Newsletter is published four times per annum. Copy dates for 2016 are as follows:
Artwork/flyers to be provided by the advertiser, at the advertiser’s cost.
PhUSE reserves the right to charge an administration fee if a confirmed order is cancelled. All prices quoted exclude VAT. Agency commission is not paid.
Please send artwork to [email protected] call +44 (0)1843 609603.
Advertising Costs
Member Figures
Country Members
United States 2,397
India 1,058
United Kingdom 832
China 376
Germany 346
Switzerland 228
Belgium 116
Denmark 96
Japan 96
South Africa 94
Sweden 93
Taiwan 76
Netherlands 74
Russia 71
Canada 60
France 60
Poland 41
Ireland 34
Philippines 33
Italy 24
Spain 15
Romania 10
Korea, Republic of 4
Australia 2
Bangladesh 1
Czech Republic 1
Jamaica 1
Mexico 1
Singapore 1
Total members 6,241
PhUSE News: Paper and Electronic Newsletter
Full page (A4) £500
Back cover £675
PhUSE Event Brochures
Full colour ad in the Annual Conference (hard copy) brochure €800
Flyer/booklet in the Annual Conference bag (650 copies) €800
Full colour ad in the Computational Science Symposium (hard copy) brochure US$1,000
PhUSE Monthly eMailshot
Banner/job advertisement per monthly mailshot £350
Four consecutive mailshots in a 12-month period £1,000
Issue Copy deadline Publication Date
Spring 1st February 1st March
Summer 2nd May 1st June
Autumn 1st August 1st September
Winter 1st November 1st December Advertise with PhUSE
Need to get your message out? Want to build awareness of your brand in the pharmaceutical and health sciences community? Advertising with us could be perfect for you...• Quarterly newsletter delivered
to our global community of over 5,000 members
• Two annual event brochures• Frequent one-day event brochures
For more information, contact the PhUSE Office at [email protected]
PhUSE News | Spring 2016 1
PhUSE NewsSpring 2016
Share / Contribute / Advance
#13610 PhUSE Newsletter Spring Jan 2016 A4 v6.indd 1 16/02/2016 13:08
Fast Track to Approval: Speed and Effi ciencyBarcelona 20169th–12th OctoberPrincesa Sofi a Gran Hotel, Barcelona
Conference Chair Åsa Carlsheimer, TrialbeeConference Co-Chair Jules van der Zalm, OCS ConsultingFor more information visit the PhUSE website phuse.eu/annual-conference.aspx
Annual Conference
#12227 PhUSE Barcelona 2016 Poster June 2015 A4 v4.indd 1 16/02/2016 13:06
Netherlands 2016 | PhUSE Single Day Event 1
NetherlandsSingle Day Events
Data Visualisation
4th February 2016Danone Nutricia Research Offi ces, Utrecht
#13475 PhUSE SDE Netherlands Jan 2016 A4 v9.indd 1 27/01/2016 10:46
PhUSE CSS 2016 35
Computational Science SymposiumMarch 12th–14th 2017Silver Spring Civic Center, Silver Spring, Maryland, USA
Washington National Cathedral
The 6th PhUSE and FDA Collaboration
phuse.eu/css
#13182 PhUSE CSS 2016 Brochure Nov 2015 US Letter v18.indd 35 16/02/2016 13:12

40 PhUSE News | Summer 2016
Better trials. Less error.SAS® Life Science Analytics Framework


