SHARED CAPITALISM IN THE U.S. ECONOMY? PREVALENCE, CHARACTERISTICS,AND EMPLOYEE VIEWS OF FINANCIAL PARTICIPATION IN ENTERPRISES
Douglas L. KruseJoseph R. BlasiRhokeun Park
Working Paper 14225http://www.nber.org/papers/w14225
NATIONAL BUREAU OF ECONOMIC RESEARCH1050 Massachusetts Avenue
Cambridge, MA 02138August 2008
Presented at the Russell Sage/NBER conference in New York City, October 2006. We thank CaseyIchniowski for valuable comments. This paper is part of the National Bureau of Economic Research'sShared Capitalism Research Project, funded by the Russell Sage and Rockefeller Foundations. Additionalfunding for the General Social Survey questions was provided by the Beyster Institute of the Universityof California at San Diego, the ESOP Association, the Employee Ownership Foundation, Hewitt Associates,the National Center for Employee Ownership, the Profit Sharing Council of America, and AmericanCapital. The authors wish to thank Tom Smith with the General Social Survey at the National OpinionResearch Center of the University of Chicago and Peter Marsden of Harvard University with the NationalOrganizations Study for their assistance in arranging the shared capitalism segment of both surveys.Refen Koh, Michelle Pinheiro, and Patricia Berhau provided excellent assistance in survey scanning,entry, and verification. The views expressed herein are those of the author(s) and do not necessarilyreflect the views of the National Bureau of Economic Research.
NBER working papers are circulated for discussion and comment purposes. They have not been peer-reviewed or been subject to the review by the NBER Board of Directors that accompanies officialNBER publications.
Shared Capitalism in the U.S. Economy: Prevalence, Characteristics, and Employee Viewsof Financial Participation in EnterprisesDouglas L. Kruse, Joseph R. Blasi, and Rhokeun ParkNBER Working Paper No. 14225August 2008JEL No. J33,J54,L23
ABSTRACT
Between one-third and one-half of employees participate directly in company performance throughprofit sharing, gainsharing, employee ownership, or stock options. This flies in the face of concernsabout the free rider problem and worker risk aversion in group incentives, and raises many questionsabout the effects on firms and workers. This paper lays out the major reasons we may see such "sharedcapitalism" plans, and reviews recent nationally representative surveys on the prevalence of these plans.We also introduce the NBER shared capitalism data, based on questions added to the 2002 and 2006General Social Surveys (GSS) and more than 40,000 employee surveys from 14 companies with differentcombinations of shared capitalism plans. We find that while shared capitalism exists broadly throughoutthe economy, it is more likely in larger establishments. The free rider effect may be countered bythe use of other policies to create productive teamwork and a cooperative culture: shared capitalismis positively linked to workplace decision-making, training, job security, teamwork, the ability to easilyobserve co-worker performance, and low levels of supervision. Also, more risk-averse employeesavoid participating in several types of shared capitalism, but two-thirds of even the most risk-averseemployees in these companies say they want shared capitalism as part of their pay package. The effectsof these plans for both workers and firms are more fully explored in accompanying papers.
Douglas L. KruseSchool of Management and Labor RelationsRutgers University94 Rockafeller RoadPiscataway, NJ 08854and [email protected]
Joseph R. BlasiRutgers UniversitySchool of Management and Labor RelationsLevin BuildingNew Brunswick, NJ 08544and [email protected]
Rhokeun Park Kwangwoon University26 Kwangwoon-gil, Nowon-guSeoul, Korea [email protected]
3
In the past several decades the U.S. and other advanced countries have seen growth in
direct employee participation in the financial performance of capitalist enterprises. This
participation can take many forms, including profit sharing, gain sharing, bonuses, employee
stock ownership, and broad-based stock options. All of these approaches have one thing in
common: offering the worker a share in profits or stock appreciation when the company makes a
profit. Our broad label for this participation is "shared capitalism."
This growth is driven in part by increased competitive pressures, environmental
volatility, and rapid technological change, which have led firms to implement new forms of
workplace organization and human resource practices. These changes include increased
teamwork, employee participation in decisions, and other practices that can work in conjunction
with financial participation to increase worker productivity, skills, commitment, and job security.
Shared capitalist institutions with new forms of high performance work organization, not
traditional labor-management relations, may be the emerging form of employee relations under
capitalism.
This raises a number of important questions for firms, workers, and economic policy-
makers:
• To what extent are these new modes of financial participation and decision-making
related?
• Are they likely to increase or decrease economic inequality?
• Do they generally supplement or substitute for standard forms of compensation?
• How can they best improve productivity in ways that will benefit both firms and
ordinary workers?
• Do employees welcome shared capitalism or are they uneasy about the increased
4
financial risk and responsibility that this places on them?
• Are the new forms of participation likely to continue to grow?
This paper introduces the NBER project that was established to address these questions.
Following a discussion of why shared capitalism exists at all, we summarize data on the current
forms and extent of shared capitalism in the U.S. economy. We then introduce the General
Social Survey and NBER employee survey datasets that will be used to answer the above
questions in accompanying papers1, and provide an overall portrait of the data and an initial
exploration of how shared capitalism is related to job and company characteristics, work
organization, risk aversion, and worker preferences.
Why Share with Workers?
Standard economic analysis outlines two key problems with shared capitalism plans that
argue against their use. Principal-agent analysis says that owners/managers can improve
employees' performance by giving employees pay contingent on performance, but group
incentives suffer from the free rider or "1/N" problem due to the increasingly weak link between
individual performance and rewards as the size of the group expands. Economic analysis
therefore predicts that firms will favor tying financial rewards to local economic performance
and outcomes rather than to company-wide outcomes. This is because profit-sharing or gain-
sharing based on workplace outcomes can motivate workers in a small group, who can influence
the costs and revenues of that group. Hence, the argument suggests that firms that introduce
financial sharing should eschew company-wide sharing, since there is virtually nothing the local
1 The accompanying papers using the GSS and NBER survey data are Blasi, Kruse, and Markowitz (2008), Blasi et al. (2008), Buchele et al. (2008), Budd (2008), Carberry (2008), Freeman, Kruse, and Blasi (2008), Harden, Kruse, and Blasi (2008), and Kruse, Freeman, and Blasi (2008). These issues are addressed using additional U.S. and UK
5
group can do to affect the share price of the firm.
A second key problem with shared capitalism plans is income variability for risk-averse
workers. Firms are predicted to select the least costly form of rewarding workers. In traditional
analyses where firms are risk-neutral and workers are risk-averse, this means paying employees
wages or salaries, rather than with variable pay dependent on company performance. Firms that
offer more risky modes of wage payment should have to compensate workers for risk.
Given these (and other2) problems, why are there any shared capitalism plans? The
major reasons for adopting shared capitalism can be categorized as productivity- or flexibility-
related.
Productivity reasons for shared capitalism plans
Firms may find that group incentives are better than individual incentives for
encouraging productive teamwork and information sharing, especially where centralized
supervision is costly. The free rider problem may be overcome by creation of an implicit
cooperative agreement among employees to work hard, enforced by monitoring co-worker
performance and applying peer pressure where needed (Weitzman and Kruse, 1990). What it
takes to create and maintain such an agreement is unclear and may vary from workplace to
workplace—it is likely that company human resource policies, employee relations, and general
corporate culture play a large role. A growing body of literature finds that combinations of
workplace policies may induce behaviours that improve performance (see, e.g., Ichniowski et al.
datasets in Bryson and Freeman (2008) and Dube and Freeman (2008). 2 While these are the two most common theoretical objections to shared capitalism plans, there are others as well. These include the possibility that diluting the economic surplus received by the owner will decrease performance by weakening the owner's incentive to monitor workers closely (Alchian and Demsetz, 1972), and the objection that profit sharing will decrease the firm's incentives to make capital investments (Summers, 1986). See Putterman and Skillman (1988) and Weitzman (1986) for responses to these, and Bonin and Putterman (1987) and Dow (2003) for additional theoretical arguments for and against shared capitalism plans.
6
1996). It has been demonstrated that globalization in specific industries and firms is linked to
the adoption of high performance work practices in firms in specific industries (Blasi and Kruse,
2006).
A productivity motivation for adopting and maintaining shared capitalism plans is
directly expressed by many firms (U.S. GAO, 1986: 20; Kruse, 1993: 33), and is supported by
several findings in studies of adoption.3 Studies generally find, however, that profit-sharing and
employee ownership plans are more common in large firms, which runs counter to the idea that
the free rider problem will favor greater productivity in small firms.4
Shared capitalism does appear to create productive cooperation at least in some
companies. Existing evidence from over 60 studies indicates a positive association on average
between shared capitalism programs and company performance, but with substantial dispersion
in results (Kruse and Blasi, 1997; Kruse, 2002). The average estimated increase in productivity
associated with employee ownership and profit sharing is about 4.5%, and is maintained when
using pre/post comparisons and attempts to control for selection bias. Boning, Ichniowski, and
Shaw (2001) find positive effects of group incentives, particularly when combined with problem-
solving teams. Other studies of gainsharing also find positive results, particularly when there is
high employee involvement in design and operation, shorter pay out periods, controllable targets,
and perceptions of procedural and distributive justice (Bullock and Tubbs, 1990; Collins, 1998).
Many of the effects of shared capitalism plans on performance are likely to work through
3 Oyer and Schaefer (2005) find that adoption of broad-based stock option plans can be explained by retention and sorting, but not incentive effects. Kruse (1996) finds that R&D levels are higher among old profit-sharing firms, and job enrichment plans were more likely to be adopted just before new profit-sharing plans, suggesting complementarities aimed at improving productivity. Beatty (1994) finds that risk variables suggest a productivity motivation for adoption of ESOPs. Ichniowski and Shaw (1995) find that group incentives are more likely to be adopted when they are part of a package of complementary policies to improve productivity, and also find evidence of large switching costs that discourage firms with established technologies and workplace relationships from
7
employee attitudes and behaviours.5 Most studies find that organizational commitment and
identification are higher under employee ownership, while giving mixed results between
favorable and neutral on motivation and behavioral measures (Kruse and Blasi, 1997). The
results are consistent with opinion polls which find that most members of the public think that
workers in employee ownership firms work harder and better (reviewed in Kruse and Blasi,
1999).
Flexibility reasons for shared capitalism plans
Firms may also adopt shared capitalism plans for flexibility-related reasons. These plans
can provide something of value to workers without a fixed obligation (such as a wage or salary
increase) that the company may have difficulty meeting depending on future performance and
the competitive environment. A flexibility motivation is supported by the finding that increased
volatility in profits helps predict adoption of profit sharing and employee ownership plans
(Kruse, 1996), although another study found that low-risk firms are more likely to provide
company stock matches in 401(k) plans (Brown et al., 2004).
Some of the firm's financial risk is being shared with workers, which as noted above may
disadvantage risk-averse workers unless they are compensated for the risk. Consistent with the
idea that workers are risk averse, most prefer straight wage salary to company-wide or individual
incentives; however, a majority express positive views toward employee ownership and profit
sharing, and would like at least part of their next raise to be in company stock (summarized in
Kruse and Blasi, 1999). The extant evidence indicates that workers generally do not sacrifice
pay and benefits for shared capitalism plans: wages and compensation tend to be higher on
adopting new practices. 4 See Gregg and Machin (1988), Poole (1989), Fitzroy and Kraft (1995), and Kruse (1996). 5 Bartel et al. (2003) find that employee attitudes affect a variety of workplace outcomes.
8
average for workers in employee ownership and profit sharing plans (Blasi et al., 1996; Kardas
et al., 1998; Kruse, 1993: 113-114; Kruse, 1998; Scharf and Mackin, 2000). In exchange for the
financial risk, workers may benefit through lower risk of displacement: prior studies find that
employee ownership firms tend to have more stable employment and higher survival rates than
other firms (Craig and Pencavel, 1992, 1993; Blair et al., 2000; Park et al., 2004). The
prediction by Weitzman (1984) that profit sharing should stabilize firm employment has also
received support in many, though not all, studies.6
Other reasons for shared capitalism plans
There are several reasons that firms may adopt shared capitalism plans apart from those
that are productivity- or flexibility-related. First, firms may adopt such plans due to tax and
regulatory incentives—for example, ESOPs enjoyed substantial tax incentives in the 1980's, and
retiring owners can still avoid capital gains taxes if they sell their stock to an ESOP. Second,
some employee ownership plans were adopted in the 1980's in response to hostile takeover
threats (Blasi and Kruse, 1991). Both takeover threats and tax incentives were clearly a factor in
some 1980's ESOP adoptions (Blasi and Kruse, 1991; Beatty, 1994). Third, firms may adopt
employee ownership or profit sharing out of a desire to discourage unionization by increasing
employee identification with the company. Profit sharing plans are less common among
unionized workers, which at least partly reflects firms dropping such plans after a union drive
(Freeman and Kleiner, 1990; Mitchell et al., 1990; Kruse, 1996). Findings are mixed on the
6 Studies of Weitzman's prediction that profit sharing should stabilize firm employment have produced mixed findings: a majority support the proposition that firms view profit sharing differently from fixed wages in making employment decisions, while half of the studies find greater employment stability associated with profit sharing and the other half find either no greater stability or greater stability only in some samples (summarized in Kruse, 1998: 109-113).
9
relation between unionization and employee ownership.7
Finally, shared capitalism plans may be adopted and promoted for moral or social
reasons. Albert Gallatin, a signer of the Declaration of Independence and Secretary of the
Treasury under Thomas Jefferson, set up a profit sharing plan at the Pennsylvania Glass Works
in 1795, stating that the "democratic principle upon which this Nation was founded should not be
restricted to the political processes but should be applied to the industrial operation" (quoted in
U.S. Senate 1939: 72). Workers who started the first unions in colonial American coastal cities
set up some worker cooperatives as alternatives to the craft firms where some master craftsmen
were attempting to introduce more division of labor in order to de-skill traditional craft workers
and reduce their pay. A century later, some labor organizations set up worker cooperatives as
part of a political challenge to how capitalism was developing, while others saw employee
ownership and profit sharing as a means to build support for capitalism in opposition to the
competing communist and socialist systems—arguing that it would help cure "unrest" and
"irrational agitation" in capitalism, and that the "great uplift and inspiration that sharing of
profits cultivates in the employee" would lead to "harmony and contentment" (Askwith, 1926:
20). John D. Rockefeller and other corporate leaders in 1919 encouraged employee ownership,
employee involvement in corporate decision-making, and profit sharing as part of a grand plan
for "welfare capitalism" that spread in the 1920's. Profit sharing was promoted in the 1930's in
Congressional hearings in the 1930's by Republican Senator Arthur Vandenberg, and ESOPs
were promoted by investment banker Louis Kelso in conjunction with Democratic Senator
7 Gregg and Machin (1988) and Poole (1989) find employee ownership is more common in unionized companies in the UK, while Kruse (1996) finds that ESOP adoption was equally likely in union and non-union establishments in the 1970's and 1980's.
10
Russell Long of Louisiana in the 1970's, as ways to broaden participation in the economic
system.8
In sum, the two key objections to group incentives—the free rider problem and worker
risk aversion—have not been sufficient to quash shared capitalism plans. They continue to be
adopted and maintained, providing a fertile ground for examining outcomes for both firms and
workers. As will be seen, such programs now involve over a third of adult workers in the
economy, albeit at different levels of intensity and with different combinations of work practices.
The next section reviews current data on the prevalence of shared capitalism plans, followed by
a more intensive look at the kind of company policies associated with shared capitalism that can
shed light on how they are used by companies.
Prevalence of Shared Capitalism Programs
There are a variety of forms that shared capitalism programs can take, which we break
into four broad categories: profit sharing, gainsharing, employee ownership, and stock options.
The NBER Shared Capitalism program sponsored several questions on shared capitalism in the
2002 and 2006 General Social Surveys and the 2003 National Organizations Survey, providing
the most recent representative data available. The results from these surveys are summarized in
Table 1, while Appendix Table A-1 summarizes other nationally representative surveys and
administrative data over the past 15 years. All of the surveys have high response rates. Four of
the surveys were conducted by the U.S. Census Bureau (the two National Employer Surveys, the
National Compensation Survey and the National Longitudinal Survey of Youth), two surveys
were conducted by the National Opinion Research Center of the University of Chicago (General
8 For a more extensive history of shared capitalism see Blasi, Kruse, and Bernstein (2003).
11
Social Survey and National Organizations Survey), and two were conducted by professional
survey organizations (the Worker Representation and Participation Survey by Princeton Survey
Research Associates, and the Employee Benefits Research Institute survey by Gallup). All
surveys are based on the full private sector, except the National Employer Surveys which are
limited to private for-profit firms.9
There is no hard and fast definition of profit sharing. Many firms have formal plans that
are called profit sharing, but there is variation in a) how profits are defined, b) whether profits
must meet a threshold level, c) whether some or all of the profit share is discretionary, and d)
whether the profit share is paid in cash or is deferred (put into a defined contribution pension
plan). In addition, firms may have bonus plans that are not called profit sharing, but which
effectively share profits since the bonus is affected by how well the company is doing. As
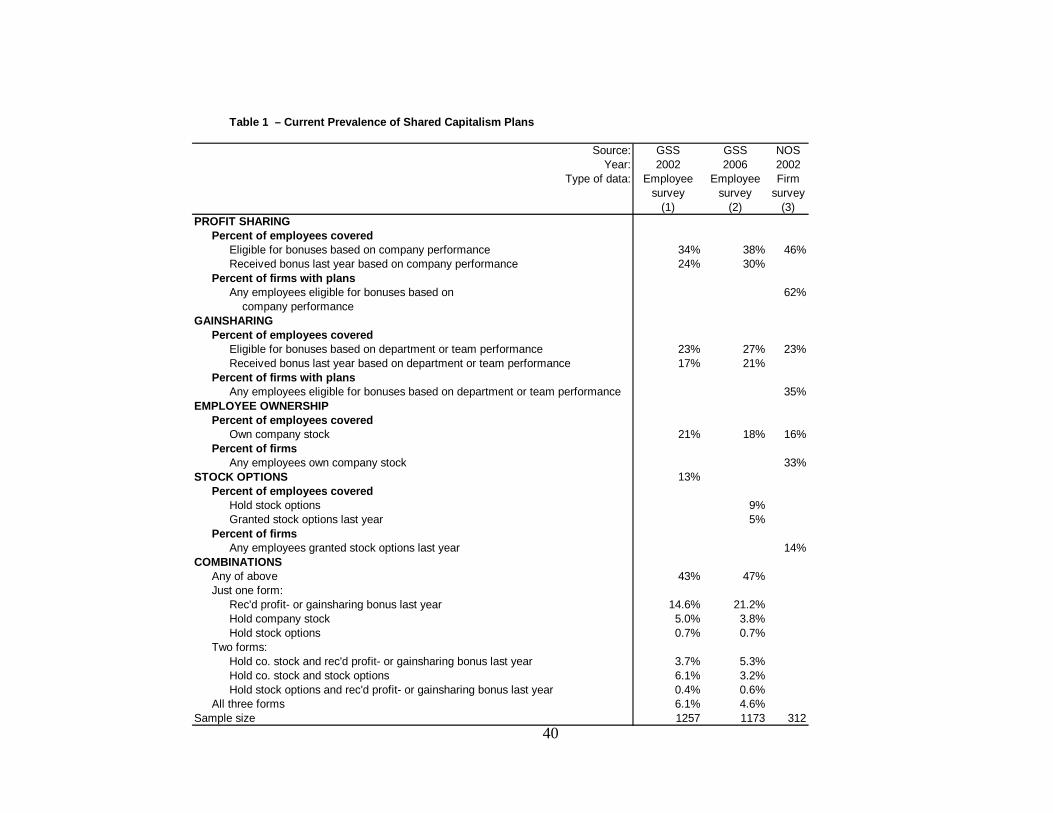
shown in Table 1, just over one-third of employees say that they are covered by profit sharing in
2002 (34%) and 2006 (38%), which is in line with earlier employee surveys in Table A-1.
Employers reported a higher percentage of employees eligible for bonuses based on company
performance (46%), though another survey using a more restricted definition showed lower
figures (30% of workers are in a deferred profit-sharing plan while 5% are in a cash profit
sharing plan, in Table A-1).
Gainsharing plans typically tie employee compensation to a group-based operational
measure -- such as physical output, productivity, quality, safety, customer satisfaction, or costs --
rather than to a company-wide financial measure such as profitability or returns. These plans
often involve employees in some formal way to develop ideas and skills for improving
9 The full private sector figures include non-profit organizations. While these organizations cannot have employee ownership and stock options, they can have organization- and group-based bonuses that are equivalent to profit sharing and gainsharing, so their inclusion provides the best estimates of the extent to which shared capitalism has
12
performance. The three most popular types are Scanlon, Rucker, and ImproShare plans,
although there is a growing number of custom-designed plans. As shown in Table 1, employee
and company surveys agree that about one-fourth (23-27%) of employees are eligible for
bonuses based on group or workplace performance.10
Employee ownership of company stock can occur in a variety of ways. Combining all
the ways, the GSS surveys in Table 1 show that roughly one-fifth of employees report owning
some company stock (21% in 2002 and 18% in 2006, which is in line with earlier surveys in
Table A-1). The most popular type of plan is the ESOP (Employee Stock Ownership Plan). The
ESOP is distinguished by the fact that workers do not have to use their own money to buy the
stock (unless stock was traded for wage and work rule changes which happens only in a very
small minority of ESOPs). Federal legislation allows companies to borrow money from a bank to
fund the worker stock and pay for it in installments from company revenues. About 5% of
employees are part of ESOPs (Table A-1). Employees may also own company stock through
other types of defined contribution plans. Many employees have bought stock through their
company 401(k) plan, a retirement plan where they make pre-tax contributions from their
paycheck. Sometimes corporations will match employee contributions to 401(k) plans with
company stock, so this type of employee ownership is closer to the ESOP because workers do
not buy it. About 20% of workers are eligible for a defined contribution plan that holds
employer stock (Table A-1). These non-ESOP pension plans also include various ERISA-
covered stock bonus plans and deferred profit sharing trusts (often combined with 401k plans)
permeated the entire private sector. Other papers in the NBER project restrict attention to for-profit firms. 10 About two-fifths (43%) of Fortune 1000 surveyed companies have gain-sharing plans somewhere in the company, although most include less than 20% of employees (Lawler et al., 1995: 19). Broader surveys of compensation and human resource managers have found that only about one-eighth (13%) have formal gainsharing plans (Collins, 1998).
13
which actually hold some of their assets in company stock.
Employees can also own company stock outside of pension plans. Employee Stock
Purchase Plans (ESPPs) allow workers to buy stock with deductions from their paycheck with a
discount from the market price, and some corporations provide employees direct grants of stock
as part of a stock bonus plan. Employees may also hold onto stock after exercising stock
options, or own stock through open market purchases. These plans combine with the pension
plans to make about one-fifth of private sector employees into employee-owners.
Stock options represent a kind of hybrid between profit sharing and employee ownership.
A stock option is the right to buy the stock at a set price for 10 years into the future. The worker
does not have to purchase the stock. Receiving one hundred stock options to purchase Biotech
Inc. stock at $10 per share gives the worker the right to exercise these options anytime over 10
years if the stock price goes above $10 per share. During the ten years, the worker can for
example buy a stock trading at $15 a share for $10 per share, then sell the stock, and pocket the
$5 profit after taxes. While stock option excesses have been abused among higher executives,
for other managers and workers, a stock option has less risk than using one’s savings to buy the
stock and really involves the right to the upside gain without the risk of losing one’s capital. The
GSS surveys show a decline in stock option holding from 13% in 2002 to 9% in 2006, which we
believe is due to the Security and Exchange Commission’s implementation of stock option
expensing that led some companies to cut back on broad-based plans.11 Only 14% of companies
reported making stock option grants in 2002 and 5% of employees in the 2006 GSS reported
11 This drop in stock option holding likely accounts for the drop in the percent of workers in the computer services industry who own company stock (from 58.3% to 31.9%). Because employee ownership often comes about as a result of being granted stock options, this drop is likely an unintended consequence of the employee stock option expensing.
14
actually receiving a stock option grant in the prior year (Table 1), while other surveys showed
that 8% of employees are eligible to receive stock options (Table A-1).
The prevalence of any type of shared capitalism is high: the GSS surveys showed that
43% of employees reported participating in one or more of the above plans in 2002, rising to
47% in 2006 (Table 1). The rise in profit-sharing and gainsharing eligibility more than offset the
declines in employee ownership and stock option holding between these two years. Earlier
surveys show that between 41% and 75% of firms have shared capitalism plans (Table A-1).
What is the overlap among the different types of shared capitalism? This issue has never
been comprehensively explored until the 2002 and 2006 General Social Surveys. As shown in
Table 1, close to 15% of employees in the 2002 survey received a profit- or gainsharing bonus in
the prior year but do not own company stock or hold stock options, rising to 21% in 2006. There
were 4-5% who just own company stock and less than 1% who just hold stock options. About
10% had two of the three forms of shared capitalism in both years, while 5-6% had all three.
The important point here is that employee ownership and stock option holding are uncommon on
their own, and typically paired with another type of shared capitalism. Over three-fourths of the
employee-owners also have profit/gainsharing bonuses and/or stock options, while almost all of
the 13% who hold stock options also have profit/gainsharing bonuses and/or employee
ownership. This high overlap suggests that firms may believe that it is worthwhile to examine
employee ownership and stock options in combination with each other and profit/gainsharing.
Employee ownership and profit sharing have also received substantial attention in other
advanced countries and transition economies. With coverage similar to that in the U.S.,
between 20% and 30% of workers in France, Great Britain, Italy, and Japan are covered by some
15
form of profit sharing, while smaller numbers covered by employee stock ownership (Del Boca
et al., 1999; Jones and Kato, 1995). Across the European Union, between 5% and 43% of firms
within each country have profit-sharing plans, between 1% and 22% have employee share
ownership, and between 5% and 38% have team-based bonuses (European Foundation for the
Improvement of Living and Working Conditions, 1997; Pendleton et al., 2003). Some employee
ownership is also found in some socialist countries transiting to private ownership, including
China (Tseo, 1996), Russia (Blasi et al., 1997), and the countries in central and eastern Europe
(Uvalic and Vaughan-Whitehead, 1997; Smith et al., 1997). Broad-based stock options have
appeared in stock market companies and high tech firms in Asia and are newly emergent in
China and India.
Employee participation in decision making is often seen as complementary to financial
participation, most basically because financial participation provides the incentive to improve
performance while participation in decision making can provide a means to improve
performance. Before looking at their overlap in the next section, Table 2 summarizes the most
recent survey data on the overall prevalence of employee participation in decisions. There is a
lot of variation in the types and measures of employee participation. About two-fifths of
employees report having a lot of influence in decisions or say they often participate with others
in job decisions in both 2002 and 2006, while one-third of employees report being in an
employee involvement team (30%) or self-directed work team (33%). Firms report a lower
number of employees in these plans (17% each), while about two-fifths of firms report having
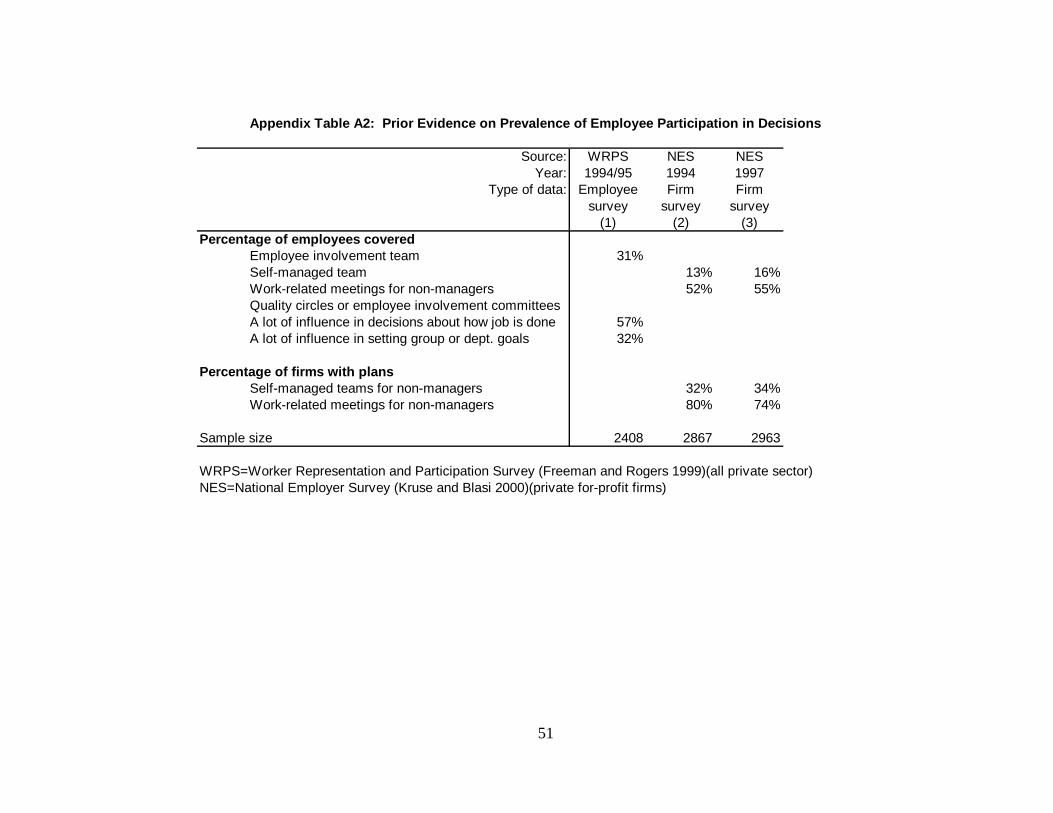
these plans at all. Data from earlier surveys in Table A-2 show great dispersion using different
measures, from a low of 13-16% of employees in self-managed teams to a high of 52-55% of
employees in work-related meetings for nonmanagers.
16
Looking Inside the Shared Capitalism Firms
The current NBER project was established to take a closer look at shared capitalism
plans, providing a more complete portrait along with an analysis of their causes and effects. The
first component of this project was to place several questions on the 2002 and 2006 General
Social Surveys, in order to collect data from a representative sample of employed Americans.
The basic results were presented in Tables 1 and 2. The second component of the project was to
do a more intensive look by conducting employee surveys in a number of firms that use shared
capitalism programs. Project members recruited 14 companies with a variety of shared capitalist
programs, and surveys were conducted over the 2001-2006 period.
The NBER database
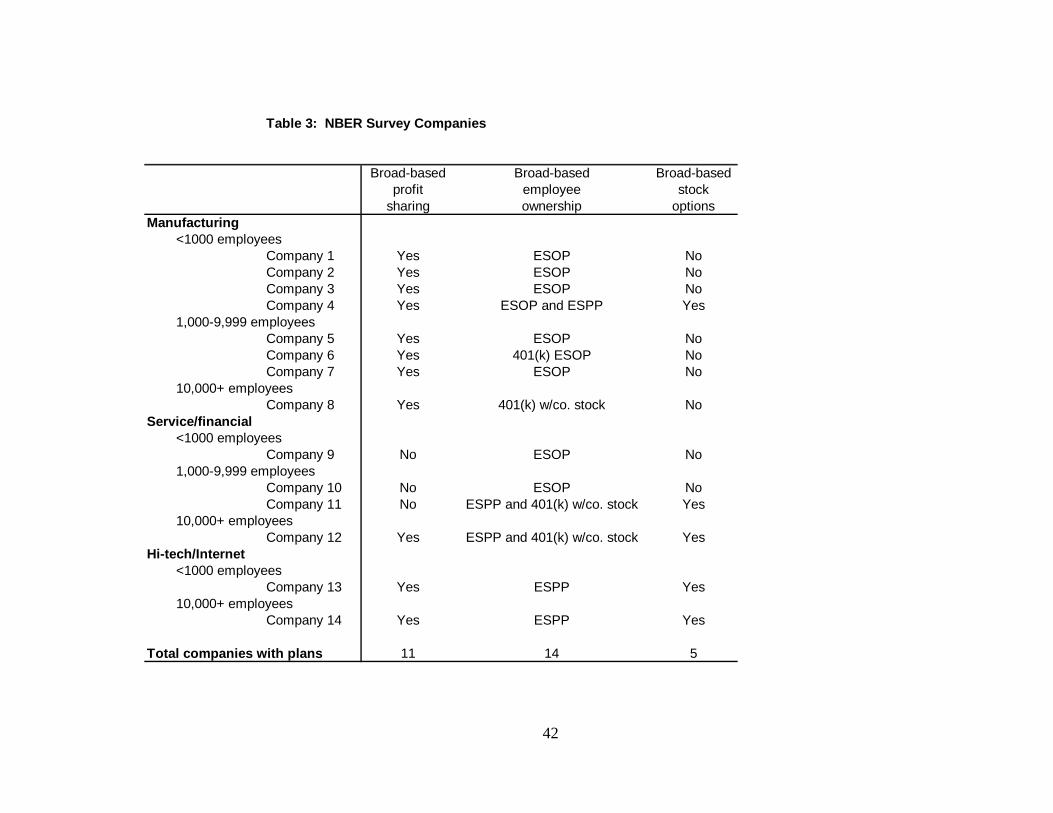
Basic information on the shared capitalism firms is contained in Table 3 (described only
in broad terms to preserve company confidentiality). All of the firms have some sort of broad-
based employee ownership plan, but the plan types vary: eight have standard ESOPs, one has a
401(k) ESOP, four have Employee Stock Purchase Plans (ESPPs), and three have 401(k)'s with
company stock. Eleven of the firms have broad-based profit-sharing plans, while five have
broad-based stock option plans. We also have variation by company size (six with fewer than
1000 employees and three with more than 10,000 employees), and industry (eight in
manufacturing, four in service/financial, and two in high-tech/Internet).
While there is useful variance in types of companies and plans, we acknowledge that our
sample is non-representative, first because many firms refused our requests to run the survey,
and second because two of the firms were bought out by others who refused to proceed with the
planned survey. Each company in the sample agreed to have our research group administer a
17
survey to all or a random sample of employees. The survey included core questions common
across all companies, and some questions of special interest or relevance to that company. Six
company surveys were conducted entirely by web, seven company surveys were done on paper,
and one survey was done using both the web and paper. The company response rates ranged
from 11% to 80%, with an average of 53% across the 14 companies. A total of 41,206
respondents provided usable surveys.
Question wordings for the GSS and NBER measures are provided in the appendix.
Size of financial stakes in shared capitalism
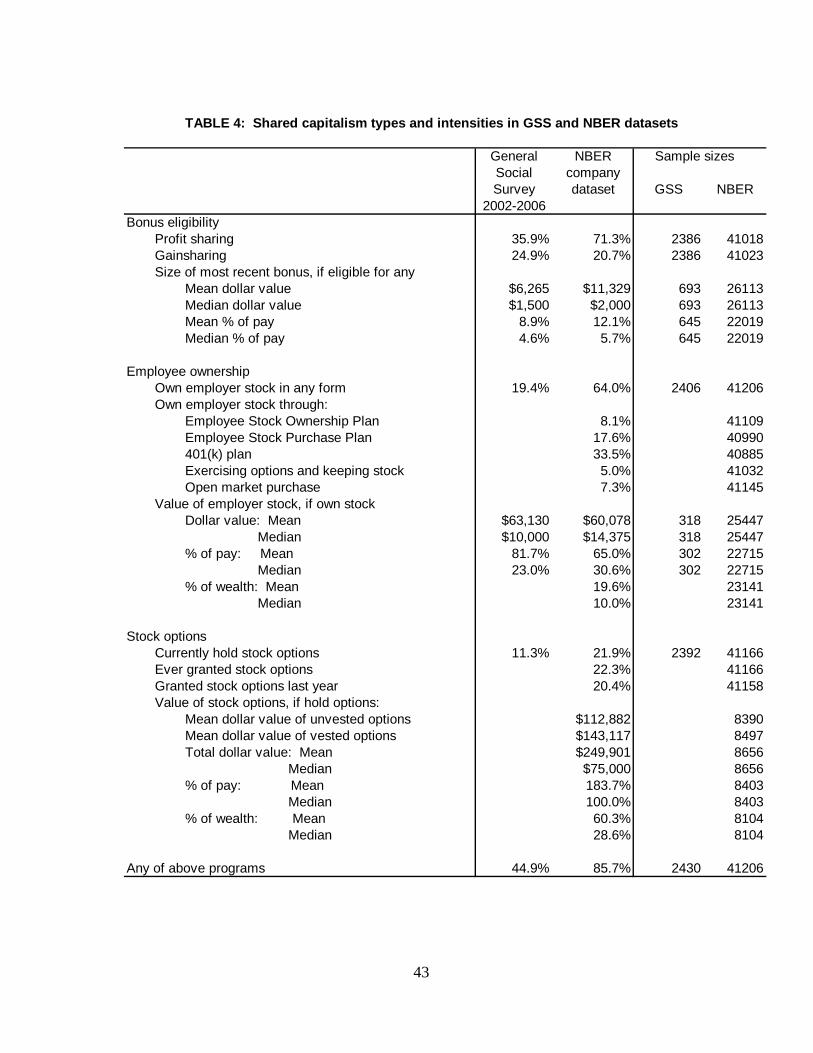
The extent and characteristics of shared capitalism programs in the GSS and NBER
datasets are presented in Table 4. This table combines the 2002 and 2006 GSS prevalence
figures from Table 1 (showing about one-third of workers covered by profit sharing, one-fourth
covered by gainsharing, one-fifth holding company stock, and one-ninth holding stock options),
and adds detail on the financial stakes involved. The monetary value appears to be significant
for covered employees. The median profit sharing and gain sharing bonus in the GSS is $1,500
or 4.6% of annual pay, and employer stock totals $10,000 or 23% of annual pay for the median
employee-owner.
The column labelled "NBER company dataset" naturally gives higher figures for the
shared capitalist modes of compensation since we selected these firms on the basis of having
these programs. Seventy-one percent of the workers in the firms report being paid by profit
sharing, 21% report gain sharing, 64% report owning employer stock, and 22% report holding
stock options. Overall, 86% of surveyed workers report having at least one of these programs.
The size of the median profit-sharing and gain sharing stake are only somewhat higher among
18
the NBER companies than in the GSS (5.7% compared to 4.1%), as is employee ownership as a
percent of pay (30.6% compared to 21.2%). The median stock option holding is $75,000
(counting the estimated profit on both vested and unvested stock options if they were exercised
on the day of the survey), representing 100% of annual pay and 29% of total wealth. These
stakes should be large enough to detect effects on worker and firm outcomes, if such effects
exist.
Participation by type of job and company
Where are shared capitalism plans most likely? Theory broadly suggests that they are
most likely to be adopted in jobs and companies where performance is most sensitive to
employee effort, or where the need for flexibility is greatest. Table 5 provides participation rates
by basic job and company characteristics, using both the representative GSS dataset and our
larger NBER dataset with more extensive measures.
The idea that shared capitalism is most likely in performance-sensitive jobs is supported
by the finding that profit/gainsharing is most common among sales and management employees
(48% and 56%, in col. 1), but the incidence remains substantial among all but service employees
(19%). Managers are also the most likely to own company stock (27%, col. 2), but are not
particularly more likely to hold stock options (14%, col. 3). The NBER data show high levels of
participation in profit/gainsharing and employee ownership for all occupational groups, and low
levels of stock options only among production workers and service employees (since the NBER
stock option companies had few production or service employees, although this is not true for all
stock option firms in the U.S.).
19
Those who have been at their jobs for less than one year are the least likely to participate
in shared capitalism, partly reflecting probationary periods (e.g., employees only become eligible
for an ESOP after 6 months or one year). The exception is that new employees are more likely
than older employees to hold stock options in the NBER dataset, probably reflecting the use of
stock options to lure workers into the jobs.
Not surprisingly, shared capitalism is more common among full-time employees in both
the GSS and NBER data—such employees are more likely to be core employees whose
commitment and effort are important to workplace performance. Also not surprisingly, union
members are less likely than non-union employees to be part of profit/gainsharing plans (38%
vs. 14%, in col. 1). Unions tend to resist profit sharing due to concerns that management can
manipulate profit figures, and that such pay can create inequality among workers (Zalusky,
1990). It is striking, however, that union members in the GSS are actually slightly more likely
than non-union employees to report owning company stock and holding stock options. While
there have been some noteworthy examples of unions leading employee buyouts (which make up
a very small percentage of firms with employee ownership), this employee ownership result
more likely reflects the greater likelihood of retirement plans among union employees, many of
which invest in company stock.
The free rider problem predicts that these plans will be most advantageous in small
workplaces. Contrary to this prediction, larger establishments are more likely to have each of
the types of shared capitalism (cols. 1-3). All three types of shared capitalism are most common
in establishments with 1000 or more employees. These large establishment sizes strongly
suggest that if these companies want to use shared capitalism to enhance performance, they need
to take steps to counter the free rider problem.
20
Finally, shared capitalism is well-represented in every broad industry. Profit/gainsharing
is most common in manufacturing, finance, and computer services (>50% in each), while
employee ownership and stock options are most common in transportation/ communications/
utilities, finance, and computer services. The figures are consistently highest in computer
services, reflecting the strong use of these incentives in new economy companies that rely
heavily on human skill and ingenuity (Blasi, Kruse, and Bernstein, 2003). This is not consistent
with the notion that shared rewards (especially employee ownership) will only work with
professional groups such as lawyers or more specialized service firms (Hansmann, 1996).
Work organization and shared capitalism
How are these jobs structured, and what policies accompany shared capitalism plans?
Table 6 uses the GSS and NBER data to explore how shared capitalism relates to several aspects
of work organization and policies, shedding some light on the role these plans may play in
companies. The figures in Table 6 are simple cross-tabulations—these relationships are
analyzed using probit regressions in Table 7.
Consistent with the idea that shared capitalism can encourage cooperative teamwork,
profit/gainsharing employees are more likely to work in teams, to be able to observe co-worker
performance, and to have low levels of supervision (cols. 2, 6). The patterns are mixed,
however, for employee-owners and stock option holders. The stock option holders are more
likely to work in teams and to have low levels of supervision, but are no more likely (and may be
less likely) to easily observe co-worker performance (cols. 4, 8). This may have to do with their
concentration in high tech and computer industry firms. Employee-owners are not more likely to
work in teams or to find it easy to observe co-workers, although they are more likely to have low
21
levels of supervision (cols. 3, 7). This suggests that profit/gainsharing may be the primary
method for encouraging cooperative teamwork in day-to-day work, while employee ownership
and stock options may affect other outcomes (e.g., identification, loyalty, turnover). This is a
good example of how we can learn from the analysis of prevalence. It could possibly be the
basis of an argument for combining short-term forms of shared capitalism like profit/gainsharing
with longer horizon forms such as employee ownership and stock options. Whether these forms
do have the effects suggested by the prevalence figures is the job of accompanying papers to sort
out.
Participation in decisions may, as discussed earlier, be an important complement to
shared capitalism programs in affecting workplace performance. Such participation can give
employees the means to improve performance, while shared capitalism provides the incentives.
The data in Table 6 generally support the idea of complementarity, with shared capitalism
employees having higher levels on both the objective measure of participation (being in an
employee involvement team) and the subjective measures (having say/influence in one's job, or
participating with others in decisions affecting one's job). Profit/gainsharing is consistently
linked to higher participation in both datasets, while employee ownership and stock option
holding show mixed results in the GSS but strong associations with participation in the NBER
data.
Training may be another important complementary policy, helping to develop worker
skills and commitment that can be reinforced by shared capitalism. The GSS tabulations in
Table 6 show that those with profit/gainsharing are more likely to report that they have the
training opportunities they need. The shared capitalism employees in the NBER firms are more
likely to have had employer-sponsored training in the past year, while profit/gainsharing
22
employees and employee-owners—but not stock option holders—are slightly more likely to
frequently participate in job rotation.
Finally, job security may be an important complementary policy—it is hard to maintain
worker commitment and cooperative teamwork if employees are afraid they will be laid off. Just
over 90% of the GSS shared capitalism employees report they are unlikely to be laid off, which
is higher than the 88% figure for the entire sample, with significantly greater job security for
profit/gainsharers and employee-owners. All three groups of shared capitalism employees report
significantly greater job security in the NBER data. In addition, each of these three groups
reports a higher expected likelihood of working at the company for a long time, and of seeing
their current jobs as part of a long-term career.
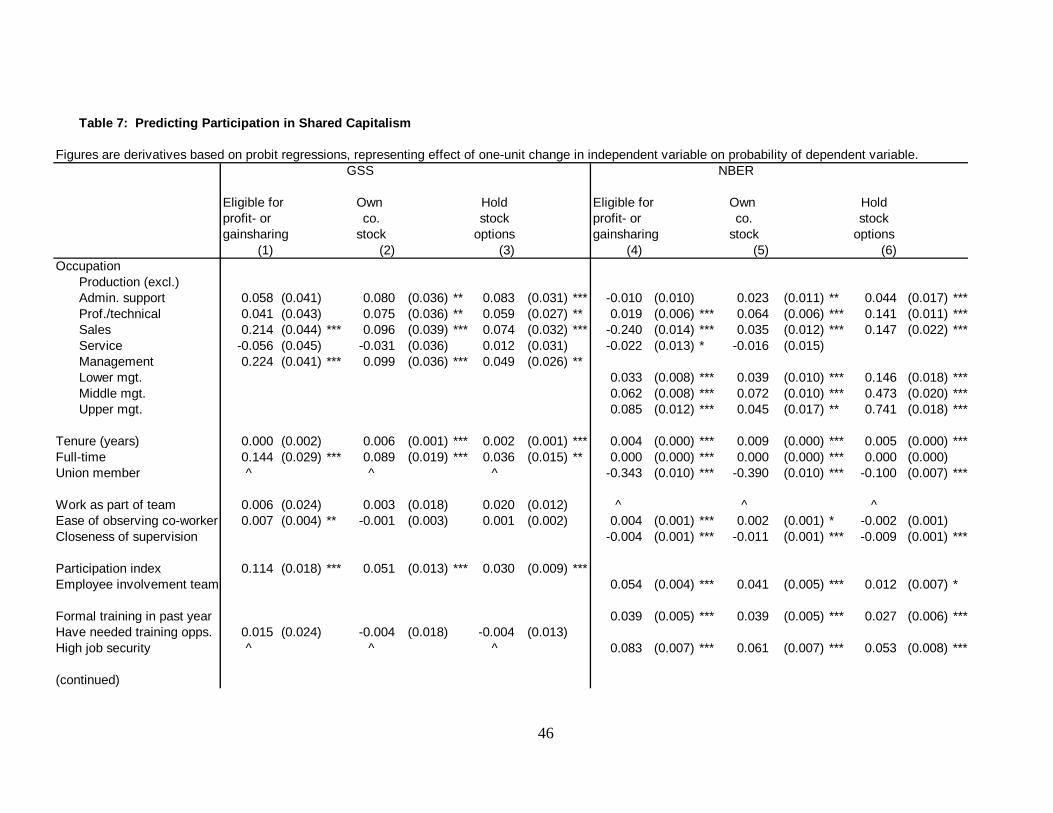
Table 7 analyzes these relationships using probit regressions to predict the likelihood of
participating in each of the types of shared capitalism. The NBER regressions control for
company fixed effects, thereby doing within-company comparisons of who participates. Most of
the simple relationships described above are maintained when controlling for other variables. In
particular, each of the plans is associated with greater participation in decisions and with
employer-sponsored training in the past year. The ease of observing co-workers is a significant
predictor of profit/gainsharing in both the GSS and NBER data, suggesting an important role for
peer pressure. Closeness of supervision is a strong negative predictor in the NBER sample, and
high job security is a strong positive predictor, indicating that freedom from supervision and job
security may be complementary policies. Finally, the GSS regressions confirm that each of the
types of shared capitalism are more likely in larger establishments (though the highest
prevalence of profit/gainsharing is among establishments with 100-999 employees rather than
the 1000+ group).
23
Risk aversion and shared capitalism
Risk aversion is clearly an important consideration in shared capitalism. We measured
risk aversion with several questions on the NBER company surveys, including a self-rating on a
0-10 scale, how much one would pay for a bet, whether one would take a job with stable pay
versus one with risky but higher pay, and whether one regularly buys and sells stock on the stock
market. These are strongly related and appear to measure a common risk propensity. Here we
focus on the employee's self-rating, where 0 is "hate to take any kind of risk" and 10 is "love to
take risks" (see question wording in appendix). The average score is 5.6, but there is wide
dispersion: 20% of employees give scores of 3 or less, while, and 41% give themselves scores of
7 or more. Of course these employees are not representative of the overall workforce, since they
have chosen to work in companies with shared capitalism and 85% are covered by some type of
shared capitalism plan. We can nonetheless learn something about the role of risk aversion by
examining its relation to plan participation and worker views of variable pay.
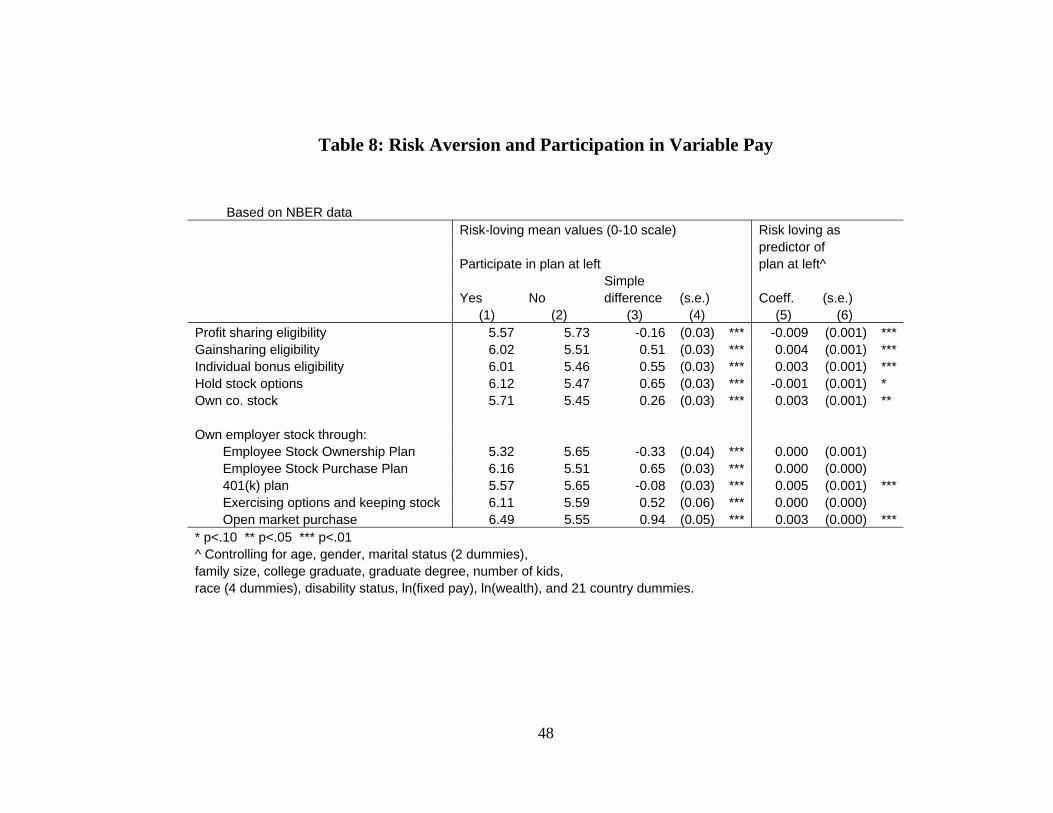
Risk aversion is related to plan participation, as shown in Table 8, but not always in
expected ways. A surprising finding is that those who are eligible for profit sharing rate
themselves as more risk averse (less risk loving) than those who are not eligible, both before and
after controlling for demographic, pay, and wealth variables (cols. 3, 5). One explanation of this
is that profit sharing may be less risky than sinking your savings in your company stock under
certain circumstances, such as where you feel you are paid at the market rate for wages and there
is no wage substitution. Eligibility for gainsharing and individual bonuses, in contrast, is
associated with greater risk loving. Like profit sharers, stock option holders appear slightly
more risk averse after controlling for demographic, pay, and wealth variables.
24
Employee owners appear to like risk more on average, but this varies by type of
employee ownership. Those owning stock through 401(k) plans or open market purchases are
clearly more risk loving than others (Table 8, col. 6), undoubtedly reflecting the self-selection of
risk lovers buying stock or allocating 401(k) accounts toward company stock. ESOP members,
however, are more risk averse than non-ESOP members in a simple comparison, and risk loving
is not a significant predictor of ESOP membership, or of owning stock through an ESPP or
exercised stock options, after controlling for demographic, pay, and wealth variables.
Does risk aversion affect employees' views of variable pay? Most of the NBER workers
would prefer to be paid in part with profit sharing, company stock, or stock options, as shown in
Table 9. Remarkably, even two-thirds (66%) of the most risk-averse employees would prefer
this, while 86% of the least risk-averse prefer this. Very similar results are obtained by a
question asking about the employee's next pay increase, where again two-thirds of the most risk-
averse would prefer at least some of the increase in shared capitalism pay.
About three-fourths of employees would prefer a new bonus program to be based at least
in part on their individual performance, where the line of sight is clearly greatest. Almost three-
fifths (58%), however, prefer that it also be based on company profits or performance, while
only about one-third (37%) prefer that it be based in part on workgroup performance. It may be
that the greater line of sight for workgroup bonuses is trumped by their greater perceived risk, as
workgroup performance is probably seen as more variable than overall company performance
(which averages across all workgroups in the company). Those with low risk aversion are more
likely to choose individual- or workgroup-based bonuses, while risk aversion is not related to the
desire for company-based bonuses.
Most employees would not vote to sell the company to an outside investor for a 50%
25
premium, but would do so for a 100% premium. This likelihood is lowest among those with
high risk aversion, reflecting greater concern about job loss if the company were sold. While the
concern about job loss is the most common reason for refusing to sell the company, about one-
third of employees say they would refuse to sell because they like owning company stock (33%),
and a similar number say they would refuse because they like the sense of community from
employee ownership (37%). A lot more research is needed on this broader issue of employee
ownership and workers’ corporate governance rights since governance has always been seen by
corporate finance experts as being partly about managing risk. (It is standard in investment
banking to provide more governance rights when risk is higher.)
Finally, most workers say that they would be willing to accept some degree of lower
regular pay in exchange for the opportunity to participate in a company-based bonus system
averaging 10% of their pay. This willingness varies substantially, however: two-fifths (41%)
would not accept lower pay, while one-sixth (15%) would accept less than 5% lower pay, one-
fourth (27%) would accept 5% lower pay, and one-sixth (17%) would accept more than 5%
lower pay. This is predictably related to risk aversion: a majority of the most risk averse would
not accept any lower regular pay (55%), compared to only a third of the least risk averse (33%).
The NBER employees of course may not be representative of the overall workforce—in
particular, they may have joined these companies because they are less risk averse and more
favourably inclined toward shared capitalism than most workers. The data are broadly
consistent, however, with existing representative surveys. Over half (57%) of workers in a 1986
BNA/Bruskin poll said they would trade their next pay increase for a share in company, while
44% said this in a 1989 EBRI/Gallup poll (summarized in Kruse and Blasi, 1999). Workers in
general report that, if they had company stock, they would be less likely than the NBER workers
26
to vote to sell the company even for a substantial premium.12 This indicates either a more rosy
view of the advantages of employee ownership among the workforce in general, or more concern
about an outside investor laying off workers. The public surveys do show positive views of
employee ownership: strong majorities think employee-owners will work harder, have higher
commitment, and be more concerned with the long-term success of the company. Participation
in decisions, however, appears to be very important: most employees would prefer participation
in decisions to having a share of ownership, and say that if they owned stock, they would not let
management vote their shares on major corporate issues (summarized in Kruse and Blasi, 1999).
Overall, as expected, risk aversion is a key factor for shared capitalism: it appears most
likely to steer workers away from positions providing gainsharing or individual bonuses, and to
discourage workers from allocating 401(k) assets toward company stock or purchasing company
stock on the open market. Greater risk aversion is associated with less positive views of shared
capitalism pay, but even among the most risk-averse employees, two-thirds says they prefer
some shared capitalism as part of their pay package.
Conclusion
Contrary to concerns about the free rider problem and worker risk aversion, a substantial
number of workers participate in shared capitalism plans and are open to more shared capitalism
in their firms. Nationally-representative surveys of private-sector employees and firms show
that:
• One-fourth to one-third of employees are eligible for profit sharing
12 The 41% who would sell for a 50% premium is somewhat higher than the 23% figure for all employees from a 1989 EBRI/Gallup poll, and the 64% who would vote to sell for a 100% premium is much higher than the 36% figure for all employees from a 1994 EBRI/Gallup poll (summarized in Kruse and Blasi, 1999).
27
• About one-fourth of employees are eligible for gainsharing
• About one-fifth of employees own stock in their companies
• Between one-twelfth and one-eighth of employees are eligible for stock options or
hold stock options
• Overall, between one-third and one-half of employees participate in some form of
shared capitalism
Why do firms use these plans, and why do workers accept them? This paper broadly
reviews the major reasons for adopting these plans and some of the research results. The two
major categories of reasons for adopting these plans are productivity-related and flexibility-
related reasons. Prior studies find that these plans tend to be associated with better company
performance on average, but there is wide dispersion in outcomes. The goal of accompanying
papers using these data is to explain this dispersion and understand why, where, and how shared
capitalism does or does not work. Limited evidence also shows that these plans tend to be
associated with greater job stability, firm survival, and employee compensation—the latter
The dispersion of results indicates that there is still much to learn about how these plans
can play a positive role in workplaces. Research has not nailed down the complementary role
that other human resource policies play in affecting worker attitudes and firm performance. To
help address the variety of questions surrounding shared capitalism, this paper has introduced the
NBER database of over 40,000 employee surveys in 14 firms with different combinations of
profit sharing, gainsharing, employee ownership, and stock options.
28
Both the NBER dataset and the nationally-representative GSS dataset indicate that while
shared capitalism exists broadly throughout the economy, it is not distributed randomly across
firms and employees. One important finding is that shared capitalism plans are more likely in
larger establishments, where free riding is likely to be the highest. To counter free riding, firms
may combine shared capitalism with other policies to create a cooperative culture. An initial
exploration of work organization and policies supports this idea: shared capitalism employees
are more likely to participate in workplace decision-making and training programs, and to have
high job security and low levels of supervision. Within-company comparisons show that they
are also more likely to work in teams, and profit/gainsharing employees can more easily observe
co-worker performance, creating the conditions for cooperative teamwork. An examination of
risk aversion in the NBER dataset shows that, as expected, risk aversion is linked to lower
participation in several types of plans and less positive views of shared capitalism, but even
among the most risk averse employees, two-thirds prefer to have some form of shared capitalism
in their pay package.
So risk aversion does not appear to be an insurmountable barrier and there appear to be
conditions for productive cooperation—does this in fact occur? What other effects does shared
capitalism have on both firms and employees? These relationships are probed and tested in the
accompanying papers, using the GSS and NBER data to explore a wide variety of outcomes for
both workers and firms.
Over the last few decades many economists have said about various shared capitalism
practices: “If it makes so much sense then why do we not observe more firms and employees
doing it?” The response put forward by these prevalence figures is: “It appears to have spread
throughout the economy, so what does that mean?” This paper has examined some of the
29
linkages between shared capitalism practices and other employment practices. These linkages
raise another series of questions: Are managers in companies making the right choices about
how to achieve optimal performance from shared capitalist practices, or are there patterns and
combinations that work better and worse? In other words, is what we observe optimal because
that is the shared capitalist arrangement that has emerged in the laboratory of real life? Or,
should managers consider making substantive changes to how they organize shared capitalism
because it can be done well or poorly? One needs to beware of looking at these incidence
patterns with a “deterministic” frame of mind. It should not be immediately concluded that just
because there are certain types of shared capitalist practices (such as company stock in 401k
plans as a lone form of shared capitalism) or combinations of these practices with human
resource policies (such as a low incidence of self-directed work teams with employee ownership)
that somehow managers have told us these are the best workable combinations. Firms and
managers may have it wrong in some cases and right in others. These data will be used to
explore the answers to these questions.
This NBER research program continues a long tradition of examination of shared
capitalism by economists. The phenomenon was seen as being so important that John Bates
Clark, a founder of the American Economic Association, wrote a book in the 1880's calling for
the combination of profit-sharing and employee ownership in companies to improve business
performance by motivating worker involvement (Clark, 1886). With his encouragement, the first
volume of the journal of the American Economics Association included an article surveying
shared capitalism in companies in the Northeast (Bemis, 1886) and in the Midwestern city of
Minneapolis (Shaw, 1886). Given that almost half of U.S. employees currently report
participating in some form of shared capitalism, it is time to take a closer look.
30
APPENDIX: GSS and NBER question wordings COMPENSATION
Profit sharing (GSS and NBER): "In your job are you eligible for any type of performance-based pay, such as individual or group bonuses, or any type of profit-sharing? What does the size of these performance-based payments depend on? Company profits or performance" (0=no, 1=yes) Profit sharing as % of pay (GSS and NBER): If "yes" to profit sharing, answer to "What was the approximate total dollar value of the payment(s) you received [in the most recent year of bonuses]?" divided by basepay+overtime, otherwise 0. Gainsharing (GSS and NBER): "In your job are you eligible for any type of performance-based pay, such as individual or group bonuses, or any type of profit-sharing? What does the size of these performance-based payments depend on? Workgroup or department performance" (0=no, 1=yes)
Gainsharing as % of pay (GSS and NBER): If "yes" to gainsharing, answer to "What was the approximate total dollar value of the payment(s) you received [in the most recent year of bonuses]?" divided by basepay+overtime, otherwise 0. Individual bonus (GSS and NBER): "In your job are you eligible for any type of performance-based pay, such as individual or group bonuses, or any type of profit-sharing? What does the size of these performance-based payments depend on? Individual performance" (0=no, 1=yes) Individual bonus as % of pay (GSS and NBER): If "yes" to individual bonus, answer to "What was the approximate total dollar value of the payment(s) you received [in the most recent year of bonuses]?" divided by basepay+overtime, otherwise 0. Own employer stock (GSS): "Do you own any shares of stock in the company where you now work, either directly or through some type of retirement or stock plan?" (0=no, 1=yes) Employer stock as % of pay (GSS): If "yes" to "hold employer stock," answer to "Please give a general estimate of how much cash you would get if all this stock were sold today?" divided by annual earnings, otherwise 0 Own employer stock (NBER): Any employer stock held through ESOP, Employee Stock Purchase Plan, 401(k), exercised stock options, or open market purchases (0=no, 1=yes) Employer stock as % of pay (NBER): If "yes" to "Hold employer stock," the sum of answers to questions about value of stock held in different plans, divided by
31
basepay+overtime, otherwise 0
Hold stock options (GSS and NBER): "Do you currently hold any stock options in your company (vested or unvested)?" (0=no, 1=yes) Stock options as % of pay (NBER): If "yes" to "Hold stock options," the sum of answers to questions about value of vested and unvested stock, divided by basepay+overtime, otherwise 0
WORK ORGANIZATION
Work as part of team (GSS and NBER): "In your job, do you normally work as part of a team or group, or do you work mostly on your own?" Ease of observing co-worker performance (GSS and NBER): "In your job how easy is it for you to see whether your co-workers are working well or poorly? Please rate on a scale of 0 to 10, where 0 equals not at all easy, and 10 equals very easy." Closeness of supervision (NBER): "Are you closely supervised, or do you work fairly independently of close supervision?" (0-10 scale, 0=closely supervised, 10=independent of close supervision)
In EI team (NBER): " Some companies have organized workplace decision-making in ways to get more employee input and involvement. Are you personally involved in any team, committee or task force that addresses issues such as product quality, cost cutting, productivity, health and safety, or other workplace issues?" (0=no, 1=yes) Lot of influence in job decisions (NBER): "How much involvement and direct influence do YOU have in: Deciding HOW to do your job and organize the work" (coded 1 if worker responded 4="a lot" on 1-4 scale, and 0 otherwise) Lot of influence in setting dept. goals (NBER): "How much involvement and direct influence do YOU have in: Setting GOALS for your work group or department" (coded 1 if worker responded 4="a lot" on 1-4 scale, and 0 otherwise) Lot of influence in company decisions (NBER): "How much involvement and direct influence do YOU have in: Overall company decisions" (coded 1 is worker responded 4="a lot" on 1-4 scale, and 0 otherwise) Lot of say on job (GSS): "I have a lot of say about what happens on my job" (coded 1 if worker responded "strongly agree" on 1-4 scale, and 0 otherwise) Often make decisions with others (GSS): "In your job, how often do you take part with others in making decisions that affect you?" (coded 1 if worker responded "often" on 1-4 scale, and 0 otherwise)
32
Often help set way things done on job (GSS): "How often do you participate with others in helping set the way things are done on your job?" (coded 1 if worker responded "often" on 1-4 scale, and 0 otherwise)
Participation index (GSS): Average of above three items (alpha=.737) Have training opportunities I need (GSS): "I have the training opportunities I need to perform my job safely and competently" (coded 1 if worker responded "very true" on 1-4 scale, and 0 otherwise) Formal training (NBER): "In the last 12 months have you received any formal training from your current employer, such as in classes or seminars sponsored by the employer?" (0=no, 1=yes) Frequently participate in job rotation (NBER): "How frequently do you participate in a job rotation or cross-training program where you work or are trained on a job with different duties than your regular job?" (coded 1 if worker responded "frequently", and 0 otherwise) High job security (GSS and NBER): "Thinking about the next twelve months, how likely do you think it is that you will lose your job or be laid off?" (coded 1 if "not at all likely" or "not very likely", and 0 otherwise) See myself working here a long time (NBER): "Which ONE of the following statements best describes how you think of your current employer? 1=I see myself working here for the foreseeable future (a long time), 0=I do not see myself working here very long." Current job is part of long-time career (NBER): "Thinking about your current job (rather than your employer), do you look upon it as part of your long term career, or a position that is not part of your long term career?" (1=yes, 0=no)
RISK AVERSION AND PREFERENCES OVER PAY
Risk loving (NBER): "Some people like to take risks and others dislike taking risks. Where would you place yourself on a scale of how much you like or dislike taking risks, where 0 is hating to take any kind of risk and 10 is loving to take risks?" Risk aversion (NBER): High risk aversion=0 to 3 on risk loving scale, medium risk aversion=4 to 6 on risk loving scale, and low risk aversion=7 to 10 on risk loving scale. Type of pay preferred (NBER): "If it was your choice and yours alone, would you prefer that you be paid: 0=All fixed wage or salary, with no profit-sharing, company
33
stock, or stock options; 1=Paid in part with a variable amount dependent on company performance, through profit-sharing, company stock, or stock options"
Preference for new bonus plan (NBER): If your employer announced a new compensation plan that would give up to 10% of pay in the form of bonuses, would you like this pay to be based on (mark all that apply): Your individual performance, Your workgroup performance, Company profits or performance"
Would vote to sell company (NBER): "If you owned stock in a company where you worked and an outside investor offered to buy the company for 50% more than the market value of the stock, would you vote to sell the company?" Lower pay accepted for company-based bonus (NBER): "Imagine that you work for a company that offers you the opportunity to participate in a bonus program. Over time, the bonus will pay you on average 10% of your regular pay, but it could be higher or lower in any given year depending on the company's performance that year. How much less regular pay would you be willing to accept in order to get the possible performance bonus?" Preference for next pay increase (NBER): "For your next pay increase, would you prefer that it come in the form of: 1=All fixed wages, with no profit sharing, company stock, or stock options, 2=Split between fixed wages and profit sharing, company stock, or stock options, 3=All in the form of profit sharing, company stock, or stock options"
34
References
Alchian, Armen A., and Harold Demsetz. 1972. "Production, Information Costs, and Economic Organization," American Economic Review, 62, pp. 777-795.
Askwith, M.E. 1926. Profit-Sharing: An Aid to Trade Revival. London: Duncan Scott. Bartel, Ann, Richard Freeman, Casey Ichniowski, and Morris Kleiner. 2003. "Can a Work
Organization Have an Attitude Problem? The Impact of Workplaces on Employee Attitudes and Economic Outcomes," National Bureau of Economic Research Working Paper 9987.
Beatty, Anne. 1994. "An Empirical Analysis if the Corporate Control, Tax and Incentive
Motivations for Adopting Leveraged Employee Stock ownership Plans," Managerial and Decision Economics, 15(4), pp. 299-315.
Bemis, Edward W. 1886. “Cooperation in the Northeast,” Publications of the American Economic
Association 1(5) (November), pp. 7-136. Blair, Margaret, Douglas Kruse, and Joseph Blasi. 2000. “Is Employee Ownership an Unstable
Form? Or a Stabilizing Force? in Thomas Kochan and Margaret Blair, eds., The New Relationship: Human Capital in the American Corporation. Washington, D.C.: The Brookings Institution.
Blasi, Joseph, Michael Conte and Douglas Kruse. 1996. "Employee Ownership and Corporate
Performance Among Public Corporations," Industrial and Labor Relations Review, Vol. 50, No. 1, October, pp. 60-79.
Blasi, Joseph, Richard Freeman, Chris Mackin, and Douglas Kruse. 2008. "Creating a Bigger
Pie? The Effects of Employee Ownership, Profit Sharing, and Stock Options on Workplace Performance." Presented at NBER/Russell Sage Foundation conference, New York, NY, October 2006.
Blasi, Joseph, Maya Kroumova and Douglas Kruse. 1997. Kremlin Capitalism: Privatizing The
Russian Economy. Ithaca: Cornell University Press. Blasi, Joseph and Douglas Kruse. 1991. The New Owners: The Mass Emergence of Employee
Ownership in Public Companies and What it Means to American Business. New York: HarperBusiness.
-----. 2006. “High Performance Work Practices at Century’s End,” Industrial Relations, Vol.
45, No. 4 (October), pp. 547-578. -----, and Aaron Bernstein. 2003. In the Company of Owners: The Truth About Stock Options
35
(And Why Every Employee Should Have Them). New York: Basic Books, 2003. Blasi, Joseph, Douglas Kruse, and Harry M. Markowitz. 2008. “Risk and Lack of
Diversification under Employee Ownership and Shared Capitalism. ” Presented at NBER/Russell Sage Foundation conference, New York, NY, October 2006.
Bonin, John P., and Louis Putterman. 1987. Economics of Cooperation and the Labor-managed
Economy. Chur, Switzerland: Harwood Academic Publishers. Boning, Brent, Casey Ichniowski, and Kathryn Shaw. 2001. "Opportunity Counts: Teams and
the Effectiveness of Production Incentives," National Bureau of Economic Research Working Paper 8306.
BLS. 2005. National Compensation Survey: Employee Benefits in Private Industry in the
United States, 2003. Bulletin 2577, U.S. Bureau of Labor Statistics, October. -----. 2006. "National Compensation Survey: Employee Benefits in Private Industry in the
United States, March 2006," Summary 06-05, U.S. Bureau of Labor Statistics, August. -----. 2007. National Compensation Survey: Employee Benefits in Private Industry in the
United States, 2005. Bulletin 2589, U.S. Bureau of Labor Statistics, May. -----. 2008. “National Compensation Survey: Employee Benefits in Private Industry in the
United States, March 2007,” Summary 07-05, U.S. Bureau of Labor Statistics, August. Brown, Jeffrey, Nellie Liang, and Scott Weisbenner. 2004. "401(k) Matching Contributions in
Company Stock: Costs and Benefits for Firms and Workers," NBER Working Paper 10419, August.
Buchele, Robert, Douglas Kruse, Loren Rodgers, and Adria Scharf. 2008. “Show Me the
Money: The Wealth Impact of Shared Capitalism.” Presented at NBER/Russell Sage Foundation conference, New York, NY, October 2006.
NBER/Russell Sage Foundation conference, New York, NY, October 2006. Bullock, R.J. and Mark E. Tubbs. 1990. "A Case Meta-Analysis of Gainsharing Plans as
Organization Development Interventions," Journal of Applied Behavioral Science, 26, 3, pp. 383-404.
Carberry, Edward. 2008. “An Analysis of Social Stratification in Companies with Shared
Capitalism.” Presented at NBER/Russell Sage Foundation conference, New York, NY, October 2006.
Clark, John Bates. 1886. The Philosophy of Wealth. Boston: Ginn & Company.
36
Collins, Denis. 1998. Gainsharing and Power: Lessons from Six Scanlon Plans. Ithaca and
London: Cornell University Press, ILR Press. Craig B. and J. Pencavel. 1992. "The Behavior of Worker Cooperatives: The Plywood
Companies of The Pacific Northwest," American Economic Review, 82, 1083-1105. -----. 1993. "The Objectives of Worker Cooperatives," Journal of Comparative Economics,
Vol. 17(2), June, pp. 288-308. Del Boca, Alessandra, Douglas Kruse, and Andrew Pendleton. 1999. "Decentralisation of
Bargaining Systems and Financial Participation: A Comparative Analysis of Italy, UK and the US," Lavoro e Relazioni Industriali, Summer 1999.
Dow, Gregory. 2003. Governing the Firm: Workers' Control in Theory and Practice.
Cambridge, England: Cambridge University Press. EBRI/Gallup. 1994. “Public Attitudes on Employee Stock Ownership and Benefit Promises,
1994,” EBRI/Gallup Poll #G-54, Employee Benefit Research Institute, Washington, D.C. European Foundation for the Improvement of Living and Working Conditions. 1997. New
Forms of Work Organization: Can Europe Realize Its Potential? Luxembourg: Office for Official Publications of the European Communities, 1997.
Fitzroy, Felix, and Kornelius Kraft. 1995. "On the Choice of Incentive in Firms," Journal of
Economic Behavior and Organization, 26, pp. 145-160. Freeman, Richard, and Morris Kleiner. 1990. "The Impact of New Unionization on Wages and
Working Conditions," Journal of Labor Economics, 8:1, S8-S25. Freeman, Richard, and Joel Rogers. 1999. What Workers Want. New York: Russell Sage and
Cornell University Press. Freeman, Richard, Douglas Kruse, and Joseph Blasi. 2008. “Worker Responses to Shirking
under Shared Capitalism.” Presented at NBER/Russell Sage Foundation conference, New York, NY, October 2006.
Gregg, P.A. and Machin, S.J. 1988. "Unions and the Incidence of Performance Linked Pay Schemes
in Britain," International Journal of Industrial Organization, 6, 91-107. Harden, Erika, Douglas Kruse, and Joseph Blasi. 2008. “Who Has a Better Idea: Innovation,
Shared Capitalism, and Human Resource Policies.” Presented at NBER/Russell Sage Foundation conference, New York, NY, October 2006.
Hansmann, Henry. 1996. The Ownership of Enterprise. Cambridge: Harvard University Prress.
37
Ichniowski, Casey, and Kathryn Shaw. 1995. "Old Dogs and New Tricks: Determinants of the
Adoption of Productivity-Enhancing Work Practices," Brookings Papers on Economic Activity, Microeconomics 1995, pp. 1-55.
Ichniowski, Casey, Thomas Kochan, David Levine, Craig Olson, and George Strauss. 1996.
"What Works at Work: Overview and Assessment," Industrial Relations, 35(3) 299-333. Ichniowski, Casey, Kathryn Shaw, and Giovanna Prennushi. 1997. "The Effects of Human
Resource Management Practices on Productivity: A Study of Steel Finishing Lines," American Economic Review, 87 (3), pp. 291-313.
Jones, Derek C; Kato, Takao. 1995. "The Productivity Effects of Employee Stock-Ownership
Plans and Bonuses: Evidence from Japanese Panel Data," American Economic Review, Vol. 85 (3), pp. 391-414.
Kardas, Peter; Adria L. Scharf; and Jim Keogh. 1998. “Wealth and Income Consequences of
ESOPs and Employee Ownership: A Comparative Study from Washington State," Journal of Employee Ownership Law and Finance. Vol. 10, No. 4, Fall.
Kato, Takao; Lee, Ju Ho; Lee, Kang-Sung; Ryu, Jang-Soo. 2005. "Employee Participation and
Involvement in Korea: Evidence from a New Survey and Field Research," International Economic Journal, Vol. 19 (2), June, pp. 251-81.
Kruse, Douglas. 1993. Profit Sharing: Does It Make a Difference? Kalamazoo, MI: W.E. Upjohn
Institute for Employment Research. -----. 1996. “Why Do Firms Adopt Profit-Sharing and Employee Ownership Plans?” British
Journal of Industrial Relations, Vol. 34, No. 4 (December), pp. 515-38. -----. 1998. “Profit Sharing and the Demand for Low-Skill Workers,” in Richard Freeman and
Peter Gottschalk, eds., Generating Jobs: Increasing the Demand for Low-Skill Workers. New York: Russell Sage Foundation, pp. 105-153.
-----. 2002. “Research Evidence on Prevalence and Effects of Employee Ownership,” Testimony
before the Subcommittee on Employer-Employee Relations, Committee on Education and the Workforce, U.S. House of Representatives, February 13, 2002.
-----, and Joseph R. Blasi. 1997. “Employee Ownership, Employee Attitudes, and Firm
Performance: A Review of the Evidence,” in David Lewin, Daniel J.B. Mitchell, and Mahmood A. Zaidi, eds., The Human Resource Management Handbook, Part I. Greenwich, Connecticut and London, England: JAI Press Inc.
-----. 1999. “Public Opinion Polls on Employee Ownership and Profit Sharing,” Journal of
Employee Ownership Law and Finance, Vol. 11, No. 3, Summer 1999, pp. 3-25.
38
Kruse, Douglas, Richard Freeman, and Joseph Blasi. 2008. “Do Workers Gain by Sharing?
Employee Outcomes Under Employee Ownership, Profit Sharing, and Broad-based Stock Options” Presented at NBER/Russell Sage Foundation conference, New York, NY, October 2006.
Lawler, Edward, Susan Mohrman, and G.E. Ledford. 1995. Creating High Performance
Organizations: Practices and Results of Employee Involvement and Quality Management in Fortune 1000 Companies. San Francisco: Jossey-Bass.
Oyer, Paul, and Scott Schaefer. 2005. "Why Do some Firms Give Stock Options to All
Employees? An Empirical Examination of Alternative Theories," Journal of Financial Economics, 76, pp. 99-133.
Park, Rhokeun., Douglas Kruse, and James Sesil. 2004. “Does Employee Ownership Enhance
Firm Survival?” in Virginie Perotin and Andrew Robinson, eds., Advances in the Economic Analysis of Participatory and Labor-Managed Firms, Vol. 8. New York: Elsevier Science, JAI, pp. 3-33.
Pendleton, Andrew; Poutsma, Erik; Van Ommeren, Jos; Brewster, Chris. 2003. "The Incidence and Determinants of Employee Share Ownership and Profit Sharing in Europe," in Takao Kato and Jeffrey Pliskin, eds., Advances in the Economic Analysis of Participatory and Labor-Managed Firms, vol. 7. New York: Elsevier Science, JAI, pp. 141-72.
Poole, Michael. 1989. The Origins of Economic Democracy: Profit-Sharing and Employee-
Shareholding Schemes. London: Routledge. Poutsma, Erik. 1999. Financial Employee Participation in Europe. Nijmegen, Netherlands:
Nijmegen University Business School, Report to the European Foundation for the Improvement of Living and Working Conditions.
Putterman, Louis, and Gil Skillman, Jr. 1988. "The Incentive Effects of Monitoring Under
Alternative Compensation Schemes," International Journal of Industrial Organization, 6, pp. 109-119.
Scharf, Adria, and Christopher Mackin. 2000. "Census of Massachusetts Companies with
Employee Stock Ownership Plans (ESOPs)." Boston: Commonwealth Corporation. Shaw, Albert. 1886. “Cooperation in a Western City,” Publications of the American Economic
Association 1(4), September, pp. 7-106. Smith, Stephen, Beom-Cheol Cin, and Milan Vodopivec. 1997. "Privatization Incidence,
Ownership Forms, and Firm Performance: Evidence from Slovenia," Journal of Comparative Economics, Vol. 25(2), October, pp. 158-179.
Summers, Lawrence. 1986. "On the Share Economy," Challenge, November/December, pp. 47-
39
50. Tseo, George. 1996. "Chinese Economic Restructuring: Enterprise Development through
Employee Ownership," Economic and Industrial Democracy, 17(2), May, pp. 243-279. U.S. GAO. 1986. “Employee Stock Ownership Plans: Benefits and Costs of ESOP Tax
Incentives for Broadening Stock Ownership.” GAO/PEMD-87-8. Washington, DC: General Accounting Office.
U.S. Senate, Subcommittee of the Committee on Finance. 1939. "Survey of Experiences in
Profit Sharing and Possibilities of Incentive Taxation." Washington, D.C.: Government Printing Office.
Uvalic, M., and Daniel Vaughan-Whitehead, eds. 1997. Privatization Surprises in Transition
Economies: Employee-ownership in Central and Eastern Europe. Cheltenham, UK and Lyme, NH: Elgar, distributed by American International Distribution Corp., Williston, VT.
Weitzman, Martin L. 1984. The Share Economy. Cambridge, MA: Harvard University Press. -----. 1986. "Macroeconomic Implications of Profit Sharing," NBER Macroeconomics Annual
1986. Cambridge, MA: MIT Press, pp. 291-335. -----, and Douglas Kruse. 1990. “Profit Sharing and Productivity,” in Alan Blinder, ed., Paying
For Productivity: A Look at the Evidence. Washington, D.C.: Brookings Institution. Zalusky, John. 1990. "Labor-Management Relations: Unions View Profit Sharing," in Myron J.
Roomkin, ed., Profit Sharing and Gain Sharing. Metuchen, NJ: Scarecrow Press, 65-78.
40
Table 1 – Current Prevalence of Shared Capitalism Plans
Source: GSS GSS NOSYear: 2002 2006 2002
Type of data: Employee Employee Firmsurvey survey survey
(1) (2) (3)PROFIT SHARING
Percent of employees coveredEligible for bonuses based on company performance 34% 38% 46%Received bonus last year based on company performance 24% 30%
Percent of firms with plansAny employees eligible for bonuses based on 62% company performance
GAINSHARINGPercent of employees covered
Eligible for bonuses based on department or team performance 23% 27% 23%Received bonus last year based on department or team performance 17% 21%
Percent of firms with plansAny employees eligible for bonuses based on department or team performance 35%
EMPLOYEE OWNERSHIPPercent of employees covered
Own company stock 21% 18% 16%Percent of firms
Any employees own company stock 33%STOCK OPTIONS 13%
Percent of employees coveredHold stock options 9%Granted stock options last year 5%
Percent of firmsAny employees granted stock options last year 14%
COMBINATIONSAny of above 43% 47%Just one form:
Rec'd profit- or gainsharing bonus last year 14.6% 21.2%Hold company stock 5.0% 3.8%Hold stock options 0.7% 0.7%
Two forms:Hold co. stock and rec'd profit- or gainsharing bonus last year 3.7% 5.3%Hold co. stock and stock options 6.1% 3.2%Hold stock options and rec'd profit- or gainsharing bonus last year 0.4% 0.6%
All three forms 6.1% 4.6%Sample size 1257 1173 312
41
Table 2: Current Prevalence of Employee Participation in Decisions
Source: GSS GSS NOSYear: 2002 2006 2002
Type of data: Employee Employee Firmsurvey survey survey
(1) (2) (3)Percentage of employees covered
Employee involvement teamSelf-directed team 30% 17%Quality circles or employee involvement committees 33% 17%Often participate with others in making 42% 38% decisions that affect jobOften participate with others in helping 45% 42% set how things are done on job
Percentage of firms with plansSelf-managed teams for non-managers 39%Quality circles or employee involvement committees 42%Worker safety committees 49%
Sample size 1257 1173 312
GSS=General Social Survey (from National Opinion Research Center, analyzed by authors)(all private sector)NOS=National Organizations Survey (from National Opinion Research Center, analyzed by authors)(all private sector)
10,000+ employeesCompany 8 Yes 401(k) w/co. stock No
Service/financial<1000 employees
Company 9 No ESOP No1,000-9,999 employees
Company 10 No ESOP NoCompany 11 No ESPP and 401(k) w/co. stock Yes
10,000+ employeesCompany 12 Yes ESPP and 401(k) w/co. stock Yes
Hi-tech/Internet<1000 employees
Company 13 Yes ESPP Yes10,000+ employees
Company 14 Yes ESPP Yes
Total companies with plans 11 14 5
43
TABLE 4: Shared capitalism types and intensities in GSS and NBER datasets
General NBER Sample sizesSocial companySurvey dataset GSS NBER
2002-2006Bonus eligibility
Profit sharing 35.9% 71.3% 2386 41018Gainsharing 24.9% 20.7% 2386 41023Size of most recent bonus, if eligible for any
Mean dollar value $6,265 $11,329 693 26113Median dollar value $1,500 $2,000 693 26113Mean % of pay 8.9% 12.1% 645 22019Median % of pay 4.6% 5.7% 645 22019
Employee ownershipOwn employer stock in any form 19.4% 64.0% 2406 41206Own employer stock through:
Employee Stock Ownership Plan 8.1% 41109Employee Stock Purchase Plan 17.6% 40990401(k) plan 33.5% 40885Exercising options and keeping stock 5.0% 41032Open market purchase 7.3% 41145
Value of employer stock, if own stockDollar value: Mean $63,130 $60,078 318 25447 Median $10,000 $14,375 318 25447% of pay: Mean 81.7% 65.0% 302 22715 Median 23.0% 30.6% 302 22715% of wealth: Mean 19.6% 23141 Median 10.0% 23141
Stock optionsCurrently hold stock options 11.3% 21.9% 2392 41166Ever granted stock options 22.3% 41166Granted stock options last year 20.4% 41158Value of stock options, if hold options:
Mean dollar value of unvested options $112,882 8390Mean dollar value of vested options $143,117 8497Total dollar value: Mean $249,901 8656 Median $75,000 8656% of pay: Mean 183.7% 8403 Median 100.0% 8403% of wealth: Mean 60.3% 8104 Median 28.6% 8104
Any of above programs 44.9% 85.7% 2430 41206
44
Table 5: Participation in Shared Capitalism by Job and Company Characteristics
GSS, 2002-2006 NBERPercent of those at left who: Percent of those at left who: Sample sizes
Are eligible for Own Hold Are eligible for Own Holdprofit- or co. stock profit- or co. stock
Participation in decisionsEmployee involvement team 34.7% 37.9% ** 37.7% ** 37.7% **Lot of involvement in job decisions 50.5% 53.5% ** 56.5% ** 71.2% **Lot of involvement in setting dept. goals 21.3% 22.6% ** 23.8% ** 33.2% **Lot of involvement in co. decisionsA lot of say about what happens on job 24.6% 30.8% ** 28.4% * 28.7%Often help set way things are done on job 39.7% 46.8% ** 47.5% ** 49.0% **Often make decisions with others 43.5% 50.1% ** 49.4% ** 52.1% **
Training/multi-skillingHave training opportunities I needFormal training in past year 60.3% 62.7% * 61.6% 60.6% 56.4% 59.2% ** 61.8% ** 76.3% **Frequently participate in job rotation 11.2% 11.4% * 11.5% * 6.2% *
High job security 88.3% 92.7% ** 91.7% * 91.3% 84.3% 86.9% ** 87.8% ** 92.0% **See myself working here a long time 81.7% 83.6% ** 84.8% ** 88.3% **Current job is part of long-time career 76.2% 78.0% ** 79.1% ** 83.5% **Sample size 2430 908 470 275 41206 31351 26390 9019* Difference between those who are and are not covered by this plan is significant at p<.10 ** p<.05
46
Table 7: Predicting Participation in Shared Capitalism
Figures are derivatives based on probit regressions, representing effect of one-unit change in independent variable on probability of dependent variable.GSS NBER
Eligible for Own Hold Eligible for Own Holdprofit- or co. stock profit- or co. stockgainsharing stock options gainsharing stock options
n 2283 2275 2264 34316 34790 30301Pseudo-R-sq. 0.12 0.165 0.156 0.194 0.211 0.815* p<.10 ** p<.05 *** p<.01^ These variables were available only for a limited number of observations. When they are included, the significant relationships are:
Union membership in GSS: negative and significant only in column 1High job security in GSS: positive and significant only in column 1Work as part of team in NBER: positive and significant in columns 4-6
48
Table 8: Risk Aversion and Participation in Variable Pay
Based on NBER data Risk-loving mean values (0-10 scale) Risk loving as predictor of Participate in plan at left plan at left^ Simple Yes No difference (s.e.) Coeff. (s.e.) (1) (2) (3) (4) (5) (6) Profit sharing eligibility 5.57 5.73 -0.16 (0.03) *** -0.009 (0.001) ***Gainsharing eligibility 6.02 5.51 0.51 (0.03) *** 0.004 (0.001) ***Individual bonus eligibility 6.01 5.46 0.55 (0.03) *** 0.003 (0.001) ***Hold stock options 6.12 5.47 0.65 (0.03) *** -0.001 (0.001) * Own co. stock 5.71 5.45 0.26 (0.03) *** 0.003 (0.001) ** Own employer stock through: Employee Stock Ownership Plan 5.32 5.65 -0.33 (0.04) *** 0.000 (0.001) Employee Stock Purchase Plan 6.16 5.51 0.65 (0.03) *** 0.000 (0.000) 401(k) plan 5.57 5.65 -0.08 (0.03) *** 0.005 (0.001) *** Exercising options and keeping stock 6.11 5.59 0.52 (0.06) *** 0.000 (0.000) Open market purchase 6.49 5.55 0.94 (0.05) *** 0.003 (0.000) **** p<.10 ** p<.05 *** p<.01 ^ Controlling for age, gender, marital status (2 dummies), family size, college graduate, graduate degree, number of kids, race (4 dummies), disability status, ln(fixed pay), ln(wealth), and 21 country dummies.
49
Table 9: Worker Views of Performance-based Pay Risk aversion Overall High Medium Low Type of pay preferred All fixed wage or salary 22% 34% 25% 14% *** Paid in part with profit sharing, stock, or stock options 78% 66% 75% 86% *** n 13199 2090 5069 5953Preference for next pay increase All fixed pay 27% 33% 28% 23% *** Split between fixed wages and profit sharing, stock, or options 60% 55% 61% 62% *** All profit sharing, stock, and options 13% 12% 11% 15% *** n 25869 5318 9805 10330Would prefer new bonus plan to be based on (can pick more than one) Your individual performance 77% 71% 77% 79% *** Your workgroup performance 37% 31% 36% 40% *** Company profits or performance 58% 57% 59% 59% n 13379 2144 5133 6002Would vote to sell company if outside investor offered: 50% premium 41% 36% 39% 45% *** 100% premium 64% 57% 61% 68% *** Reasons for not selling for 50% premium: Like owning company stock 33% 35% 33% 32% Like sense of community from employee ownership 37% 37% 36% 39% Concerned about investor laying off employees 70% 75% 73% 65% *** Offer might mean company is worth more 39% 33% 38% 44% *** n 12938 2059 4931 5854Lower pay accepted for company-based bonus averaging 10% Mean percent lower regular pay accepted 3.31 2.28 3.15 3.91 *** (std. dev.) (3.56) (3.21) (3.51) (3.63) 0% lower pay accepted 41% 55% 43% 33% *** Between 0% and 5% lower pay accepted 15% 15% 15% 15% 5% lower pay accepted 27% 19% 26% 31% *** More than 5% lower pay accepted 17% 11% 16% 21% *** n 29426 5535 11141 12480* Significant difference among risk groups at p<.10 ** p<.05 *** p<.01
Appendix Table A1 – Prior Evidence on Prevalence of Shared Capitalism Plans
Source: WRPS NLSY EBRI NES NES Form 5500 NCS NCS NCSYear: 1994/95 1993 1994 1994 1997 1998 2003 2005 2007
Type of data: Employee Employee Employee Firm Firm Admin. Firm Firm Firmsurvey survey survey survey survey data survey survey survey
(1) (2) (3) (4) (5) (6) (7) (8) (9)PROFIT SHARING
Percent of employees coveredReceive any bonuses based on profit sharing 30%Employer makes profit sharing available 35%Deferred profit-sharing plan 21% 30%Cash profit-sharing plan 5% 5%
GAINSHARINGPercent of employees covered
Receive any bonuses based on meeting workplace goals 27%EMPLOYEE OWNERSHIP
Percent of employees coveredParticipate in an employee stock ownership or ESOP plan 24%Own company stock 21%ESOP participant 6% 5% 4%Participant in non-ESOP 401(k) w/employer stock^ 11%Participant in other defined con. plan w/employer stock^ 1%Eligible for other defined con. plan w/employer stock^ 20%Participant in savings/thrift plan w/employer stock^ 16%
STOCK OPTIONSPercent of employees covered
Eligible to receive stock options 8% 8%COMBINATIONS
Percent of employees coveredAny of above 57%
Percent of firmsProfit sharing, bonus, or gainsharing plan 75%Stock options or profit sharing 41%
Sample size 2408 1000 2867 2963 50769 3030 3227 8256^ At least some employees in these plans own company stock, but the employee him/herself might not own stock (e.g., if s/he declined
to allocate some contributions to employer stock in a 401(k))WRPS=Worker Representation and Participation Survey (Freeman and Rogers 1999); NLSY=National Lomgitudinal Survey of Youth (Kruse 1998); EBRI=Employee Benefits Research Institute (EBRI/Gallup 1994); NES=National Employer Survey (Kruse and Blasi 2000); Form 5500=Form 5500 pension dataset (Kruse 2002); NCS=National Compensation Survey (BLS 2005, 2007, 2008)
50
51
Appendix Table A2: Prior Evidence on Prevalence of Employee Participation in Decisions
Source: WRPS NES NESYear: 1994/95 1994 1997
Type of data: Employee Firm Firmsurvey survey survey
(1) (2) (3)Percentage of employees covered
Employee involvement team 31%Self-managed team 13% 16%Work-related meetings for non-managers 52% 55%Quality circles or employee involvement committeesA lot of influence in decisions about how job is done 57%A lot of influence in setting group or dept. goals 32%
Percentage of firms with plansSelf-managed teams for non-managers 32% 34%Work-related meetings for non-managers 80% 74%
Sample size 2408 2867 2963
WRPS=Worker Representation and Participation Survey (Freeman and Rogers 1999)(all private sector)NES=National Employer Survey (Kruse and Blasi 2000)(private for-profit firms)