35
Shared producer and consumer responsibility – theory and practice ISA Research Paper 01-06 Prepared by Manfred Lenzen, Joy Murray, Fabian Sack and Tommy Wiedmann
Shared producer and consumer responsibility – theory and practice
ISA Research Paper 01-06 Prepared by Manfred Lenzen, Joy Murray, Fabian Sack and Tommy Wiedmann

Please cite this report as
Lenzen, M., J. Murray, F. Sack and T. Wiedmann (2007) Shared producer and
consumer responsibility - theory and practice. Ecological Economics 61, 27-42.

Lenzen, Murray, Sack and Wiedmann – Shared responsibility
Integrated Sustainability Analysis ™
Shared producer and consumer responsibility – theory and practice by Manfred Lenzen, Joy Murray, Fabian Sack and Tommy Wiedmann
For further enquiries please contact:
Dr Manfred Lenzen School of Physics
Phone: (02) 9351 5985 A28
Fax: (02) 9351 7725 The University of Sydney
Email: [email protected] N.S.W. 2006
Website: http://www.isa.org.usyd.edu.au
2
Lenzen, Murray, Sack and Wiedmann – Shared responsibility
Shared producer and consumer responsibility – theory and practice
Manfred Lenzen1, Joy Murray2, Fabian Sack3 and Thomas Wiedmann4
Abstract – Over the past decade, an increasing number of authors have been examining the nexus of producer versus consumer responsibility, often dealing with the question of how to assign responsibility for internationally traded greenhouse gas emissions. Recently, a similar problem has appeared in drafting the standards for the Ecological Footprint: While the method traditionally assumes a full life-cycle perspective with full consumer responsibility, a large number of producers (businesses and industry sectors) have started to calculate their own footprints. Adding any producer’s footprint to other producers’ footprints, or to population footprints, which all already cover the full upstream supply chain of their operating inputs, leads to double-counting: The sum over footprints of producers and consumers is larger than the total national footprint. The committee in charge of the Footprint standardisation process was hence faced with the decades-old non-additivity problem, posing the following dilemma for the accounting of footprints, or any other production factor: if one disallows double-counting, but wishes to be able to account for producers and consumers, then one cannot impose the requirement of full life-cycle coverage; the supply chains of agents have to be curtailed somehow in order to avoid double-counting. This work demonstrates and discusses a non-arbitrary method of consistently delineating these supply chains, into mutually exclusive and collectively exhaustive portions of responsibility to be shared by all agents in an economy. Keywords: Producer responsibility, consumer responsibility, shared responsibility, supply
chains, ecological footprint
1 Corresponding author: ISA, School of Physics A28, The University of Sydney NSW 2006, Australia, ph +61 / 2 / 9351-5985,
fax +61 / 2 / 9351-7725, e-mail [email protected], http://www.isa.org.usyd.edu.au; remaining authors in alphabetical order.
2 ISA, School of Physics A28, The University of Sydney NSW 2006, Australia, ph +61/2/9351-2627, fax +61 / 2 / 9351-7725, e-mail [email protected].
3 Sydney Water Corporation, 115-123 Bathurst St, Sydney NSW 2000, Australia, email [email protected]. 4 Stockholm Environment Institute – York, University of York, Heslington, York, YO10 5DD, UK, email
3
Lenzen, Murray, Sack and Wiedmann – Shared responsibility
1 Introduction: a brief history of producer and consumer responsibility It is perhaps because of the tendency of economic policy in market-driven economies not to interfere with consumers’ preferences that the producer-centric representation is the dominant form of viewing the environmental impacts of industrial production: In statistics on energy, emissons, water etc, impacts are almost always presented as attributes of industries (‘on-site’ or ‘direct’ allocation) rather than as attributes of the supply chains of products for consumers. On a smaller scale, most existing schemes for corporate sustainability reporting include only impacts that arise out of operations controlled by the reporting company, and not supply-chain impacts (World Business Council on Sustainable Development and World Resources Institute 2001). According to this world view, “upstream and downstream [environmental] impacts are […] allocated to their immediate producers. The institutional setting and the different actors’ spheres of influence are not reflected” (Spangenberg and Lorek 2002, p. 131). On the other hand, a number of studies have highlighted that final consumption and affluence, especially in the industrialised world, are the main drivers for the level and growth of environmental pressure.5 Even though these studies provide a clear incentive for complementing producer-focused environmental policy with some consideration for consumption-related aspects, demand-side measures to environmental problems are rarely exploited (Princen 1999, p. 348). The nexus created by the different views on impacts caused by industrial production is exemplified by several contributions to the discussion about producer or consumer responsibility for greenhouse gas emissions.6 Emissions data are reported to the IPCC as contributions of producing industries located in a particular country (Task Force on National Greenhouse Gas Inventories 1996) rather than as embodiments in products consumed by a particular population, irrespective of productive origin. However, especially for open economies, taking into account the greenhouse gases embodied in internationally traded commodities can have a considerable influence on national greenhouse gas balance sheets. Assuming consumer responsibility, exports have to be subtracted from, and imports added to national greenhouse gas inventories. In Denmark for example, Munksgaard and Pedersen 2001 report that a significant amount of power and other energy-intensive commodities are traded across Danish borders, and that between 1966 and 1994 the Danish foreign trade balance in terms of CO2 developed from a 7 Mt deficit to a 7 Mt surplus, compared to total emissions of approximately 60 Mt. In particular, electricity traded between Norway, Sweden and Denmark is subject to large annual fluctuations due to varying rainfall in Norway and Sweden. In wet years Denmark imports hydro-electricity whereas electricity from coal-fired power plants is exported in dry years. The official Danish emissions inventory includes a correction for electricity trade and thus applies the consumer responsibility principle (Danish Environmental Protection Agency 1998). Similarly, at the company level, “when adopting the concept of eco-efficiency and the scope of an environmental management system stated in for example ISO 14001, it is insufficient to merely report on the carbon dioxide emissions limited to the judicial borders of the company” (Cerin 2002, p. 59).7 “Companies must recognise their wider responsibility and manage the entire life-cycle of their products … Insisting on high environmental standards from suppliers and ensuring that raw materials are extracted or produced in an environmentally conscious way 5 Hamilton and Turton 1999; Hamilton and Turton 2002; Lenzen and Smith 2000; Mélanie, Phillips, and Tormey 1994; Parikh 1996; Parikh and Painuly 1994; Wier, Lenzen, Munksgaard, and Smed 2001; Wolvén 1991. 6 Imura and Moriguchi 1995;Lenzen, Pade, and Munksgaard 2004;Proops, Faber, and Wagenhals 1993;Subak 1995;Wyckoff and Roop 1994; Bastianoni, Pulselli, and Tiezzi 2004. 7 Cerin 2002 (p. 59) goes on to say that “an improvement in emissions within the judicial limits of the company may, within the scope of the whole life-cycle of the functions offered by the product and/or service, be a worsening of eco-efficiency”. This has been quantitatively confirmed by Lenzen and Treloar 2003.
4
Lenzen, Murray, Sack and Wiedmann – Shared responsibility
provides a start” (Welford 1996, as cited in Cerin 2005a, p. 34). A life-cycle perspective is also taken in Extended Producer Responsibility (EPR) frameworks: “Producers of products should bear a significant degree of responsibility (physical and/or financial) not only for the environmental impacts of their products downstream from the treatment and disposal of their product, but also for their upstream activities inherent in the selection of materials and in the design of products” (Organisation for Economic Co-operation and Development 2001, p. 21-22). “The major impetus for EPR came from northern European countries in the late 1980s and early 1990s, as they were facing severe landfill shortages. [… As a result,] EPR is generally applied to post-consumer wastes which place increasing physical and financial demands on municipal waste management” (Environment Protection Authority New South Wales 2003, p. 2-4). In trying to operationalise EPR, the Chartered Institute of Purchasing and Supply UK 1993 launched voluntary guidelines for environmental purchasing (Chartered Institute of Purchasing and Supply 2000) and ethical business practices (Chartered Institute of Purchasing and Supply 1999). Recently, a range of companies have implemented policies that are aimed at reducing CO2 emissions and packaging waste from upstream suppliers and increasing recyclability, or supplier environmental awards.8 At times, queries by users of products about the environmental performance of the supplier have initiated knock-on effects that lead upstream organisations to begin conducting environmental audits and implementing environmental management systems (Barry 1996). On the down side, McKerlie, Knight, and Thorpe 2006 (p. 620) report that the concept of product stewardship “suggests that all parties with a role in designing, producing, selling or using a product are responsible for minimising the environmental impact of the product over its life. In practice, this “shared responsibility” extends beyond the producers and users of a product to include local governments and general taxpayers who incur the expense of managing products at their end-of-life as part of the residential waste stream. This shared approach does not clearly designate responsibility to any one party, diluting the impetus to advance waste prevention.” Indeed, at present, most of extended-responsibility initiatives proceed in a more or less qualitative and ad-hoc, rather than quantitative and systematic way in selecting, screening, ranking or influencing other agents in their supply chain. We agree with Lloyd 1994, who states that “it will be impossible to produce a sufficiently credible ranking of suppliers without quantitative rating”. Hence, the work described in this paper has the following objectives:
− to demonstrate that there exists a ubiquitous need for a consistent and robust, quantitative concept of producer and consumer responsibility (Section 2);
− to explain the shortcomings of existing accounting methods, using an example of a simple supply chain involving producers and consumers (Sections 3.1 and 3.2);
− to explain in plain terms the concept of shared responsibility as a solution to assigning responsibility to both producers and consumers, in a mutually exclusive and collectively exhaustive way (Section 3.3);
− to derive mathematical conditions under which responsibility sharing across single supply chains is independent of the delineation (classification, aggregation and boundaries) of supply chain participants (company branches, corporations, industry sectors etc; Section 4);
− to discuss the implications of shared responsibility (Section 5.1); and − to document experiences from applying the shared responsibility principle to Australian
organisations, and outline challenges ahead (Section 5.2). 8 See Toyota Motor Corporation 2003, p. 5; Ford Motor Company of Australia Limited 2003, pp. 9-10; Chartered Institute of Purchasing and Supply UK 1993; Barry 1996; Norwich Union Central Services 2003; Carillion 2001; Vachon and Klassen 2006.
5
Lenzen, Murray, Sack and Wiedmann – Shared responsibility
2 Conceptualising producer and consumer responsibility – attempts and problems 2.1 Previous attempts to quantify producer and consumer responsibility An early attempt to develop an impact measure that deals with producers and consumers in a supply-chain formulation is Szyrmer 1992; based on the total flow concept by Jeong 1982;1984. Szyrmer’s motivation for developing total flow arose out of the inability of Leontief’s classical final-demand-driven inter-industry model to account for total industrial output, but only for the fraction of output that is delivered into final demand. Taking this approach, the responsibility for downstream impacts of some mining industries for example is negligible, since most ores enter other industries rather than being absorbed by final consumers, and all environmental consequences of mining would be passed on to metal works and downstream manufacturers and their customers (compare Milana 1985, p. 284). Thus, Szyrmer sought to formulate a measure that would account for transactions amongst producers as well as between producers and consumers, in other words for intermediate as well as for final demand. Szyrmer thought the total flow concept to be particularly applicable to firms, existing or new, and for identifying “key sectors”. While the concept was introduced in terms of quantities, it applies equally to proxies such as responsibility. Szyrmer (1992, p. 928) correctly points out an important disadvantage of the total flow concept, which is also at the heart of the argument pursued in this article: “A computational consequence of the non-causal nature of the total flow model is its non-additivity feature. As is well known, in the standard Leontief model, each unit of final demand has its own ‘support network’, that is, its own direct and indirect inputs that are perfectly separable from other inputs required by other final demand units. Thus, the whole production system becomes a collection of mutually exclusive and collectively exhaustive production inputs required by a given final demand mix. In the total flow model the mutual exclusiveness of inputs is not present. The same quantity of input i may be required at the same time by gross output of two (or more) different sectors, say j and k independently. This non-additivity property results in a number of computational (and conceptual) inconveniences. The total flow coefficient matrix cannot be expressed as the sum of an infinite power series. When using a total flow model for impact analysis, we should consider, in principle, only one sector at a time.” Non-additivity was already recognised as a problem for determining indirect requirements for gross output by Milana 1985. Based on Miyazawa 1966 formalism for partitioned input-output matrices, Milana and later Heimler 1991 constructed multipliers for the gross output of an industry sector or a company by separating that sector or company from the rest of the economy. Milana 1985 (p. 289), writes that “the sum of total output and primary input requirements for gross output […] leads to a double counting procedure because some indirect requirements of one industry are indirect requirements of other industries which use part of that output of that industry as an intermediate input.” Similarly, Heimler 1991 (p. 263) acknowledges that “gross output of different industries cannot be summed because of double counting of intermediate consumption.”9 Ferng's 2003 production-benefit principle involves double counting for similar reasons. Even her shared-responsibility formulation ΦA + (1-Φ)B, where A and B are allocations of responsibility according to the consumer- and producer-benefit principles and 0<Φ<1, does not solve the
9 Oosterhaven and Stelder 2002 (p. 536, see also de Mesnard 2002) get around the double-counting problem by weighting the gross multiplier “with the fractions of total sectoral output that may rightfully be considered exogenous”, that is the ratio of final demand and gross output. While adding up, this formulation does not accept any impact for intermediate transactions, so that a producer only delivering to other industries would end up having no impact, and hence no responsibility.
6
Lenzen, Murray, Sack and Wiedmann – Shared responsibility
problem, since double counting is always inherent in the second term. Similarly, Kondo and Moriguchi 1998 discuss mixtures between producer and consumer responsibility, but concede that varying percentages of national direct, and attributed CO2 emissions lead to totals depending on the allocation percentage. Bastianoni, Pulselli, and Tiezzi 2004 come up with a solution of distributing greenhouse gas responsibility to producers that avoid double-counting, but their approach is not invariant with respect to sector aggregation.10 Recently, Rodrigues, Domingos, Giljum, and Schneider 2006 have defined an indicator of environmental responsibility that accounts for transactions between countries in a ‘fair’ manner. Based on normative considerations, they derive environmental responsibility as a measure that takes indirect effects into account, follows economic causality, is additive across agents and normalised to the world total, is monotonic on direct environmental pressure and is symmetric with regard to consumption and production behaviour.11 The last property – symmetry – requires further attention. First, Rodrigues, Domingos, Giljum, and Schneider 2006 (p.4) state “…that each economic agent is simultaneously both a consumer and a producer”. In a closed economy the total of full producer and of full consumer responsibility is indeed the same and therefore symmetrical. However, this cannot be said for a single business or industry, because these entities may use primary inputs while not supplying final consumers at all, but only intermediate consumers (i.e. other firms). Similarly, sub-national sets of final consumers (people) may not be part of the labour force, and therefore not generate primary inputs. Hence, in this sub-national perspective, there may be agents who are only producers, and agents who are only consumers. The problem becomes asymmetrical. Second, it is only by enforcing symmetry as a required property that the proposed indicator of environmental responsibility becomes unique. Rodrigues, Domingos, Giljum, and Schneider 2006 state that “…if one does not consider symmetry, then many possibilities arise regarding how to weigh the environmental pressure from consumption and from production.” Whilst true, this is not a sufficient justification for implementing symmetry as an essential property. Third, Rodrigues, Domingos, Giljum, and Schneider 2006 already make one qualification of their argument for imposing symmetry in conceding that (p.6) “there are situations of asymmetry in which a country is more constrained in the choice of its production activities than on its consumer choices.” We contend their view by asserting that asymmetry in economic transactions is not the exception, but rather the rule, especially in a sub-national perspective: Agents belonging to different industry sectors have a very different (and limited) choice of choosing
10 Bastianoni, Pulselli, and Tiezzi 2004 distribute 100 units of emissions amongst three supply chain participants A, B and C by adding up carbon emissions along the chain, and then normalising by the total in order to compensate for multiple-counting. In their example, A emits 50, B 30, and C 20 units, so that “Carbon Emissions Added” (CEA) are 50, 80 and 100 units, respectively. Dividing by 230 and multiplying by 100 units gives 22 (A), 35 (B) and 43 (C), which add up to the correct total of 100 units. Now add a stage D after C that neither adds value nor emissions (an “agent” for C), so that the CEA are 50 (A), 80 (B), 100 (C) and 100 (D). Dividing by 330 and multiplying by 100 units yields CEA of 15.2 (A), 24.2 (B), and 30.3 (C and D). These CEA add up to the correct total, but they are very different from the 3-stage allocation. Given that the supply chain has not changed at all, this is inconsistent. For an invariant solution, see Sections 4.2 and 4.3. 11 Mathematically, this turns out to be the arithmetic average between the environmental pressure generated to produce the final demand and the primary inputs of an agent. Thus, the environmental responsibility of any country is a linear combination of the upstream environmental pressure of the final demand of that country and of the downstream environmental pressure of the primary inputs of that same country. In a practical application Rodrigues and colleagues apply this indicator to the trade of materials between countries (Rodrigues, Schneider, Giljum, Domingos, and Hinterberger 2004; see also Rodrigues and Giljum 2004;2005). In order to distribute total material responsibilities between both consumers and producers, they introduce Total Material Production (TMP) as a mirror indicator to Total Material Consumption and define a “fair” indicator of total material requirements (TMF) as the arithmetic average of TMC and TMP.
7
Lenzen, Murray, Sack and Wiedmann – Shared responsibility
operating inputs and output destinations (see Cerin and Karlson 2002). Hence, “the relations between the actors [in a supply chain] may be characterised by considerable asymmetries in iformation and power” (Cerin 2006, p. 217). In Appendix 3 we show that the concept for an indicator of shared responsibility that we propose in this paper satisfies all five properties suggested by Rodrigues, Domingos, Giljum, and Schneider 2006 except for the condition of symmetry which we don’t accept. Neither is symmetry a requirement for a unique solution, as we show in section 4.2. 2.2 A recent example: The standardisation process of the ecological footprint The debate described in the previous two Sections provides ample evidence for both the practical importance and the challenges of a robust attribution method that includes both producers and consumers. Perhaps the most recent example for this ongoing problem is the discussion surrounding the ecological footprint standards. In 2004, three committees were set up by the Global Footprint Network12, with the task of drafting a set of standards for ecological footprint practitioners, dealing with National Footprint Accounts, application standards, and communication standards.13 While the method traditionally assumes a full life-cycle perspective with full consumer responsibility, a large number of producers (businesses and industry sectors) have started to calculate their own ecological footprints. As a result, various parts of the application standards draft reflect the following requirements:
− A: producers (businesses, industry sectors) can be assessed, in addition to consumers (populations in cities, regions, nations etc);
− B: there should be no double-counting of ecological footprints of sub-national entities; the ecological footprint summed over cities, regions, companies and industries of a nation must match the national ecological footprint as listed in the Global Footprint Network’s National Footprint Accounts;
− C: ecological footprints should encompass the full life-cycle of products.14 In the following Section we argue that 1) strictly speaking, only two of the three requirements can be fulfilled at any one time, 2) this dilemma is identical to the problems previous authors had in conceptualising producer responsibility (Section 2), and 3) shared responsibility provides a way of meeting most of all three requirements.15
12 www.footprintnetwork.org. 13 www.footprintstandards.org. 14 Some of the critique of the draft standards was aimed at the life-cycle reporting requirement for companies. Life-cycle accounting, it was pointed out, was too complex and too complicated: For business to embrace the ecological footprint it had to be easy, affordable and practical, and it had to adhere to the same boundary as the financial annual report, i.e. the company premise. While this is also a topical discussion within the Global Reporting Initiative and elsewhere (see Dey, Lenzen, Foran, and Bilek 2002), this work uses the three requirements above as a given starting point. 15 For further information on ecological footprints, and its connection with input-output analysis, see Lenzen and Murray 2003.
8
Lenzen, Murray, Sack and Wiedmann – Shared responsibility
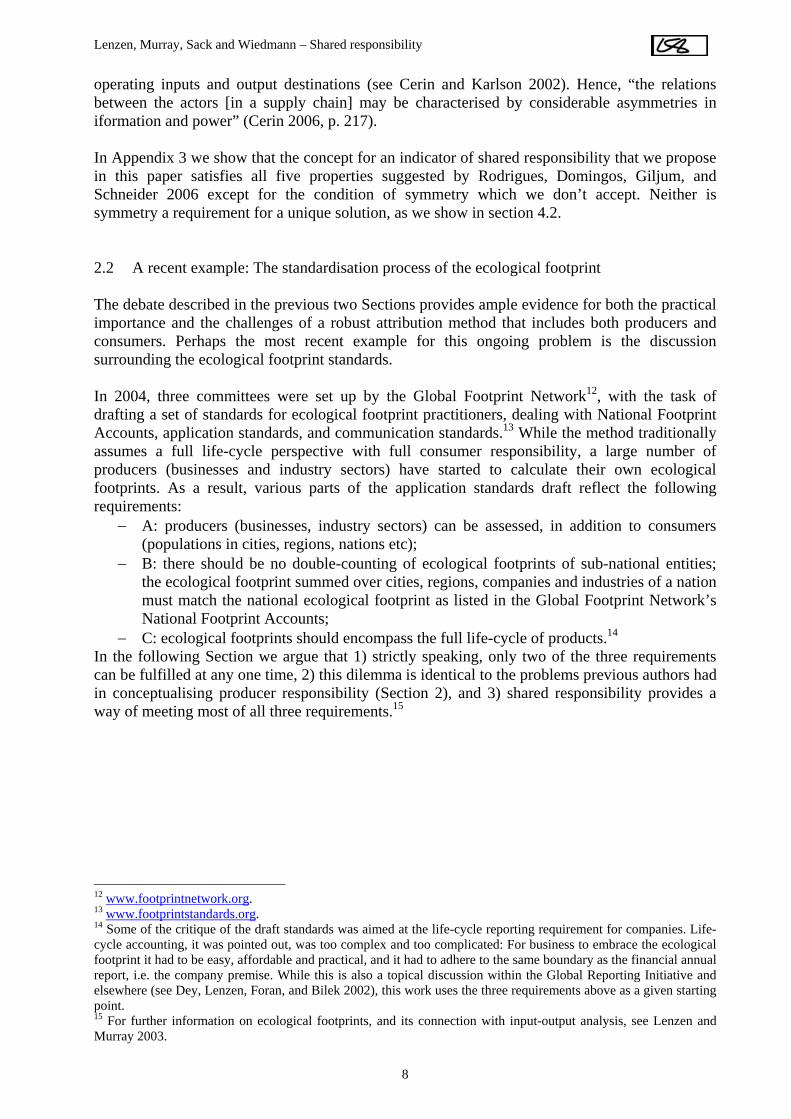
3 Life-cycle accounting and shared responsibility 3.1 The problem of double-counting In the same way as traditional Life-Cycle Assessment (LCA), the Ecological Footprint adds up all upstream impacts embodied in consumer goods. In the example supply chain (food in a glass jar) in Fig. 1, this is the footprint caused by the food manufacturer, plus the footprint caused by the manufacturer of the glass containers that the food manufacturer buys, plus the footprint caused for making the glass for the containers, plus the footprint caused by mining sand to make glass, etc. Assume for the sake of illustration that the participants of this supply chain do not supply anyone other than their successor. Imagine that the producers of food and containers, plus the glass maker and the sand mining company all use traditional LCA to calculate and publicise their ecological footprint. The footprint caused by the food manufacturer supplying the consumer with food would appear in the population’s ecological footprint, plus they would appear in the food manufacturer’s ecological footprint. It is hence double-counted. The footprint caused by mining sand appears in the ecological footprint of the sand mining company (as an on-site impact), in that of the glass maker, the container producer, the food company, and the final consumer (as an upstream impact). Hence, it is multiple-counted (Fig. 1). If every business and consumer in the economy used traditional LCA to calculate their ecological footprint, the sum would be much greater than the total national ecological footprint. The National Footprint Accounts would not balance. This can obviously not be right.
Fig. 1: Double-counting of ecological footprints, for one particular supply chain. 3.2 Consumer or producer responsibility? LCA is a method that assumes full consumer responsibility. In life-cycle thinking, the final consumer is placed at the very end of the supply chain. All impacts incurred during production are heaped onto the final product, making the final consumer ultimately responsible for them16. Therefore, if double-counting is to be avoided, LCA can only be used for the final consumers in an economy: the impacts of any producer must be zero. This is also the perspective taken by traditional Footprint estimates such as the National Footprint Accounts (NFA). After looking at 16 Already in 1774, Adam Smith remarked that “consumption is the sole end and purpose of all production” (Smith 1904).
Final consumer: 0 ha
Glass: 0.4 ha
Glass container: 0.2 ha
Food: 0.2 ha
Sand mine: 8 ha
Final consumer: 8.8 ha
Glass: 8.4 ha
Glass container: 8.6 ha
Food: 8.8 ha
Sand mine: 8 ha
On-site footprint Footprint reported on
9
Lenzen, Murray, Sack and Wiedmann – Shared responsibility
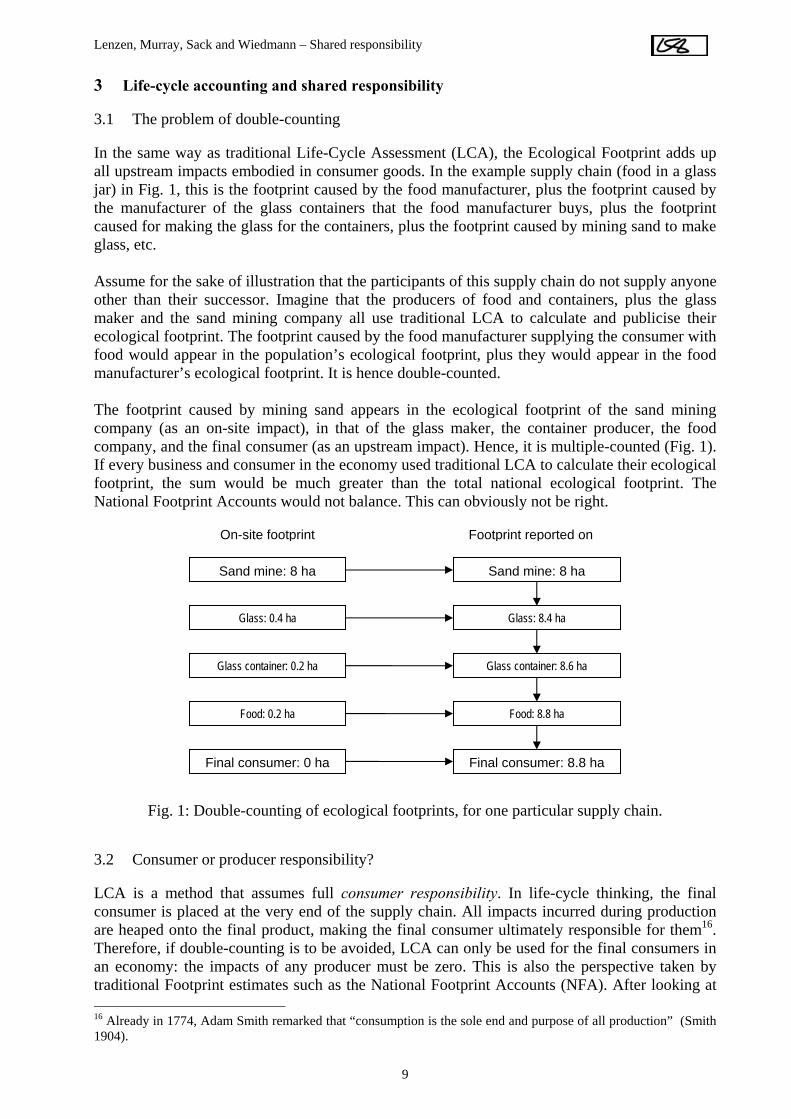
the total impact of production, imports and exports, the NFA calculations result in one figure, the Footprint of the final consumer of a nation in (global) hectares per capita. This is a full consumer responsibility account. Other approaches assume full producer responsibility. For example, every country has to report their greenhouse gas emissions to the Intergovernmental Panel for Climate Change (IPCC). Some countries like Australia emit a lot during the production of goods that are exported. However the IPCC asks that these emissions appear in Australia’s report, not in the report of the country that imports and consumes these goods. The literature contains some interesting debates about which approach is best. Full consumer and producer responsibility are consistent with the principles of National Footprint Accounting in the sense that they do not lead to double-counting (Fig. 2).
Full producer responsibility
Fig. 2: Full producer and consumer responsibility in ecological footprints, for one particular supply chain. The sum of all ecological footprints reported on is 8.8 hectares.
Returning to the requirements for ecological footprint standards, the LCA approach (Fig. 1) fulfils conditions A (producer assessment) and C (full life cycle), but fails B (double-counting). Full producer responsibility (Fig. 2) fulfils A and B, but fails C. Full consumer responsibility (Fig. 2) fulfils B and C, but fails A. Hence, neither approach satisfies all three requirements. A particular disadvantage of full producer or consumer responsibility is that neither allows for both producers and consumers to report on their ecological footprints without double-counting. Full producer and consumer responsibility therefore appear somewhat unrealistic in their extremeness. Both producers and consumers wish to report their ecological footprint, and it is intuitively clear that responsibility is somehow shared between the supplier and the recipient of a commodity, because the supplier has caused the impacts directly, but the recipient has demanded that the supplier do so. When thinking about environmental impacts of producers and consumers, crucial questions arise such as: who is responsible for what, or: how is the responsibility to be shared, if at all? For example: Should a firm have to improve the eco-friendliness of its products, or is it up to the consumer to buy or not to buy? And further: should the firm be held responsible for only the downstream consequences of the use of its products, or – through its procurement decisions –
Final consumer: 0 ha
Glass: 0.4 ha
Glass container: 0.2 ha
Food: 0.2 ha
Sand mine: 8 ha
Final consumer: 8.8 ha
Glass: 0 ha
Glass container: 0 ha
Food: 0 ha
Sand mine: 0 ha
Full consumer responsibility
10
Lenzen, Murray, Sack and Wiedmann – Shared responsibility
also for the implications of its inputs from upstream suppliers? And if so, how far should the downstream and upstream spheres of responsibility extend? Similar questions can be phrased for the problem of deciding who takes the credits for successful abatement measures that involved producers and consumers: Who has the best knowledge of, or the most influence over how to reduce adverse impacts associated with the transfer of a product from producer to consumer? 3.3 Shared responsibility As with many other allocative problems, an acceptable consensus probably lies somewhere between producer and consumer responsibility. In order to assign responsibility to agents participating in these transactions, one has to know the respective supply chains or inter-industry relations. Hence, a problem poses itself in form of the question: “How can one devise an accounting method that allows apportioning ecological footprints (or any other quantity) to both producers and consumers while avoiding double-counting?” This problem has been addressed in a recent publication by Gallego and Lenzen 2005.17
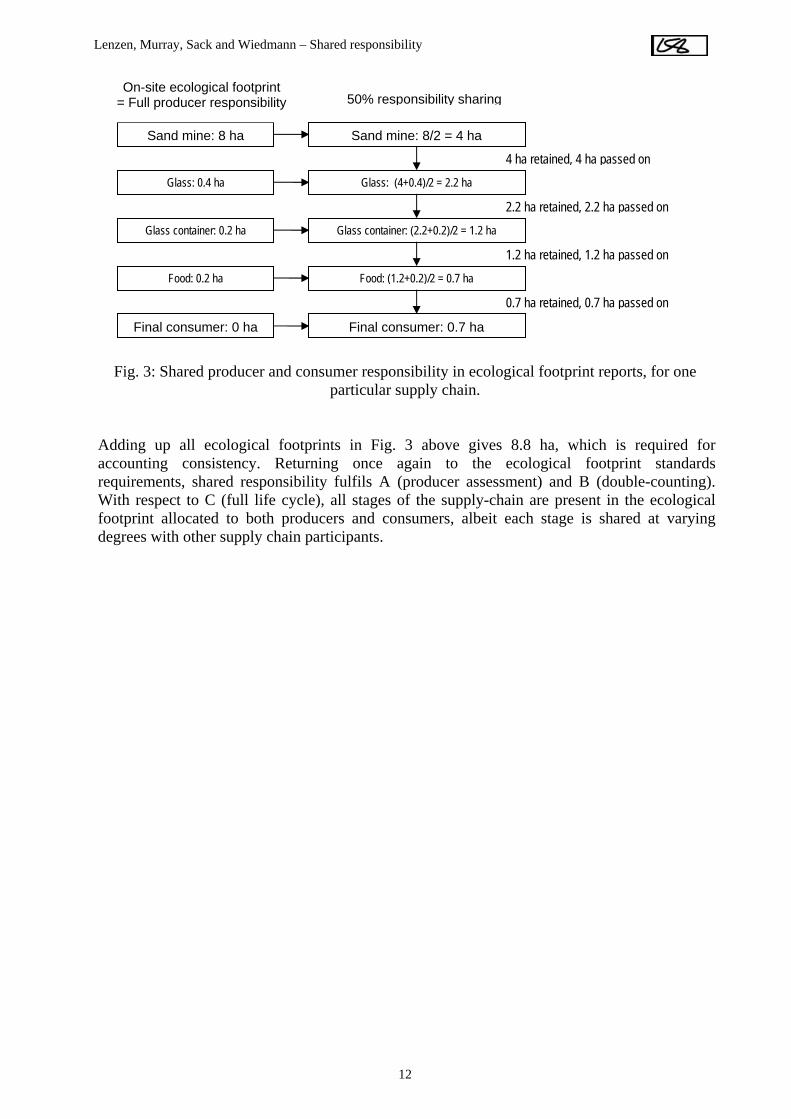
The result is that in reality, both the final consumers and their upstream suppliers play some role in causing ecological footprints: The suppliers use land and energy in order to produce, and make decisions on how much land and energy to use, while consumers decide to spend their money on upstream suppliers’ products. And this role-sharing probably holds for many more situations in business and in life. The concept of shared responsibility recognises that there are always two (groups of) people who play a role in commodities produced and impacts caused, and two perspectives involved in every transaction: the supplier’s and the recipient’s. Hence, responsibility for impacts can be shared between them. Naturally, this applies to both burdens and benefits. The idea of shared responsibility is not new. However shared responsibility has only recently been consistently and quantitatively conceptualised by Gallego and Lenzen 2005. Sharing each impact – for example on a 50%-50% basis between the supplier and the recipient – gets rid of the double-counting problem (Fig.3).
17 A related approach (http://www.sustainableinnovation.org/Recasting-TBL.pdf) challenges the division of the society into producers and consumers, and argues instead that (1) the ecological impacts of human activities are caused by actions that people take. Thus, responsibility and apportionment attaches to people, not producers or even consumers as abstractions, and (2) each person on Earth travels with their proportionate share of the planet’s carrying capacity. Ecological footprints are then allocated based on the time people spend at work or at home. With this concept comes a slightly reformulated question compared to the one quoted above: “How can we devise an accounting method that allows apportioning ecological footprints (or any other quantity) to individuals while avoiding double-counting?” (personal communication, Mark McElroy, 15 Feruary 2006). Even though conceptually promising, this approach is not pursued further here because of a lack of systematic data on time spent by individuals.
11
Lenzen, Murray, Sack and Wiedmann – Shared responsibility
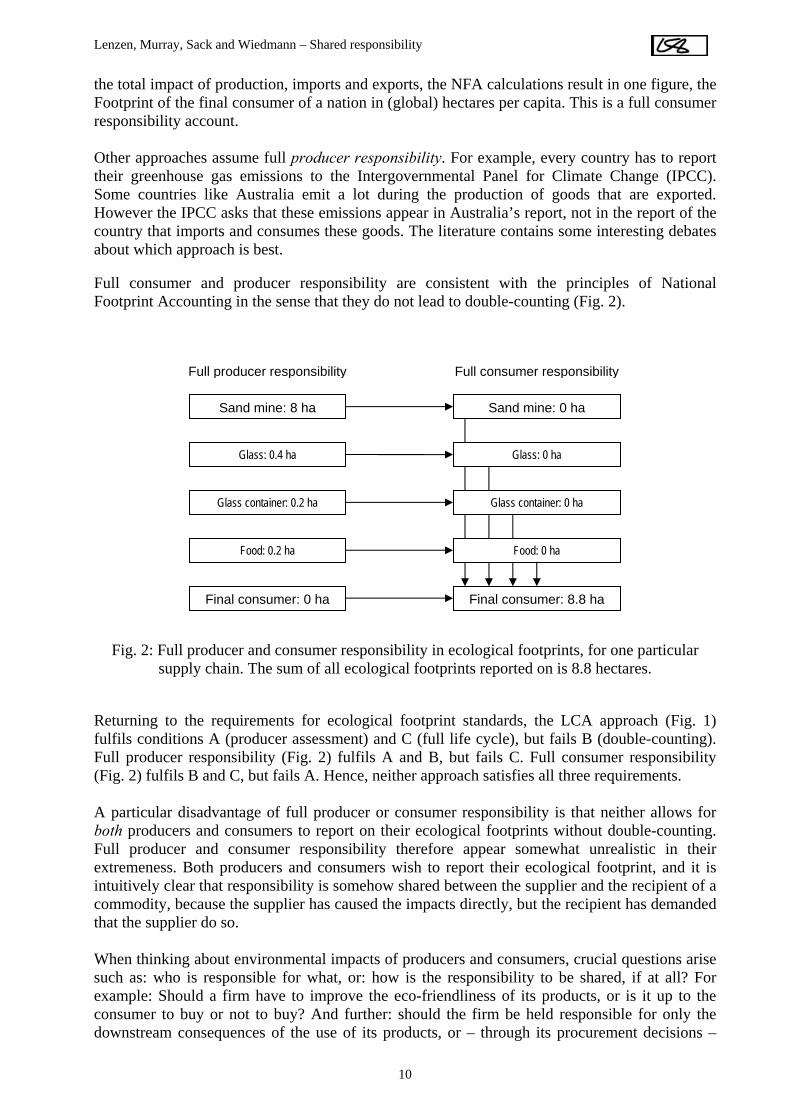
Fig. 3: Shared producer and consumer responsibility in ecological footprint reports, for one
particular supply chain.
Adding up all ecological footprints in Fig. 3 above gives 8.8 ha, which is required for accounting consistency. Returning once again to the ecological footprint standards requirements, shared responsibility fulfils A (producer assessment) and B (double-counting). With respect to C (full life cycle), all stages of the supply-chain are present in the ecological footprint allocated to both producers and consumers, albeit each stage is shared at varying degrees with other supply chain participants.
Final consumer: 0 ha
Glass: 0.4 ha
Glass container: 0.2 ha
Food: 0.2 ha
On-site ecological footprint
Sand mine: 8 ha
= Full producer responsibility
Final consumer: 0.7 ha
Glass: (4+0.4)/2 = 2.2 ha
Glass container: (2.2+0.2)/2 = 1.2 ha
Food: (1.2+0.2)/2 = 0.7 ha
Sand mine: 8/2 = 4 ha
50% responsibility sharing
4 ha retained, 4 ha passed on
2.2 ha retained, 2.2 ha passed on
1.2 ha retained, 1.2 ha passed on
0.7 ha retained, 0.7 ha passed on
12
Lenzen, Murray, Sack and Wiedmann – Shared responsibility
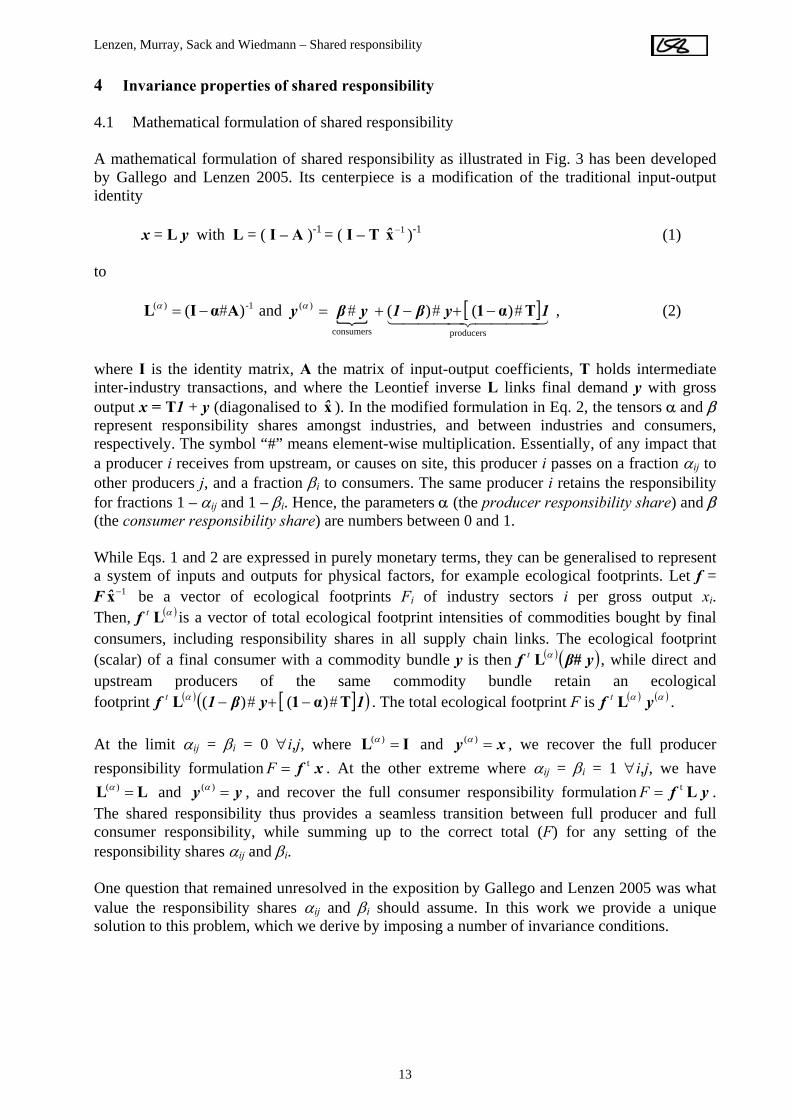
4 Invariance properties of shared responsibility 4.1 Mathematical formulation of shared responsibility A mathematical formulation of shared responsibility as illustrated in Fig. 3 has been developed by Gallego and Lenzen 2005. Its centerpiece is a modification of the traditional input-output identity x = L y with L = ( I – A )-1 = ( I – T )1−x̂ -1 (1) to
-1)( )( AαIL #−=α and { [ ]4444 34444 21
producersconsumers
)( )()( 1yβ1yβy Tα1 ### −+−+=α , (2)
where I is the identity matrix, A the matrix of input-output coefficients, T holds intermediate inter-industry transactions, and where the Leontief inverse L links final demand y with gross output x = T1 + y (diagonalised to ). In the modified formulation in Eq. 2, the tensors α and β represent responsibility shares amongst industries, and between industries and consumers, respectively. The symbol “#” means element-wise multiplication. Essentially, of any impact that a producer i receives from upstream, or causes on site, this producer i passes on a fraction α
x̂
ij to other producers j, and a fraction βi to consumers. The same producer i retains the responsibility for fractions 1 – αij and 1 – βi. Hence, the parameters α (the producer responsibility share) and β (the consumer responsibility share) are numbers between 0 and 1. While Eqs. 1 and 2 are expressed in purely monetary terms, they can be generalised to represent a system of inputs and outputs for physical factors, for example ecological footprints. Let f = F be a vector of ecological footprints F1−x̂ i of industry sectors i per gross output xi. Then, is a vector of total ecological footprint intensities of commodities bought by final consumers, including responsibility shares in all supply chain links. The ecological footprint (scalar) of a final consumer with a commodity bundle y is then
( )αLtf
( ) ( yβ#f αLt )
] )
, while direct and upstream producers of the same commodity bundle retain an ecological footprint . The total ecological footprint F is( ) [( 1yβ1f Tα1L ##t )()( −+−α ( ) ( )αα yf Lt . At the limit αij = βi = 0 ∀i,j, where IL =)(α and , we recover the full producer responsibility formulation . At the other extreme where α
xy =)(α
xf t=F ij = βi = 1 ∀i,j, we have and , and recover the full consumer responsibility formulation .
The shared responsibility thus provides a seamless transition between full producer and full consumer responsibility, while summing up to the correct total (F) for any setting of the responsibility shares α
LL =)(α yy =)(α yf Lt=F
ij and βi. One question that remained unresolved in the exposition by Gallego and Lenzen 2005 was what value the responsibility shares αij and βi should assume. In this work we provide a unique solution to this problem, which we derive by imposing a number of invariance conditions.
13
Lenzen, Murray, Sack and Wiedmann – Shared responsibility
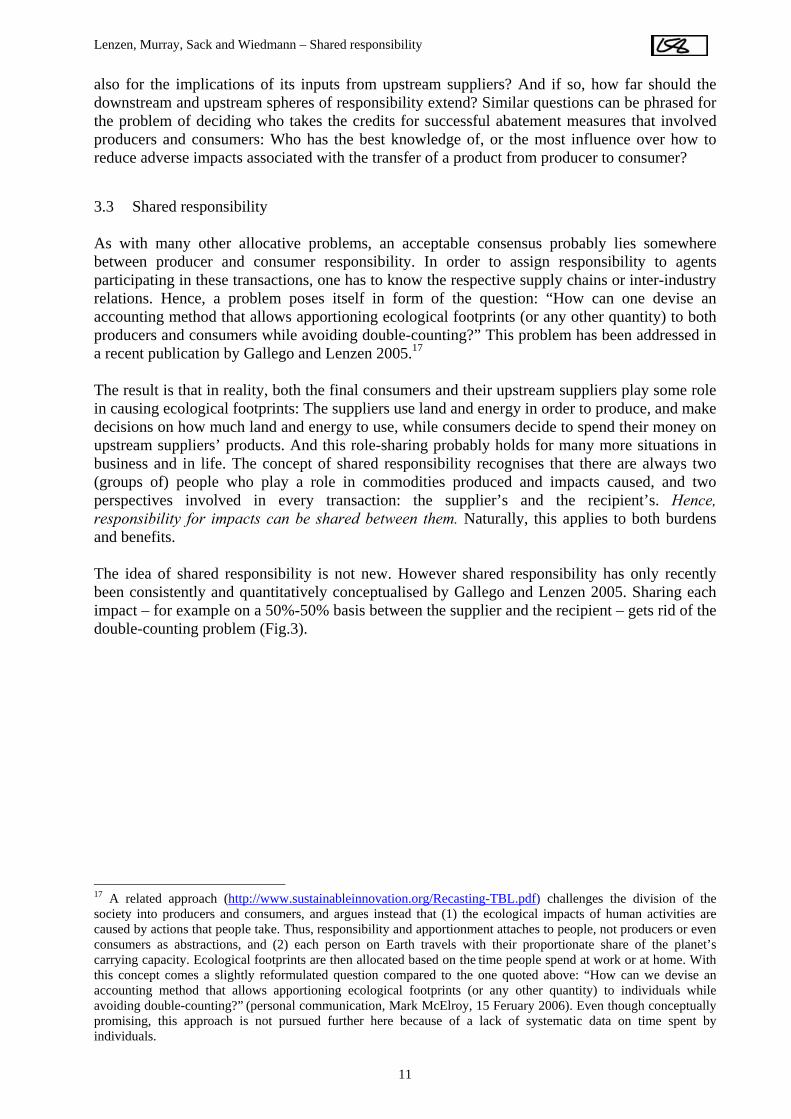
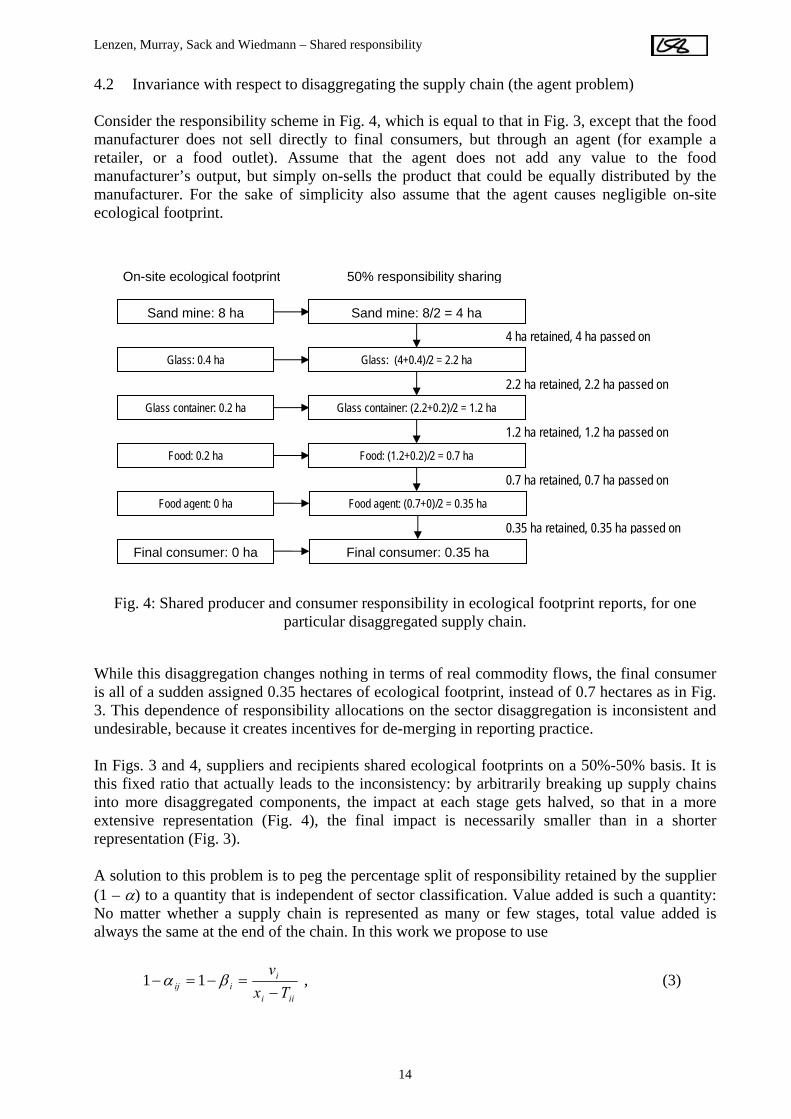
4.2 Invariance with respect to disaggregating the supply chain (the agent problem) Consider the responsibility scheme in Fig. 4, which is equal to that in Fig. 3, except that the food manufacturer does not sell directly to final consumers, but through an agent (for example a retailer, or a food outlet). Assume that the agent does not add any value to the food manufacturer’s output, but simply on-sells the product that could be equally distributed by the manufacturer. For the sake of simplicity also assume that the agent causes negligible on-site ecological footprint.
Fig. 4: Shared producer and consumer responsibility in ecological footprint reports, for one particular disaggregated supply chain.
While this disaggregation changes nothing in terms of real commodity flows, the final consumer is all of a sudden assigned 0.35 hectares of ecological footprint, instead of 0.7 hectares as in Fig. 3. This dependence of responsibility allocations on the sector disaggregation is inconsistent and undesirable, because it creates incentives for de-merging in reporting practice. In Figs. 3 and 4, suppliers and recipients shared ecological footprints on a 50%-50% basis. It is this fixed ratio that actually leads to the inconsistency: by arbitrarily breaking up supply chains into more disaggregated components, the impact at each stage gets halved, so that in a more extensive representation (Fig. 4), the final impact is necessarily smaller than in a shorter representation (Fig. 3). A solution to this problem is to peg the percentage split of responsibility retained by the supplier (1 – α) to a quantity that is independent of sector classification. Value added is such a quantity: No matter whether a supply chain is represented as many or few stages, total value added is always the same at the end of the chain. In this work we propose to use
iii
iiij Tx
v−
=−=− βα 11 , (3)
Final consumer: 0.35 haFinal consumer: 0 ha
Glass: 0.4 ha
Glass container: 0.2 ha
Food: 0.2 ha
Sand mine: 8 ha
On-site ecological footprint
Glass: (4+0.4)/2 = 2.2 ha
Glass container: (2.2+0.2)/2 = 1.2 ha
Food: (1.2+0.2)/2 = 0.7 ha
Sand mine: 8/2 = 4 ha
50% responsibility sharing
4 ha retained, 4 ha passed on
2.2 ha retained, 2.2 ha passed on
1.2 ha retained, 1.2 ha passed on
0.35 ha retained, 0.35 ha passed on
0.7 ha retained, 0.7 ha passed on Food agent: (0.7+0)/2 = 0.35 ha Food agent: 0 ha
14
Lenzen, Murray, Sack and Wiedmann – Shared responsibility
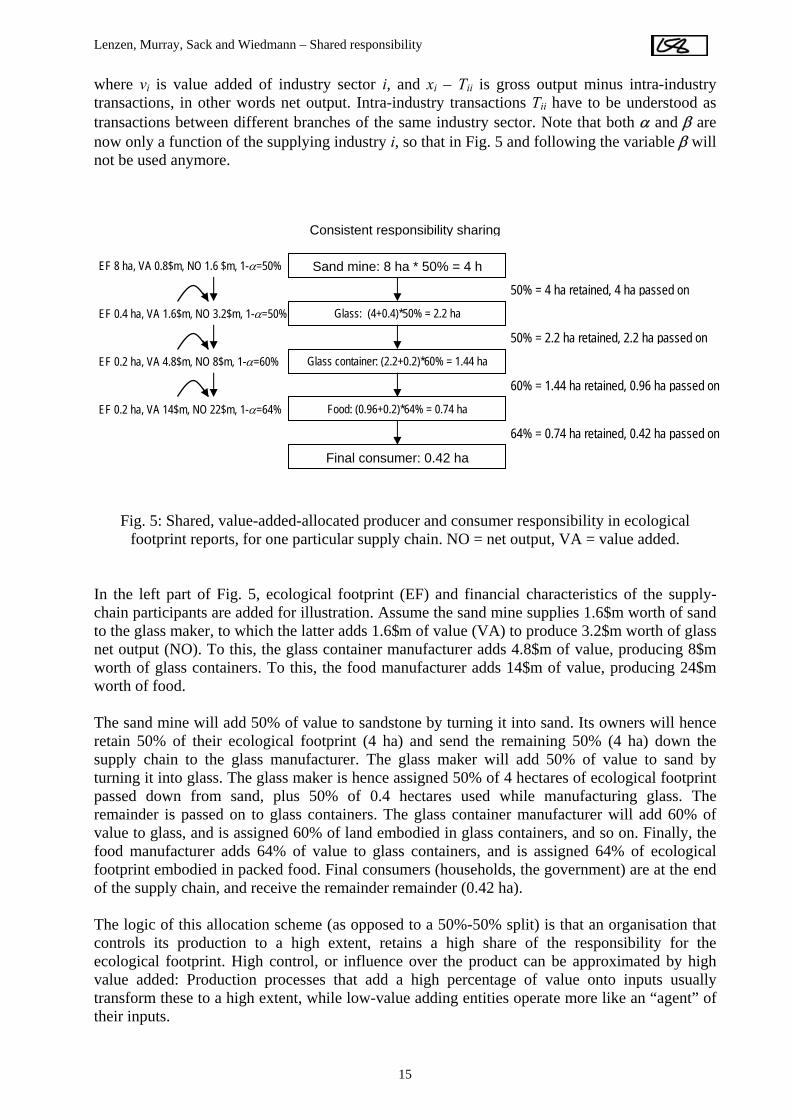
where vi is value added of industry sector i, and xi – Tii is gross output minus intra-industry transactions, in other words net output. Intra-industry transactions Tii have to be understood as transactions between different branches of the same industry sector. Note that both α and β are now only a function of the supplying industry i, so that in Fig. 5 and following the variable β will not be used anymore.
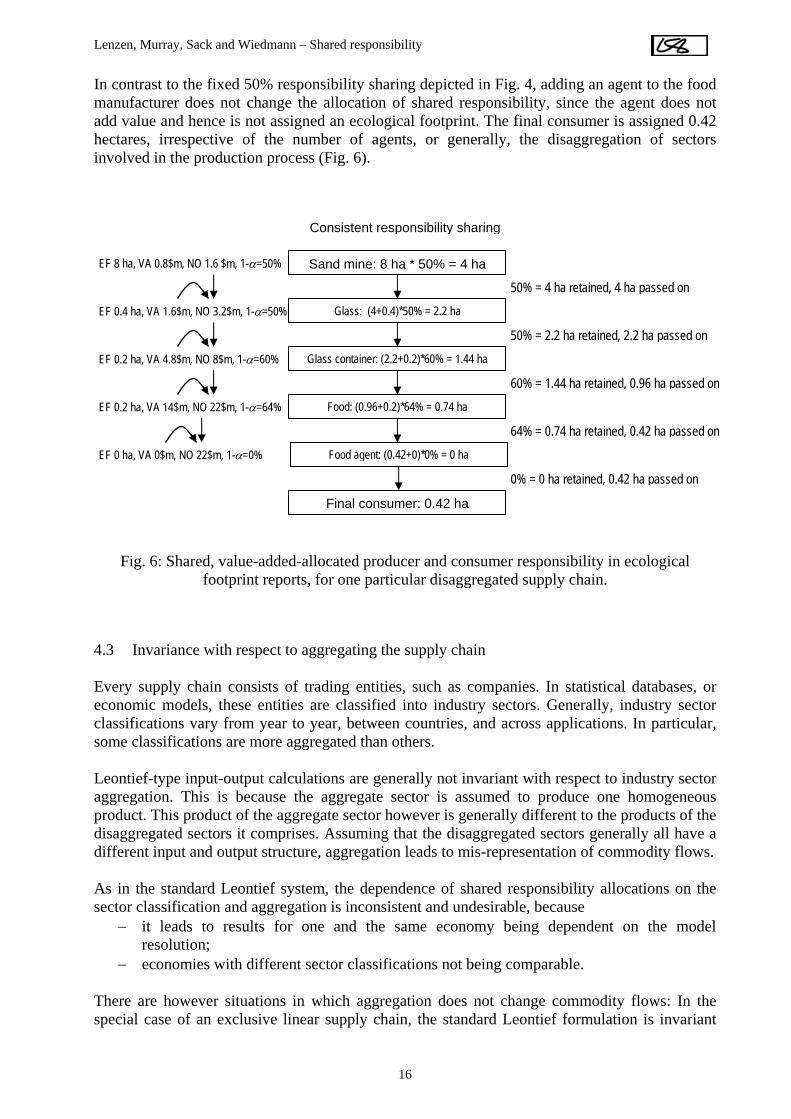
Fig. 5: Shared, value-added-allocated producer and consumer responsibility in ecological footprint reports, for one particular supply chain. NO = net output, VA = value added.
In the left part of Fig. 5, ecological footprint (EF) and financial characteristics of the supply-chain participants are added for illustration. Assume the sand mine supplies 1.6$m worth of sand to the glass maker, to which the latter adds 1.6$m of value (VA) to produce 3.2$m worth of glass net output (NO). To this, the glass container manufacturer adds 4.8$m of value, producing 8$m worth of glass containers. To this, the food manufacturer adds 14$m of value, producing 24$m worth of food. The sand mine will add 50% of value to sandstone by turning it into sand. Its owners will hence retain 50% of their ecological footprint (4 ha) and send the remaining 50% (4 ha) down the supply chain to the glass manufacturer. The glass maker will add 50% of value to sand by turning it into glass. The glass maker is hence assigned 50% of 4 hectares of ecological footprint passed down from sand, plus 50% of 0.4 hectares used while manufacturing glass. The remainder is passed on to glass containers. The glass container manufacturer will add 60% of value to glass, and is assigned 60% of land embodied in glass containers, and so on. Finally, the food manufacturer adds 64% of value to glass containers, and is assigned 64% of ecological footprint embodied in packed food. Final consumers (households, the government) are at the end of the supply chain, and receive the remainder remainder (0.42 ha). The logic of this allocation scheme (as opposed to a 50%-50% split) is that an organisation that controls its production to a high extent, retains a high share of the responsibility for the ecological footprint. High control, or influence over the product can be approximated by high value added: Production processes that add a high percentage of value onto inputs usually transform these to a high extent, while low-value adding entities operate more like an “agent” of their inputs.
Final consumer: 0.42 ha
Glass: (4+0.4)*50% = 2.2 ha
Glass container: (2.2+0.2)*60% = 1.44 ha
Food: (0.96+0.2)*64% = 0.74 ha
Sand mine: 8 ha * 50% = 4 h
Consistent responsibility sharing
EF 8 ha, VA 0.8$m, NO 1.6 $m, 1-α=50%
50% = 4 ha retained, 4 ha passed on
EF 0.4 ha, VA 1.6$m, NO 3.2$m, 1-α=50%
50% = 2.2 ha retained, 2.2 ha passed on
EF 0.2 ha, VA 4.8$m, NO 8$m, 1-α=60%
EF 0.2 ha, VA 14$m, NO 22$m, 1-α=64%
60% = 1.44 ha retained, 0.96 ha passed on
64% = 0.74 ha retained, 0.42 ha passed on
15
Lenzen, Murray, Sack and Wiedmann – Shared responsibility
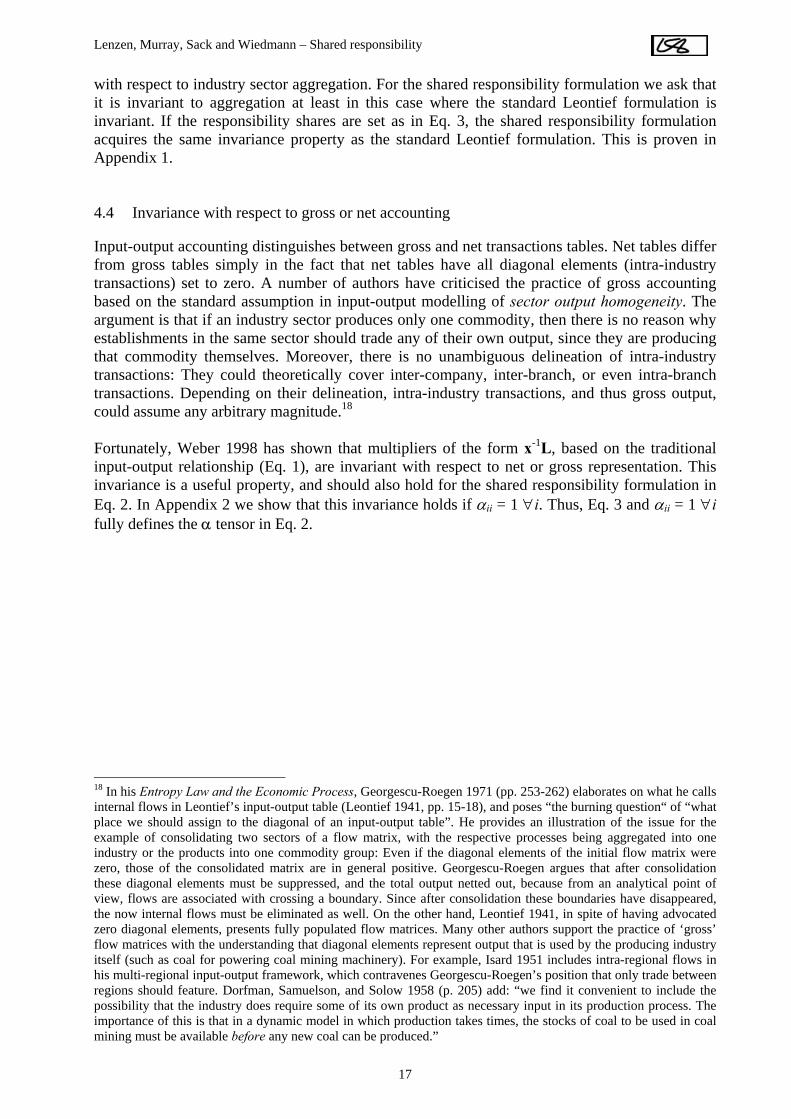
In contrast to the fixed 50% responsibility sharing depicted in Fig. 4, adding an agent to the food
Fig. 6: Shared, value-added-allocated producer and consumer responsibility in ecological
.3 Invariance with respect to aggregating the supply chain
very supply chain consists of trading entities, such as companies. In statistical databases, or
ontief-type input-output calculations are generally not invariant with respect to industry sector
s in the standard Leontief system, the dependence of shared responsibility allocations on the
ent on the model
− ith different sector classifications not being comparable.
here are however situations in which aggregation does not change commodity flows: In the special case of an exclusive linear supply chain, the standard Leontief formulation is invariant
manufacturer does not change the allocation of shared responsibility, since the agent does not add value and hence is not assigned an ecological footprint. The final consumer is assigned 0.42 hectares, irrespective of the number of agents, or generally, the disaggregation of sectors involved in the production process (Fig. 6).
Final consumer: 0.42 ha
Glass: (4+0.4)*50% = 2.2 ha
Glass container: (2.2+0.2)*60% = 1.44 ha
Food: (0.96+0.2)*64% = 0.74 ha
Sand mine: 8 ha * 50% = 4 ha
Consistent responsibility sharing
50% = 4 ha retained, 4 ha passed on
50% = 2.2 ha retained, 2.2 ha passed on
60% = 1.44 ha retained, 0.96 ha passed on
0% = 0 ha retained, 0.42 ha passed on
64% = 0.74 ha retained, 0.42 ha passed on
EF 8 ha, VA 0.8$m, NO 1.6 $m, 1-α=50%
EF 0.4 ha, VA 1.6$m, NO 3.2$m, 1-α=50%
EF 0.2 ha, VA 4.8$m, NO 8$m, 1-α=60%
EF 0 ha, VA 0$m, NO 22$m, 1-α=0%
EF 0.2 ha, VA 14$m, NO 22$m, 1-α=64%
Food agent: (0.42+0)*0% = 0 ha
footprint reports, for one particular disaggregated supply chain.
4 Eeconomic models, these entities are classified into industry sectors. Generally, industry sector classifications vary from year to year, between countries, and across applications. In particular, some classifications are more aggregated than others. Leaggregation. This is because the aggregate sector is assumed to produce one homogeneous product. This product of the aggregate sector however is generally different to the products of the disaggregated sectors it comprises. Assuming that the disaggregated sectors generally all have a different input and output structure, aggregation leads to mis-representation of commodity flows. Asector classification and aggregation is inconsistent and undesirable, because
− it leads to results for one and the same economy being dependresolution; economies w
T
16
Lenzen, Murray, Sack and Wiedmann – Shared responsibility
with respect to industry sector aggregation. For the shared responsibility formulation we ask that it is invariant to aggregation at least in this case where the standard Leontief formulation is invariant. If the responsibility shares are set as in Eq. 3, the shared responsibility formulation acquires the same invariance property as the standard Leontief formulation. This is proven in Appendix 1. 4.4 Invariance with respect to gross or net accounting
net transactions tables. Net tables differ om gross tables simply in the fact that net tables have all diagonal elements (intra-industry
multipliers of the form x L, based on the traditional put-output relationship (Eq. 1), are invariant with respect to net or gross representation. This
Input-output accounting distinguishes between gross andfrtransactions) set to zero. A number of authors have criticised the practice of gross accounting based on the standard assumption in input-output modelling of sector output homogeneity. The argument is that if an industry sector produces only one commodity, then there is no reason why establishments in the same sector should trade any of their own output, since they are producing that commodity themselves. Moreover, there is no unambiguous delineation of intra-industry transactions: They could theoretically cover inter-company, inter-branch, or even intra-branch transactions. Depending on their delineation, intra-industry transactions, and thus gross output, could assume any arbitrary magnitude.18 Fortunately, Weber 1998 has shown that -1
ininvariance is a useful property, and should also hold for the shared responsibility formulation in Eq. 2. In Appendix 2 we show that this invariance holds if αii = 1 ∀i. Thus, Eq. 3 and αii = 1 ∀i fully defines the α tensor in Eq. 2.
18 In his Entropy Law and the Economic Process, Georgescu-Roegen 1971 (pp. 253-262) elaborates on what he calls internal flows in Leontief’s input-output table (Leontief 1941, pp. 15-18), and poses “the burning question“ of “what place we should assign to the diagonal of an input-output table”. He provides an illustration of the issue for the example of consolidating two sectors of a flow matrix, with the respective processes being aggregated into one industry or the products into one commodity group: Even if the diagonal elements of the initial flow matrix were zero, those of the consolidated matrix are in general positive. Georgescu-Roegen argues that after consolidation these diagonal elements must be suppressed, and the total output netted out, because from an analytical point of view, flows are associated with crossing a boundary. Since after consolidation these boundaries have disappeared, the now internal flows must be eliminated as well. On the other hand, Leontief 1941, in spite of having advocated zero diagonal elements, presents fully populated flow matrices. Many other authors support the practice of ‘gross’ flow matrices with the understanding that diagonal elements represent output that is used by the producing industry itself (such as coal for powering coal mining machinery). For example, Isard 1951 includes intra-regional flows in his multi-regional input-output framework, which contravenes Georgescu-Roegen’s position that only trade between regions should feature. Dorfman, Samuelson, and Solow 1958 (p. 205) add: “we find it convenient to include the possibility that the industry does require some of its own product as necessary input in its production process. The importance of this is that in a dynamic model in which production takes times, the stocks of coal to be used in coal mining must be available before any new coal can be produced.”
17
Lenzen, Murray, Sack and Wiedmann – Shared responsibility
5 Discussion: Shared responsibility – theory and practice 5.1 Some implications of shared responsibility The main differences between the principle of shared responsibility, and that of either full producer or full consumer responsibility are:
– in contrast to full producer responsibility, in shared responsibility, every member of the supply chain is affected by their upstream supplier and affects their downstream recipient, hence it is in all agents’ interest to enter into a dialogue about what to do to improve supply chain performance. There is no incentive for such a dialogue in full producer responsibility. In shared responsibility, producers are not alone in addressing the impact (ecological footprint) issue, because their downstream customers play a role too.
– in contrast to full consumer responsibility, shared responsibility provides an incentive for producers and consumers to enter into a dialogue about what to do to improve the profile of consumer products.
The latter point is acknowledged for example by Bastianoni, Pulselli, and Tiezzi 2004 (p. 255) who write that “assuming a consumer responsibility viewpoint, producers are not directly motivated to reduce emissions, while consumers, instead, should in theory assume responsibility for choosing the best strategies and policy by showing a preference for producers who are attentive to GHG reductions. However, without adequate incentives or policies, consumers are not likely to be sensitive with respect to their environmental responsibilities […]”. An interesting feature arising out of applying the shared responsibility principle is that the upstream responsibility for a given impact decreases with increasing distance between actors in the supply chain. In Fig. 5: the final consumer’s demand of food entails an ecological footprint at the sand mine. The sand mine is five transactions away from the final consumer, and hence its ripple impact is hardly noticeable (0.42 ha out of an initial 8 ha). However, the sand mine is only two transactions away from the glass container manufacturer, and hence the ripple impact is higher at 1.44 ha. Finally the sand mine operator has the highest control and influence over how much land is used in mining and is assigned 4 ha. Diminishing influence is an interesting feature since it seems logical to assume that the further a receiving sector is located from the producer of the impact, the less control it has over that impact. Generally put, “different (groups of) economic agents occupy overlapping spheres of social, economic and political influence […], a quantification of [these] influences […] would be a precondition for an allocation of environmental responsibilities to specific actors” (Spangenberg and Lorek 2002, p. 128). Accordingly, choices of responsibility shares should ideally reflect suppliers’ and recipients’ financial control, innovation potential and business relations, as well as their influence over production processes and their options to substitute suppliers or buyers (compare Global Reporting Initiative 2002, p. 26). Value added indicates whether or not a producer has transformed operating inputs in any significant way, and is therefore a good proxy for control and influence over production. A logical step onwards from asserting responsibility is to implement actual legal obligations, or property rights. 5.2 Shared responsibility and property rights Steenge 2004 (p. 48) has created an interesting link between the concept of shared responsibility, and the Coase Theorem (Coase 1960). Using Leontief’s abatement model (Leontief and Ford 1970), Steenge quantitatively confirms that overall allocation of resources will be efficient
18
Lenzen, Murray, Sack and Wiedmann – Shared responsibility
independent of allocation of property rights, given no income effects and zero transaction cost. Nevertheless, Steenge acknowledges that the nature of shared responsibility, or “reciprocity” in Coase’s terminology, depends on the allocation of property rights: “Indeed, the Coasean prescription of allocating property rights has consequences at the individual level which often are viewed as unfair and unjustified.” However, Steenge also points out that traditionally, Coase’s point was only exemplified for a few agents at any one time. In reality, there will be a multitude of agents that “are interconnected in the sense that they use each other’s outputs, either directly or indirectly. In such a context, the idea of ‘offenders’ and ‘victims’ seems less justified. The reason is not difficult to see: A smoke emitting factory produces this smoke precisely to satisfy demand from another sector which itself may be quite clean. So who would be considered as being ‘responsible’ for the smoke? In a sense, it rather is the entire economy (because of the existing interconnections) that should be held responsible. But that means that each sector in an indecomposable economic system can be given (part of) the blame. This also means that, in this context, a distinction on moral grounds between polluting and non-polluting sectors makes less sense. In fact we might say that interconnectedness makes every one responsible” (Steenge 2004, p. 73; see also Steenge 1997). According to Steenge (p. 48), “Coase proposed that, basically, public authorities should confine themselves to establishing and maintaining a system of property rights”, rather than a system of corrective taxes and subsidies (Pigou 1920). In this respect, Steenge suggests that (p. 73) “… the ‘blame’ therefore should not be put arbitrarily at those points where, as a consequence of activities of entire production chains, emissions happen to occur. The [input-output] model expresses this by telling us that changes in the production process of any sector can be passed on straightforwardly to the next sectors, which in their turn can pass it on to further ones, and so on.” Taking Steenge’s argument further, Cerin and Karlson 2002 and Cerin 2006 suggest actively re-arranging corporate legal ownership of production processes, or property rights, in order to provide incentives for extended producer responsibility for environmental impacts. They argue that even if major environmental impacts occur outside producers’ legal boundary, they often possess the control over, and the best competence to reduce those impacts, but they are neither obliged nor stimulated to abate because they do not own property rights over upstream and downstream stages of the products’ life-cycle (stewardship). In this case, if other agents (for example consumers) wanted to abate they would first have to acquire the necessary information, thus incurring transaction costs that could be avoided if the agent with the best abatement competence (the producer) was given the property rights over the respective part of the product life cycle.19 In this respect, Cerin 2005b again uses the Coase theorem to explain the necessity of giving the rights to resources to those who can use them most productively in order to keep transaction costs down and to increase overall efficiency. This control-based delimitation of production ownership would also correspond directly to control over financial risk, for example from new environmental policies, or resource price increases (cf. Cerin 2002, p. 59). The shared responsibility approach advocated here rings true with all of the above: After exchanging “property rights” for “responsibility” in the previous paragraph, Cerin and Karlson’s 19 For example, drivers do often not possess the technical knowledge required to operate a car at minimum fuel consumption and emissions. On the other hand it is not the obligation of car manufacturers to maintain the car in optimum working order, once sold. The result is either drivers shouldering transaction costs (efforts to acquire technical knowledge, workshop bills) in order to keep fuel consumption low, or cars running at suboptimal performance. Assuming that drivers do not really want a car as such, but mobility, it would be more efficient if car manufacturers sold mobility (kilometres) rather than cars. In such a scenario, manufacturers would own and hire out car and petrol, rather than sell or even hire out only cars. Since manufacturers have better product knowledge, cars would operate efficiently in order to keep mobility cost low and the manufacturer competitive. Drivers would not worry about which model car to buy, and how to maintain it.
19
Lenzen, Murray, Sack and Wiedmann – Shared responsibility
argument still makes good sense. In essence, our shared responsibility scheme is a suggestion for a method of exactly how to allocate property rights and pass on responsibility in a non-arbitrary way across entire supply chains without any double counting. 5.3 Applying shared responsibility: experience from reporting practice During the course of developing this approach the authors have road-tested the idea with a wide range of organisations some of which were part of a two-year action research project to examine the sustainability reporting support needs of business, industry, government and non-government organisations.20 This road-testing has revealed a number of positions: While some were critical of the approach for a range of practical reasons others took an academic interest in examining possible solutions. The general discussion sparked interest in the philosophical dilemmas inherent in the construct of ‘responsibility’ and its apportioning. Behind several of the arguments was a practical consideration of cost in time, money and energy associated with stakeholder education or re-education. For example a non-government organisation with an interest in bringing about change through buyer activism may have invested heavily in community education programs that rely on the end-user taking responsibility for environmental or social problems associated with the production of some goods. The 2004 No Dirty Gold21 campaign conducted by Earthworks and Oxfam and aimed at Valentine’s Day jewelry buyers relied on the passion of activists and their ability to convince buyers of their responsibility for the health and safety of mine workers. The organisation may be reluctant to embrace a methodology that would require a new public education strategy and could, in the sharing of responsibility, diffuse the focus for activism. Another organisation had, a few years earlier, begun to report on greenhouse gas emissions, accepting full upstream responsibility, and publicising abatement plans and targets. A new approach that provided a distinct drop in emissions and assigned some of the ‘blame’ to others they felt would be viewed with the utmost suspicion among external stakeholders. It would require a considerable investment in education to explain this new position. A related position was that voiced by a member of a large industry who felt that the time and effort required to convince internal stakeholders, in particular the Board of Directors, would be considerable and unless there was some outside pressure to adopt shared responsibility as a reporting methodology support for such a campaign would not be considered. Some organisations responded primarily to the academic argument: Producer and consumer footprint should never be mixed, or added up, and the full producer and full consumer responsibility view (Fig. 2) should just be taken as the same number looked at from a different perspective (compare also Dietzenbacher 2005). One criticism of the shared responsibility solution was that financial value added reflects both consumer preferences (demand) and resource or service scarcity (supply), and that therefore it does not serve as a direct causal basis from which to assign producer responsibility. It was argued that a more pragmatic approach would be to assign responsibility shares that ensure best possible influence in the sense of best possible financial ability to abate adverse impacts. Based on this rationale, the responsibility share could be pegged to gross operating surplus as the only discretionary component of value added. However, a disadvantage of the surplus-pegging method is that it does not have the same invariance property as the standard Leontief formulation (see 4.3). 20 A full report of this project can be found at http://www.isa.org.usyd.edu.au/research/TBLEPA.shtml. 21 http://www.wrm.org.uy/bulletin/80/Africa.html and http://www.nodirtygold.org/dirty_metals_report.cfm.
20
Lenzen, Murray, Sack and Wiedmann – Shared responsibility
Moreover, it was argued that asserting responsibility only goes part of the way towards Cerin and Karlson’s suggestion of re-allocating property rights: Solely asserting responsibility does not create an economic incentive, but property rights do. Another argument cited destructive production methods that add very little value, resulting from various forms of market failure or regulatory intervention. The proposed solution to the allocation problem would fail to assign responsibility shares as might seem intuitively appropriate in such cases. This view was guided by an intuitive link between impact severity and responsibility. However, in our approach as in Cerin and Karlson 2002, responsibility is assigned according to process knowledge and influence, not impact: It may therefore be the case that an industry with a large environmental impact and little value added in its production shares little responsibility. An example would be a sector that – largely driven by downstream demand – simply extracted, and passed on an intensively impacting low-price resource. Most of the responsibility would lie with those downstream value-adding industries which created the demand for extraction. It was also pointed out that other less tangible types of influence should be included in a responsibility measure, such as advertising, or other mechanisms that create and drive consumer preferences, and hence generate surplus and value added. Despite the above arguments some took the position that what goes into the ‘black box’ of methodology was of no real concern to them. They were happy to leave the academic discussion to the experts and were willing to trust whatever the resulting consensus. Their need was for an accepted standard that produced reliable and comparable results. 5.4 Shared responsibility and value judgment At the other end of the spectrum, some organisations warned against the use of moral and value judgments, and preferred reporting what is, and not what should be. Some recommended the use of non-judgmental terms such as “footprint of activities” or “impact embodied in commodities” rather than naming agents (producers and consumers). It was also suggested not to use the term “responsibility” because it could be seen as pre-assigning blame, but rather to use less contentious phrases such as “allocation” or “attribution” with certain impacts.22 The motivation behind these comments is partly the perceived arbitrariness of any delineation of “fair shares” between different agents, partly negative experiences or concern of disaffecting certain segments of the population, and partly the assertion that people would draw their own conclusions when presented with factual information. In this context, it must be noted that if one wants to be able to calculate (environmental) impacts for intermediate as well as final supply chain entities at the same time, one must split the life-cycle at some point, independent of whether one deals with agents, or with activities/commodities. Without such a split there will be double-counting. If one assumes that any split will be based on a value judgment, then this means that if one wants to be able to
22 Note that using “footprint embodied in commodities” without further qualification can lead to ambiguity: Embodiments are usually calculated for final consumer goods and services. Hence, within full consumer responsibility, the “footprint embodied in 100$ worth of paper” relates only to paper bought by a final consumer. In this perspective, the footprint of paper bought by a book publisher is zero, because this embodiment is passed on to downstream customers of books, and is part of the footprint of books. As a result, one cannot get around naming agents.
21
Lenzen, Murray, Sack and Wiedmann – Shared responsibility
calculate consistent (environmental) impacts for intermediate and final entities, one has to make a value judgment. For example, the ecological footprint chooses to report in a life-cycle perspective. This choice is in fact based on a value judgment: In life-cycle thinking – no matter whether implemented using the Leontief input-output framework or another method – ecological footprints, or any other production impact, is passed on downstream until it ends at the final consumer and the end of commodities’ life. Hence, life-cycle thinking chooses the full consumer responsibility paradigm: it chooses to heap all impact onto final consumers, and to exclude intermediate producers from responsibility. We believe that it is impossible to think of a sustainability indicator that merely reports a state of affairs without conveying a value-based message. However formulated, any sustainability indicator will at least embody the message that the world should move towards a sustainable state – which in itself is value-based, and ultimately debatable. Moreover, in accepting the use of say, the ecological footprint, we are accepting the outcome of myriad decisions, judgments made about inclusions and exclusions, strategies and calculations, all of which have come out of a particular view of the world. At last, how can people understand a statement of “the ecological footprint of producing cars”, or “the ecological footprint of the commodity ‘car’”, other than as a message that they bear some responsibility for the act of producing or consuming this car, and the consequences thereof? Activities and commodities cannot act, only people can. Therefore, any sustainability indicator does inherently, and must, address people in their capacity to accept responsibility, and invite them to act accordingly in order to bring about changes towards a particular set of goals and values. For this very reason, many companies have already started to calculate “their ecological footprint”. They want, and they are expected by shareholders, to take responsibility for the production processes that they own.
22
Lenzen, Murray, Sack and Wiedmann – Shared responsibility
6 Conclusions Over the past decade, an increasing number of authors have examined the nexus of producer versus consumer responsibility, often dealing with the question of how to assign responsibility for internationally traded greenhouse gas emissions. Recently, a problem has appeared in drafting the standards for the ecological footprint: While the method traditionally assumes a full life-cycle perspective with full consumer responsibility, a large number of producers (businesses and industry sectors) have started to calculate their own footprints. Adding any producer’s footprint to other producers’ footprints, or to population footprints, which all already cover the full upstream supply chain of their operating inputs, leads to double-counting: The sum over footprints of producers and consumers is larger than the total national footprint. The standardisation committee was hence faced with the decades-old non-additivity problem, posing the following dilemma for the accounting of footprints, or any other production factor: if one disallows double-counting, but wishes to be able to account for producers and consumers, then one cannot impose the requirement of full life-cycle coverage; the supply chains of agents have to be curtailed somehow in order to avoid double-counting. This work demonstrates and discusses a method of consistently delineating these supply chains, into mutually exclusive and collectively exhaustive responsibilities to be shared by all agents in an economy. More generally, the method is an approach to allocating factors across agents in a fully inter-connected circular system. The method has desirable invariance properties, and leads to a unique assignment scheme. As an example we demonstrate how upstream environmental impacts are shared between the agents of a supply chain. The same approach can be applied to downstream impacts, as described in Gallego and Lenzen, 2005. Although our formulation of shared responsibility is developed here for businesses as agents in a national economy, it can also be applied in a multi-region input-output setting to trade between countries and regions. We believe that our approach of pegging responsibility shares to value added not only has desirable invariance properties, but that it makes intuitive sense as well, in that it places responsibility where the influence and control over production processes and operating inputs resides. Organisations that are already engaging in Extended Producer Responsibility have started dialogues with their closest upstream suppliers and customers, or have appraised changes to procurement policy.8 The fact that shared responsibility diminishes with increasing distance between the point of impact and the point of product use directly reflects and supports this practice, since the further users of a product are located from the producer of the impact, the less control they have over that impact. At a meeting of the action research participants mentioned in Section 5.3, it was generally agreed that the building of critical mass was the real issue. Were shared responsibility to become embedded in a methodology that became the standard than it would be accepted because ‘everyone was doing it’. Moreover the burden of stakeholder education would be taken from them because they would be able to point to ‘the standard’. And therein lies the heart of the problem for many practitioners. The time and budget needed to provide an education strategy are prohibitive especially when the issue is one that most would consider irrelevant to their core business. Yet until a core group of organisations take up a standard methodology, developed out of academic debate and feedback from practitioners then there will be no critical mass. There is, therefore, a need to present, in a range of media and in accessible language, the issues and dilemmas, inherent in accounting fairly for the environmental, social and economic effects of doing business. At the same time work must proceed on developing accounting and reporting standards that provide long term solutions to the outstanding accounting problems, solutions that work at all levels and across individual, organization, city, state and national boundaries.
23
Lenzen, Murray, Sack and Wiedmann – Shared responsibility
The ecological footprint, and sustainability indicators in general, as a concept, are not simply about promoting a particular kind of understanding of our impact on the environment. They are implicitly about promoting someone’s notion of ‘right action’ based on that understanding. Similarly, users of the ecological footprint, or any reporting methodology, are not operating in a value-free zone. They are using the methodology in order to influence people and effect change. Again, presumably they have in mind a notion of ‘right action’ that they hope will follow. Thus to design a methodology and to use that methodology are already value-laden actions. In using this or any methodology we take responsibility for the choice and all that it implies by way of underlying assumptions. Someone produced the methodology, someone else used it. Just as in the broader argument of this paper any actor is part of a web of interactions for which there is no beginning and no end point – nowhere to apportion ultimate responsibility. Acknowledgements This research and its applications were supported in parts, by the Fisheries Research and Development Corporation (FRDC), and the NSW Environmental Trust. Richard Wood (ISA, University of Sydney) cleared up mathematical inconsistencies in an earlier allocation model. Mathis Wackernagel (Global Footprint Network), Mark McElroy (Sustainable Innovation, USA), Bert Steenge (University of Twente, Netherlands), Joel Fleming (ClimateFriendly, Australia), Rowena Joske (Australian Conservation Foundation), and Christopher Dey (ISA) provided valuable comments on earlier drafts. Glen Peters (Norwegian University of Science and Technology) pointed out Steenge’s work on the connection of the Leontief model with the Coase Theorem.
24
Lenzen, Murray, Sack and Wiedmann – Shared responsibility
References Ara, K. 1959. The aggregation problem in input-output analysis. Econometrica 27(2), 257-62. Barry, Anthony 1996. Buyers start to spread the "green" message. Purchasing & Supply
Management Feb, 21. Bastianoni, S., F. M. Pulselli, and E. Tiezzi 2004. The problem of assigning responsibility for
greenhouse gas emissions. Ecological Economics 49, 253-57. Blair, I. M. and R. E. Miller 1983. Spatial aggregation of multiregional input-output models.
Environment and Planning A 15, 187-206. Carillion 2001. Sustainable Supply Chain Management. Sustainability Report
http://www.carillionplc.com/sustain-2001/sustainable_supply_chain_managem.htm. Carillion: Wolverhampton, West Midlands, UK.
Cerin, P. 2002. Communication in corporate environmental reports. Eco-Management and Auditing 9, 46-66.
Cerin, P. 2005a. Environmental Strategies in Industry - Turning Business Incentives into Sustainability. Report 5455. Swedish Environmental Protection Agency: Stockholm, Sweden.
Cerin, P. 2005b. Introducing Value Chain Stewardship (VCS). International Environmental Agreements, in press.
Cerin, P. 2006. Bringing economic opportunity into line with environmental influence: A discussion on the Coase theorem and the Porter and van der Linde hypothesis. Ecological Economics 56, 209-25.
Cerin, P. and L. Karlson 2002. Business incentives for sustainability: a property rights approach. Ecological Economics 40, 13-22.
Chartered Institute of Purchasing and Supply 1999. Ethical business practices in purchasing and supply. CIPS Positions on Practice, http://www.epolitix.com/data/companies/images/Companies/Chartered-Institute-of-Purchasing-and-Supply/ethics.pdf. Chartered Institute of Purchasing and Supply: Easton on the Hill, Stamford, Lincolnshire, UK.
Chartered Institute of Purchasing and Supply 2000. Environmental purchasing and supply management summary. CIPS Policies and Positions, http://www.epolitix.com/data/companies/images/Companies/Chartered-Institute-of-Purchasing-and-Supply/environmental.pdf. Chartered Institute of Purchasing and Supply: Easton on the Hill, Stamford, Lincolnshire, UK.
Chartered Institute of Purchasing and Supply UK 1993. Green purchasing: Are you buying into the environment? Purchasing & Supply Management Jul/Aug, 18.
Coase, R. H. 1960. The problem of social cost. Journal of Law and Economics 3, 1-44. Danish Environmental Protection Agency 1998. Denmark's Second National Communication on
Climate Change submitted under the UN FCCC. Internet site http://www.mst.dk/homepage/. Danish Ministry of Environment and Energy: Copenhagen.
de Mesnard, L. 2002. Note about the concept of "net multipliers". Journal of Regional Science 42(3), 545-48.
Dey, C., M. Lenzen, B. Foran, and M. Bilek 2002. Addressing boundary issues in the Global Reporting Initiative. Comments on the Draft 2002 Sustainability Reporting Guidelines, http://www.globalreporting.org/feedback/PublicComments2002/UniversityofSydneyCSIRO.pdf. The University of Sydney, CSIRO Sustainable Ecosystems: Sydney, Australia.
Dietzenbacher, E. 2005. More on multipliers. Journal of Regional Science 45(2), 421-26. Dorfman, R., P. A. Samuelson, and R. M. Solow 1958. Linear Programming and Economic
Analysis. New York, USA: McGraw-Hill.
25
Lenzen, Murray, Sack and Wiedmann – Shared responsibility
Environment Protection Authority New South Wales 2003. Extended Producer Responsibility Priority Statement. Consultation Paper 2003/10. EPA NSW: Sydney South, NSW, Australia.
Ferng, J.-J. 2003. Allocating the responsibility of CO2 over-emissions from the perspectives of benefit principle and ecological deficit. Ecological Economics 46, 121-41.
Fisher, W. D. 1986. Criteria for aggregation in input-output analysis, in Readings in Input-Output Analysis. I. Sohn ed. New York, USA: Oxford University Press, 210-25.
Ford Motor Company of Australia Limited 2003. Policies and organisation. Broadmeadows Public Environment Report 2002/2003, www.ford.com.au/resources/pdf/environment/7.pdf. Ford Motor Company of Australia Limited: Campbellfield, Victoria, Australia.
Gallego, B. and M. Lenzen 2005. A consistent input-output formulation of consumer and producer responsibility. Economic Systems Research 17(4), 365-91.
Georgescu-Roegen, N. 1971. The Entropy Law and the Economic Process. Cambridge, MA, USA: Harvard University Press.
Global Reporting Initiative 2002. Sustainability Reporting Guidelines. Global Reporting Initiative: Boston, USA.
Hamilton, C. and H. Turton 1999. Population policy and environmental degradation: sources and trends in greenhouse gas emissions. People and Place 7(4), 42-62.
Hamilton, C. and H. Turton 2002. Determinants of emissions growth in OECD countries. Energy Policy 30, 63-71.
Heimler, A. 1991. Linkages and vertical integration in the Chinese economy. Review of Economics and Statistics 73(2), 261-67.
Imura, H. and Y. Moriguchi 1995. Economic interdependence and eco-balance: accounting for the flow of environmental loads associated with trade, in Toward Global Planning of Sustainable Use of the Earth. S. Murai ed. Amsterdam, Netherlands: Elsevier, 189-208.
Isard, W. 1951. Interregional and regional input-output analysis, a model of a space economy. Review of Economics and Statistics 33, 318-28.
Jeong, K. 1982. Direct and indirect requirements: a correct economic interpretation of the Hawkins-Simons conditions. Journal of Macroeconomics 4, 349-56.
Jeong, K. 1984. The relation between different notions of direct and indirect input requirements. Journal of Macroeconomics 6, 473-76.
Kondo, Y. and Y. Moriguchi 1998. CO2 emissions in Japan: influences of imports and exports. Applied Energy 59(2-3), 163-74.
Lenzen, M. 2002. A guide for compiling inventories in hybrid LCA: some Australian results. Journal of Cleaner Production 10, 545-72.
Lenzen, M. and S. A. Murray 2003. The ecological footprint - issues and trends. ISA Research Paper 01-03, Internet site http://www.isa.org.usyd.edu.au/publications/documents/Ecological_Footprint_Issues_and_Trends.pdf. ISA The University of Sydney: Sydney, Australia.
Lenzen, M., L.-L. Pade, and J. Munksgaard 2004. CO2 multipliers in multi-region input-output models. Economic Systems Research 16(4), 391-412.
Lenzen, M. and S. Smith 2000. Teaching responsibility for climate change: three neglected issues. Australian Journal of Environmental Education 15/16, 69-78.
Lenzen, M. and G. Treloar 2003. Differential convergence of life-cycle inventories towards upstream production layers. Journal of Industrial Ecology 6(3-4), 137-60.
Leontief, W. 1941. The Structure of the American Economy, 1919-1939. Oxford, UK: Oxford University Press.
Leontief, W. and D. Ford 1970. Environmental repercussions and the economic structure: an input-output approach. Review of Economics and Statistics 52(3), 262-71.
Lloyd, Michael 1994. How green are my suppliers? - Buying environmental risk. Purchasing & Supply Management Oct, 36.
26
Lenzen, Murray, Sack and Wiedmann – Shared responsibility
McKerlie, K., N. Knight, and B. Thorpe 2006. Advancing Extended Producer Responsibility in Canada. Journal of Cleaner Production 14, 616-28.
Mélanie, J., B. Phillips, and B. Tormey 1994. An international comparison of factors affecting carbon dioxide emissions. Australian Commodities 1(4), 468-83.
Milana, C. 1985. Direct and indirect requirements for gross output in input-output systems. Metroeconomica 37, 283-92.
Miyazawa, K. 1966. Internal and external matrix multipliers in the input-output model. Hitotsubashi Journal of Economics 7(1), 38-55.
Munksgaard, J. and K. A. Pedersen 2001. CO2 accounts for open economies: producer or consumer responsibility? Energy Policy 29, 327-34.
Norwich Union Central Services 2003. Suppliers. Corporate Social Responsibility Report http://www.aviva.com/responsibility/2003report/reports/nu_cent_suppliers.htm. Norwich Union Central Services: Norwich, UK.
Oosterhaven, J. and D. Stelder 2002. Net multipliers avoid exaggerating impacts: with a bi-regional illustration for the Dutch transportation sector. Journal of Regional Science 42(3), 533-43.
Organisation for Economic Co-operation and Development 2001. Extended Producer Responsibility: A Guidance Manual for Governments. Paris, France: Organisation for Economic Co-operation and Development.
Parikh, J. 1996. Consumption patterns: the driving force of environmental stress, in Pricing the Planet. P. H. May and R. Serôa da Motta eds. New York, USA: Columbia University Press, 39-48.
Parikh, J. K. and J. P. Painuly 1994. Population, consumption patterns and climate change: a socioeconomic perspective from the south. Ambio 23(7), 434-37.
Pigou, A. C. 1920. The Economics of Welfare. London, UK: Macmillan. Princen, T. 1999. Consumption and environment: some conceptual issues. Ecological Economics
31, 347-63. Proops, J. L. R., M. Faber, and G. Wagenhals 1993. Reducing CO2 Emissions. Berlin, Germany:
Springer-Verlag. Rodrigues, J., T. Domingos, S. Giljum, and F. Schneider 2006. Designing an indicator of
environmental responsibility. Ecological Economics, in press. Rodrigues, J. and S. Giljum 2004. The accounting of indirect material requirements in material
flow based indicators. SERI Working Paper Nr. 3. Sustainable Europe Research Institute (SERI): Vienna, Austria.
Rodrigues, J. and S. Giljum 2005. The accounting of indirect material requirements in material flow based indicators. Journal of Environmental Economics (ICFAI) 3, 51-69.
Rodrigues, J., F. Schneider, S. Giljum, T. Domingos, and F. Hinterberger 2004. Designing a fair indicator of environmental pressure. Unpublished manuscript. Sustainable Europe Research Institute (SERI): Vienna, Austria.
Smith, A. 1904. An Inquiry into the Nature and Causes of the Wealth of Nations. Strand, UK: Methuen & Co.
Spangenberg, J. H. and S. Lorek 2002. Environmentally sustainable household consumption: from aggregate environmental pressures to priority fields of action. Ecological Economics 43, 127-40.
Steenge, A. E. 1997. On background principles for environmental policy: "Polluter Pays", "User Pays" or "Victim Pays"?, in Public Priority Setting: Rules and Costs. P. B. Boorsma, K. Aarts and A. E. Steenge eds. Dordrecht, Netherlands: Kluwer Academic Publishers, 121-37.
Steenge, A. E. 2004. The Coase Theorem, economic lineage, and the small numbers problem, in Ökonomische und rechtliche Analyse von Institutionen. A. Prinz, A. E. Steenge and J. Schmidt eds. Münster, Germany: Lit Verlag, 47-84.
27
Lenzen, Murray, Sack and Wiedmann – Shared responsibility
Subak, S. 1995. Methane embodied in the international trade of commodities. Global Environmental Change 5(5), 433-46.
Szyrmer, J. M. 1992. Input-output coefficients and multipliers from a total-flow perspective. Environment and Planning A 24, 921-37.
Task Force on National Greenhouse Gas Inventories 1996. Revised 1996 IPCC Guidelines for National Greenhouse Gas Inventories - Reporting Instructions (Volume 1).http://www.ipcc-nggip.iges.or.jp/public/gl/invs4.htm. Institute for Global Environmental Strategies, Intergovernmental Panel on Climate Change - IPCC National Greenhouse Gas Inventories Programme: Tokyo, Japan.
Toyota Motor Corporation 2003. 2003 Environmental Report.http://environment.toyota.com.au/TWP/Upload/Media/144.pdf. Toyota Motor Corporation: Port Melbourne, Victoria, Australia.
Treloar, G. 1997. Extracting embodied energy paths from input-output tables: towards an input-output-based hybrid energy analysis method. Economic Systems Research 9(4), 375-91.
Vachon, S. and R. D. Klassen 2006. Green project partnership in the supply chain: the case of the package printing industry. Journal of Cleaner Production 14, 661-71.
Weber, C. 1998. Zerlegung kumulierter Energieaufwendungen als Instrument der umweltorientierten Verflechtungsanalyse. Jahrbücher für Nationalökonomie und Statistik 217(3), 273-91.
Welford, R. 1996. Corporate Environmental Management: Systems and Strategies. Earthscan Publications Ltd: London, UK.
Wier, M., M. Lenzen, J. Munksgaard, and S. Smed 2001. Environmental effects of household consumption pattern and lifestyle. Economic Systems Research 13(3), 259-74.
Wolvén, L.-E. 1991. Life-styles and energy consumption. Energy 16(6), 959-63. World Business Council on Sustainable Development and World Resources Institute 2001. The
Greenhouse Gas Protocol.http://www.ghgprotocol.org/standard/ghg.pdf, http://www.ghgprotocol.org/. World Business Council on Sustainable Development: Conches-Geneva, Switzerland.
Wyckoff, A. W. and J. M. Roop 1994. The embodiment of carbon in imports of manufactured products - Implications for international agreements on greenhouse gas emissions. Energy Policy 22(3), 187-94.
28
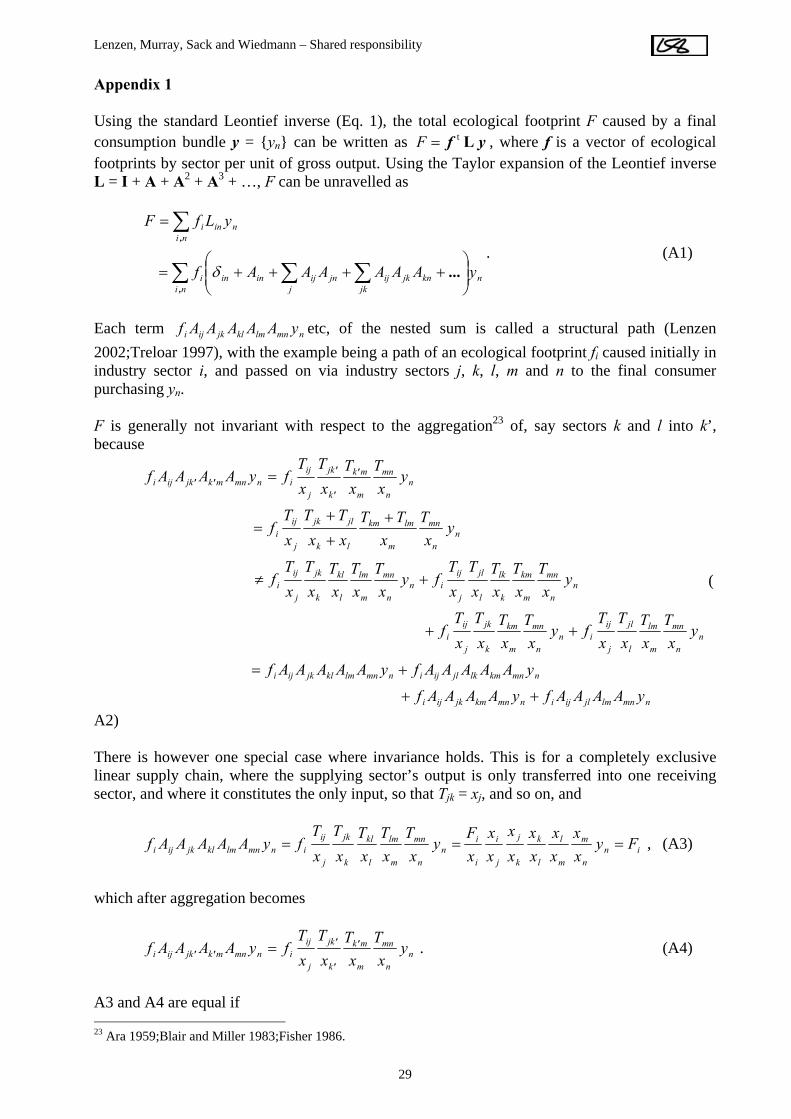
Lenzen, Murray, Sack and Wiedmann – Shared responsibility
Appendix 1 Using the standard Leontief inverse (Eq. 1), the total ecological footprint F caused by a final consumption bundle y = {yn} can be written as , where f is a vector of ecological footprints by sector per unit of gross output. Using the Taylor expansion of the Leontief inverse L = I + A + A
yf Lt=F
2 + A3 + …, F can be unravelled as
. (A1) ∑ ∑∑
∑
⎟⎟⎠
⎞⎜⎜⎝
⎛++++=
=
nin
jkknjkij
jjnijinini
ninini
yAAAAAAf
yLfF
,
,
...δ
Each term etc, of the nested sum is called a structural path (Lenzen 2002;Treloar 1997), with the example being a path of an ecological footprint f
nmnlmkljkiji yAAAAAfi caused initially in
industry sector i, and passed on via industry sectors j, k, l, m and n to the final consumer purchasing yn. F is generally not invariant with respect to the aggregation23 of, say sectors k and l into k’, because
nmnlmjlijinmnkmjkiji
nmnkmlkjlijinmnlmkljkiji
nn
mn
m
lm
l
jl
j
ijin
n
mn
m
km
k
jk
j
iji
nn
mn
m
km
k
lk
l
jl
j
ijin
n
mn
m
lm
l
kl
k
jk
j
iji
nn
mn
m
lmkm
lk
jljk
j
iji
nn
mn
m
mk
k
jk
j
ijinmnmkjkiji
yAAAAfyAAAAf
yAAAAAfyAAAAAf
yx
TxT
xT
xT
fyx
TxT
xT
xT
f
yx
TxT
xT
xT
xT
fyx
TxT
xT
xT
xT
f
yx
Tx
TTxxTT
xT
f
yx
Tx
TxT
xT
fyAAAAf
++
+=
++
+≠
++
+=
= '
'
'''
(
A2) There is however one special case where invariance holds. This is for a completely exclusive linear supply chain, where the supplying sector’s output is only transferred into one receiving sector, and where it constitutes the only input, so that Tjk = xj, and so on, and
inn
m
m
l
l
k
k
j
j
i
i
in
n
mn
m
lm
l
kl
k
jk
j
ijinmnlmkljkiji Fy
xx
xx
xx
xx
xx
xF
yx
TxT
xT
xT
xT
fyAAAAAf === , (A3)
which after aggregation becomes
nn
mn
m
mk
k
jk
j
ijinmnmkjkiji y
xT
xT
xT
xT
fyAAAAf '
'
''' = . (A4)
A3 and A4 are equal if 23 Ara 1959;Blair and Miller 1983;Fisher 1986.
29
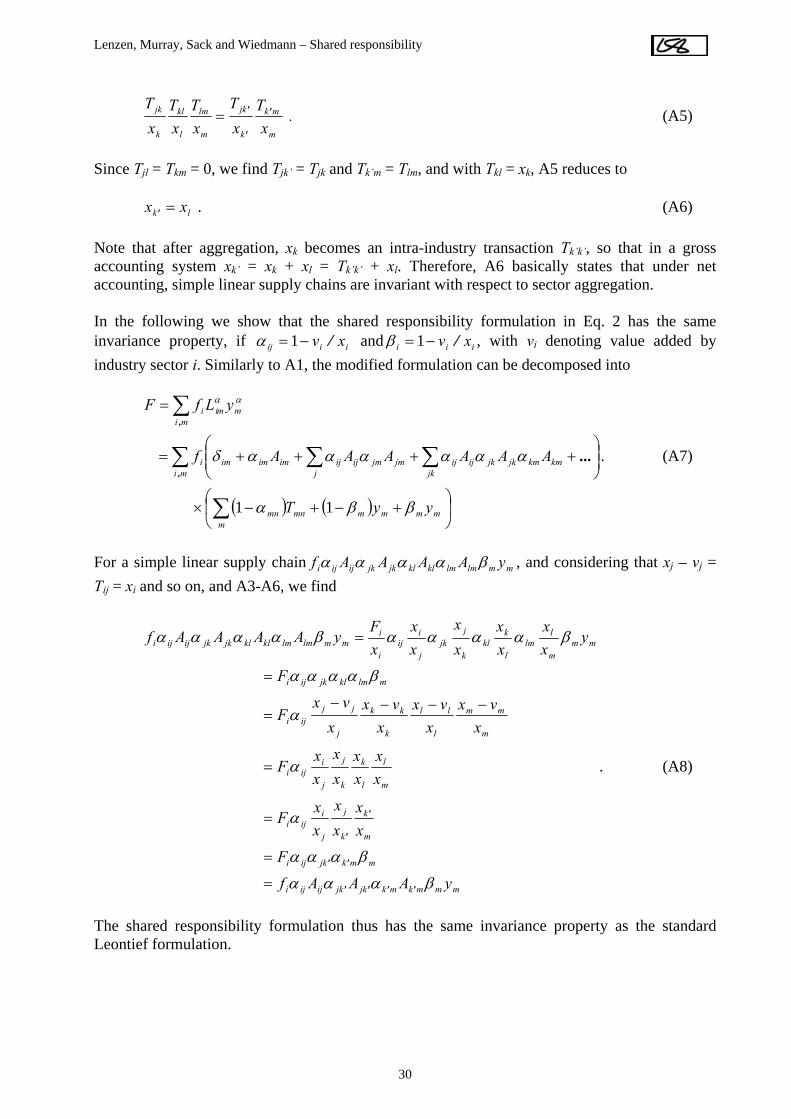
Lenzen, Murray, Sack and Wiedmann – Shared responsibility
m
mk
k
jk
m
lm
l
kl
k
jk
xT
xT
xT
xT
xT '
'
'= . (A5)
Since Tjl = Tkm = 0, we find Tjk’ = Tjk and Tk’m = Tlm, and with Tkl = xk, A5 reduces to . (A6) lk xx ='
Note that after aggregation, xk becomes an intra-industry transaction Tk’k’, so that in a gross accounting system xk’ = xk + xl = Tk’k’ + xl. Therefore, A6 basically states that under net accounting, simple linear supply chains are invariant with respect to sector aggregation. In the following we show that the shared responsibility formulation in Eq. 2 has the same invariance property, if iiij xv /−= 1α and iii xv /−= 1β , with vi denoting value added by industry sector i. Similarly to A1, the modified formulation can be decomposed into
. (A7)
( ) ( ) ⎟⎠
⎞⎜⎝
⎛+−+−×
⎟⎟⎠
⎞⎜⎜⎝
⎛++++=
=
∑
∑ ∑∑
∑
mmmmmmnmn
mi jkkmkmjkjkijij
jjmjmijijimimimi
mimmii
yyT
AAAAAAf
yLfF
ββα
ααααααδ
αα
11
,
,
...
For a simple linear supply chain mmlmlmklkljkjkijiji yAAAAf βαααα , and considering that xj – vj = Tij = xi and so on, and A3-A6, we find
mmmkmkjkjkijiji
mmkjkiji
m
k
k
j
j
iiji
m
l
l
k
k
j
j
iiji
m
mm
l
ll
k
kk
j
jjiji
mlmkljkiji
mmm
llm
l
kkl
k
jjk
j
iij
i
immlmlmklkljkjkijiji
yAAAf
F
xx
xx
xx
F
xx
xx
xx
xx
F
xvx
xvx
xvx
xvx
F
F
yxx
xx
xx
xx
xF
yAAAAf
βααα
βααα
α
α
α
βαααα
βααααβαααα
''''
''
'
'
=
=
=
=
−−−−=
=
=
. (A8)
The shared responsibility formulation thus has the same invariance property as the standard Leontief formulation.
30
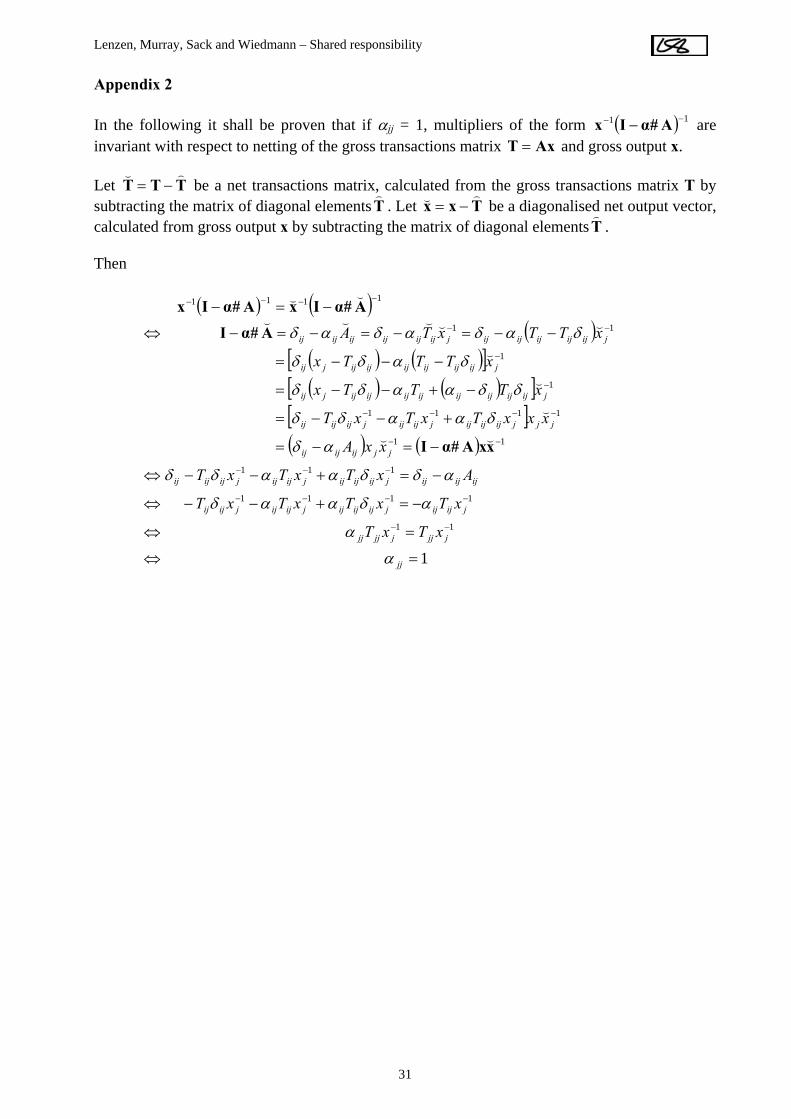
Lenzen, Murray, Sack and Wiedmann – Shared responsibility
Appendix 2 In the following it shall be proven that if αjj = 1, multipliers of the form are invariant with respect to netting of the gross transactions matrix
( ) 11 −− − AαIx #AxT = and gross output x.
Let TTT
)(−= be a net transactions matrix, calculated from the gross transactions matrix T by
subtracting the matrix of diagonal elements T)
. Let Txx)( −= be a diagonalised net output vector,
calculated from gross output x by subtracting the matrix of diagonal elements T)
. Then
( ) ( )( )
( ) ( )[ ]( ) ( )[ ]
[ ]( ) ( )
1
11
1111
111
11
1111
1
1
11
1111
=⇔
=⇔
−=+−−⇔
−=+−−⇔
−=−=
+−−=
−+−−=
−−−=
−−=−=−=−⇔
−=−
−−
−−−−
−−−
−−
−−−−
−
−
−−
−−−−
jj
jjjjjjjj
jijijjijijijjijijjijij
ijijijjijijijjijijjijijij
jjijijij
jjjijijijjijijjijijij
jijijijijijijijijjij
jijijijijijijjij
jijijijijijjijijijijijij
xTxT
xTxTxTxT
AxTxTxT
xxA
xxxTxTxT
xTTTx
xTTTx
xTTxTA
α
α
αδααδ
αδδααδδ
αδ
δααδδ
δδααδδ
δαδδ
δαδαδαδ
xxAαI
AαI
AαIxAαIx
((
(
(
(
(((((
((
#
#
##
31
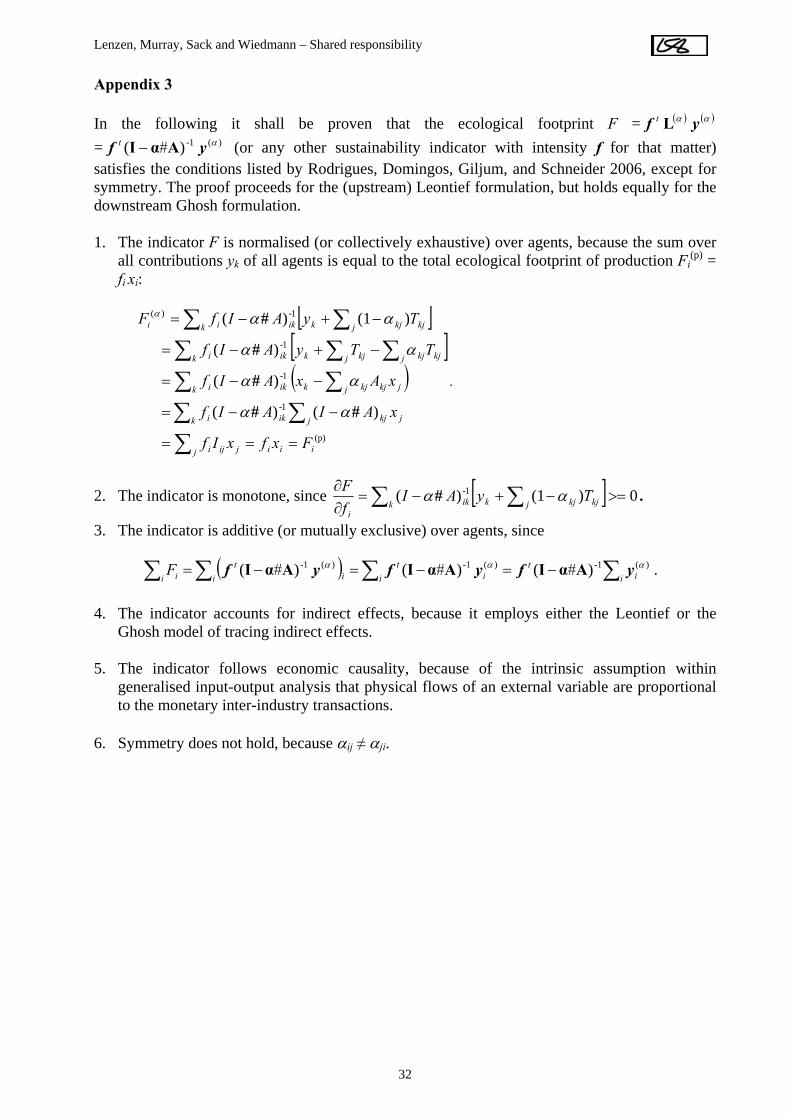
Lenzen, Murray, Sack and Wiedmann – Shared responsibility
Appendix 3 In the following it shall be proven that the ecological footprint F = ( ) ( )αα yf Lt = (or any other sustainability indicator with intensity f for that matter) satisfies the conditions listed by Rodrigues, Domingos, Giljum, and Schneider 2006, except for symmetry. The proof proceeds for the (upstream) Leontief formulation, but holds equally for the downstream Ghosh formulation.
)(-1)( αyf AαI #t −
1. The indicator F is normalised (or collectively exhaustive) over agents, because the sum over
all contributions yk of all agents is equal to the total ecological footprint of production Fi(p) =
fi xi:
[ ][ ]( )
(p)
1-
1-
1-
1-)(
)()(
)(
)(
)(1)(
iiij jiji
k j jkjiki
k j jkjkjkiki
k j kjkjj kjkiki
k j kjkjkikii
FxfxIf
xAIAIf
xAxAIf
TTyAIf
TyAIfF
===
−−=
−−=
−+−=
−+−=
∑∑ ∑∑ ∑∑ ∑∑∑ ∑
##
#
#
#
αα
αα
αα
ααα
.
2. The indicator is monotone, since [ ] .# 0)(1)( 1- >=−+−=∂∂ ∑ ∑k j kjkjkik
i
TyAIfF αα
3. The indicator is additive (or mutually exclusive) over agents, since ( ) ∑∑∑∑ −=−=−=
i it
i it
i it
i i ###F )(-1)(-1)(-1 )()()( ααα yfyfyf AαIAαIAαI . 4. The indicator accounts for indirect effects, because it employs either the Leontief or the
Ghosh model of tracing indirect effects. 5. The indicator follows economic causality, because of the intrinsic assumption within
generalised input-output analysis that physical flows of an external variable are proportional to the monetary inter-industry transactions.
6. Symmetry does not hold, because αij ≠ αji.
32


