SHAREHOLDER LETTER A message from our Chief Executive Officer We made more good progress last year. We grew consumer loan unit volumes by 16.8% and increased our profitability, as measured by adjusted net income per share, by 27.7%. Most important, we continued to improve our product offering, and began to see favorable results from our efforts to promote optimal performance by our team members. While there are many other ways we can improve what we do, we believe we are well positioned to take advantage of the considerable market opportunity before us. Moreover, that opportunity is likely to grow even larger going forward due to changing economic and competitive conditions. Historically, our industry has gone through cycles of competition. When I joined Credit Acceptance in 1991, there was little competition and we had almost unlimited opportunity to write new business at very high levels of profitability. But that environment changed rapidly and by 1995, we were contending with so much competition that we were unable to write profitable business at all. Since then, we have gone through two more cycles of competition, each one a function of the availability of capital. We have successfully navigated both, having greatly improved our ability to write profitable business regardless of market conditions. The second cycle began five years ago. The competitive environment became increasingly difficult as capital to fund our competitors became easy to find. This cycle began to change in late 2007 as our competitors started to experience higher than expected credit losses and disappointing financial results. That this happened is not surprising. Our competitors write business at very low levels of profitability and use very high levels of debt. They inevitably encounter higher than expected losses and, since they have little margin for error, they are forced to significantly reduce origination levels or, worse, to liquidate. The poor performance of our competitors, and the even more significant issues in the mortgage industry, have caused capital for our industry to be in short supply. Lenders, having experienced huge losses in their mortgage investments, are justifiably cautious. As of the date of this letter, the impact of the changing environment on our company is not clear. We will almost certainly have less competition in 2008, and will likely have an opportunity to grow our business at high returns on capital. At the same time, we also are being affected by the limited availability of capital. We are working diligently to obtain the funds we need to grow. To date, we have renewed our warehouse line of credit ($325.0 million through February 11, 2009) and have increased and extended our bank line of credit (to $153.5 million and June 22, 2010 provided net income exceeds $5.0 million in the first quarter of 2008). Historically, we have used term asset-backed securitizations to supply additional debt capital. As of the date of this letter, the market for such securitizations is virtually inactive for less than prime-quality assets, and the prospects for accessing this market in 2008 are uncertain. Therefore, we are working on other financing alternatives and hope to report progress in the weeks and months that follow the distribution of this letter.
Transcript
SHAREHOLDER LETTER A message from our Chief Executive Officer We made more good progress last year. We grew consumer loan unit volumes by 16.8% and increased our profitability, as measured by adjusted net income per share, by 27.7%. Most important, we continued to improve our product offering, and began to see favorable results from our efforts to promote optimal performance by our team members. While there are many other ways we can improve what we do, we believe we are well positioned to take advantage of the considerable market opportunity before us. Moreover, that opportunity is likely to grow even larger going forward due to changing economic and competitive conditions. Historically, our industry has gone through cycles of competition. When I joined Credit Acceptance in 1991, there was little competition and we had almost unlimited opportunity to write new business at very high levels of profitability. But that environment changed rapidly and by 1995, we were contending with so much competition that we were unable to write profitable business at all. Since then, we have gone through two more cycles of competition, each one a function of the availability of capital. We have successfully navigated both, having greatly improved our ability to write profitable business regardless of market conditions. The second cycle began five years ago. The competitive environment became increasingly difficult as capital to fund our competitors became easy to find. This cycle began to change in late 2007 as our competitors started to experience higher than expected credit losses and disappointing financial results. That this happened is not surprising. Our competitors write business at very low levels of profitability and use very high levels of debt. They inevitably encounter higher than expected losses and, since they have little margin for error, they are forced to significantly reduce origination levels or, worse, to liquidate. The poor performance of our competitors, and the even more significant issues in the mortgage industry, have caused capital for our industry to be in short supply. Lenders, having experienced huge losses in their mortgage investments, are justifiably cautious. As of the date of this letter, the impact of the changing environment on our company is not clear. We will almost certainly have less competition in 2008, and will likely have an opportunity to grow our business at high returns on capital. At the same time, we also are being affected by the limited availability of capital. We are working diligently to obtain the funds we need to grow. To date, we have renewed our warehouse line of credit ($325.0 million through February 11, 2009) and have increased and extended our bank line of credit (to $153.5 million and June 22, 2010 provided net income exceeds $5.0 million in the first quarter of 2008). Historically, we have used term asset-backed securitizations to supply additional debt capital. As of the date of this letter, the market for such securitizations is virtually inactive for less than prime-quality assets, and the prospects for accessing this market in 2008 are uncertain. Therefore, we are working on other financing alternatives and hope to report progress in the weeks and months that follow the distribution of this letter.
Although the underlying consumer loans we originate are considered high-risk, we offer lenders a very low-risk investment opportunity. Based on our debt outstanding at year-end, in order for our lenders to receive less than 100% of their expected principal and interest payments, our actual loan collection rate would need to be less than 50% of the amount we projected it to be at the time of origination. Over the last seven years, our worst performance against our original forecasted collection rate has been on loans originated in 2001, for which the current forecasted collection rate is now 96.3% of the original forecast at loan inception. The loans we originated in 2003, when unemployment rates were higher than they are today, have a current forecasted collection rate of 103.6% of our original forecast. Although the economic environment we face going forward may reduce collection rates below current expectations, our lenders benefit from an extremely large margin of safety. Simply put, we cannot envision a realistic scenario where our lenders would not receive 100% of their expected principal and interest payments. Although our capital position is not as clear as we would like, shareholders can feel comfortable that our loans continue to perform. Additionally, our record of writing appropriately profitable business and using financial leverage modestly should put us in position to find the capital we need to take advantage of the opportunity ahead. EARNINGS The table below summarizes our GAAP-based earnings results for the period 2001–2007: GAAP net income Year-to-year per share change 2001 ..................................................................................... $0.57 2002 ..................................................................................... $0.69 21.1% 2003 ..................................................................................... $0.57 -17.4% 2004 ..................................................................................... $1.40 145.6% 2005 ..................................................................................... $1.85 32.1% 2006 ..................................................................................... $1.66 -10.3% 2007 ..................................................................................... $1.76 6.0% Compound annual growth rate 2001-2007 .......................... 20.7% GAAP-based net income per share (diluted) increased 6.0% in 2007. Since 2001, GAAP-based earnings per share have grown at an annual compounded rate of 20.7%.
ADJUSTED EARNINGS Our 2007 year-end earnings release included two adjustments to our GAAP financial results that are important for shareholders to understand: (1) a floating yield adjustment and (2) a license fee yield adjustment. Floating yield adjustment The purpose of this adjustment is to modify the calculation of our GAAP-based finance charge revenue so that both favorable and unfavorable changes in expected cash flows from loans receivable are treated consistently. To make the adjustment understandable, we must first explain how GAAP requires us to account for finance charge revenue, which is our primary revenue source. Credit Acceptance is an indirect lender, which means that the loans are originated by an automobile dealer and immediately assigned to us. We compensate the automobile dealer for the loan through two types of payments. The first payment is made at the time of origination. The remaining compensation is paid over time based on the performance of the loan. The amount we pay at the time of origination is called an advance; the portion paid over time is called dealer holdback. Finance charge revenue equals the cash we collect from a loan (i.e., repayments by the consumer), less the amounts we pay to the dealer-partner (advance + dealer holdback). In other words, finance charge revenue equals the cash inflows from the loan less the cash outflows to acquire the loan. This amount, plus a modest amount of revenue from other sources, less our operating expenses, interest and taxes, is the sum that will ultimately be paid to shareholders or reinvested in new assets. Under our current GAAP accounting methodology, finance charge revenue is recognized on a level-yield basis. That is, the amount of loan revenue recognized in a given period, divided by the loan asset, is a constant percentage. Recognizing loan revenue on a level-yield basis is reasonable, conforms to industry practice, and matches the economics of the business. Where GAAP diverges from economic reality is in the way it deals with changes in expected cash flows. The expected cash flows from a dealer loan portfolio are not known with certainty. Instead, they are estimated. From an economic standpoint, if forecasted cash flows from one dealer loan increase by $1,000 and forecasted cash flows from another dealer loan decrease by $1,000, no change in our shareholders’ economic position has occurred. GAAP, however, requires the Company to record the $1,000 decrease as an expense in the current period, and to record the $1,000 favorable change as income over the remaining life of the loan. Shareholders relying on our GAAP financial statements would therefore see earnings which understate our economic performance in the current period, and earnings which overstate our economic performance in future periods. The floating yield adjustment reverses the distortion caused by GAAP by treating both favorable and unfavorable changes in expected cash flows consistently. In other words, both types of changes are treated as adjustments to our loan yield.
License fee yield adjustment The purpose of this adjustment is to make the results for license fee revenue comparable across time periods. In 2001, the Company had begun charging dealer-partners a monthly licensing fee for access to the Company’s Internet-based Credit Approval Processing System, also known as CAPS. In accordance with GAAP, this fee was being recorded as revenue in the month the fee was charged. However, based on feedback from field sales personnel and dealer-partners, the Company concluded that structuring the fee in this way was contributing to increased dealer-partner attrition. To address the problem, the Company changed its method for collecting these fees. As of January 1, 2007, the Company began to take the license fee out of future dealer holdback payments instead of collecting it in the current period. Although the change was implemented to reduce attrition, it had two other effects: (1) it reduced per unit profitability, since cash that previously was collected immediately is now collected over time, and (2) it required us to change our GAAP accounting method for license fees. Starting January 1, 2007, the Company began to record license fees for GAAP purposes as an adjustment to the loan yield, effectively recognizing them over the term of the dealer loan. This new GAAP treatment is more consistent with the cash economics. To allow for proper comparisons in the future, the license fee adjustment applies this new GAAP treatment to all pre-2007 periods. The following table shows earnings per share for 2001–2007 after the two adjustments: GAAP net income Floating yield License fee Adjusted net income Year-to-year per share adjustment per share adjustment per share per share change 2001 ....... $0.57 $0.03 $(0.03) $0.57 2002 ....... $0.69 $0.06 $(0.05) $0.70 22.8% 2003 ....... $0.57 $0.03 $(0.05) $0.55 -21.4% 2004 ....... $1.40 $0.00 $(0.03) $1.37 149.1% 2005 ....... $1.85 $(0.06) $(0.05) $1.74 27.0% 2006 ....... $1.66 $0.01 $(0.08) $1.59 -8.6% 2007 ....... $1.76 $0.11 $0.16 $2.03 27.7% Compound annual growth rate 2001-2007 23.6% Footnote 1: Adjusted net income per share published in the Company’s year-end earnings release included additional adjustments related to taxes, non-recurring expenses and discontinued operations that are excluded above for simplicity. Footnote 2: The license fee adjustment will become less significant in future periods. The license fee adjustment is projected to be $0.07 per share in 2008, $0.02 per share in 2009, $0.01 per share in 2010 and will be immaterial starting in 2011.
In 2007, adjusted net income per share (diluted) increased 27.7%. Over the full seven-year period, adjusted net income increased at an annual compounded rate of 23.6%. Included in adjusted net income are after-tax expenses of $0.4 million in 2007 and $7.0 million in 2006 related to the settlement of an 11-year-old lawsuit in Missouri. Excluding the litigation expense, adjusted net income per share increased 14.2% in 2007 and grew at an annual compounded rate of 23.7% over the seven years. As the table shows, over the full seven-year period the two adjustments have a relatively insignificant impact on our historical results. However, for any single year (such as 2007) the impact of the two adjustments can be significant.
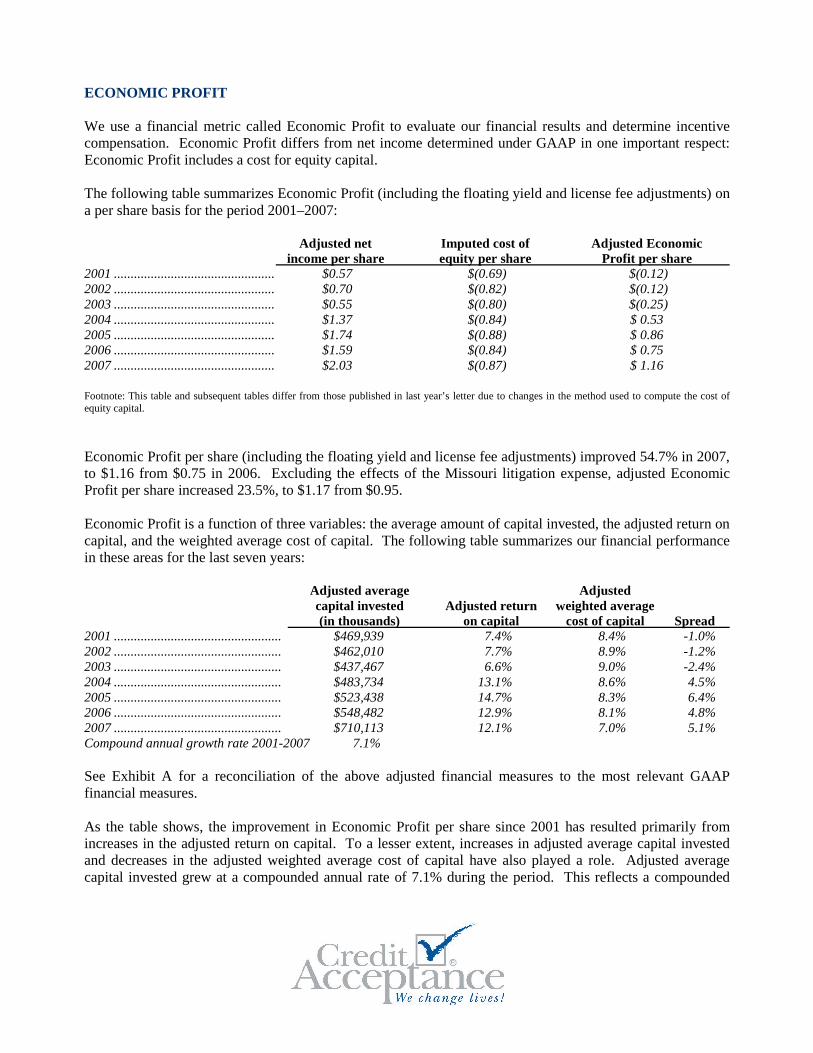
ECONOMIC PROFIT We use a financial metric called Economic Profit to evaluate our financial results and determine incentive compensation. Economic Profit differs from net income determined under GAAP in one important respect: Economic Profit includes a cost for equity capital. The following table summarizes Economic Profit (including the floating yield and license fee adjustments) on a per share basis for the period 2001–2007: Adjusted net Imputed cost of Adjusted Economic income per share equity per share Profit per share 2001 ................................................ $0.57 $(0.69) $(0.12) 2002 ................................................ $0.70 $(0.82) $(0.12) 2003 ................................................ $0.55 $(0.80) $(0.25) 2004 ................................................ $1.37 $(0.84) $ 0.53 2005 ................................................ $1.74 $(0.88) $ 0.86 2006 ................................................ $1.59 $(0.84) $ 0.75 2007 ................................................ $2.03 $(0.87) $ 1.16 Footnote: This table and subsequent tables differ from those published in last year’s letter due to changes in the method used to compute the cost of equity capital.
Economic Profit per share (including the floating yield and license fee adjustments) improved 54.7% in 2007, to $1.16 from $0.75 in 2006. Excluding the effects of the Missouri litigation expense, adjusted Economic Profit per share increased 23.5%, to $1.17 from $0.95. Economic Profit is a function of three variables: the average amount of capital invested, the adjusted return on capital, and the weighted average cost of capital. The following table summarizes our financial performance in these areas for the last seven years: Adjusted average Adjusted capital invested Adjusted return weighted average (in thousands) on capital cost of capital Spread 2001 .................................................. $469,939 7.4% 8.4% -1.0% 2002 .................................................. $462,010 7.7% 8.9% -1.2% 2003 .................................................. $437,467 6.6% 9.0% -2.4% 2004 .................................................. $483,734 13.1% 8.6% 4.5% 2005 .................................................. $523,438 14.7% 8.3% 6.4% 2006 .................................................. $548,482 12.9% 8.1% 4.8% 2007 .................................................. $710,113 12.1% 7.0% 5.1% Compound annual growth rate 2001-2007 7.1% See Exhibit A for a reconciliation of the above adjusted financial measures to the most relevant GAAP financial measures. As the table shows, the improvement in Economic Profit per share since 2001 has resulted primarily from increases in the adjusted return on capital. To a lesser extent, increases in adjusted average capital invested and decreases in the adjusted weighted average cost of capital have also played a role. Adjusted average capital invested grew at a compounded annual rate of 7.1% during the period. This reflects a compounded
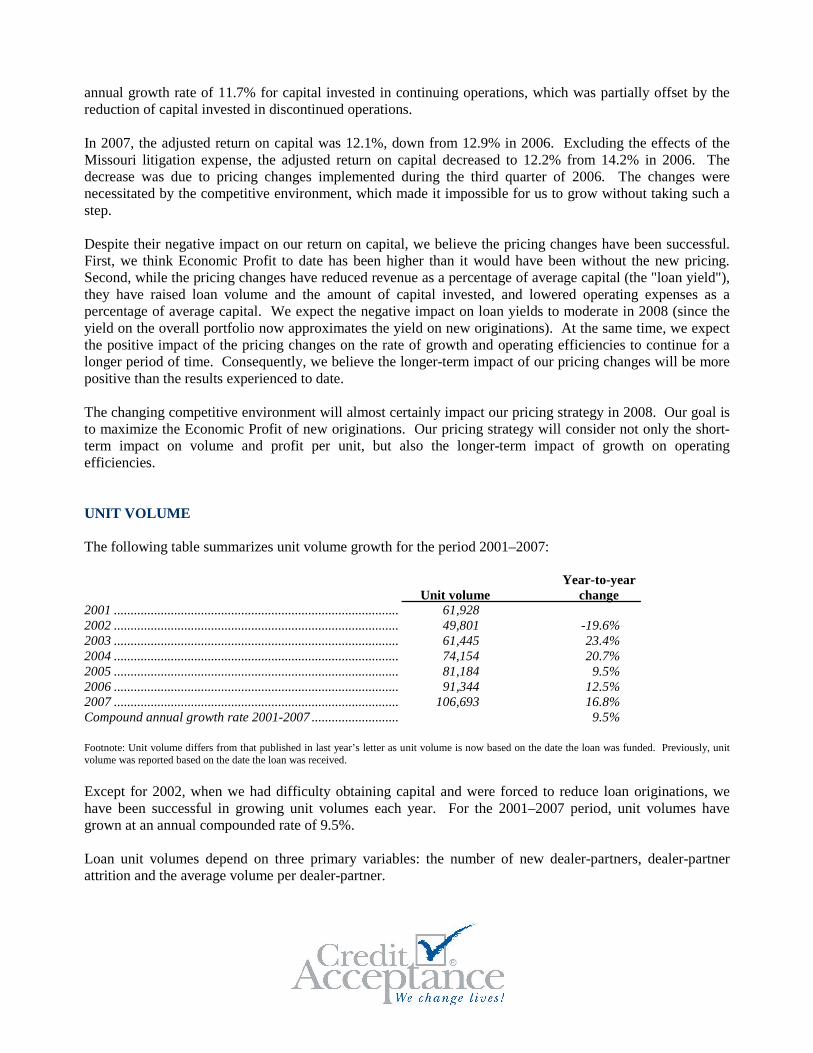
annual growth rate of 11.7% for capital invested in continuing operations, which was partially offset by the reduction of capital invested in discontinued operations. In 2007, the adjusted return on capital was 12.1%, down from 12.9% in 2006. Excluding the effects of the Missouri litigation expense, the adjusted return on capital decreased to 12.2% from 14.2% in 2006. The decrease was due to pricing changes implemented during the third quarter of 2006. The changes were necessitated by the competitive environment, which made it impossible for us to grow without taking such a step. Despite their negative impact on our return on capital, we believe the pricing changes have been successful. First, we think Economic Profit to date has been higher than it would have been without the new pricing. Second, while the pricing changes have reduced revenue as a percentage of average capital (the "loan yield"), they have raised loan volume and the amount of capital invested, and lowered operating expenses as a percentage of average capital. We expect the negative impact on loan yields to moderate in 2008 (since the yield on the overall portfolio now approximates the yield on new originations). At the same time, we expect the positive impact of the pricing changes on the rate of growth and operating efficiencies to continue for a longer period of time. Consequently, we believe the longer-term impact of our pricing changes will be more positive than the results experienced to date. The changing competitive environment will almost certainly impact our pricing strategy in 2008. Our goal is to maximize the Economic Profit of new originations. Our pricing strategy will consider not only the short-term impact on volume and profit per unit, but also the longer-term impact of growth on operating efficiencies. UNIT VOLUME The following table summarizes unit volume growth for the period 2001–2007: Year-to-year Unit volume change 2001 ..................................................................................... 61,928 2002 ..................................................................................... 49,801 -19.6% 2003 ..................................................................................... 61,445 23.4% 2004 ..................................................................................... 74,154 20.7% 2005 ..................................................................................... 81,184 9.5% 2006 ..................................................................................... 91,344 12.5% 2007 ..................................................................................... 106,693 16.8% Compound annual growth rate 2001-2007 .......................... 9.5% Footnote: Unit volume differs from that published in last year’s letter as unit volume is now based on the date the loan was funded. Previously, unit volume was reported based on the date the loan was received.
Except for 2002, when we had difficulty obtaining capital and were forced to reduce loan originations, we have been successful in growing unit volumes each year. For the 2001–2007 period, unit volumes have grown at an annual compounded rate of 9.5%. Loan unit volumes depend on three primary variables: the number of new dealer-partners, dealer-partner attrition and the average volume per dealer-partner.
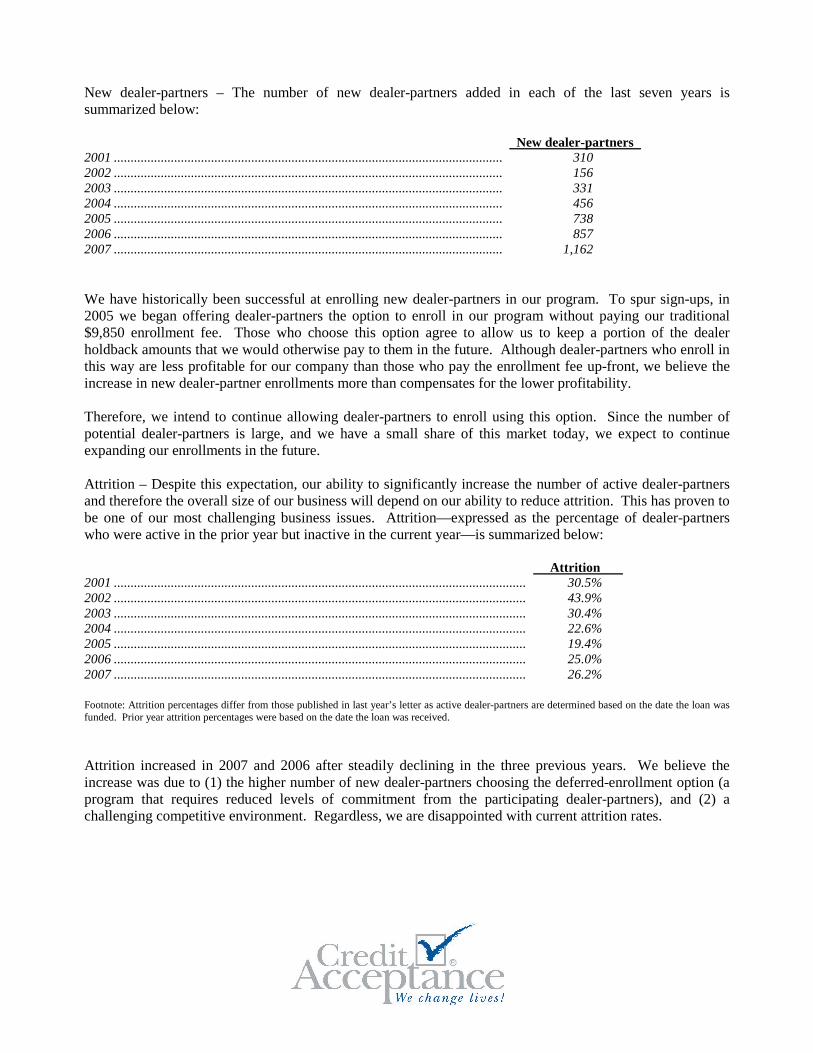
New dealer-partners – The number of new dealer-partners added in each of the last seven years is summarized below: New dealer-partners 2001 .................................................................................................................... 310 2002 .................................................................................................................... 156 2003 .................................................................................................................... 331 2004 .................................................................................................................... 456 2005 .................................................................................................................... 738 2006 .................................................................................................................... 857 2007 .................................................................................................................... 1,162 We have historically been successful at enrolling new dealer-partners in our program. To spur sign-ups, in 2005 we began offering dealer-partners the option to enroll in our program without paying our traditional $9,850 enrollment fee. Those who choose this option agree to allow us to keep a portion of the dealer holdback amounts that we would otherwise pay to them in the future. Although dealer-partners who enroll in this way are less profitable for our company than those who pay the enrollment fee up-front, we believe the increase in new dealer-partner enrollments more than compensates for the lower profitability. Therefore, we intend to continue allowing dealer-partners to enroll using this option. Since the number of potential dealer-partners is large, and we have a small share of this market today, we expect to continue expanding our enrollments in the future. Attrition – Despite this expectation, our ability to significantly increase the number of active dealer-partners and therefore the overall size of our business will depend on our ability to reduce attrition. This has proven to be one of our most challenging business issues. Attrition—expressed as the percentage of dealer-partners who were active in the prior year but inactive in the current year—is summarized below: Attrition 2001 ........................................................................................................................... 30.5% 2002 ........................................................................................................................... 43.9% 2003 ........................................................................................................................... 30.4% 2004 ........................................................................................................................... 22.6% 2005 ........................................................................................................................... 19.4% 2006 ........................................................................................................................... 25.0% 2007 ........................................................................................................................... 26.2% Footnote: Attrition percentages differ from those published in last year’s letter as active dealer-partners are determined based on the date the loan was funded. Prior year attrition percentages were based on the date the loan was received.
Attrition increased in 2007 and 2006 after steadily declining in the three previous years. We believe the increase was due to (1) the higher number of new dealer-partners choosing the deferred-enrollment option (a program that requires reduced levels of commitment from the participating dealer-partners), and (2) a challenging competitive environment. Regardless, we are disappointed with current attrition rates.
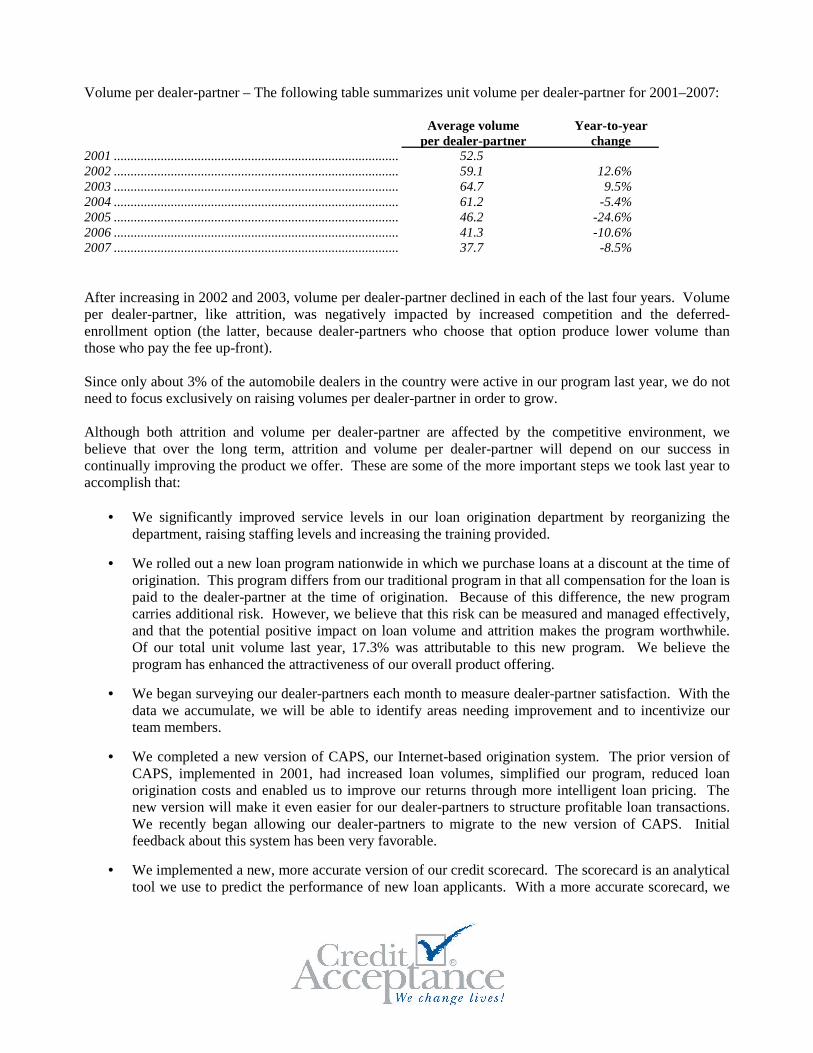
Volume per dealer-partner – The following table summarizes unit volume per dealer-partner for 2001–2007: Average volume Year-to-year per dealer-partner change 2001 ..................................................................................... 52.5 2002 ..................................................................................... 59.1 12.6% 2003 ..................................................................................... 64.7 9.5% 2004 ..................................................................................... 61.2 -5.4% 2005 ..................................................................................... 46.2 -24.6% 2006 ..................................................................................... 41.3 -10.6% 2007 ..................................................................................... 37.7 -8.5% After increasing in 2002 and 2003, volume per dealer-partner declined in each of the last four years. Volume per dealer-partner, like attrition, was negatively impacted by increased competition and the deferred-enrollment option (the latter, because dealer-partners who choose that option produce lower volume than those who pay the fee up-front). Since only about 3% of the automobile dealers in the country were active in our program last year, we do not need to focus exclusively on raising volumes per dealer-partner in order to grow. Although both attrition and volume per dealer-partner are affected by the competitive environment, we believe that over the long term, attrition and volume per dealer-partner will depend on our success in continually improving the product we offer. These are some of the more important steps we took last year to accomplish that:
• We significantly improved service levels in our loan origination department by reorganizing the department, raising staffing levels and increasing the training provided.
• We rolled out a new loan program nationwide in which we purchase loans at a discount at the time of origination. This program differs from our traditional program in that all compensation for the loan is paid to the dealer-partner at the time of origination. Because of this difference, the new program carries additional risk. However, we believe that this risk can be measured and managed effectively, and that the potential positive impact on loan volume and attrition makes the program worthwhile. Of our total unit volume last year, 17.3% was attributable to this new program. We believe the program has enhanced the attractiveness of our overall product offering.
• We began surveying our dealer-partners each month to measure dealer-partner satisfaction. With the data we accumulate, we will be able to identify areas needing improvement and to incentivize our team members.
• We completed a new version of CAPS, our Internet-based origination system. The prior version of CAPS, implemented in 2001, had increased loan volumes, simplified our program, reduced loan origination costs and enabled us to improve our returns through more intelligent loan pricing. The new version will make it even easier for our dealer-partners to structure profitable loan transactions. We recently began allowing our dealer-partners to migrate to the new version of CAPS. Initial feedback about this system has been very favorable.
• We implemented a new, more accurate version of our credit scorecard. The scorecard is an analytical tool we use to predict the performance of new loan applicants. With a more accurate scorecard, we
are able to establish the correct pricing for a greater percentage of our loan applications. By reducing loan mispricing, we are able to increase our advance rates without reducing our overall return on capital.
• We continued to focus on something we call organizational health. Since the quality of our product offering depends on our team members, we have been emphasizing training, setting of clear expectations, incentive plans and communication. Results from our annual survey of team members indicate that this effort has succeeded in creating an environment where team members can do their best work.
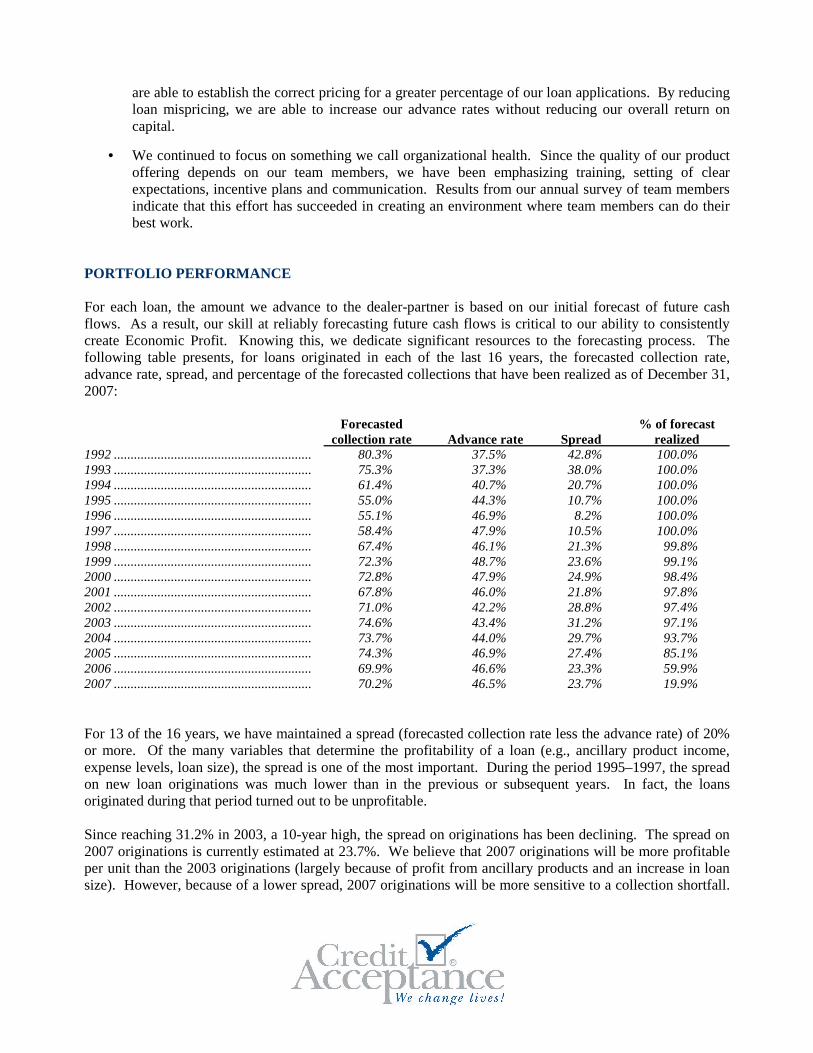
PORTFOLIO PERFORMANCE For each loan, the amount we advance to the dealer-partner is based on our initial forecast of future cash flows. As a result, our skill at reliably forecasting future cash flows is critical to our ability to consistently create Economic Profit. Knowing this, we dedicate significant resources to the forecasting process. The following table presents, for loans originated in each of the last 16 years, the forecasted collection rate, advance rate, spread, and percentage of the forecasted collections that have been realized as of December 31, 2007: Forecasted % of forecast collection rate Advance rate Spread realized 1992 ........................................................... 80.3% 37.5% 42.8% 100.0% 1993 ........................................................... 75.3% 37.3% 38.0% 100.0% 1994 ........................................................... 61.4% 40.7% 20.7% 100.0% 1995 ........................................................... 55.0% 44.3% 10.7% 100.0% 1996 ........................................................... 55.1% 46.9% 8.2% 100.0% 1997 ........................................................... 58.4% 47.9% 10.5% 100.0% 1998 ........................................................... 67.4% 46.1% 21.3% 99.8% 1999 ........................................................... 72.3% 48.7% 23.6% 99.1% 2000 ........................................................... 72.8% 47.9% 24.9% 98.4% 2001 ........................................................... 67.8% 46.0% 21.8% 97.8% 2002 ........................................................... 71.0% 42.2% 28.8% 97.4% 2003 ........................................................... 74.6% 43.4% 31.2% 97.1% 2004 ........................................................... 73.7% 44.0% 29.7% 93.7% 2005 ........................................................... 74.3% 46.9% 27.4% 85.1% 2006 ........................................................... 69.9% 46.6% 23.3% 59.9% 2007 ........................................................... 70.2% 46.5% 23.7% 19.9% For 13 of the 16 years, we have maintained a spread (forecasted collection rate less the advance rate) of 20% or more. Of the many variables that determine the profitability of a loan (e.g., ancillary product income, expense levels, loan size), the spread is one of the most important. During the period 1995–1997, the spread on new loan originations was much lower than in the previous or subsequent years. In fact, the loans originated during that period turned out to be unprofitable. Since reaching 31.2% in 2003, a 10-year high, the spread on originations has been declining. The spread on 2007 originations is currently estimated at 23.7%. We believe that 2007 originations will be more profitable per unit than the 2003 originations (largely because of profit from ancillary products and an increase in loan size). However, because of a lower spread, 2007 originations will be more sensitive to a collection shortfall.
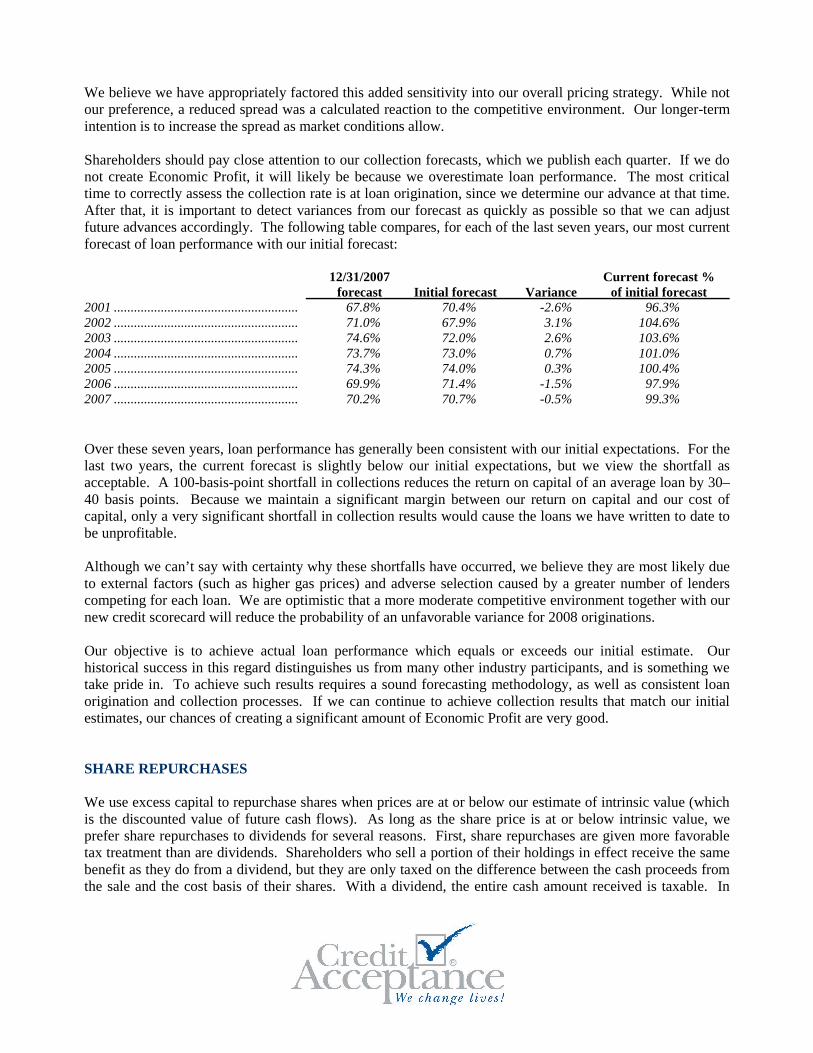
We believe we have appropriately factored this added sensitivity into our overall pricing strategy. While not our preference, a reduced spread was a calculated reaction to the competitive environment. Our longer-term intention is to increase the spread as market conditions allow. Shareholders should pay close attention to our collection forecasts, which we publish each quarter. If we do not create Economic Profit, it will likely be because we overestimate loan performance. The most critical time to correctly assess the collection rate is at loan origination, since we determine our advance at that time. After that, it is important to detect variances from our forecast as quickly as possible so that we can adjust future advances accordingly. The following table compares, for each of the last seven years, our most current forecast of loan performance with our initial forecast: 12/31/2007 Current forecast % forecast Initial forecast Variance of initial forecast 2001 ....................................................... 67.8% 70.4% -2.6% 96.3% 2002 ....................................................... 71.0% 67.9% 3.1% 104.6% 2003 ....................................................... 74.6% 72.0% 2.6% 103.6% 2004 ....................................................... 73.7% 73.0% 0.7% 101.0% 2005 ....................................................... 74.3% 74.0% 0.3% 100.4% 2006 ....................................................... 69.9% 71.4% -1.5% 97.9% 2007 ....................................................... 70.2% 70.7% -0.5% 99.3% Over these seven years, loan performance has generally been consistent with our initial expectations. For the last two years, the current forecast is slightly below our initial expectations, but we view the shortfall as acceptable. A 100-basis-point shortfall in collections reduces the return on capital of an average loan by 30–40 basis points. Because we maintain a significant margin between our return on capital and our cost of capital, only a very significant shortfall in collection results would cause the loans we have written to date to be unprofitable. Although we can’t say with certainty why these shortfalls have occurred, we believe they are most likely due to external factors (such as higher gas prices) and adverse selection caused by a greater number of lenders competing for each loan. We are optimistic that a more moderate competitive environment together with our new credit scorecard will reduce the probability of an unfavorable variance for 2008 originations. Our objective is to achieve actual loan performance which equals or exceeds our initial estimate. Our historical success in this regard distinguishes us from many other industry participants, and is something we take pride in. To achieve such results requires a sound forecasting methodology, as well as consistent loan origination and collection processes. If we can continue to achieve collection results that match our initial estimates, our chances of creating a significant amount of Economic Profit are very good. SHARE REPURCHASES We use excess capital to repurchase shares when prices are at or below our estimate of intrinsic value (which is the discounted value of future cash flows). As long as the share price is at or below intrinsic value, we prefer share repurchases to dividends for several reasons. First, share repurchases are given more favorable tax treatment than are dividends. Shareholders who sell a portion of their holdings in effect receive the same benefit as they do from a dividend, but they are only taxed on the difference between the cash proceeds from the sale and the cost basis of their shares. With a dividend, the entire cash amount received is taxable. In
addition, distributing capital to shareholders through a share repurchase gives shareholders the option to defer taxes by electing not to sell any of their holdings. A dividend does not allow shareholders to defer taxes in this manner. Second, a share repurchase provides shareholders with the discretion to increase their ownership, receive cash or do both based on their individual circumstances and view of the value of a Credit Acceptance share. (They do both if the proportion of shares they sell is smaller than the ownership stake they gain through the repurchase program.) A dividend does not provide similar flexibility. Third, repurchasing shares below intrinsic value increases the value of the remaining shares. Since beginning our share repurchase program in mid-1999, we have repurchased approximately 20.4 million shares at a total cost of $399.2 million. Although the share price was attractive during 2007, our share repurchases slowed considerably since accelerated growth in unit volumes made investing our available capital in our core business a better option. Even though we have repurchased a significant number of shares since 1999, we continue to maintain a ratio of debt to equity that is very conservative relative to industry standards. At year-end, our debt-to-equity ratio was 2.0:1. KEY SUCCESS FACTORS Our recent financial success is a result of having a unique and valuable product and of putting in many years of hard work to develop the business. Our core product has remained essentially unchanged for 35 years. We provide auto loans to consumers regardless of their credit history. Our customers consist of individuals who have typically been turned away by other lenders. Traditional lenders have many reasons for declining a loan. We have always believed that individuals, if given an opportunity to establish or reestablish a positive credit history, will take advantage of it. As a result of this belief, we have changed the lives of thousands of people. However, as we have found, having a unique and valuable product is only one of the elements we need if we are to make our business successful. There are others, and many have taken years to develop. The following summarizes the key elements of our success today:
• We have developed the ability to offer guaranteed credit approval while maintaining an appropriate return on capital. It took years to develop the processes and accumulate the customer and loan performance data that we use to make profitable loans in our segment of the market.
• We understand the daily execution required to successfully service a portfolio of automobile loans to customers in our target market. There are many examples of companies in our industry that underestimated the effort involved and are now bankrupt. Approximately 50% of our team members work directly on some aspect of servicing our loan portfolio, and we are fortunate to have such a capable and engaged group.
• We have learned how to develop relationships with dealer-partners that are profitable. Forging a profitable relationship requires us to select the right dealer, align incentives, communicate constantly and create processes to enforce standards. In our segment of the market, the dealer-partner has
significant influence over loan performance. Learning how to create relationships with dealer-partners who share our passion for changing lives has been one of our most important accomplishments.
• We have developed a much more complete program for helping dealer-partners serve this segment of the market. Over the years, many dealer-partners have been overwhelmed by the work required to be successful in our program. Many dealer-partners have quit, telling us the additional profits generated from our program were not worth the effort. We have continually worked to provide solutions for the many obstacles that our dealer-partners encounter. It is impossible to quantify the impact of these initiatives on our loan volume because of the changing competitive environment. However, anecdotal evidence suggests our efforts have been worthwhile. Continuing to make our program easier for dealer-partners will likely produce additional benefits in the future.
• We have developed a strong management team. Our team is deeper and more talented than at any other time in our history. Our success in growing the business while simultaneously improving our returns on capital could not have occurred without the dedication and energy of this talented group.
• We have strengthened our focus on our core business. Historically, our focus had been diluted by the pursuit of other, non-core opportunities. Today, we offer one product and focus 100% of our energy and capital on providing that product profitably.
• We have developed a unique system, CAPS, for originating auto loans. Traditional indirect lending is inefficient. Many traditional lenders take 1-4 hours to process a loan application, and they decline most of the applications they process. We take 60 seconds, and we approve 100% of the applications submitted, 24 hours a day, seven days a week.
• We have developed a high-quality field sales force. Our sales team provides real value to our dealer-partners. Team members act as consultants as we teach dealer-partners how to successfully serve our market segment.
A FINAL NOTE We have built a consistently profitable business in an industry where most companies fail. The credit for this achievement belongs to our talented team members. They have worked hard to achieve this success, and I am grateful for their efforts. As always, we thank our shareholders for their confidence in and support of this company. We are optimistic that future results will be even better, and look forward to reporting our progress in next year’s letter. Brett A. Roberts Chief Executive Officer March 21, 2008
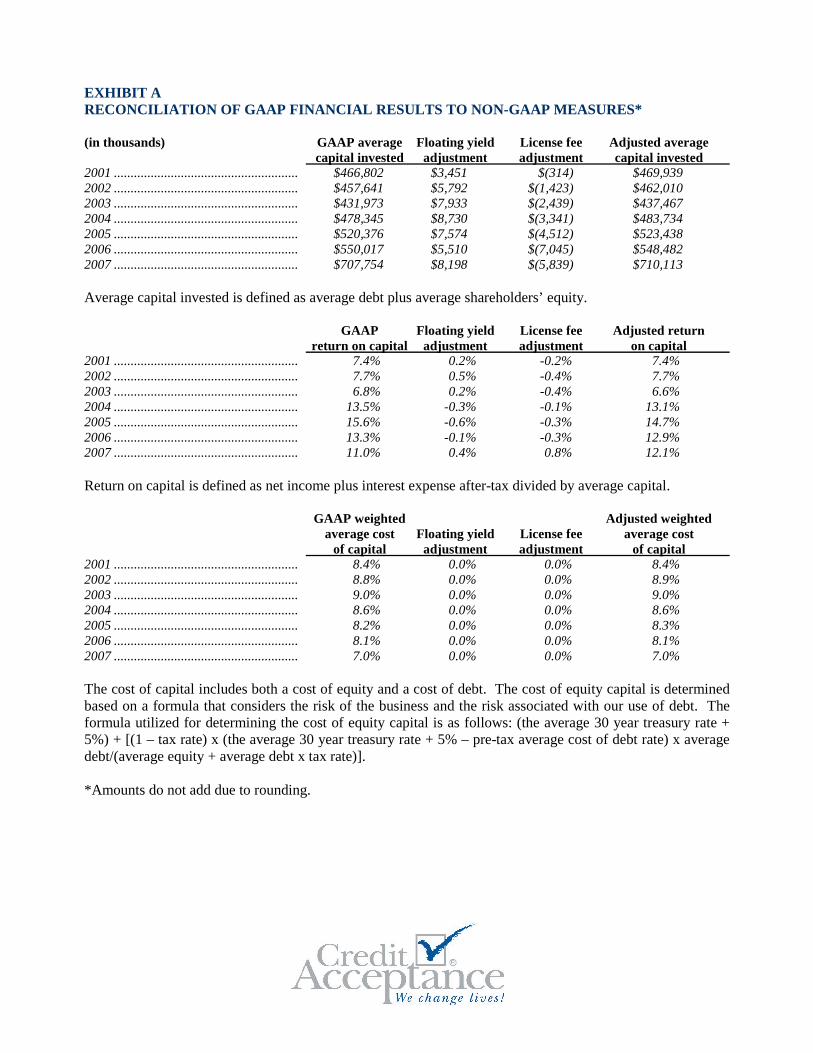
EXHIBIT A RECONCILIATION OF GAAP FINANCIAL RESULTS TO NON-GAAP MEASURES* (in thousands) GAAP average Floating yield License fee Adjusted average capital invested adjustment adjustment capital invested 2001 ....................................................... $466,802 $3,451 $(314) $469,939 2002 ....................................................... $457,641 $5,792 $(1,423) $462,010 2003 ....................................................... $431,973 $7,933 $(2,439) $437,467 2004 ....................................................... $478,345 $8,730 $(3,341) $483,734 2005 ....................................................... $520,376 $7,574 $(4,512) $523,438 2006 ....................................................... $550,017 $5,510 $(7,045) $548,482 2007 ....................................................... $707,754 $8,198 $(5,839) $710,113 Average capital invested is defined as average debt plus average shareholders’ equity. GAAP Floating yield License fee Adjusted return return on capital adjustment adjustment on capital 2001 ....................................................... 7.4% 0.2% -0.2% 7.4% 2002 ....................................................... 7.7% 0.5% -0.4% 7.7% 2003 ....................................................... 6.8% 0.2% -0.4% 6.6% 2004 ....................................................... 13.5% -0.3% -0.1% 13.1% 2005 ....................................................... 15.6% -0.6% -0.3% 14.7% 2006 ....................................................... 13.3% -0.1% -0.3% 12.9% 2007 ....................................................... 11.0% 0.4% 0.8% 12.1% Return on capital is defined as net income plus interest expense after-tax divided by average capital. GAAP weighted Adjusted weighted average cost Floating yield License fee average cost of capital adjustment adjustment of capital 2001 ....................................................... 8.4% 0.0% 0.0% 8.4% 2002 ....................................................... 8.8% 0.0% 0.0% 8.9% 2003 ....................................................... 9.0% 0.0% 0.0% 9.0% 2004 ....................................................... 8.6% 0.0% 0.0% 8.6% 2005 ....................................................... 8.2% 0.0% 0.0% 8.3% 2006 ....................................................... 8.1% 0.0% 0.0% 8.1% 2007 ....................................................... 7.0% 0.0% 0.0% 7.0% The cost of capital includes both a cost of equity and a cost of debt. The cost of equity capital is determined based on a formula that considers the risk of the business and the risk associated with our use of debt. The formula utilized for determining the cost of equity capital is as follows: (the average 30 year treasury rate + 5%) + [(1 – tax rate) x (the average 30 year treasury rate + 5% – pre-tax average cost of debt rate) x average debt/(average equity + average debt x tax rate)]. *Amounts do not add due to rounding.