12
Sharing AIS Data Maritime Administration Efforts U. S. Department of Transportation Owen Doherty Director, Office of Security

Sharing AIS Data
Maritime Administration Efforts
U. S. Department of Transportation
Owen Doherty
Director, Office of Security

Reasons to Share AIS
• Safety• Security• Environment• Commercial Mobility• National Security

Global Supply Chain Components
Producers Distributors Retailers Customers
Transportation and Logistics Service Providers

Trade Growth, 1860 to 2005
1860 18
80 1900 19
20 1940 19
60 1980 20
00 2003
-
100,000
200,000
300,000
400,000
500,000
600,000
Mill
ions
of R
eal (
2000
) Dol
lars
Atlantic CoastCanadian Border
Pacific CoastGulf Coast
Mexican Border
The value of U.S. trade—measured in constant dollars by coast and land border—has grown rapidly over the last 30 years

1,4371,4376,1656,165(TEUs in
thousands)
2020202020042004
HoustonHouston1,0101,010 2,1522,152
MiamiMiami
2,0432,043 3,3823,382
OaklandOakland
4,4784,478
15,83515,835
NY/NJNY/NJ
1,8091,8095,5665,566
VirginiaVirginia
1,8601,8606,6396,639
CharlestonCharleston
1,7981,7984,3964,396
TacomaTacoma
1,7761,776 2,5572,557
SeattleSeattle
1,6621,662
9,4209,420
SavannahSavannah
Dramatic increases in projected freight demand
* Forecast figures are based on an unconstrained 10-year linear regression, and do not reflect the expected capacity of each port in 2020.
LA/LBLA/LB
59,42059,420
13,10113,101

Impact of Global Trade on Major Ports of the United States
0
4
8
12
Chicag
o
LA/LB
NY/NJ
Needed
Sea/Tac
Charle
ston
Oaklan
dSav
annah
Virginia
Miami
Housto
n
2005
TEU
s (0
00,0
00)
Largest volume“port” is inland
Annually required new port capacity [10% Growth on 26.2 million TEUs]
Capacity of Ports

Supply Chain Security and Productivity
• Integrated System
• Transparency
• Accountability
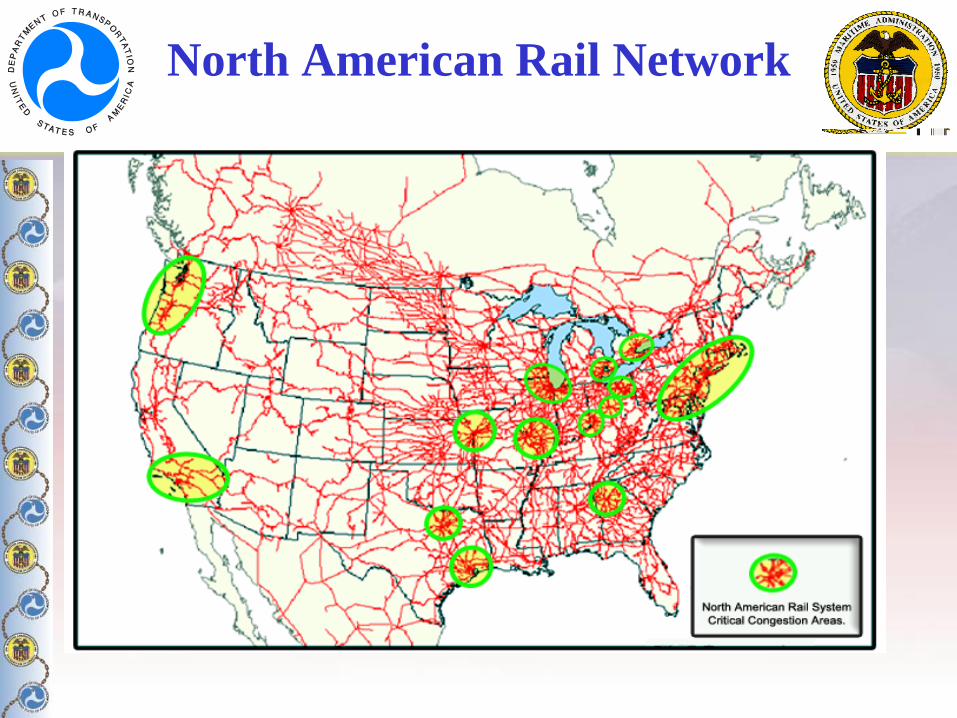
North American Rail Network

Major Freight Truck Bottlenecks

Government-Industry Partnership
Vessel Tracking Services
Volpe
MSSIS
NAIS
Carriers
Lloyds
MISNA
Port Authorities
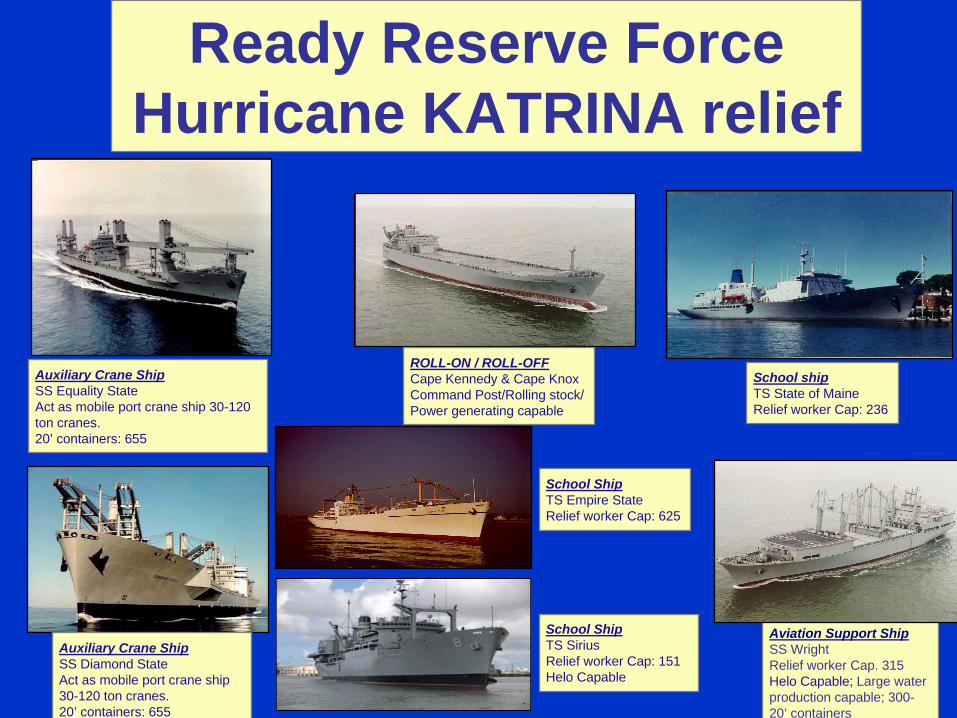
Ready Reserve Force Hurricane KATRINA relief
School ShipTS SiriusRelief worker Cap: 151Helo Capable
ROLL-ON / ROLL-OFFCape Kennedy & Cape KnoxCommand Post/Rolling stock/ Power generating capable
Aviation Support Ship SS WrightRelief worker Cap. 315Helo Capable; Large water production capable; 300- 20’ containers
School shipTS State of MaineRelief worker Cap: 236
School ShipTS Empire StateRelief worker Cap: 625
Auxiliary Crane ShipSS Equality State Act as mobile port crane ship 30-120 ton cranes.20’ containers: 655
Auxiliary Crane ShipSS Diamond StateAct as mobile port crane ship 30-120 ton cranes.20’ containers: 655


