+ All Categories
Home > Documents > Sharon M. Gourdji, K.L. Mueller, V. Yadav, A.E. Andrews, M. Trudeau, D.N. Huntzinger, A.Schuh, A.R....

Sharon M. Gourdji, K.L. Mueller, V. Yadav, A.E. Andrews, M. Trudeau, D.N. Huntzinger, A.Schuh, A.R....

Date post: 30-Dec-2015
Category:
Upload: ethan-gibbs
View: 214 times
Download: 0 times
Share this document with a friend
Popular Tags:
22
The Top-Down Constraint on North American CO 2 Fluxes: an Inter-comparison of Regional Inversion Results for 2004 Sharon M. Gourdji , K.L. Mueller, V. Yadav, A.E. Andrews, M. Trudeau, D.N. Huntzinger, A.Schuh, A.R. Jacobson, M. Butler, A.M. Michalak North American Carbon Program Meeting New Orleans, LA February 4, 2011
Transcript

The Top-Down Constraint on North American CO2 Fluxes: an Inter-comparison of Regional Inversion Results for 2004

Sharon M. Gourdji, K.L. Mueller, V. Yadav, A.E. Andrews, M. Trudeau, D.N. Huntzinger, A.Schuh, A.R. Jacobson, M.

Butler, A.M. Michalak

North American Carbon Program MeetingNew Orleans, LAFebruary 4, 2011

Atmospheric inversions Variability in

atmospheric CO2 concentrations provides information about surface CO2 exchange

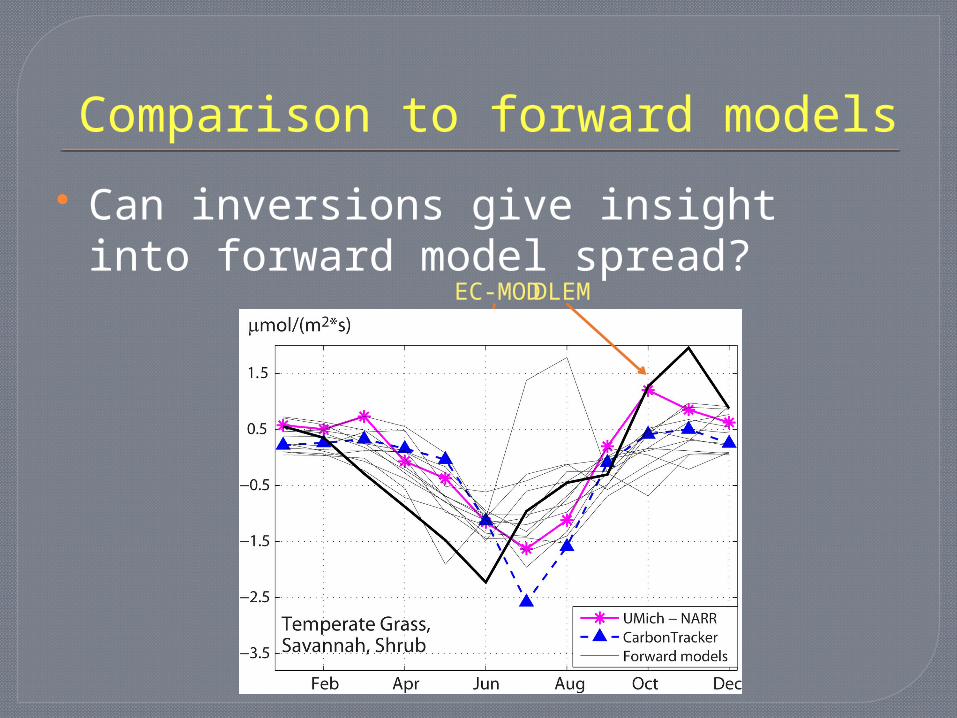
Inversions potentially useful for validating bottom-up models and verifying emission reductions

Measurement locations

Continuous, continental measurement data

(Relatively) recent availability of continuous, continental measurement data necessitates improvements in inversions and transport models to appropriately use this data

(Source: http://www.esrl.noaa.gov/gmd/ccgg/)

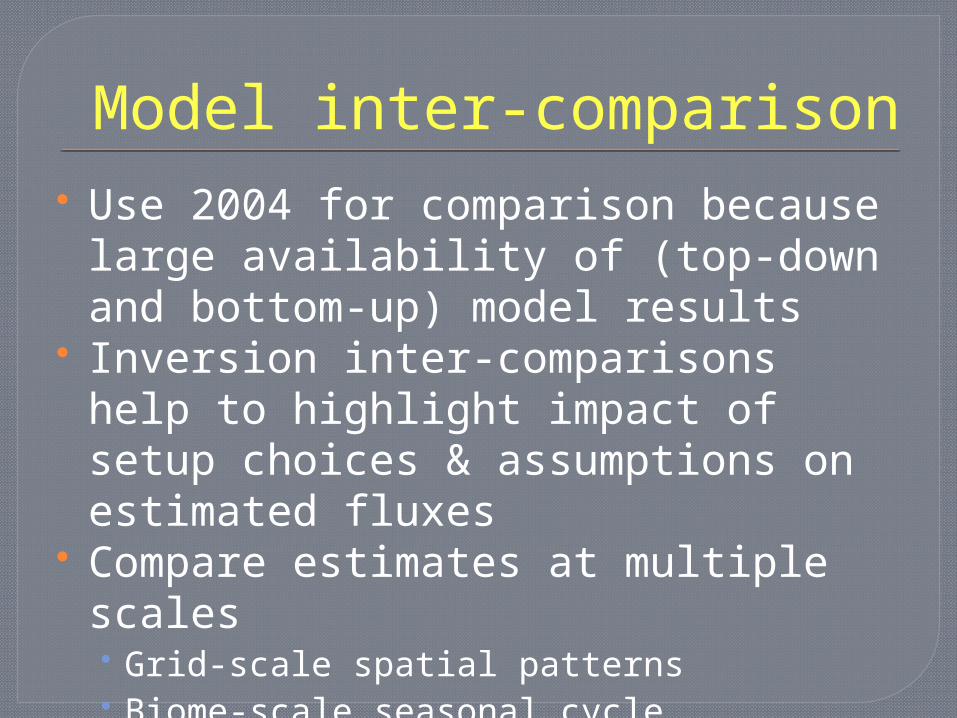
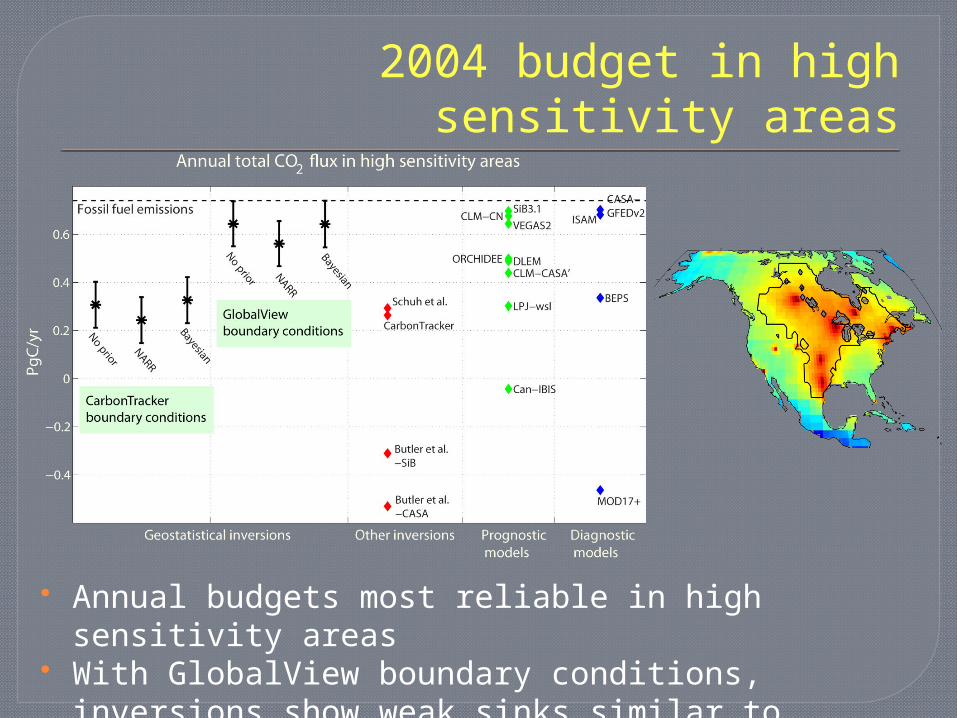
Model inter-comparison Use 2004 for comparison because

large availability of (top-down and bottom-up) model results

Inversion inter-comparisons help to highlight impact of setup choices & assumptions on estimated fluxes

Compare estimates at multiple scales• Grid-scale spatial patterns• Biome-scale seasonal cycle• Annual aggregated budgets

Specific inversionsDomain

Temporal resolution

Spatial resolution

Covariance assumptions Priors Transport

Data??

Butler et al.Global monthly

10 sub-regions in North America None SiB3 PCTM

CarbonTracker Global weekly

25 eco-regions in North America Limited CASA-GFEDv2 TM5

Schuh et al.North Americaweekly 1°x1°

Spatial covariance (fixed length scales) SiB3 PCTM

UMich - geostats

North America

4-day average diurnal cycle 1°x1°

Spatial covariance (estimated with atmospheric data)

Simple mean flux WRF-STILT

UMich- geostats w/ NARR

North America3-hourly 1°x1°

Spatial covariance (estimated with atmospheric data)

Linear trend with NARR variables, calibrated with atmospheric data WRF-STILT

UMich – Bayesian

North America3-hourly 1°x1°

Spatial covariance (estimated with atmospheric data) CASA-GFEDv2 WRF-STILT

Atmospheric data constraint over North America in 2004

Can identify areas well-constrained by atmospheric measurements using footprint analysis

• High sensitivity area shown here, where minimum level of sensitivity to measurements throughout year

2004 yearly-average sensitivity of measurements to fluxes from WRF-STILT

Forward models Compare inversions to 16 forward models

estimating North American biospheric fluxes in 2004• Collected for the North American Carbon

Program Regional Interim SynthesisCan-IBISCLM-CASA'

CLM-CNDLEMISAMLPJmLMC1

ORCHIDEESiB3.1TEM6

VEGAS2BEPS

CASA-GFEDv2EC-MODMOD17+

NASA-CASA

Biospheric flux,June to

August, 2004

mmol/(m2*s)

Click hereto playmovie

Grid-scale spatial patterns

Grid-scale (March to May)

Can see influence of explicit priors Sources around LEF visible in 5 of 6

inversions; spatial extent of impact varies NARR inversion similar to forward model

mean

Grid-scale (June to August)

Inversions look similar during height of growing season, and most correspond closely with forward model mean

Grid-scale (September to November)

Strong sources in center of continent from all inversions relative to forward model mean; most visible in UMich “no prior” inversion

Grid-scale (December to February)

Stronger sources in UMich than other inversions• Fossil fuel inventory? Data choices? Boundary

conditions?

Biome-scale seasonal cycle

Comparison to other inversions

Some convergence in UMich inversions & CarbonTracker Differences in timing & magnitude of peak uptake; spread driven

as much by inversion setup as prior assumptions? Inversion spread narrower in well-constrained agricultural

regions

Comparison to forward models

Can inversions give insight into forward model spread?

EC-MODDLEM

Annual aggregated budgets

Boundary conditions for regional inversions

Boundary conditions needed to account for influence of fluxes outside North America on measurement data

For geostatistical inversions, test two different sets of boundary conditions

CarbonTracker GlobalView

2004 continental budget

Boundary conditions have strong impact on annual budgets from inversions, regardless of prior assumptions

2004 budget in high sensitivity areas

Annual budgets most reliable in high sensitivity areas

With GlobalView boundary conditions, inversions show weak sinks similar to majority of forward models

Conclusions Large spread in inversion results for 2004; need

for:• Community consensus on optimal setup (grid-scale vs.

big regions, covariance assumptions, priors, etc.) and data choices

• More research into correct boundary conditions Will more data increase or decrease model

spread?• Results less sensitive to inversion setup?• Or more difficult to use new kinds of data (e.g. very short

towers, urban sites, complex terrain, satellite column-averages?)

• Improvements in transport models needed to reduce risks in using new datastreams

Important to understand “simple” inversions using in situ data before incorporating satellite measurements into sophisticated data assimilation systems

Acknowledgements WRF-STILT: AER, Inc. (Janusz Eluszkiewicz,

Thomas Nehrkorn, John Henderson), John Lin, Deyong Wen

Atmospheric data providers: NOAA, Doug Worthy, Bill Munger, Marc Fischer

NACP Regional Interim Synthesis team and modelers

Funders: NASA (ROSES NACP and NESSF fellowship)

Contact: [email protected]

QUESTIONS?


Recommended