30
STRONG FUNDAMENTALS FUNDAMENTAL STRENGTHS Investor Presentation September 2014
STRONG FUNDAMENTALS
FUNDAMENTALSTRENGTHS
Investor PresentationSeptember 2014
Disclaimer
This presentation contains forward-looking information within the meaning of applicablesecurities laws. The forward-looking information is based on assumptions, estimates andanalysis made in light of the company’s experience and its perception of trends, currentconditions and expected developments, as well as other factors that are believed by thecompany to be reasonable and relevant in the circumstances. Forward-lookinginformation involves known and unknown risks, uncertainties and other factors whichmay cause actual results, performance or achievements to be materially different fromthose predicted, expressed or implied by the forward-looking information. The risks anduncertainties include, among other things, changes in global economic activity andchanges in energy supply and demand which impact on the level of drilling activity andpipeline construction; political, economic and other risks arising from internationaloperations; compliance with environmental, trade and other laws; liability claims;fluctuations in foreign exchange rates and fluctuations in raw material prices, as well asother risks and uncertainties that are more fully described in the company’s currentAnnual Information Form, annual and quarterly reports and in other reports and filingsmade with securities regulatory authorities and available at www.sedar.com.
2
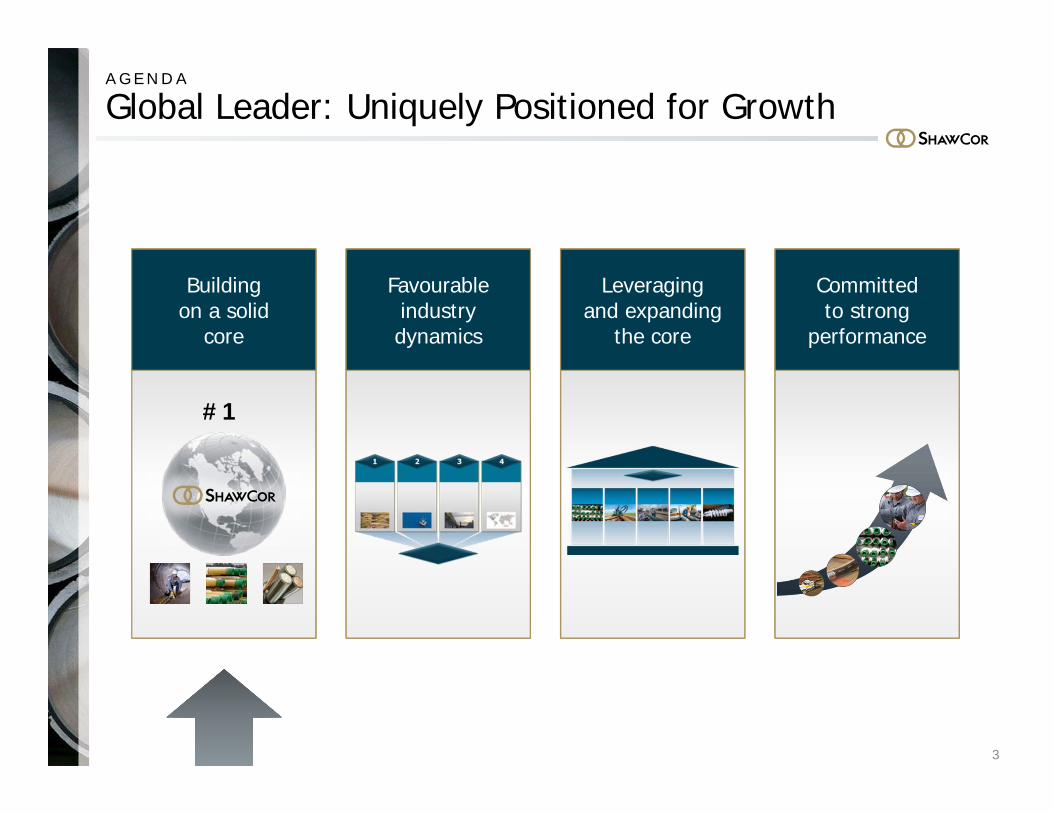
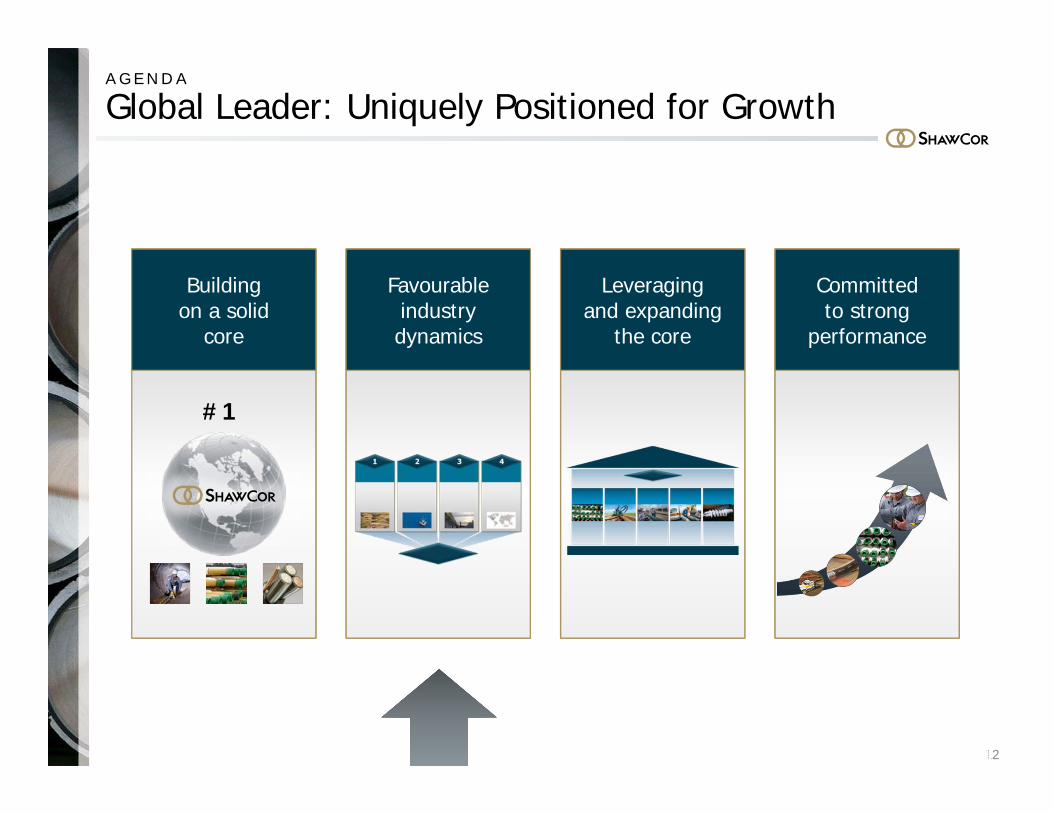
A G E N D A
Global Leader: Uniquely Positioned for Growth
Buildingon a solid
core
Favourable industry dynamics
Leveragingand expanding
the core
Committedto strong
performance
3
#1
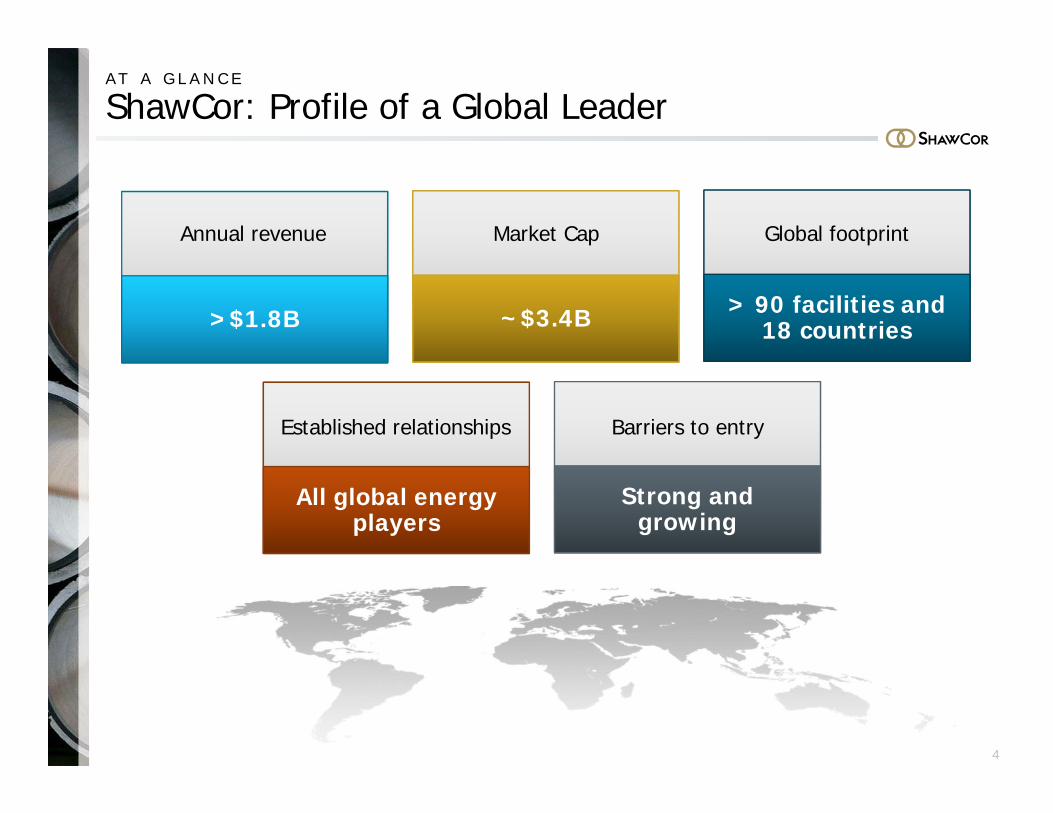
A T A G L A N C E
ShawCor: Profile of a Global Leader
4
>$1.8B
Annual revenue
~$3.4B
Market Cap
> 90 facilities and 18 countries
Global footprint
All global energy players
Established relationships
Strong andgrowing
Barriers to entry
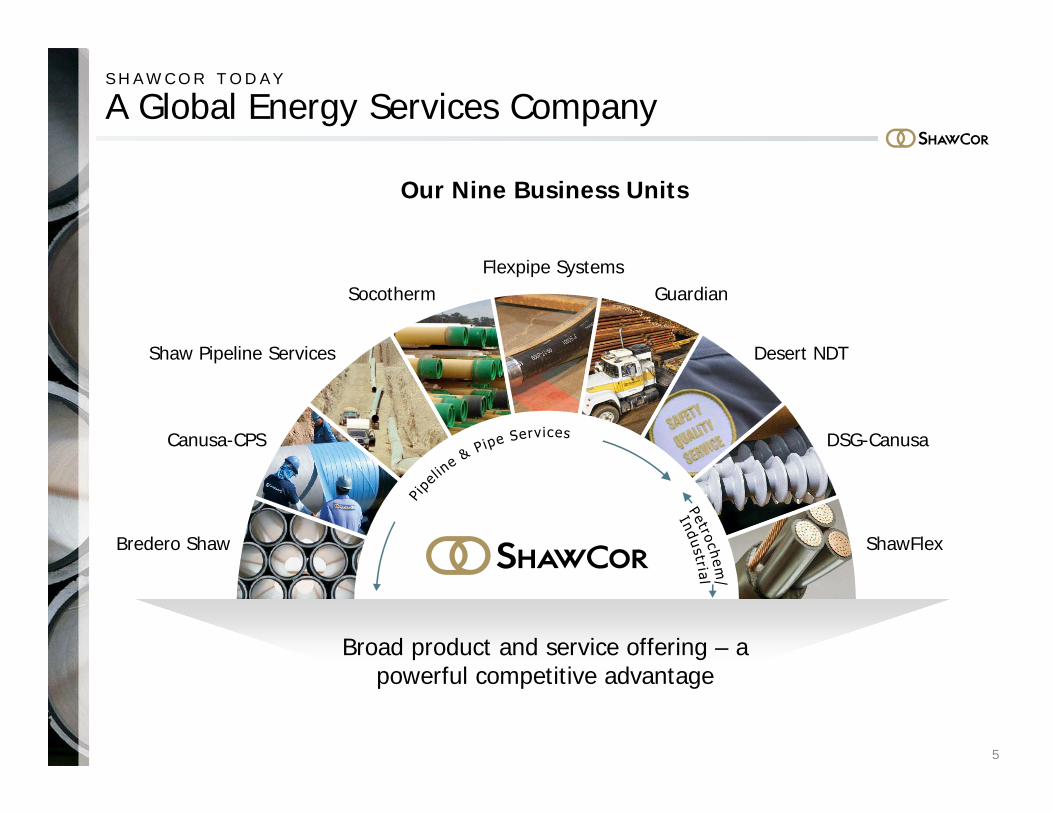
S H A W C O R T O D A Y
A Global Energy Services Company
5
Our Nine Business Units
Broad product and service offering – a powerful competitive advantage
Bredero Shaw
Canusa-CPS
Shaw Pipeline Services
SocothermFlexpipe Systems
Guardian
Desert NDT
DSG-Canusa
ShawFlex

Delivering Leading Solutions to Our Customers Around the World
6
AMERICAS
EMAR
ASIAPACIFIC
PipelinePerformance
CompositeProductionSystems
Integrity Management ConnectivityOilfield Asset
Management
Customers around the world
• Bredero Shaw• Socotherm• Canusa–CPS
• FlexpipeSystems
• Guardian• CSI
• ShawFlex• DSG–Canusa• PFT Systems
& Connectors
• SPS• Desert NDT• Zedi• Vintri
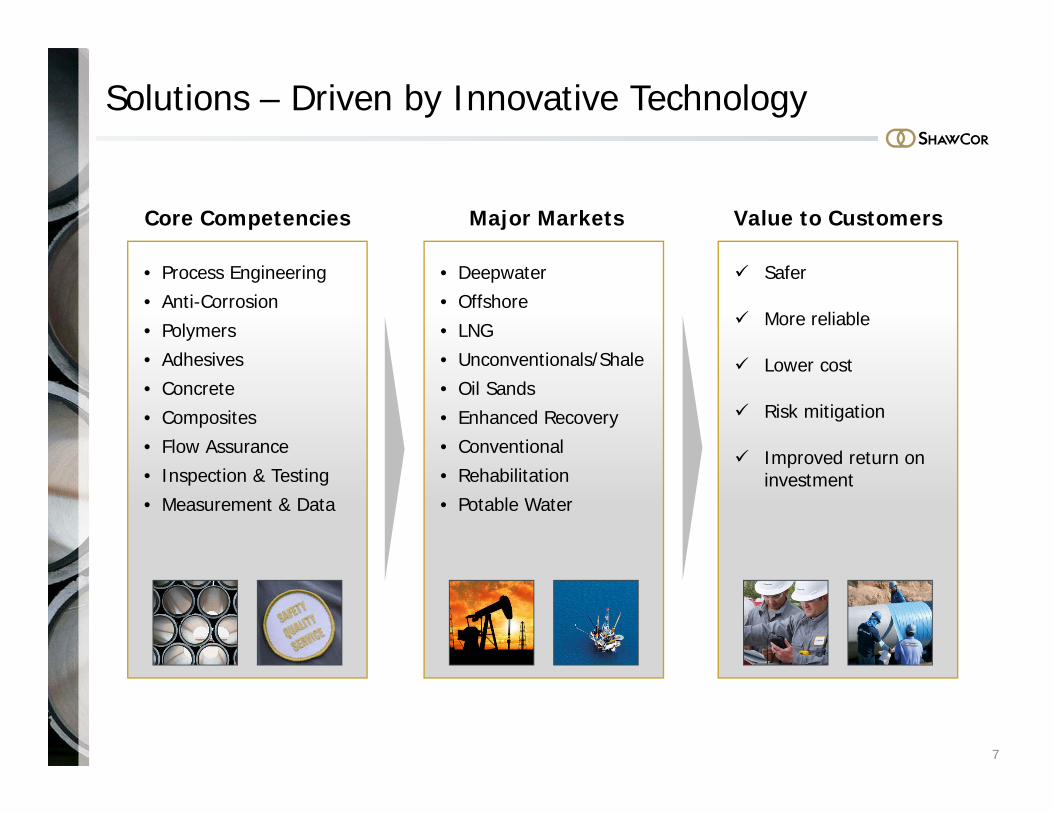
Solutions – Driven by Innovative Technology
7
Core Competencies Major Markets Value to Customers
• Process Engineering• Anti-Corrosion• Polymers• Adhesives• Concrete• Composites• Flow Assurance• Inspection & Testing• Measurement & Data
• Deepwater• Offshore• LNG• Unconventionals/Shale• Oil Sands• Enhanced Recovery• Conventional• Rehabilitation• Potable Water
Safer
More reliable
Lower cost
Risk mitigation
Improved return on investment

Unmatched Scale, Diversity and Global Reach
8
Coating Facility
Other Operating Facility
• 90+ global locations• 7 mobile coating plants• >8,000 employees worldwide• Serving all major basins

A Track Record of Successful Project Execution
9
Darwin
Ichthys LNG Project
• Longest offshore gas pipeline in southern hemisphere
• Coatings for >1,000 km of offshore pipelines
• Value >$500M
Ichthys
Gas pipelineGas field
Trinidad Project• Concrete weight coatings for
offshore Dragon Cigma gas field• Executed with 2 mobile plants in
Trinidad• Value >$100M
North America Gathering Lines
• > 22,000 km of Flexpipe composite linepipe installed
• > 1.5 million welds inspected per year by Desert NDT
Dragon Cigma
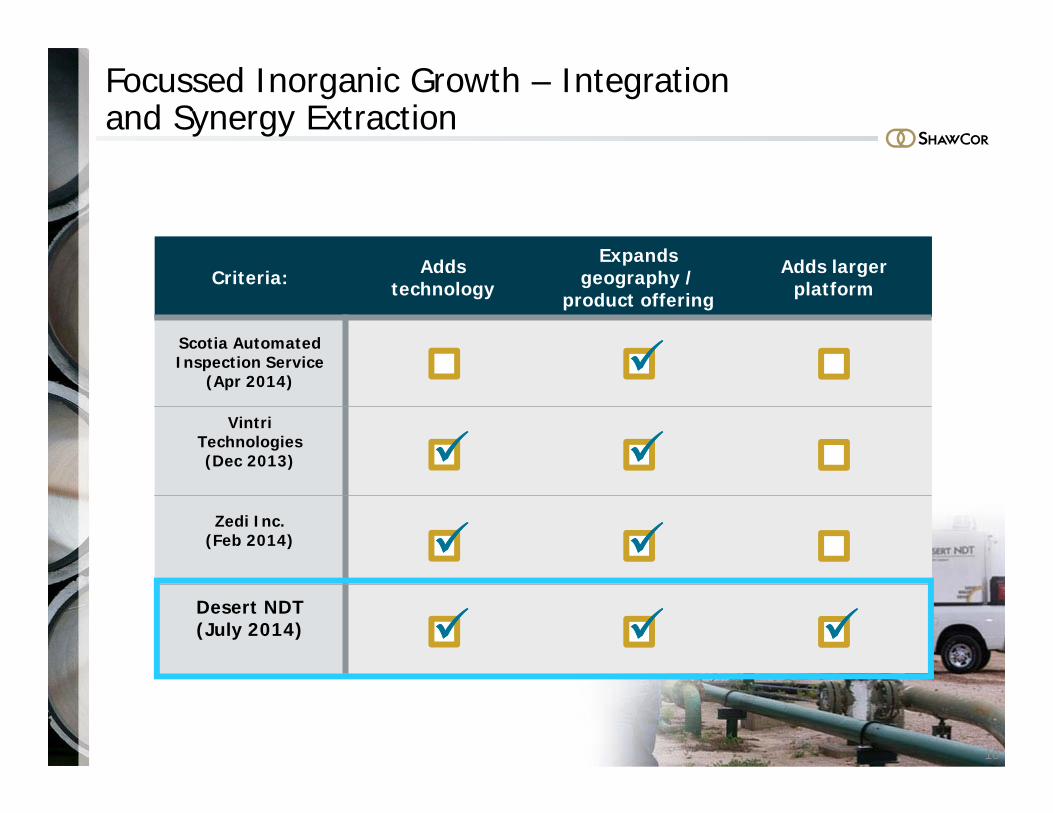
Focussed Inorganic Growth – Integration and Synergy Extraction
10
Criteria: Addstechnology
Expands geography /
product offering
Adds larger platform
Scotia Automated Inspection Service
(Apr 2014)
VintriTechnologies(Dec 2013)
Zedi Inc. (Feb 2014)
Desert NDT(July 2014)

Proven Track Record – 2008 to 2013
11
* 5 year compound annual growth rate
Revenuegrowth
6.0%*
EBITDAgrowth
8.0%*
EPSgrowth
10.9%*
AverageROIC
16.2%
#1
A G E N D A
Global Leader: Uniquely Positioned for Growth
12
Buildingon a solid
core
Favourable industry dynamics
Leveragingand expanding
the core
Committedto strong
performance
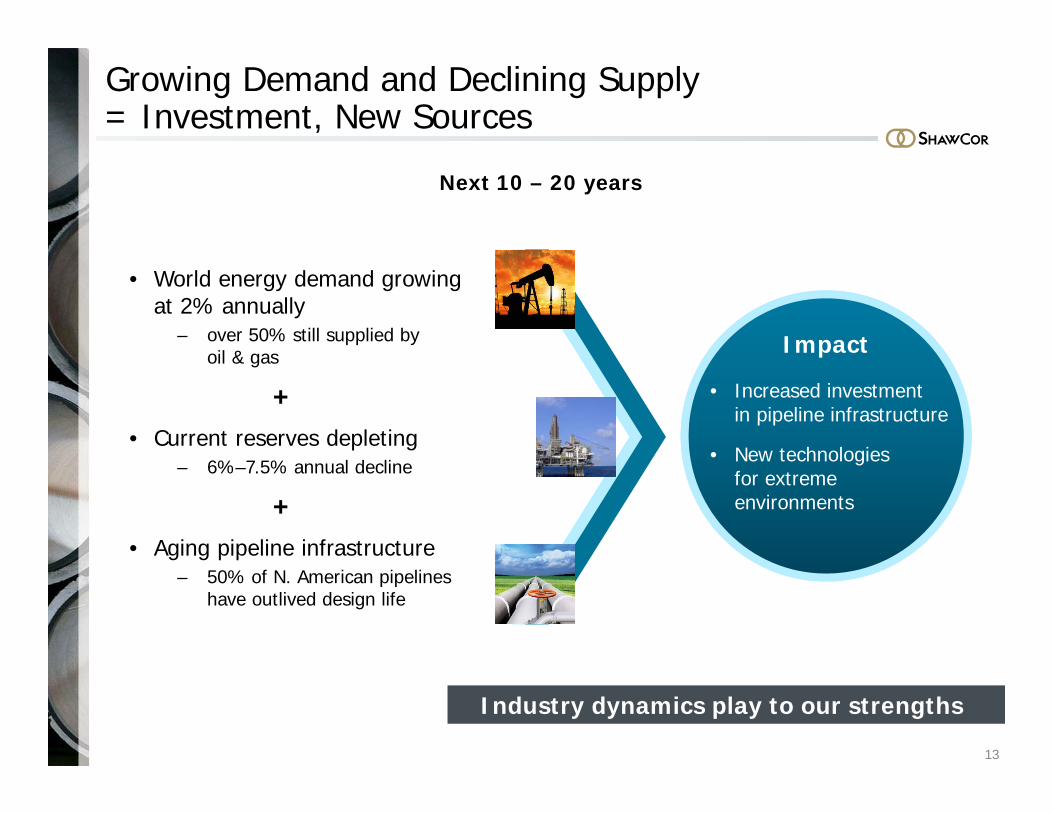
Growing Demand and Declining Supply = Investment, New Sources
13
Next 10 – 20 years
• World energy demand growing at 2% annually
– over 50% still supplied by oil & gas
+• Current reserves depleting
– 6%–7.5% annual decline
+• Aging pipeline infrastructure
– 50% of N. American pipelines have outlived design life
Impact
• Increased investment in pipeline infrastructure
• New technologies for extreme environments
Industry dynamics play to our strengths

Growing Gap Between Energy Supply and Demand
14
Growing demand distant from supply driving new pipeline infrastructure
Source: EIA International Energy Outlook 2013
Oil Supply
Oil Demand
Gas Supply
Gas DemandGapGap
GapGap
GapGapGapGap
Africa
Middle East
Europe & EurasiaNorth America
Central & South America
Asia Pacific
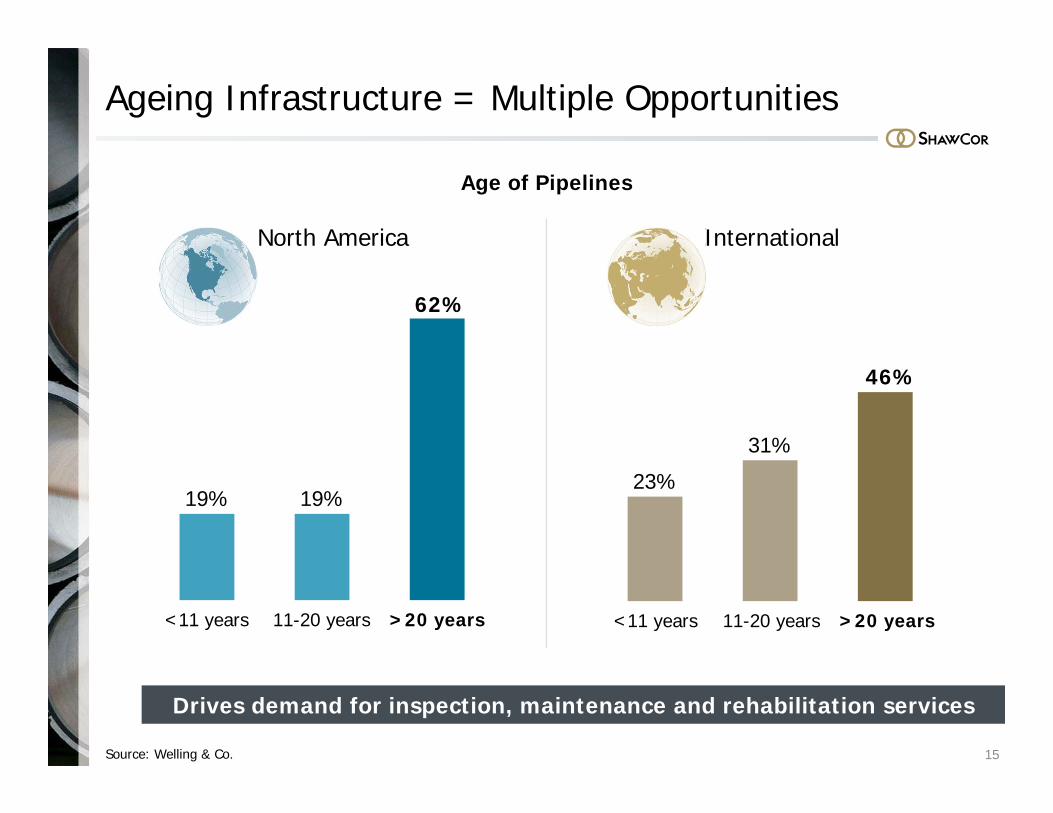
Ageing Infrastructure = Multiple Opportunities
15Source: Welling & Co.
Age of Pipelines
Drives demand for inspection, maintenance and rehabilitation services
19% 19%
62%
North America International
23%
31%
46%
<11 years 11-20 years >20 years <11 years 11-20 years >20 years

Increasing Public and Regulatory Scrutiny…
16
…is driving need for increased traceability and operator confidence
RISK
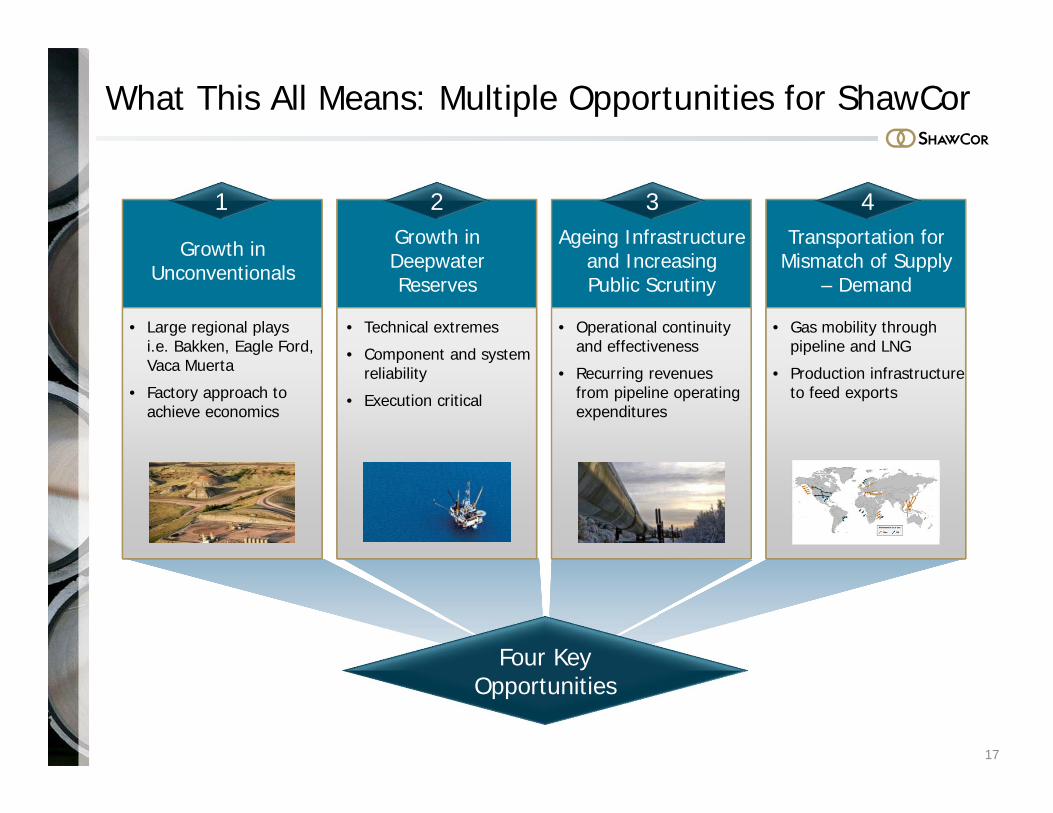
What This All Means: Multiple Opportunities for ShawCor
17
Growth inUnconventionals
Growth in Deepwater Reserves
Ageing Infrastructure and IncreasingPublic Scrutiny
Transportation for Mismatch of Supply
– Demand
• Large regional plays i.e. Bakken, Eagle Ford, Vaca Muerta
• Factory approach to achieve economics
• Technical extremes
• Component and system reliability
• Execution critical
• Operational continuity and effectiveness
• Recurring revenues from pipeline operating expenditures
• Gas mobility through pipeline and LNG
• Production infrastructure to feed exports
Four Key Opportunities
1 2 3 4

#1
A G E N D A
Global Leader: Uniquely Positioned for Growth
Buildingon a solid
core
Favourable industry dynamics
Leveragingand expanding
the core
Committedto strong
performance
18
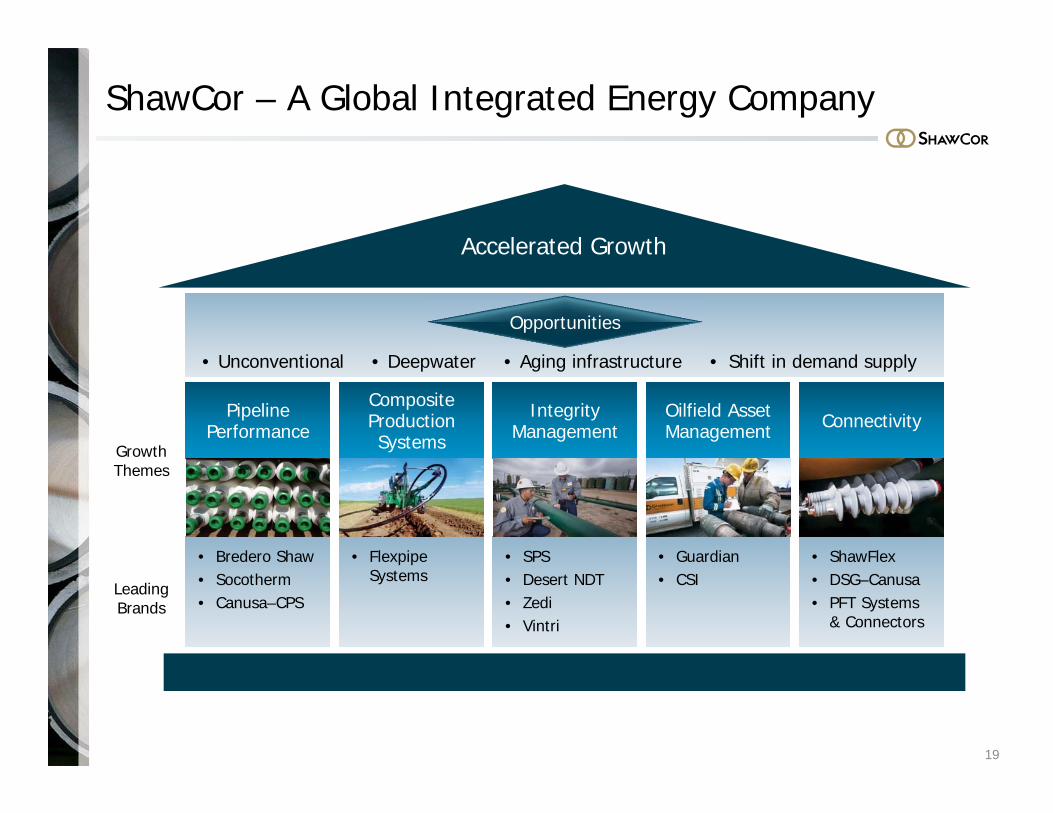
ShawCor – A Global Integrated Energy Company
19
• Bredero Shaw• Socotherm• Canusa–CPS
• FlexpipeSystems
• Guardian• CSI
• ShawFlex• DSG–Canusa• PFT Systems
& Connectors
CompositeProductionSystems
Integrity Management ConnectivityOilfield Asset
Management
Accelerated Growth
PipelinePerformance
• Deepwater• Unconventional • Aging infrastructure • Shift in demand supply
GrowthThemes
LeadingBrands
Opportunities
• SPS• Desert NDT• Zedi• Vintri

Why ShawCor?Value to Customer
G R O W T H T H E M E # 1
Pipeline Performance
20
The OpportunityLeverage our leading pipe coating products, services and systems into innovative solutions that extend the life of pipeline assets and/or expand operating envelopes
• Extend life of pipeline assets
• Expand operating envelopes (increased production)
• Reduced risk (HSE and execution)
• Proven track record
• Proven technology
• Global presence
Note: ShawCor market share based on 2014 Revenue on a proforma basis
Market Size
• Global market $5 Billion, ShawCor share ~25%
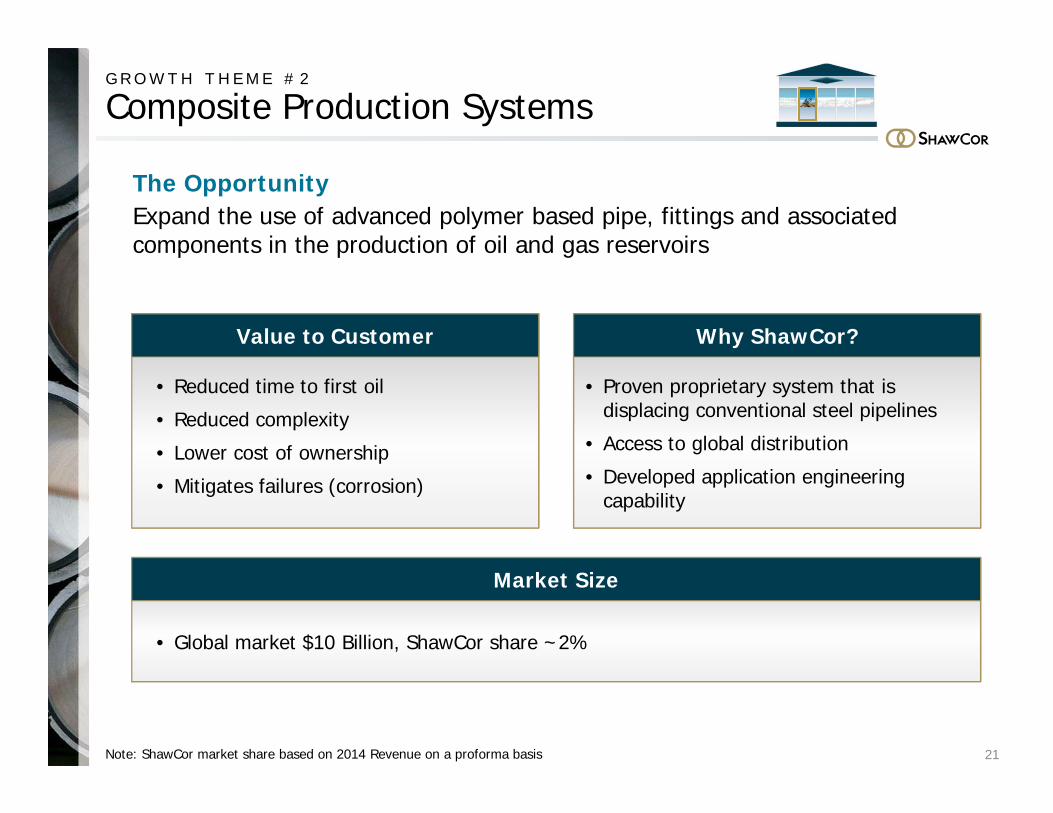
G R O W T H T H E M E # 2
Composite Production Systems
21
The OpportunityExpand the use of advanced polymer based pipe, fittings and associated components in the production of oil and gas reservoirs
Note: ShawCor market share based on 2014 Revenue on a proforma basis
Value to Customer Why ShawCor?
Market Size
• Reduced time to first oil
• Reduced complexity
• Lower cost of ownership
• Mitigates failures (corrosion)
• Proven proprietary system that is displacing conventional steel pipelines
• Access to global distribution
• Developed application engineering capability
• Global market $10 Billion, ShawCor share ~2%

Value to Customer
G R O W T H T H E M E # 3
Integrity Management
22
The OpportunityDevelop measurement and data technology and systems to enhance the operational continuity and efficiency of oil and gas infrastructure assets
• Mitigation of failures
• Quality control
• Reduce costs
• Reliable traceability
Note: ShawCor market share based on 2014 Revenue on a proforma basis
Why ShawCor?
• North American leader in pipeline weld inspection
• Established global presence
• Proprietary measurement technology
• Access to Zedi remote data monitoring and Vintri tracking capabilities
Market Size
• North America market $3.5 Billion, ShawCor share ~8%

Value to Customer
G R O W T H T H E M E # 4
Oilfield Asset Management
23
The OpportunityImprove customer’s oilfield asset utilization, especially in unconventional production, by providing asset management, inspection and repair services
• Improved return on capital employed
• Increased confidence in operational performance and asset uptime
• Cost reduction
• One-stop shop (inspection, repair, asset tracking)
Note: ShawCor market share based on 2014 Revenue on a proforma basis
Why ShawCor?
• Proven asset management systems
• Proven repair capability
• Leading market position in Canada
• Established position in large U.S. and growing Mexico markets
Market Size
• North America market $2 Billion, ShawCor share ~ 4%
Value to Customer
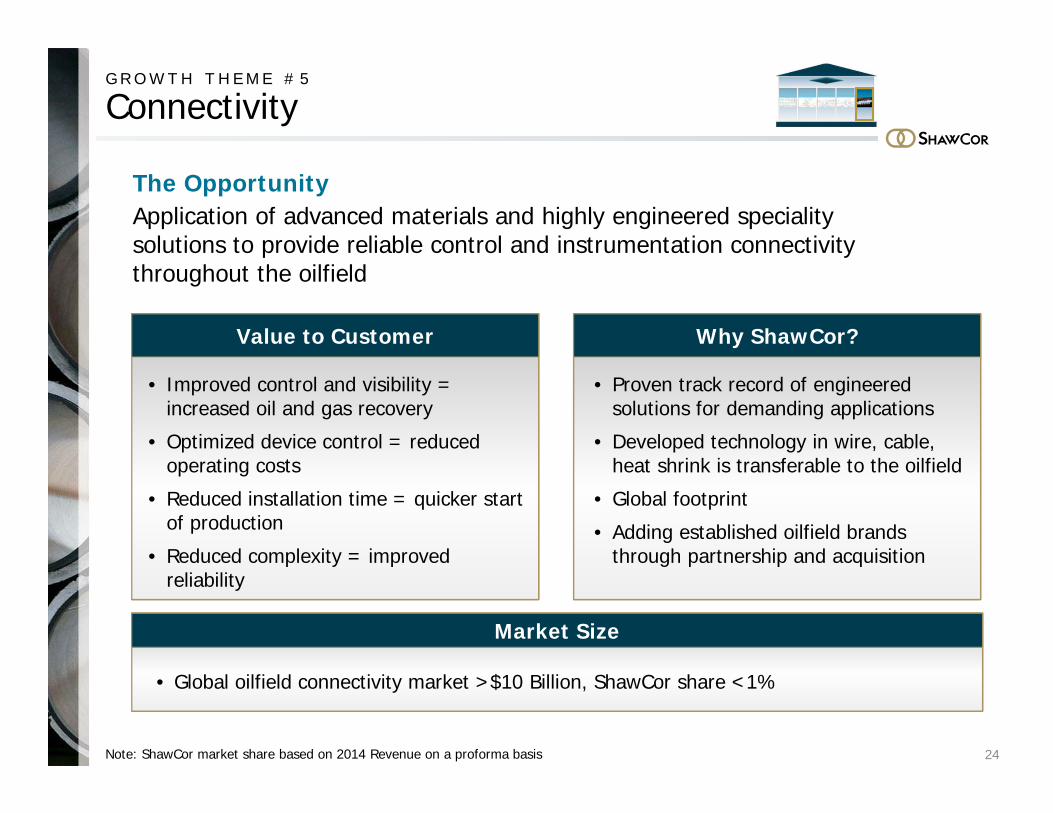
G R O W T H T H E M E # 5
Connectivity
24Note: ShawCor market share based on 2014 Revenue on a proforma basis
The OpportunityApplication of advanced materials and highly engineered speciality solutions to provide reliable control and instrumentation connectivity throughout the oilfield
• Improved control and visibility = increased oil and gas recovery
• Optimized device control = reduced operating costs
• Reduced installation time = quicker start of production
• Reduced complexity = improved reliability
Why ShawCor?
• Proven track record of engineered solutions for demanding applications
• Developed technology in wire, cable, heat shrink is transferable to the oilfield
• Global footprint
• Adding established oilfield brands through partnership and acquisition
Market Size
• Global oilfield connectivity market >$10 Billion, ShawCor share <1%

#1
A G E N D A
Global Leader: Uniquely Positioned for Growth
25
Buildingon a solid
core
Favourable industry dynamics
Leveragingand expanding
the core
Committedto strong
performance
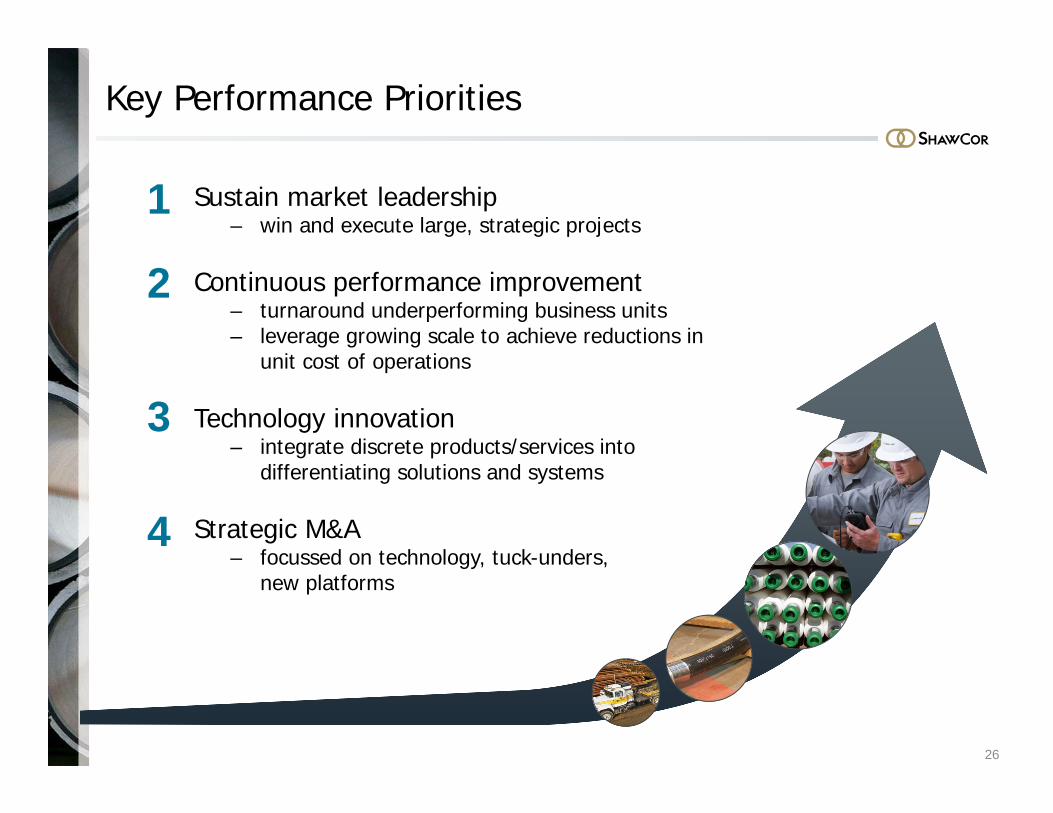
Key Performance Priorities
26
1 Sustain market leadership – win and execute large, strategic projects
2
3
4
Continuous performance improvement– turnaround underperforming business units – leverage growing scale to achieve reductions in
unit cost of operations
Technology innovation– integrate discrete products/services into
differentiating solutions and systems
Strategic M&A– focussed on technology, tuck-unders,
new platforms

Long Term Financial Goals Remain Unchanged
27
Last 5 Years Goal
ROIC over a business cycle 16.2% 15%
EPS annual growth over a business cycle 10.9% 15%
Dividend per share annual growth 18.5% 15%
Maintain strong balance sheetNet debt to capital:
Net debt to EBITDA:
00
45%1.5X

S H A W C O R V I S I O N
A Global Integrated Energy Services Company
• Revenue in excess of $4 Billion
• Leading market positions in >$30 Billion available market
• Platform of 5 focussed businesses, each >$300M
• Reduced financial performance variability through recurring revenues >85%
28
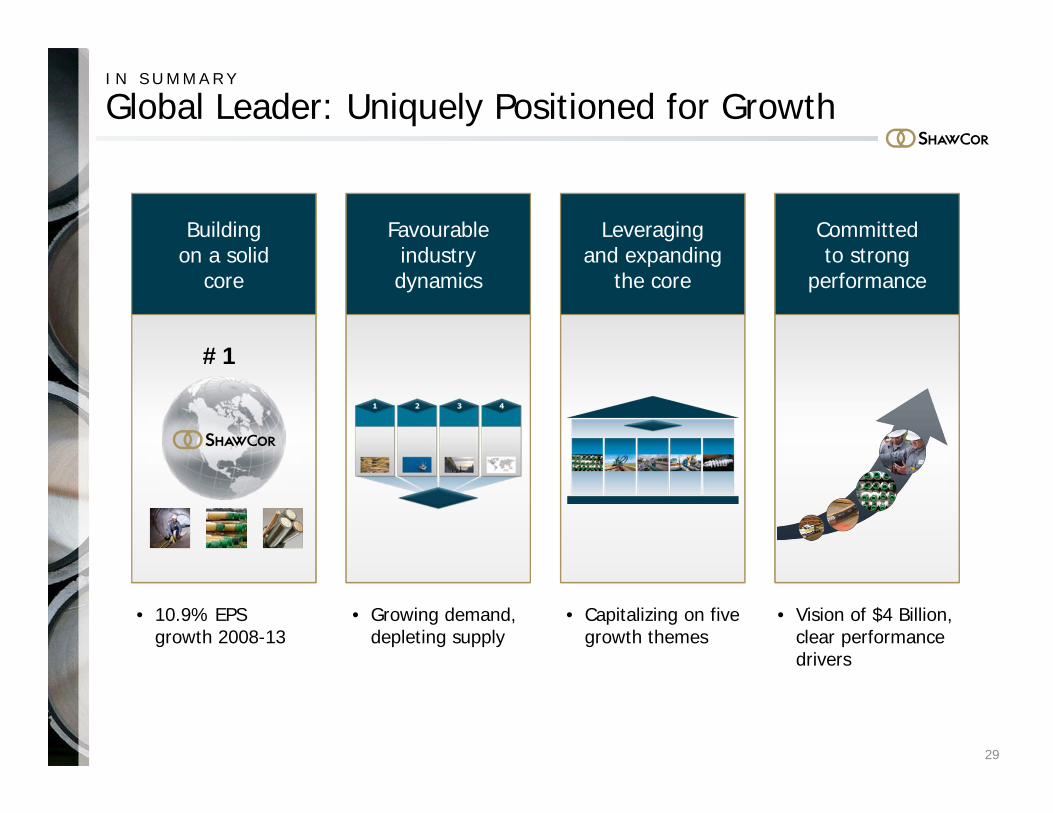
I N S U M M A R Y
Global Leader: Uniquely Positioned for Growth
29
• 10.9% EPSgrowth 2008-13
• Growing demand, depleting supply
• Vision of $4 Billion, clear performance drivers
• Capitalizing on five growth themes
#1
Buildingon a solid
core
Favourable industry dynamics
Leveragingand expanding
the core
Committedto strong
performance

STRONG FUNDAMENTALS
FUNDAMENTALSTRENGTHS
Investor PresentationSeptember 2014
30


