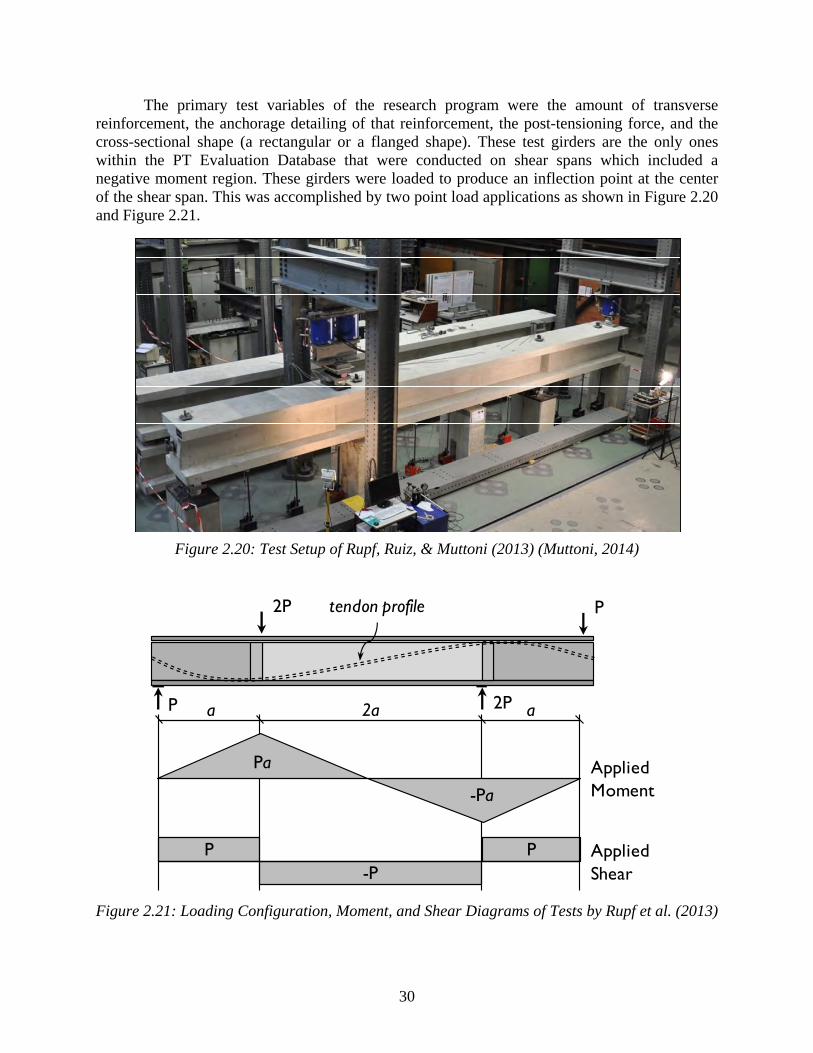
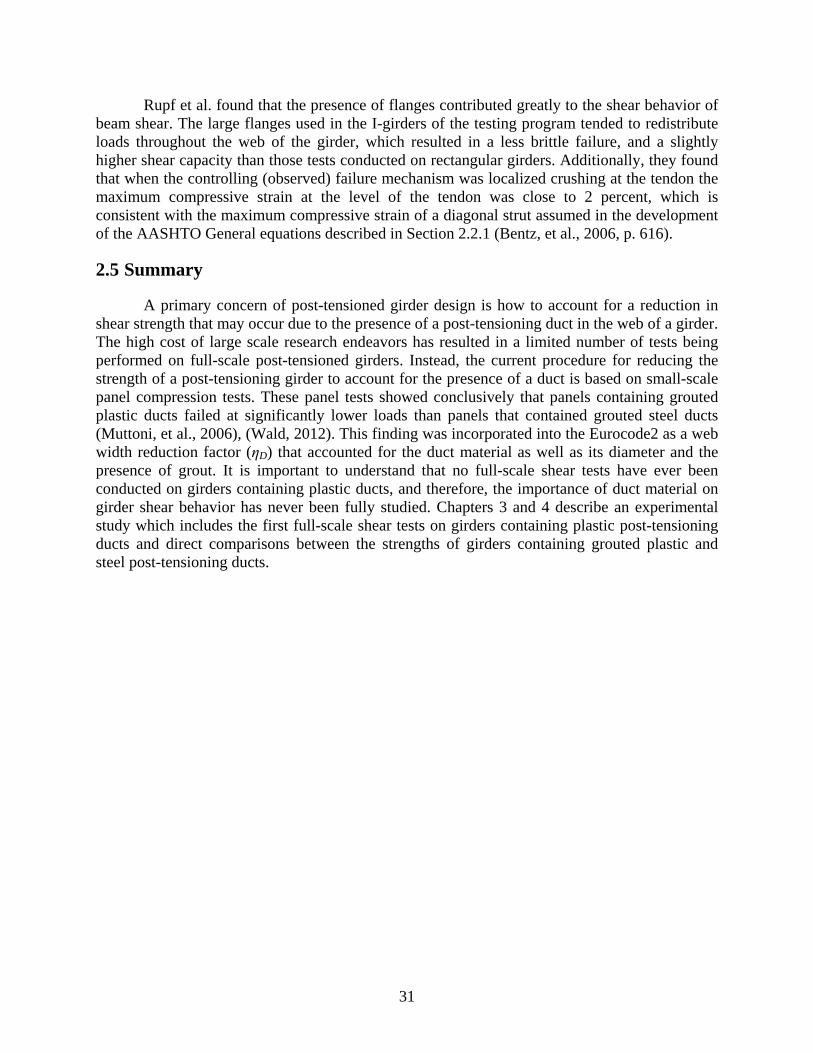
Technical Report Documentation Page 1. Report No. FHWA/TX-14/0-6652-1 2. Government Accession No. 3. Recipient’s Catalog No. 4. Title and Subtitle Shear Behavior of Spliced Post-Tensioned Girders 5. Report Date Published April 2015 6. Performing Organization Code 7. Author(s) Andrew Moore, Chris Williams, Dhiaa Al-Tarafany, James Felan, Josh Massey, Trang Nguyen, Katie Schmidt, David Wald, Oguzhan Bayrak, James Jirsa, and Wassim Ghannoum 8. Performing Organization Report No. 0-6652-1 9. Performing Organization Name and Address Center for Transportation Research The University of Texas at Austin 1616 Guadalupe Street, Suite 4.202 Austin, TX 78701 10. Work Unit No. (TRAIS) 11. Contract or Grant No. 0-6652 12. Sponsoring Agency Name and Address Texas Department of Transportation Research and Technology Implementation Office P.O. Box 5080 Austin, TX 78763-5080 13. Type of Report and Period Covered Technical Report 09/01/2010-08/31/2014 14. Sponsoring Agency Code 15. Supplementary Notes Project performed in cooperation with the Texas Department of Transportation and the Federal Highway Administration. 16. Abstract By its nature a spliced girder must contain a number of post tensioning tendons throughout its length. The focus of the experimental program described in this dissertation is the evaluation of the strength and serviceability of post- tensioned girders loaded in shear, and, more specifically, how a post-tensioning duct located in the web of a girder affects the shear transfer mechanism of a bulb-tee cross-section. Due to the limited number of tests in the literature conducted on full-scale post-tensioned girders, eleven shear tests were performed on seven prestressed concrete bulb-tee girder specimens. Of these tests, ten were conducted on specimens that contained a post-tensioning duct within their web and additional pretensioning reinforcement in their bottom and top flanges. The remaining shear test was conducted on a control specimen that did not have a post- tensioning tendon but contained the same pretensioning reinforcement as the post-tensioned girder specimens. The behavioral characteristics of these eleven test specimens at service level shear forces and at their ultimate shear strengths were evaluated in regards to five primary experimental variables: (i) the presence of a post-tensioning duct, (ii) post-tensioning duct material (plastic or steel), (iii) web-width, (iv) duct diameter, and (v) the transverse reinforcement ratio. The findings of this experimental study are described in detail within this dissertation, but can be summarized by the following two points. (i) No differences were observed in the ultimate or service level shear behavior in girders containing plastic grouted ducts when compared to those containing steel grouted ducts and (ii) The current procedure of reducing the effective web width to account for the presence of a post-tensioning duct is ineffective because it addresses the incorrect shear transfer mechanism. A method that correctly addresses the reduction in shear strength due to the presence of a post-tensioning duct was developed and verified using the tests performed during this experimental program and tests reported in the literature. 17. Key Words Prestressed Shear, Post-Tensioned Shear, Spliced Girder, Post-Tensioning Ducts, Shear 18. Distribution Statement No restrictions. This document is available to the public through the National Technical Information Service, Springfield, Virginia 22161; www.ntis.gov. 19. Security Classif. (of report) Unclassified 20. Security Classif. (of this page) Unclassified 21. No. of pages 220 22. Price Form DOT F 1700.7 (8-72) Reproduction of completed page authorized
Transcript
Technical Report Documentation Page
1. Report No. FHWA/TX-14/0-6652-1
2. Government Accession No.
3. Recipient’s Catalog No.
4. Title and Subtitle Shear Behavior of Spliced Post-Tensioned Girders
5. Report Date August 2014; Published April 2015
6. Performing Organization Code 7. Author(s) Andrew Moore, Chris Williams, Dhiaa Al-Tarafany, James Felan, Josh Massey, Trang Nguyen, Katie Schmidt, David Wald, Oguzhan Bayrak, James Jirsa, and Wassim Ghannoum
8. Performing Organization Report No. 0-6652-1
9. Performing Organization Name and Address Center for Transportation Research The University of Texas at Austin 1616 Guadalupe Street, Suite 4.202 Austin, TX 78701
10. Work Unit No. (TRAIS) 11. Contract or Grant No. 0-6652
12. Sponsoring Agency Name and Address Texas Department of Transportation Research and Technology Implementation Office P.O. Box 5080 Austin, TX 78763-5080
13. Type of Report and Period Covered Technical Report 09/01/2010-08/31/2014 14. Sponsoring Agency Code
15. Supplementary Notes Project performed in cooperation with the Texas Department of Transportation and the Federal Highway Administration. 16. Abstract By its nature a spliced girder must contain a number of post tensioning tendons throughout its length. The focus of the experimental program described in this dissertation is the evaluation of the strength and serviceability of post-tensioned girders loaded in shear, and, more specifically, how a post-tensioning duct located in the web of a girder affects the shear transfer mechanism of a bulb-tee cross-section. Due to the limited number of tests in the literature conducted on full-scale post-tensioned girders, eleven shear tests were performed on seven prestressed concrete bulb-tee girder specimens. Of these tests, ten were conducted on specimens that contained a post-tensioning duct within their web and additional pretensioning reinforcement in their bottom and top flanges. The remaining shear test was conducted on a control specimen that did not have a post-tensioning tendon but contained the same pretensioning reinforcement as the post-tensioned girder specimens. The behavioral characteristics of these eleven test specimens at service level shear forces and at their ultimate shear strengths were evaluated in regards to five primary experimental variables: (i) the presence of a post-tensioning duct, (ii) post-tensioning duct material (plastic or steel), (iii) web-width, (iv) duct diameter, and (v) the transverse reinforcement ratio. The findings of this experimental study are described in detail within this dissertation, but can be summarized by the following two points. (i) No differences were observed in the ultimate or service level shear behavior in girders containing plastic grouted ducts when compared to those containing steel grouted ducts and (ii) The current procedure of reducing the effective web width to account for the presence of a post-tensioning duct is ineffective because it addresses the incorrect shear transfer mechanism. A method that correctly addresses the reduction in shear strength due to the presence of a post-tensioning duct was developed and verified using the tests performed during this experimental program and tests reported in the literature. 17. Key Words Prestressed Shear, Post-Tensioned Shear, Spliced Girder, Post-Tensioning Ducts, Shear
18. Distribution Statement No restrictions. This document is available to the public through the National Technical Information Service, Springfield, Virginia 22161; www.ntis.gov.
19. Security Classif. (of report) Unclassified
20. Security Classif. (of this page) Unclassified
21. No. of pages 220
22. Price
Form DOT F 1700.7 (8-72) Reproduction of completed page authorized
Shear Behavior of Spliced Post-Tensioned Girders Andrew Moore Chris Williams Dhiaa Al-Tarafany James Felan Josh Massey Trang Nguyen Katie Schmidt David Wald Oguzhan Bayrak James Jirsa Wassim Ghannoum
CTR Technical Report: 0-6652-1 Report Date: August 2014 Project: 0-6652 Project Title: Spliced Tx Girder Bridges Sponsoring Agency: Texas Department of Transportation Performing Agency: Center for Transportation Research at The University of Texas at Austin
Project performed in cooperation with the Texas Department of Transportation and the Federal Highway Administration.
iv
Center for Transportation Research The University of Texas at Austin 1616 Guadalupe, Suite 4.202 Austin, TX 78701 http://ctr.utexas.edu/
v
Disclaimers Author's Disclaimer: The contents of this report reflect the views of the authors, who
are responsible for the facts and the accuracy of the data presented herein. The contents do not necessarily reflect the official view or policies of the Federal Highway Administration or the Texas Department of Transportation (TxDOT). This report does not constitute a standard, specification, or regulation.
Patent Disclaimer: There was no invention or discovery conceived or first actually reduced to practice in the course of or under this contract, including any art, method, process, machine manufacture, design or composition of matter, or any new useful improvement thereof, or any variety of plant, which is or may be patentable under the patent laws of the United States of America or any foreign country.
Engineering Disclaimer NOT INTENDED FOR CONSTRUCTION, BIDDING, OR PERMIT PURPOSES.
Project Engineer: Oguzhan Bayrak Professional Engineer License State and Number: Texas No. 106598
P. E. Designation: Research Supervisor
vi
Acknowledgments The authors are grateful to the Texas Department of Transportation (TxDOT) for
providing the funds to conduct this research study. The contributions of the Project Monitoring Committee – Darrin Jenson, Greg Turco, Alanna Bettis, Leon Flournoy, and Michael Hyzak – are deeply appreciated.
2.2.1 AASHTO General Procedure ........................................................................................ 4 2.2.1.1 Effective Web Width Reduction in the AASHTO General Procedure ................... 8 2.2.1.2 Shear Stress Limitation in the AASHTO General Procedure ................................. 9
2.2.2 AASHTO (2013) Shear Design Provisions for Segmental Bridges .............................. 9 2.2.3 Effective Web Width Reduction in AASHTO (2013) Segmental ............................... 11 2.2.4 AASHTO (2013): Maximum Duct Diameter to Web Width Ratio ............................. 11 2.2.5 ACI 318-11 Simplified Method for Concrete Contribution to Shear Strength ............ 12 2.2.6 ACI 318-11 Detailed Method for Concrete Contribution ............................................ 12 2.2.7 ACI 318-11 Steel Contribution to Shear Strength ....................................................... 13
2.3 Web Width Reduction Factors ............................................................................................ 13 2.3.1 Code Approach to Web Width Reduction ................................................................... 13 2.3.2 Panel Test Research ..................................................................................................... 15 2.3.3 Recent Panels Tests: Muttoni, Burdet, & Hars (2006) ................................................ 15 2.3.4 Panel Test Research Conducted at FSEL ..................................................................... 16 2.3.5 Panel Test Database Evaluation of Code Effective Web Width Equations ................. 17 2.3.6 Other Approaches to Shear Strength Reduction (Kuchma, 2013) ............................... 19
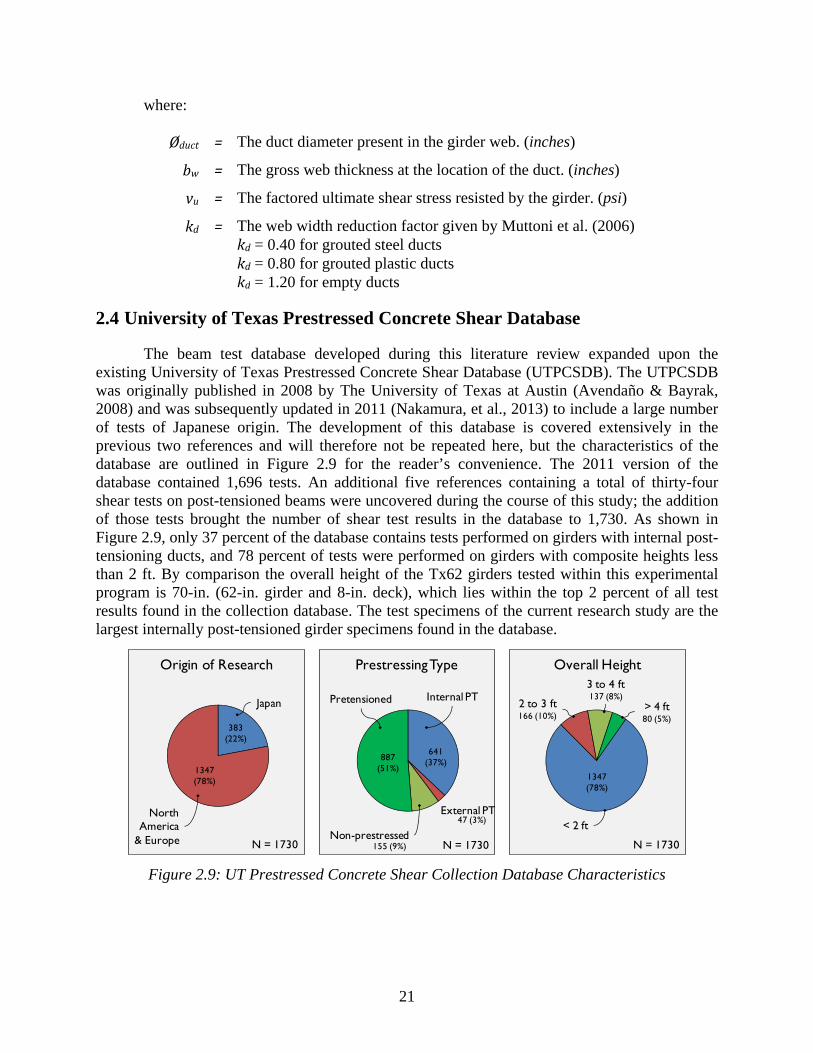
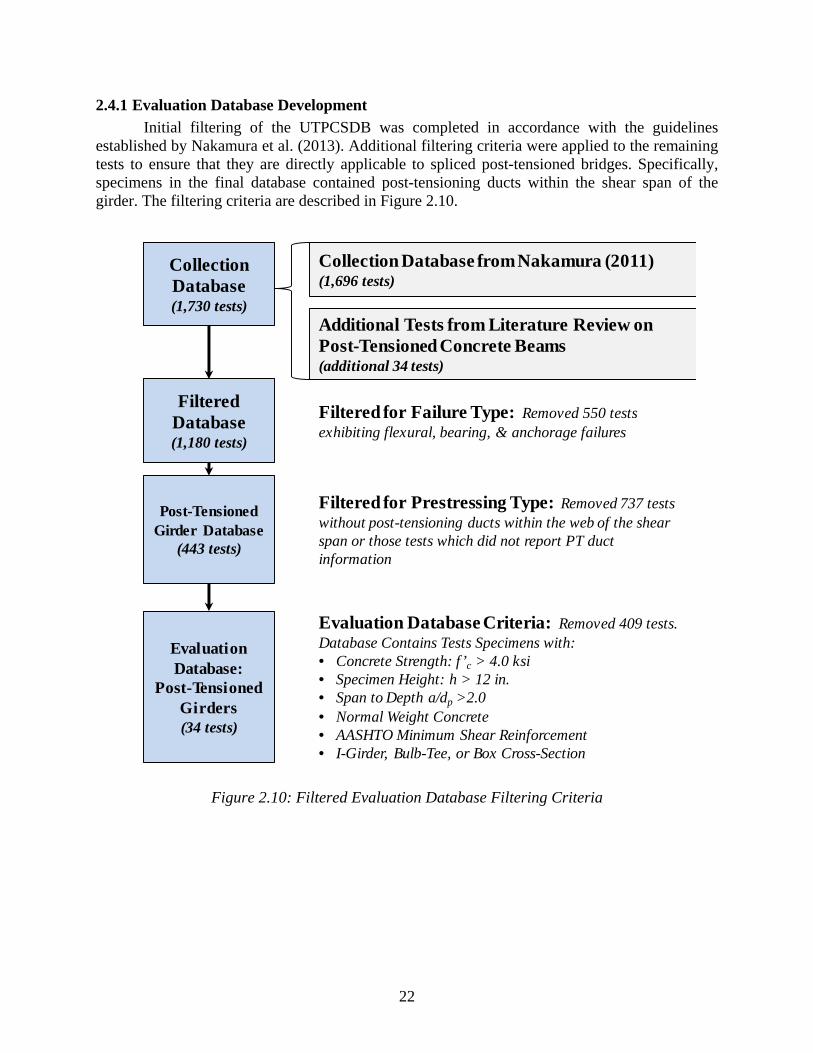
2.4 University of Texas Prestressed Concrete Shear Database ................................................. 21 2.4.1 Evaluation Database Development .............................................................................. 22 2.4.2 Evaluation Database Characteristics ............................................................................ 23
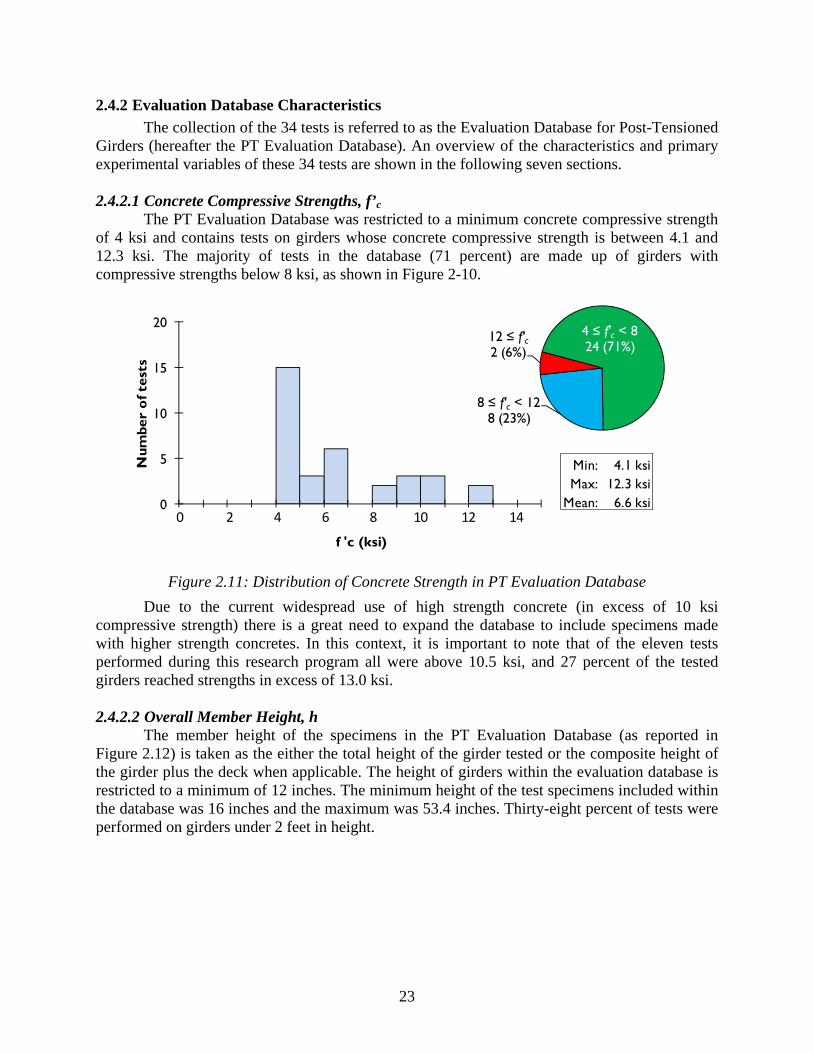
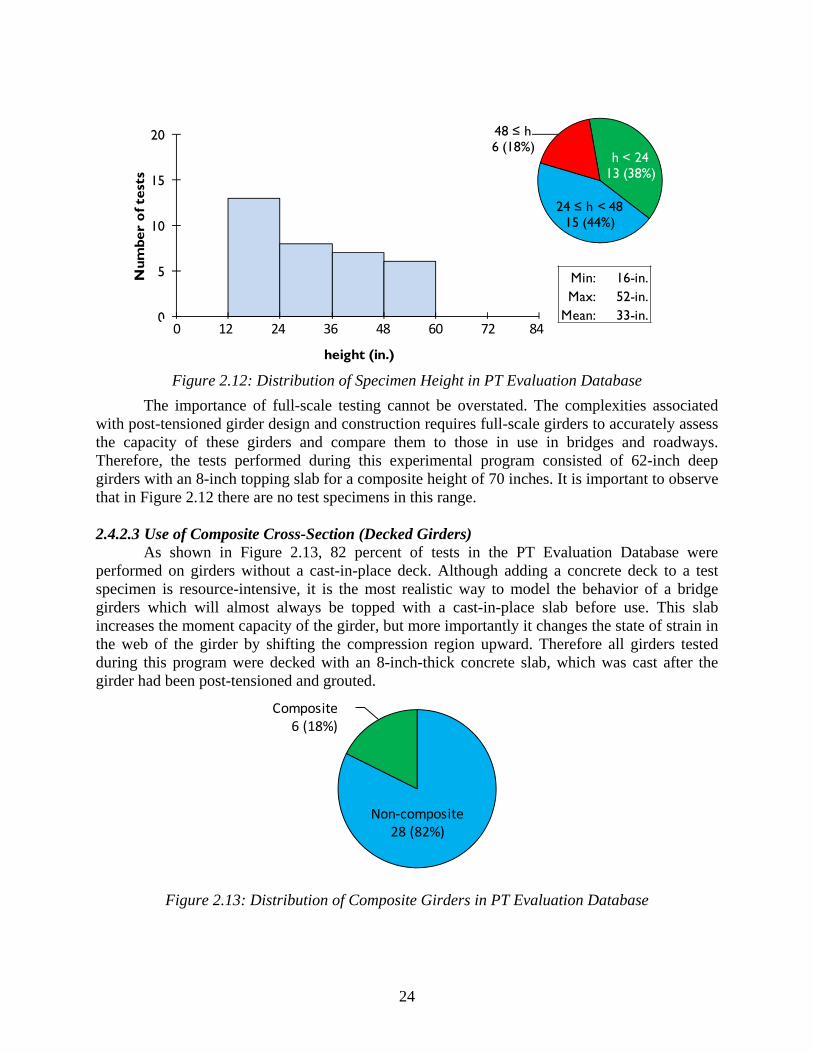
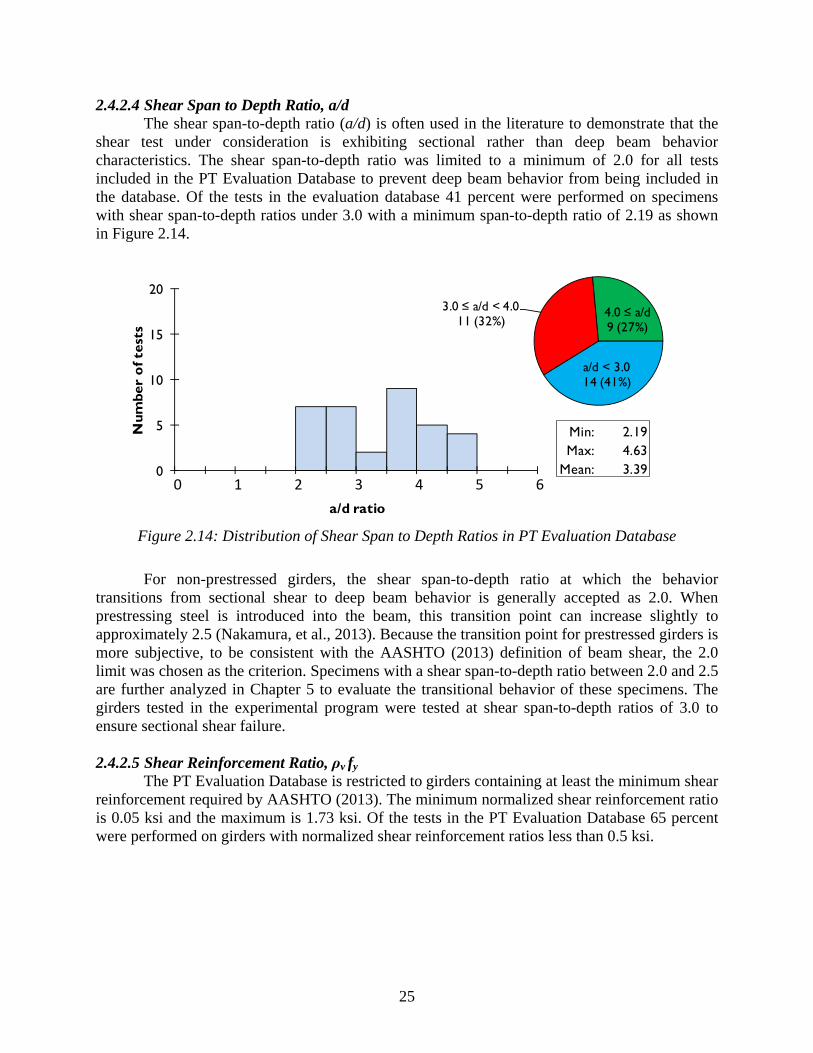
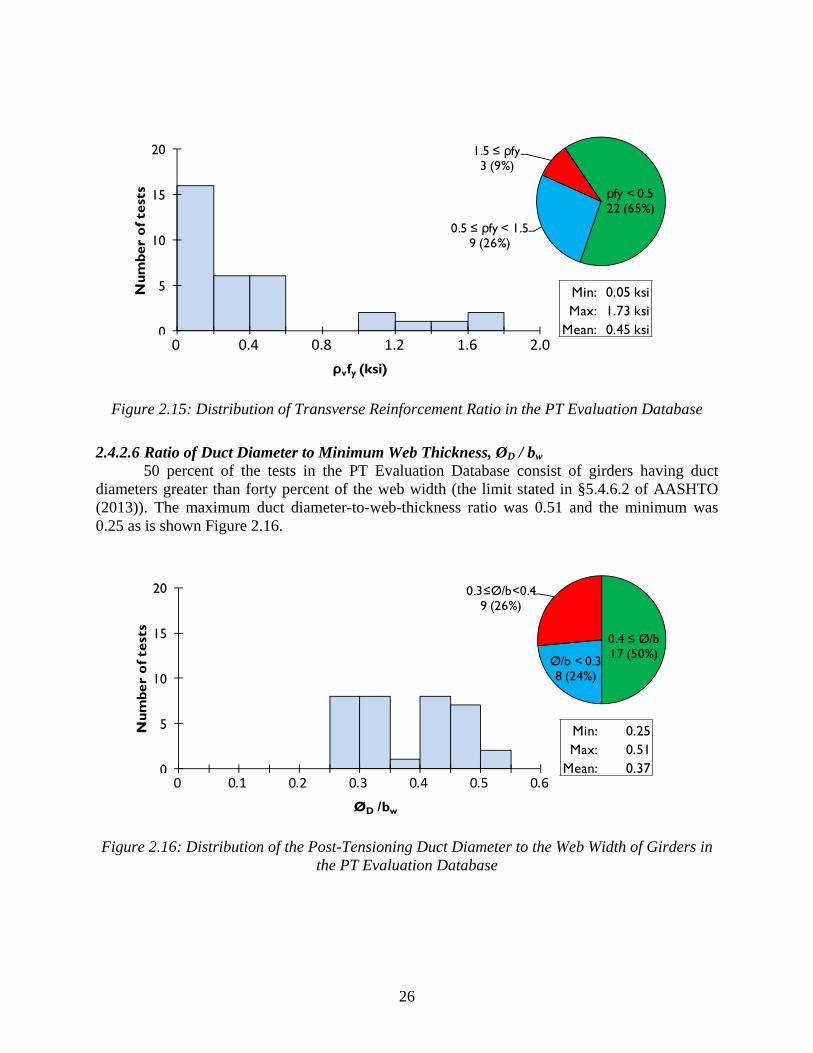
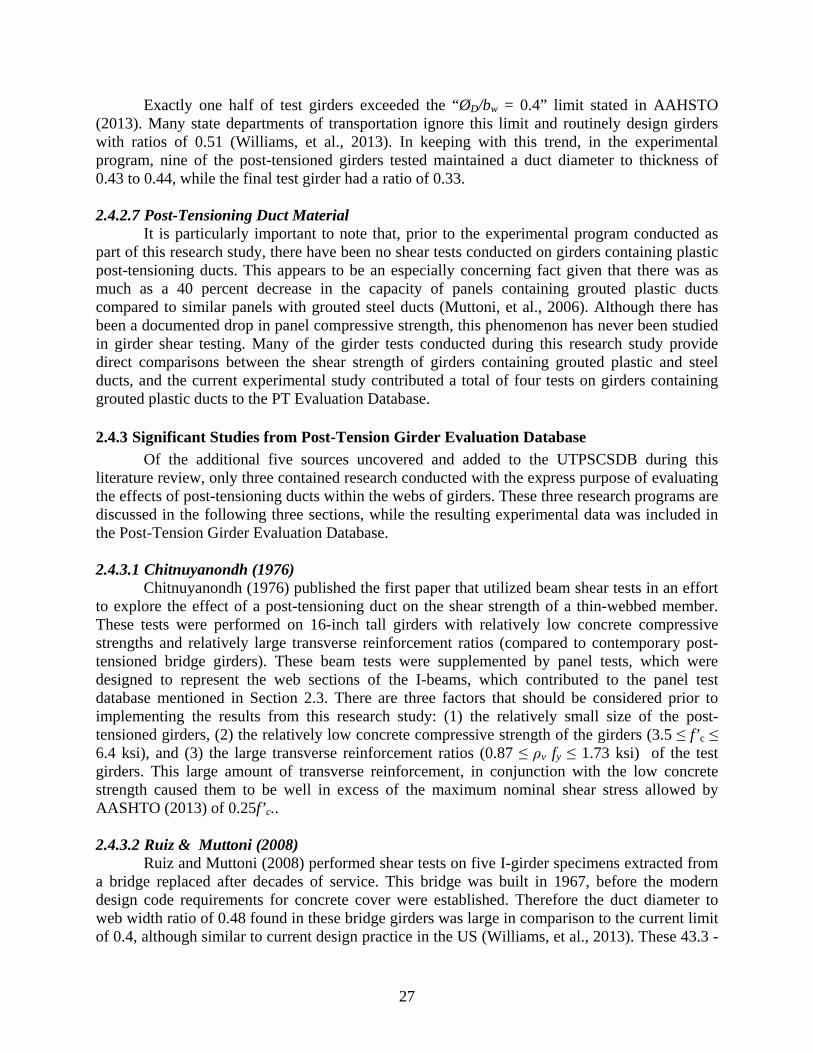
2.4.2.1 Concrete Compressive Strengths, f’c .................................................................... 23 2.4.2.2 Overall Member Height, h .................................................................................... 23 2.4.2.3 Use of Composite Cross-Section (Decked Girders) ............................................. 24 2.4.2.4 Shear Span to Depth Ratio, a/d ............................................................................. 25 2.4.2.5 Shear Reinforcement Ratio, ρv fy .......................................................................... 25 2.4.2.6 Ratio of Duct Diameter to Minimum Web Thickness, ØD / bw ............................ 26 2.4.2.7 Post-Tensioning Duct Material ............................................................................. 27
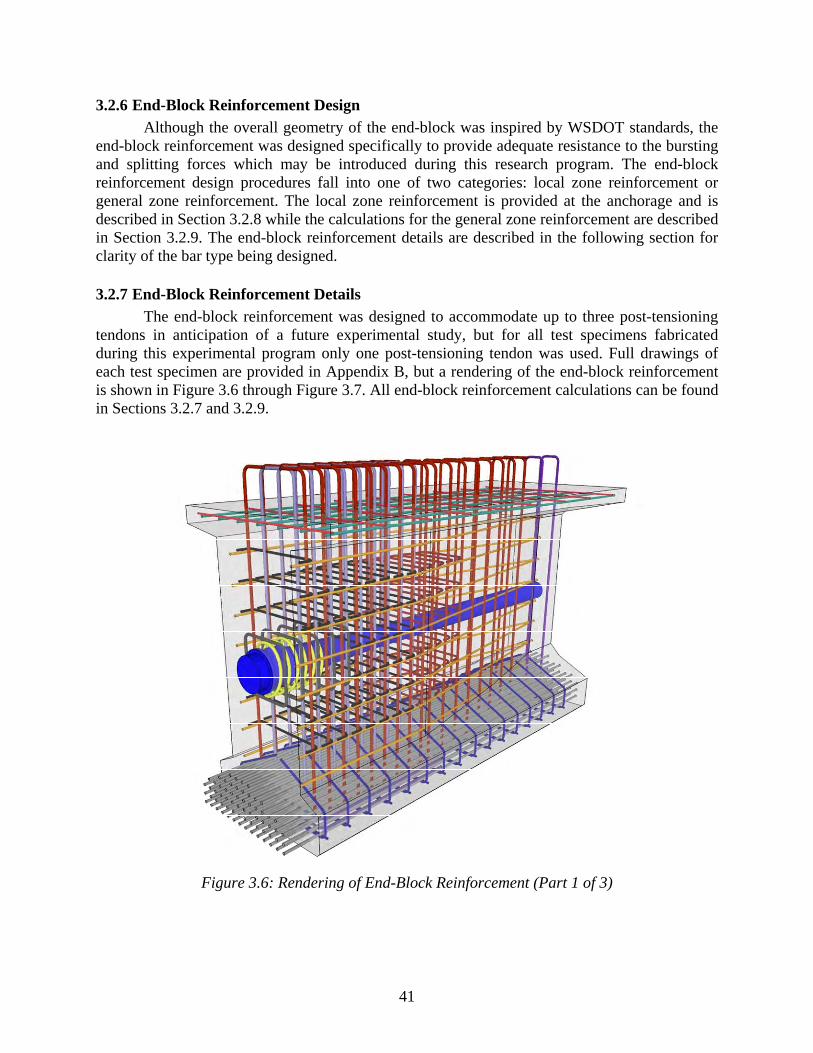
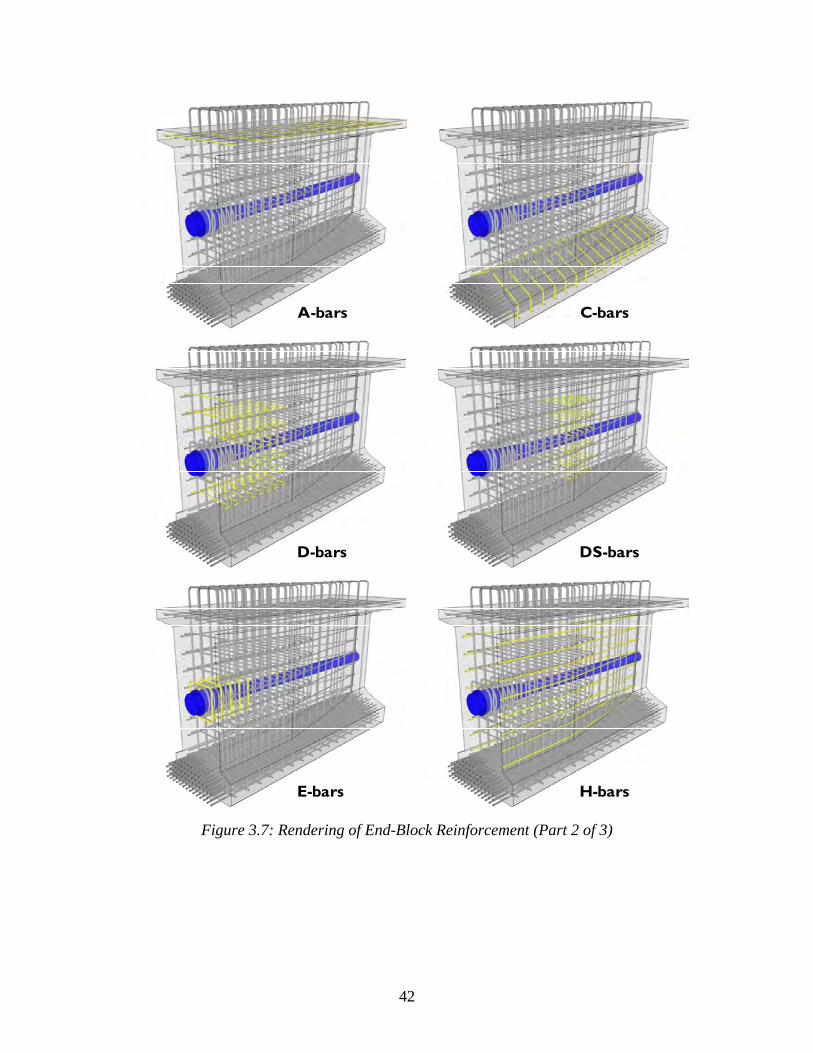
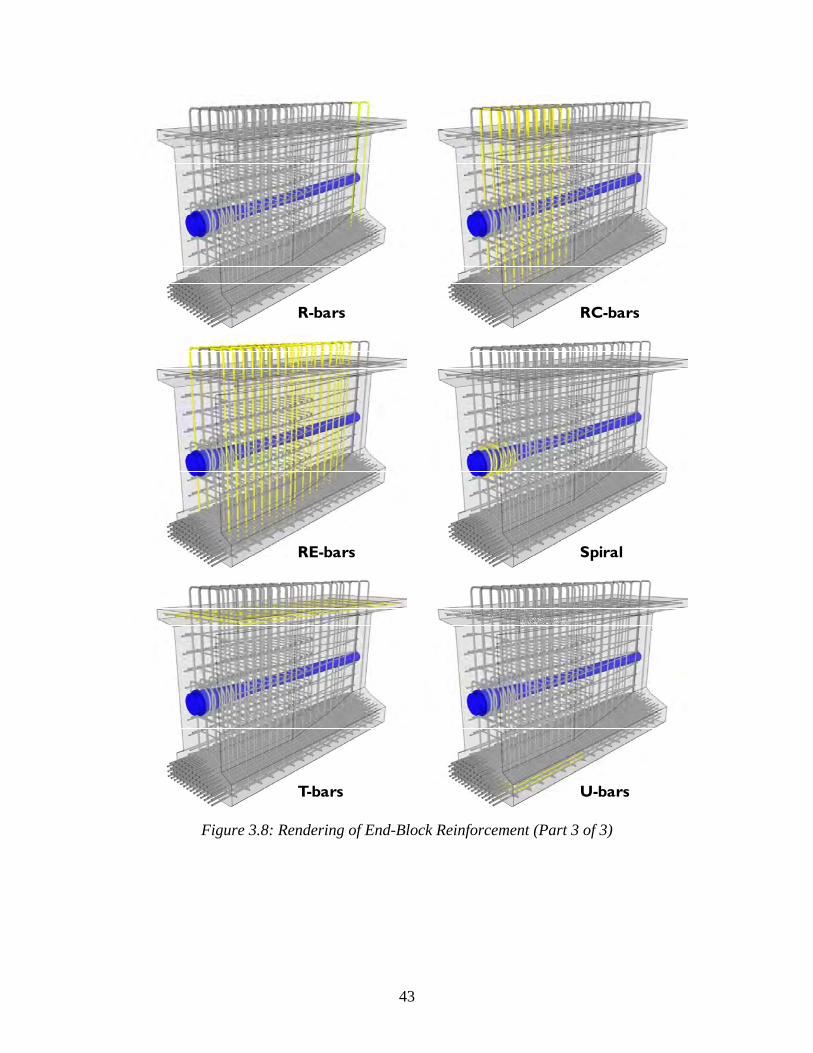
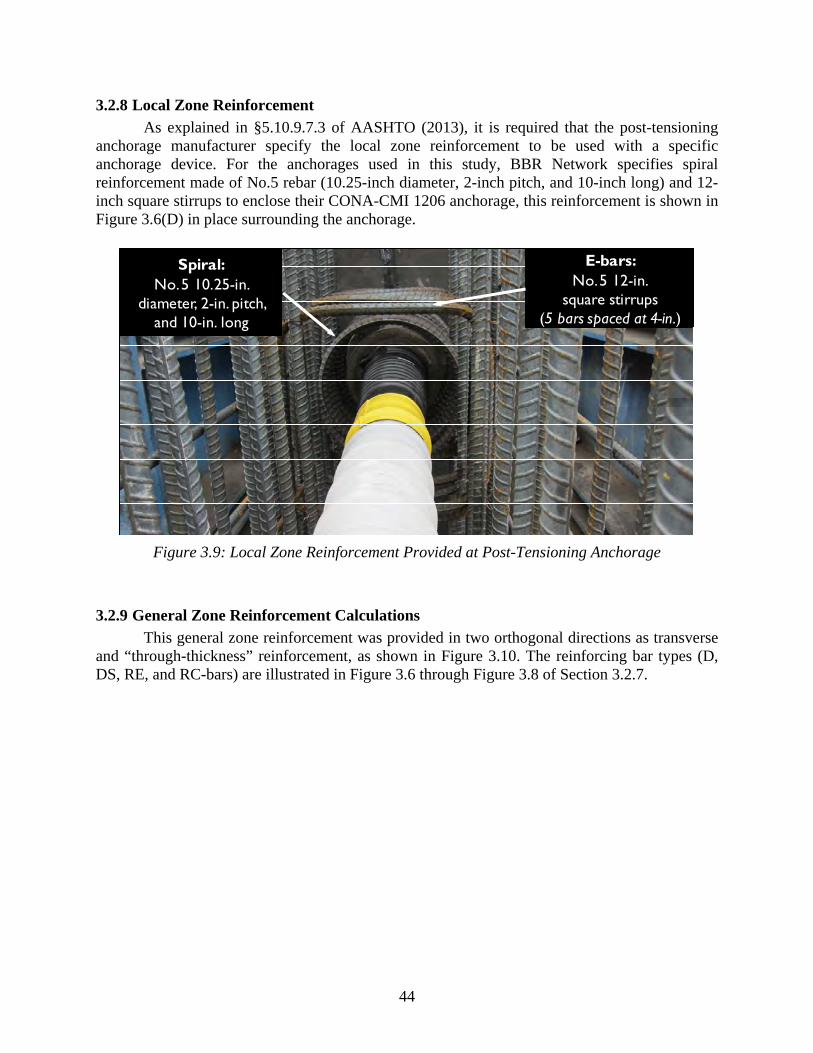
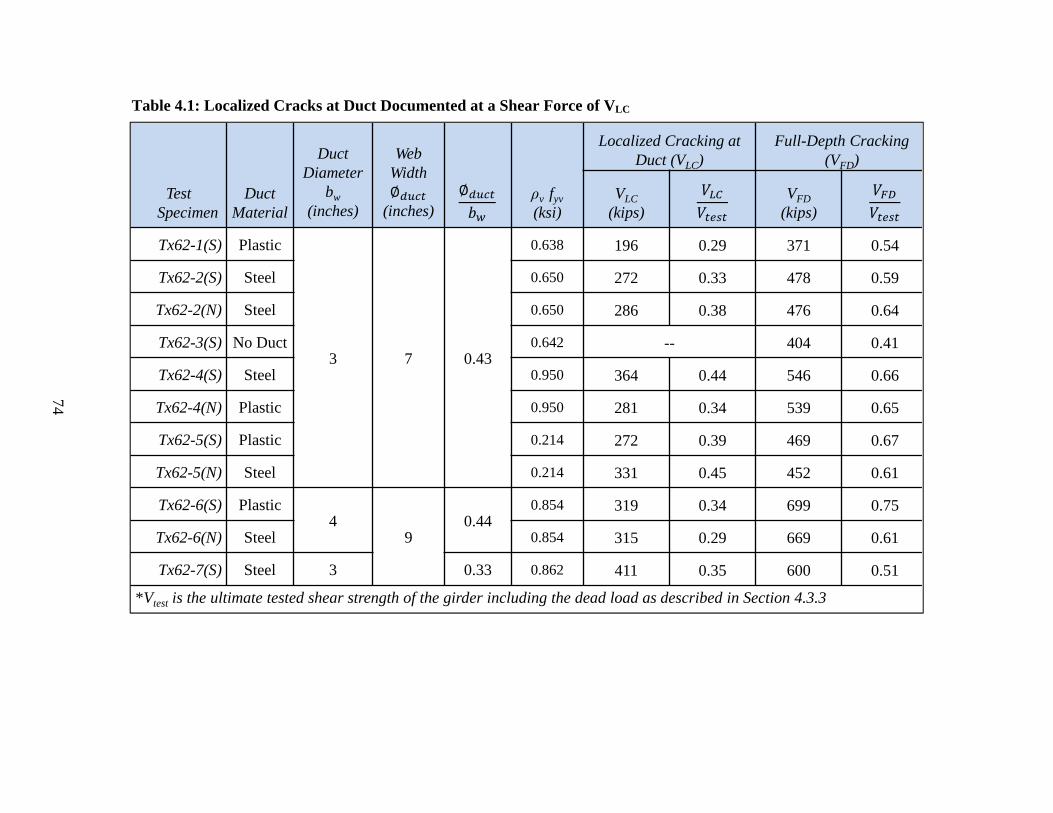
4.1 Introduction ......................................................................................................................... 71 4.2 Summary of Service Level Shear Behavior ........................................................................ 71 4.3 Summary of Strength Data.................................................................................................. 75
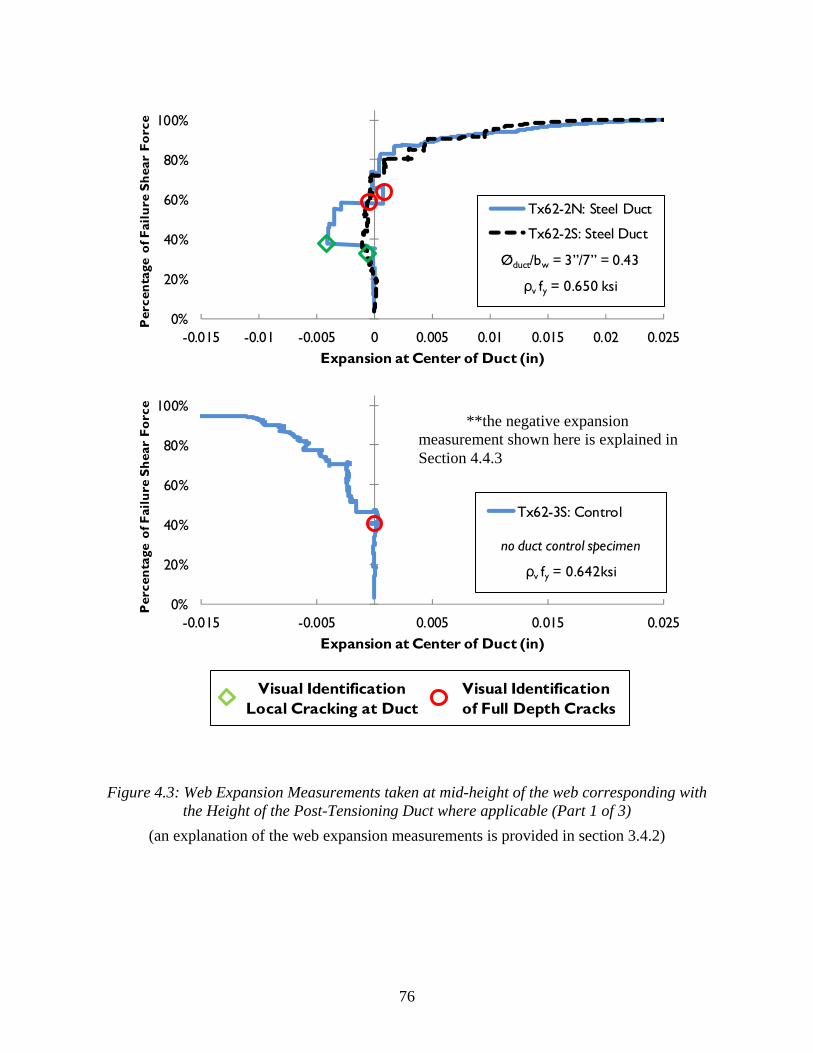
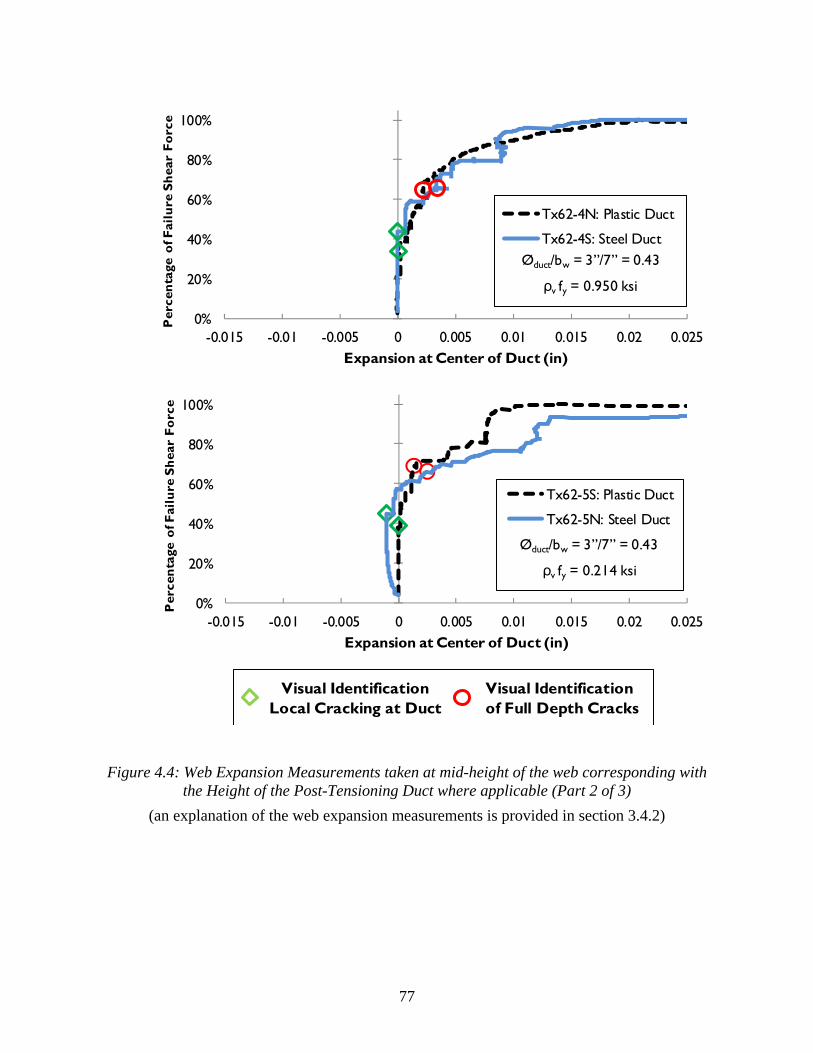
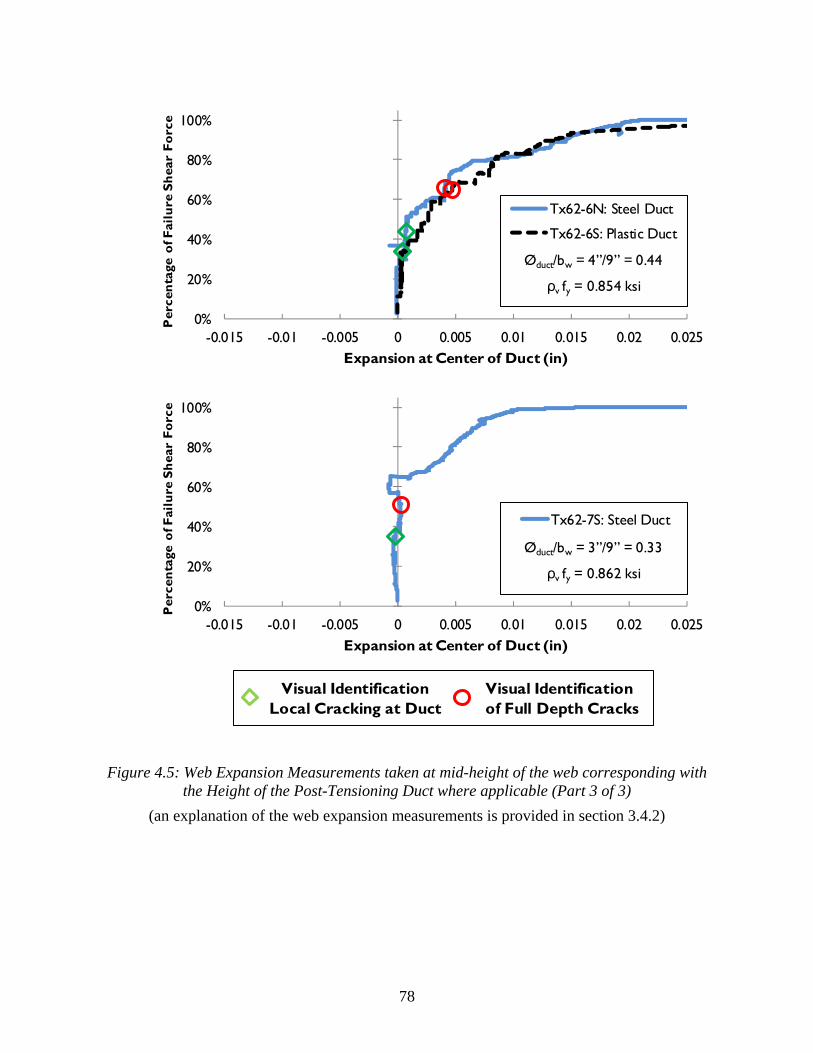
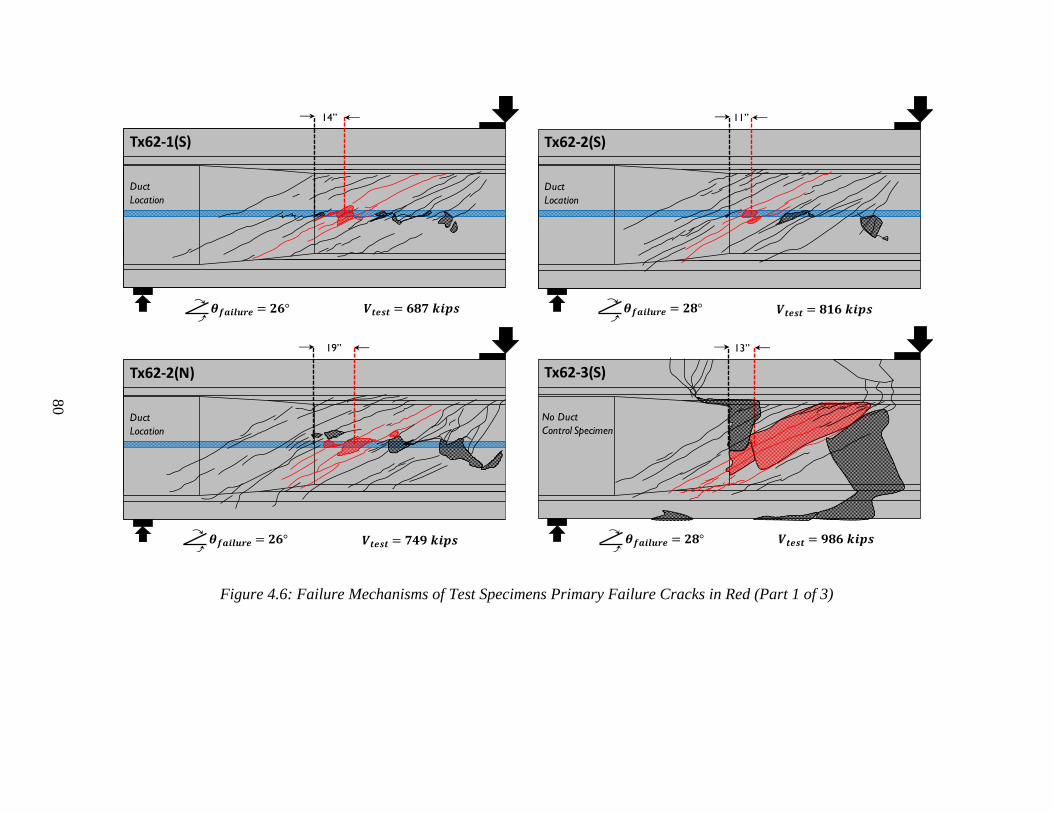
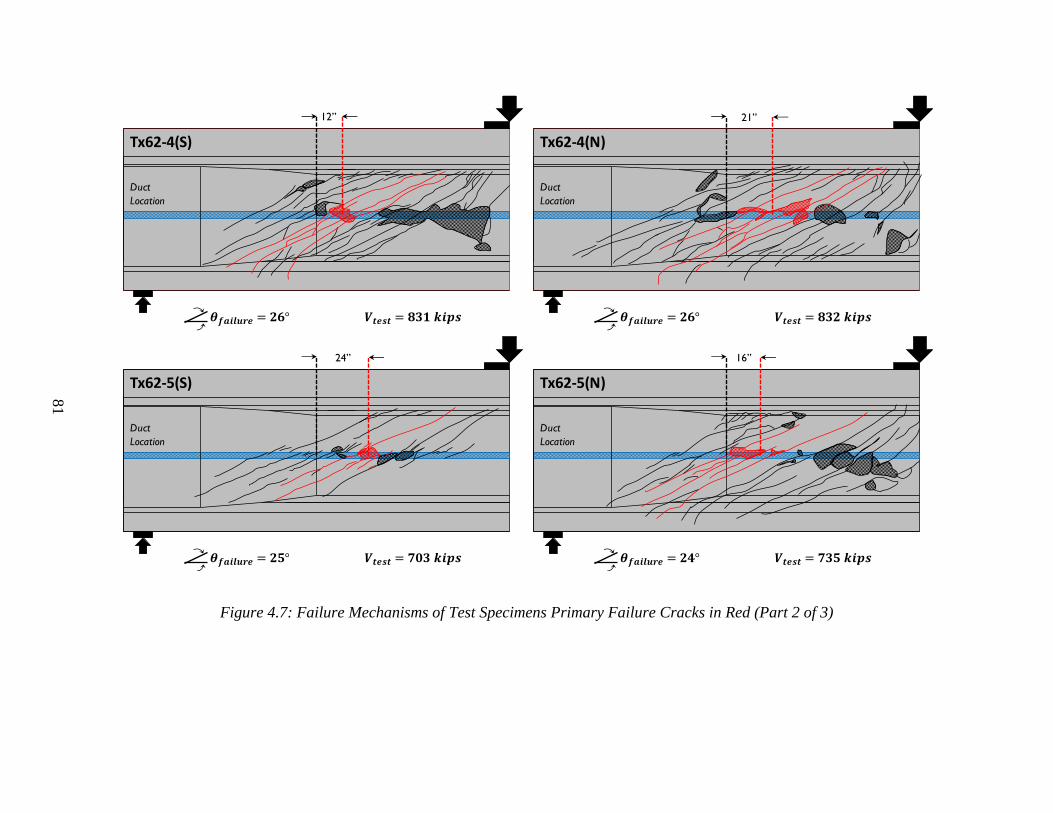
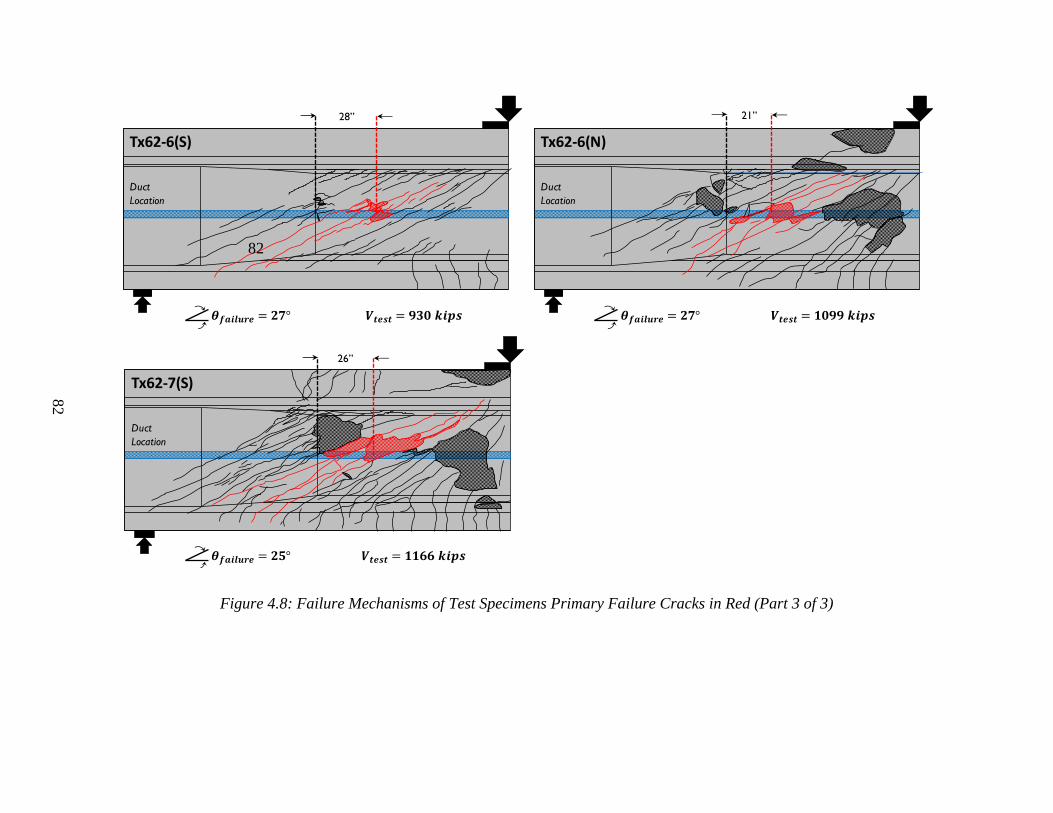
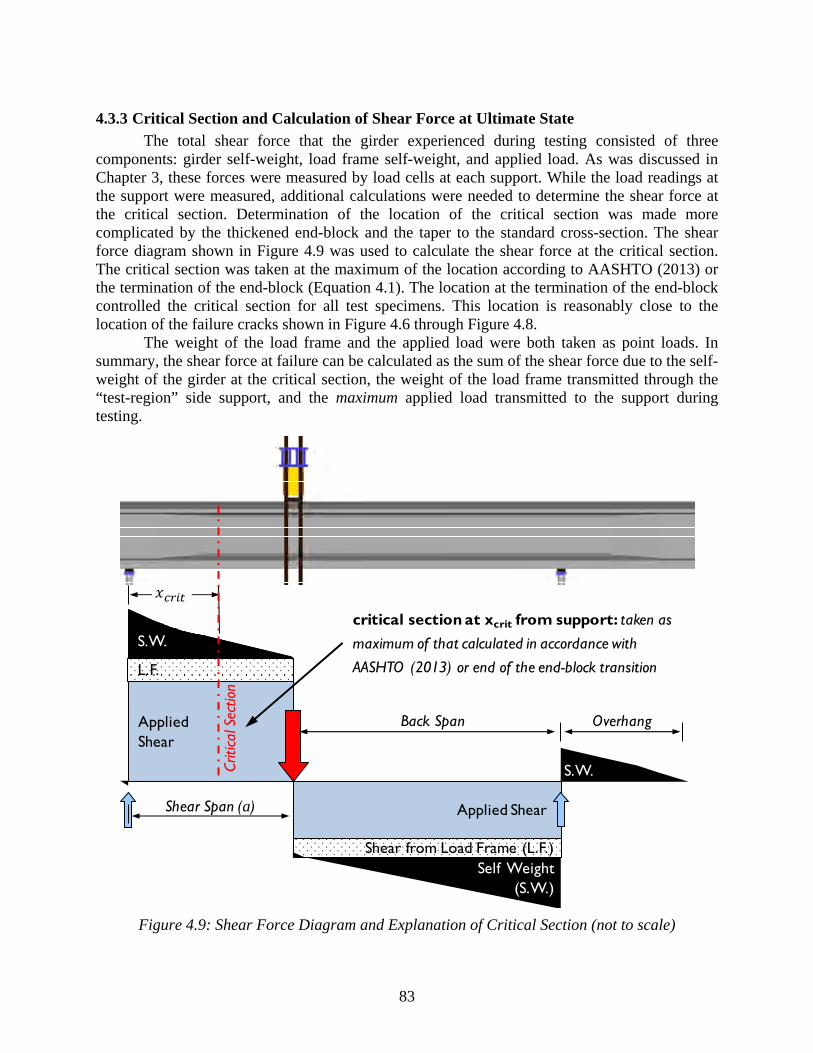
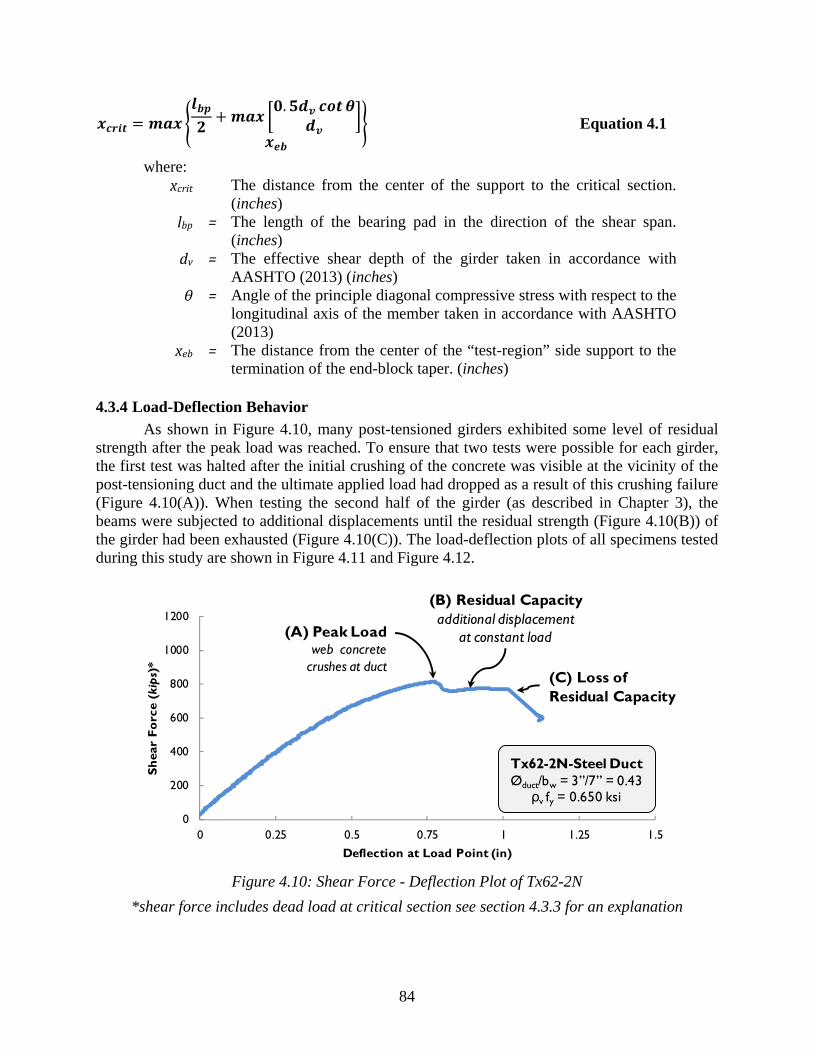
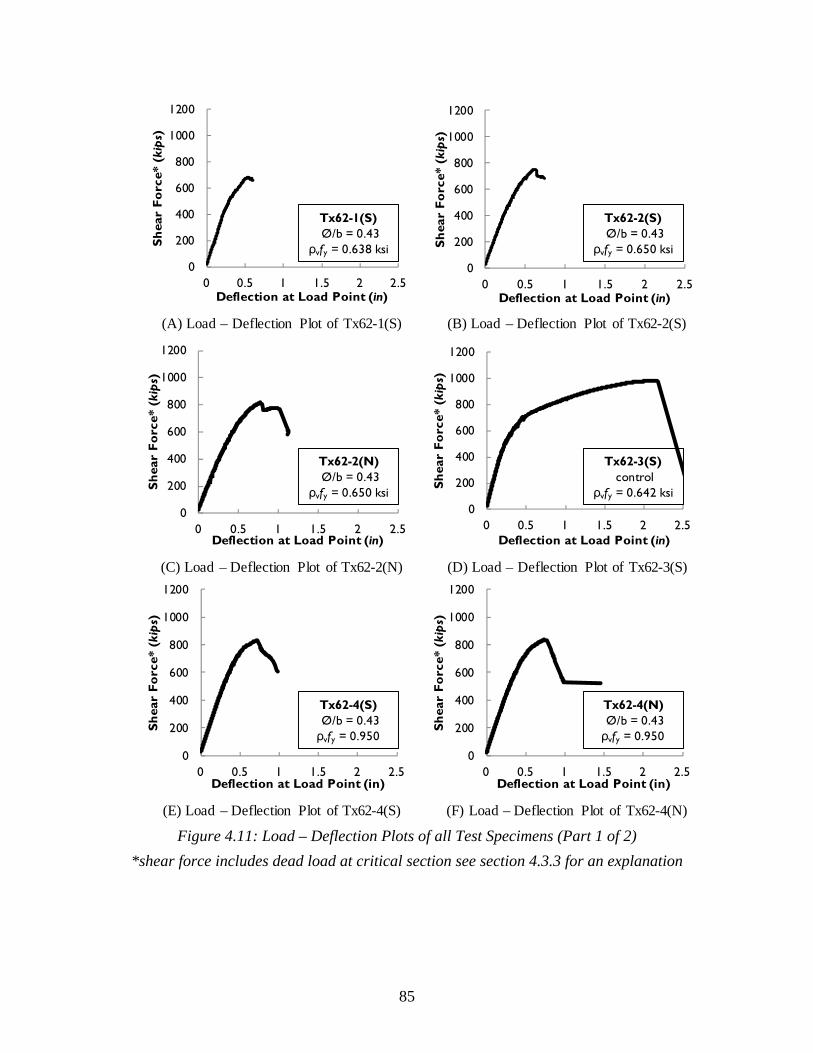
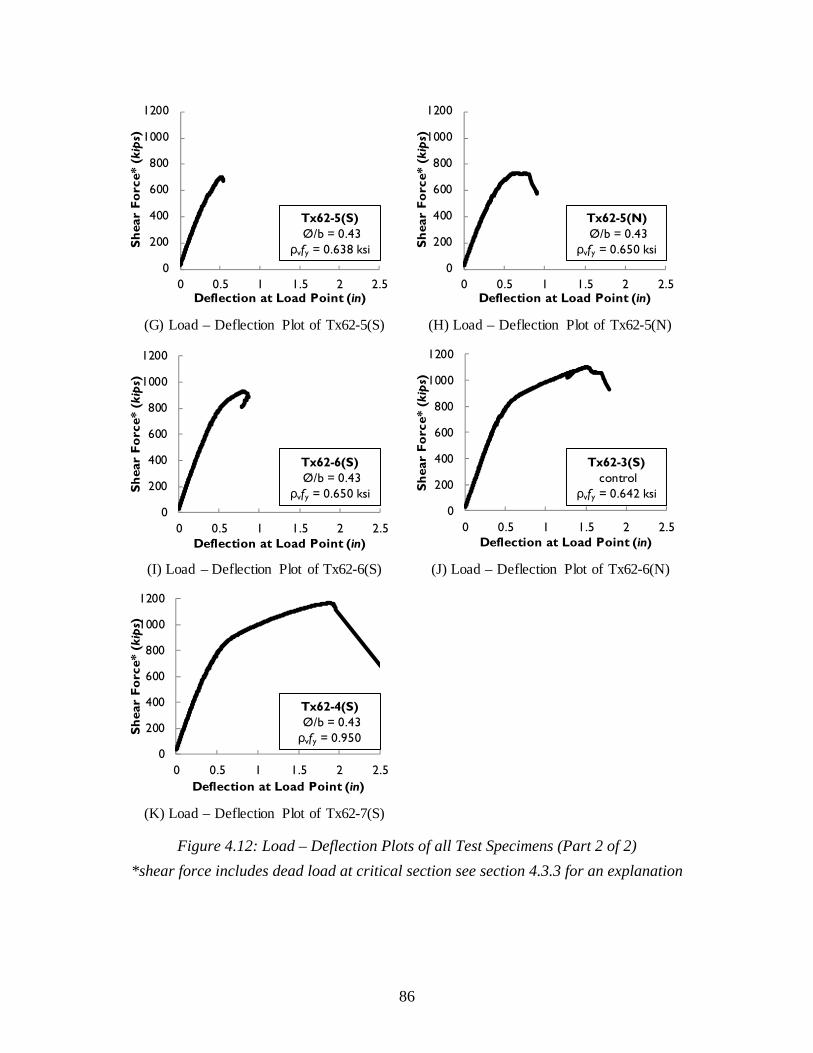
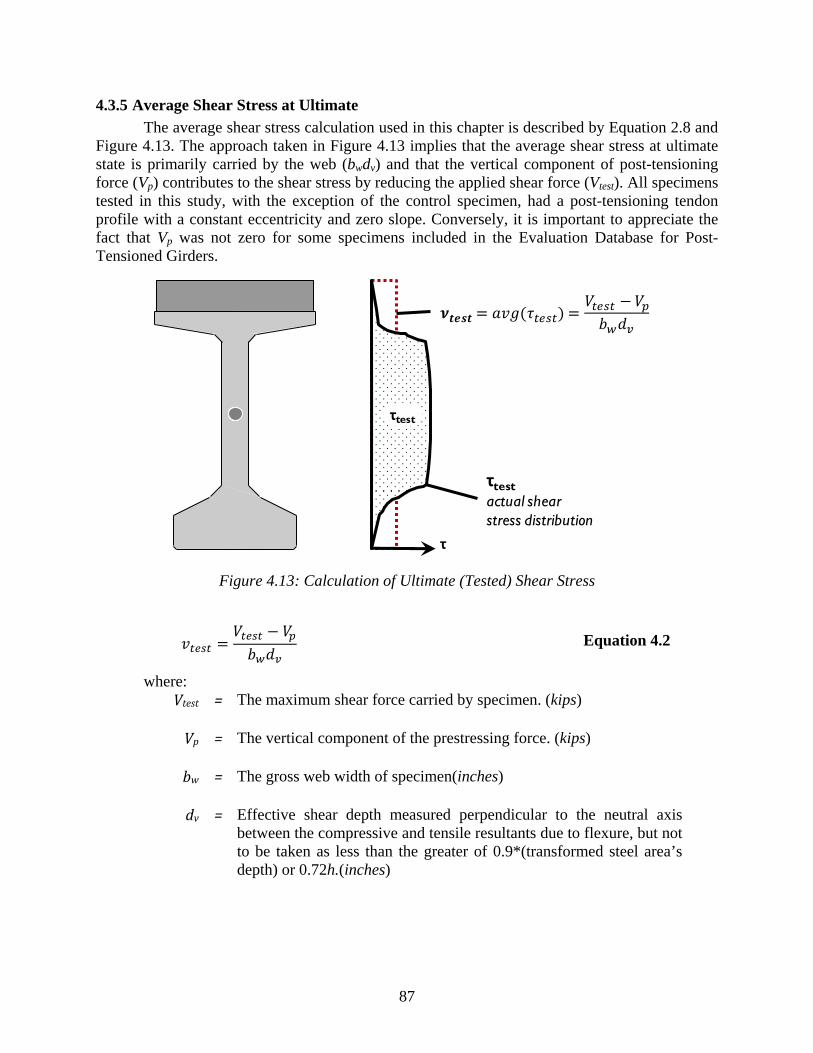
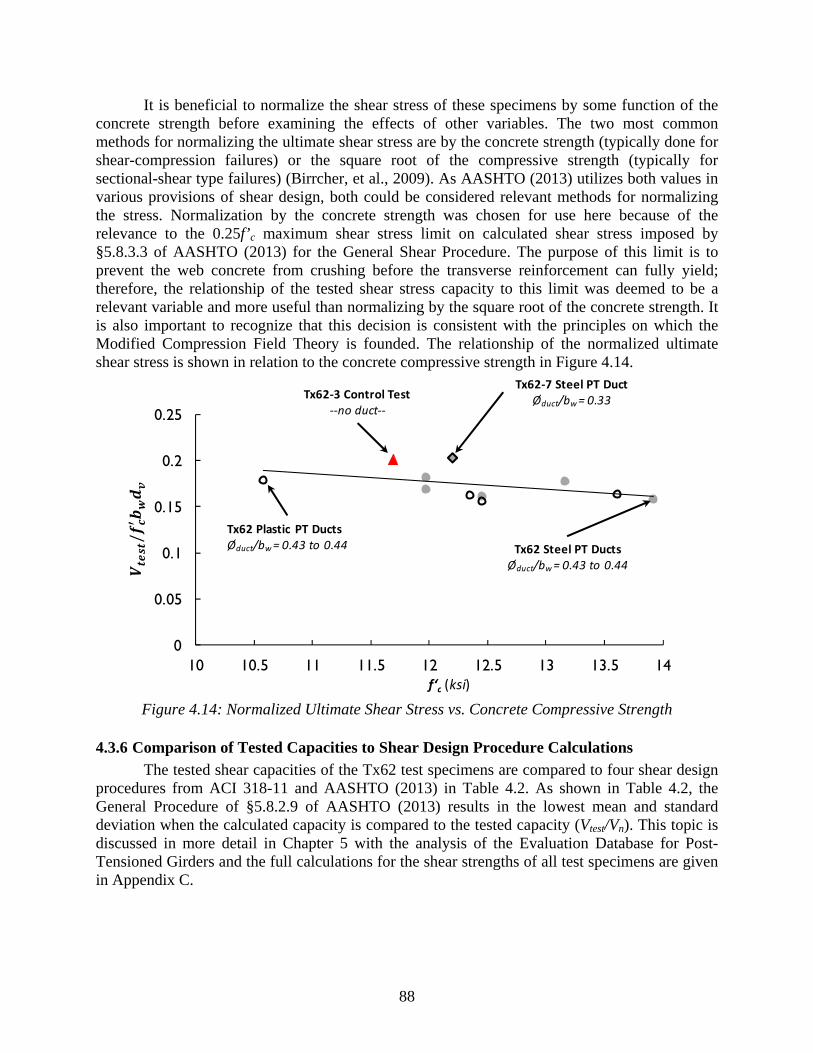
4.3.1 Web Expansion Measurements .................................................................................... 75 4.3.2 Shear-Compression Failure Mechanism ...................................................................... 79 4.3.3 Critical Section and Calculation of Shear Force at Ultimate State .............................. 83 4.3.4 Load-Deflection Behavior ........................................................................................... 84 4.3.5 Average Shear Stress at Ultimate ................................................................................ 87 4.3.6 Comparison of Tested Capacities to Shear Design Procedure Calculations ................ 88
4.4 Presence of a Post-Tensioning Duct ................................................................................... 90
ix
4.4.1 Service Level Shear Behavior ...................................................................................... 90 4.4.2 Shear Failure Mechanism ............................................................................................ 91 4.4.3 Shear-Compression Failure at Duct of Post-Tensioned Girders .................................. 93 4.4.4 Web Expansion Measurements .................................................................................... 94
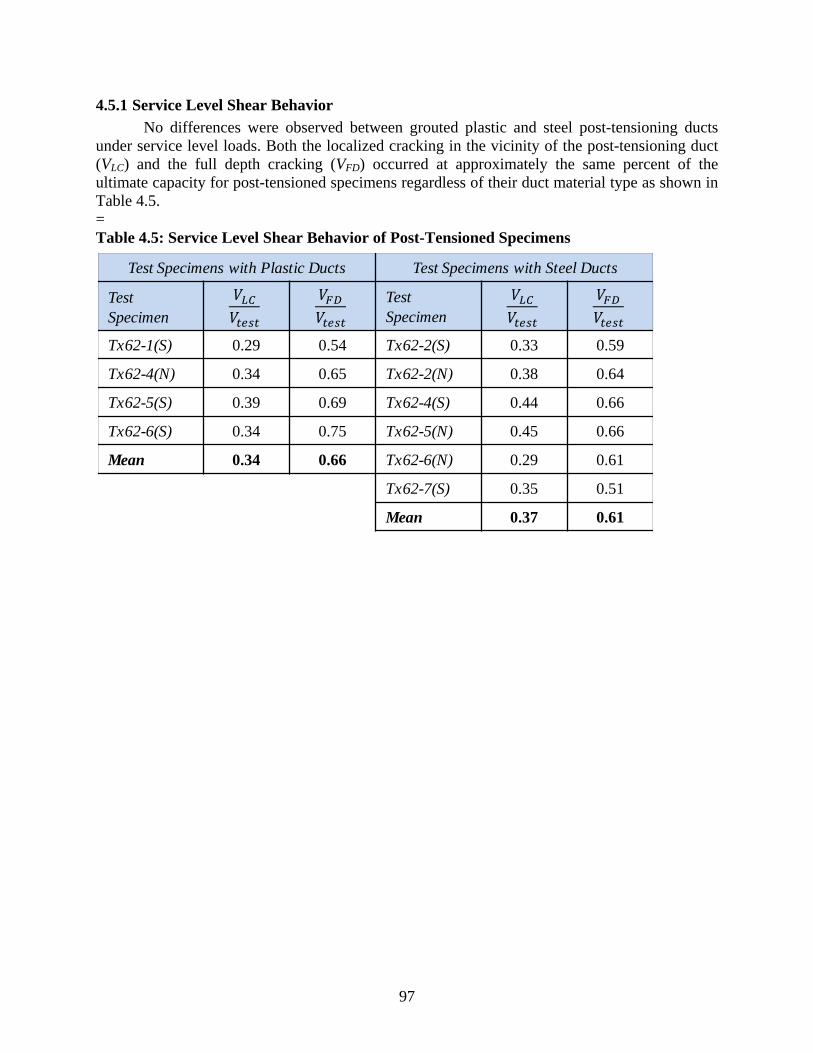
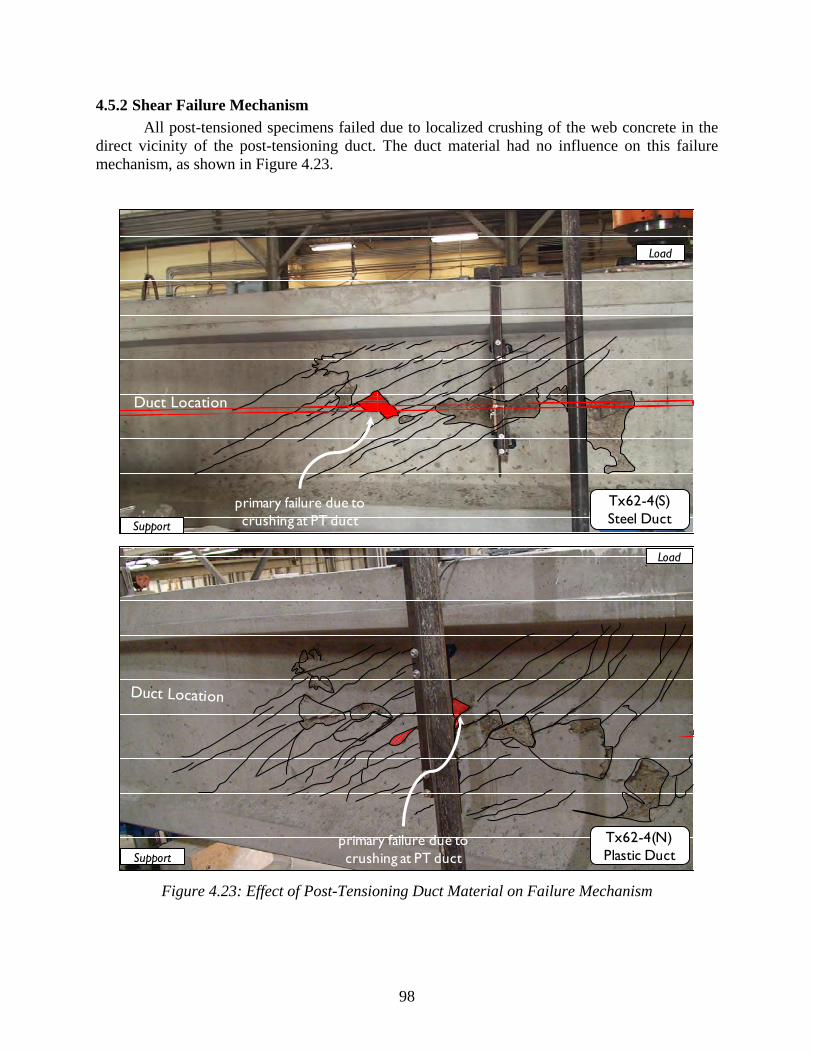
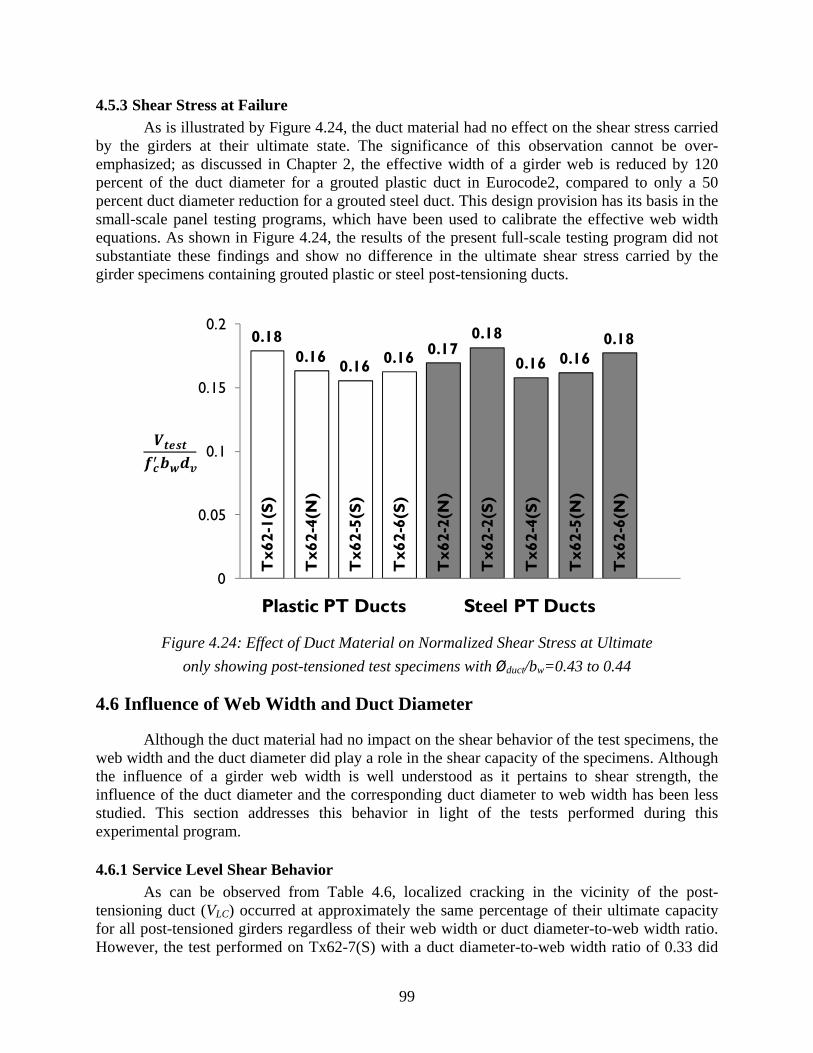
4.5 Post-Tensioning Duct Material (Plastic or Steel) ............................................................... 96 4.5.1 Service Level Shear Behavior ...................................................................................... 97 4.5.2 Shear Failure Mechanism ............................................................................................ 98 4.5.3 Shear Stress at Failure .................................................................................................. 99
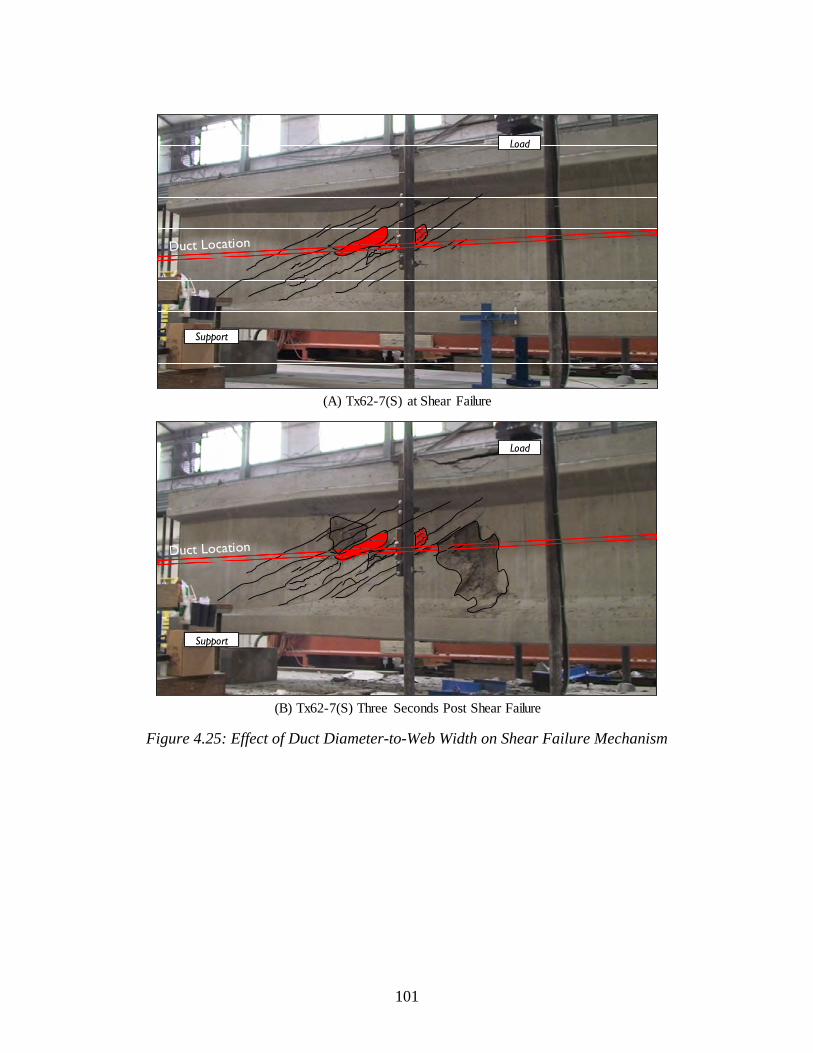
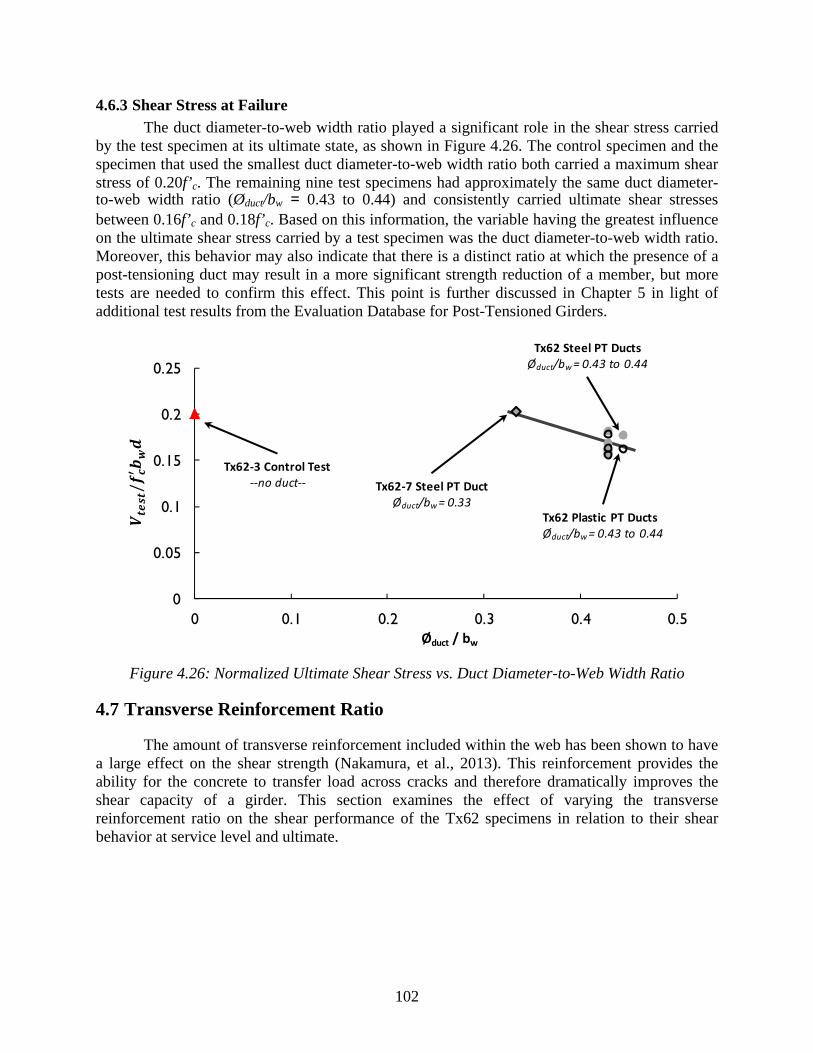
4.6 Influence of Web Width and Duct Diameter ...................................................................... 99 4.6.1 Service Level Shear Behavior ...................................................................................... 99 4.6.2 Shear Failure Mechanism .......................................................................................... 100 4.6.3 Shear Stress at Failure ................................................................................................ 102
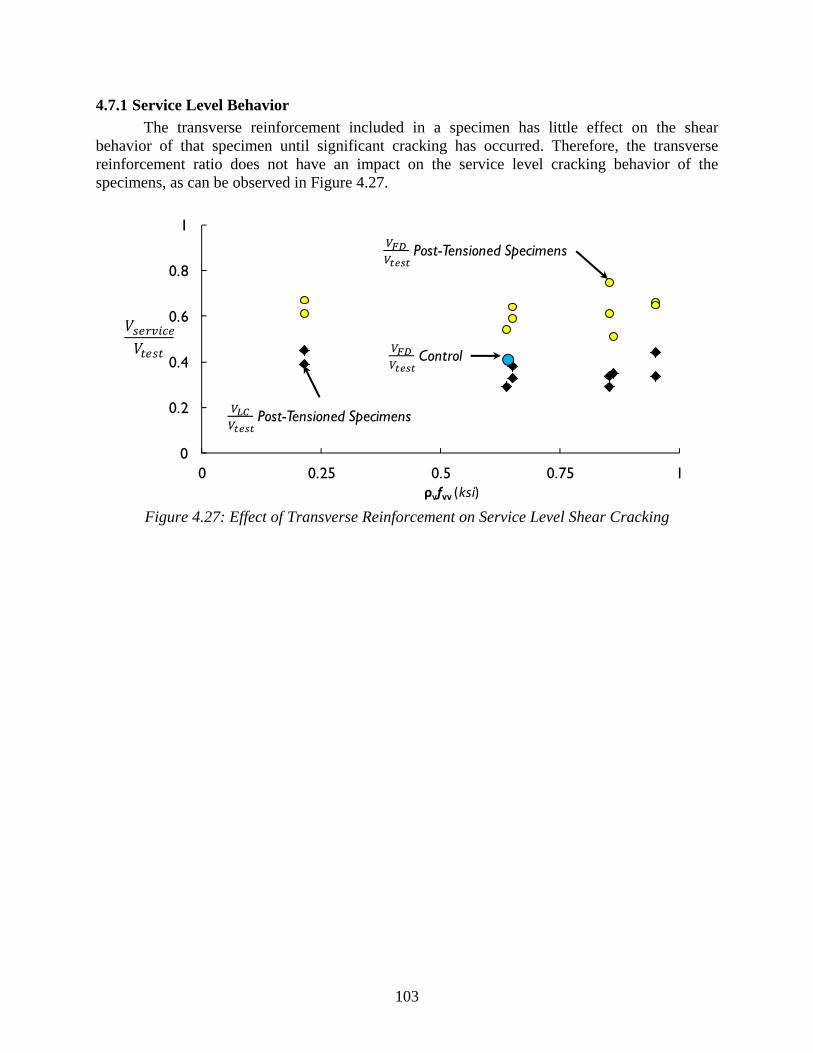
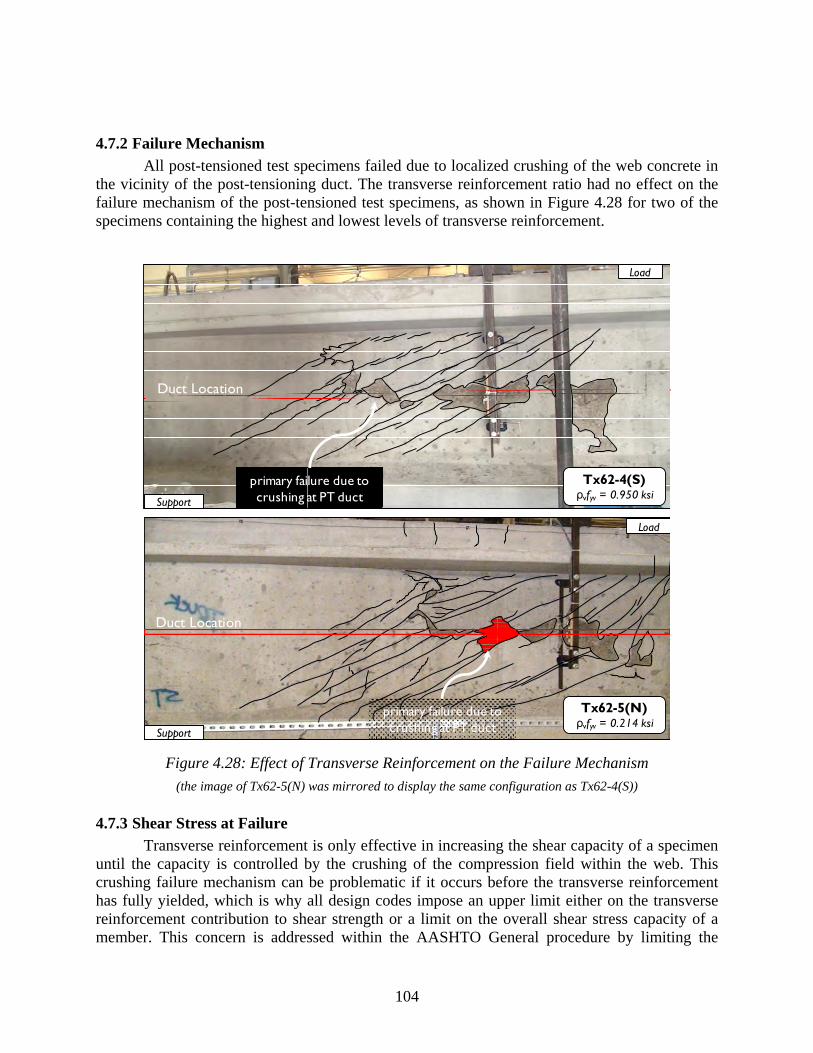
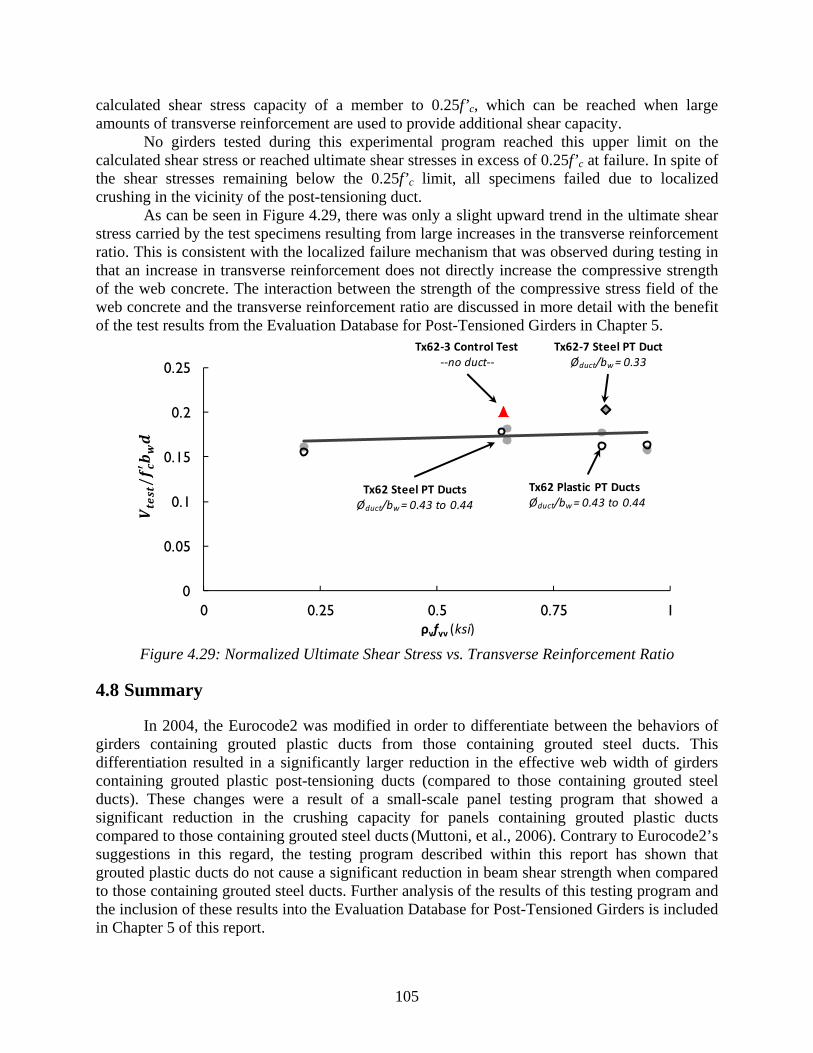
4.7 Transverse Reinforcement Ratio ....................................................................................... 102 4.7.1 Service Level Behavior .............................................................................................. 103 4.7.2 Failure Mechanism ..................................................................................................... 104 4.7.3 Shear Stress at Failure ................................................................................................ 104
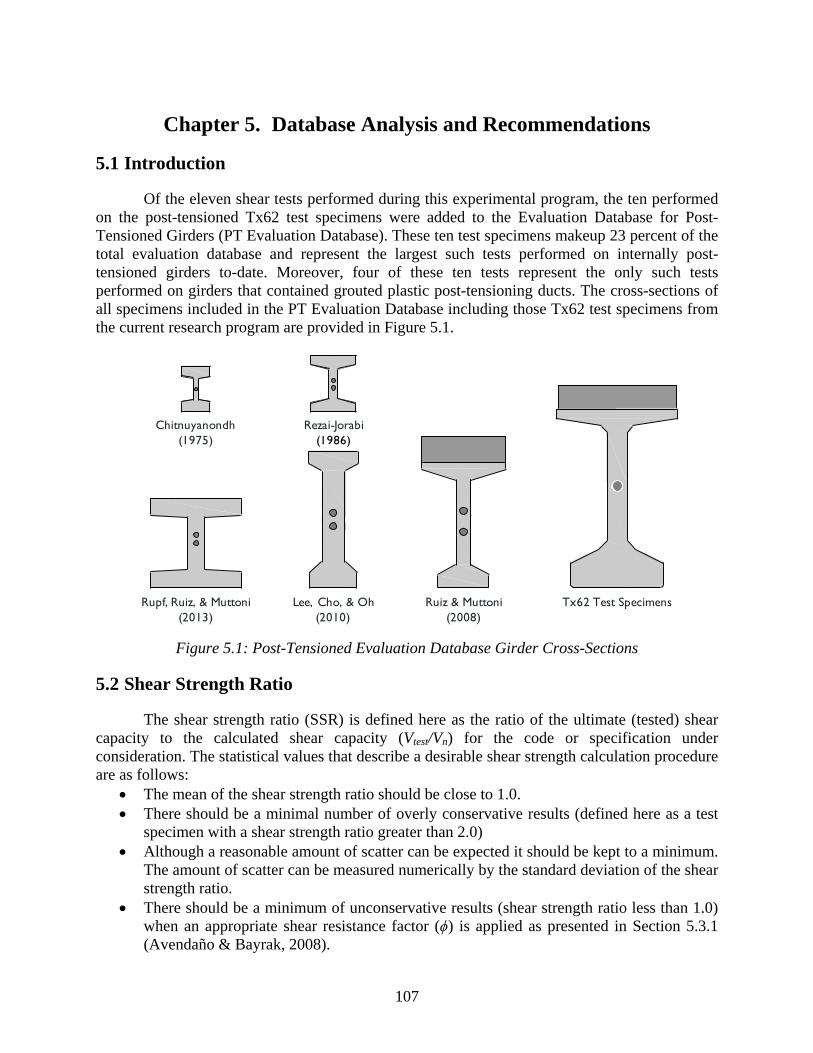
Chapter 5. Database Analysis and Recommendations .......................................................... 107
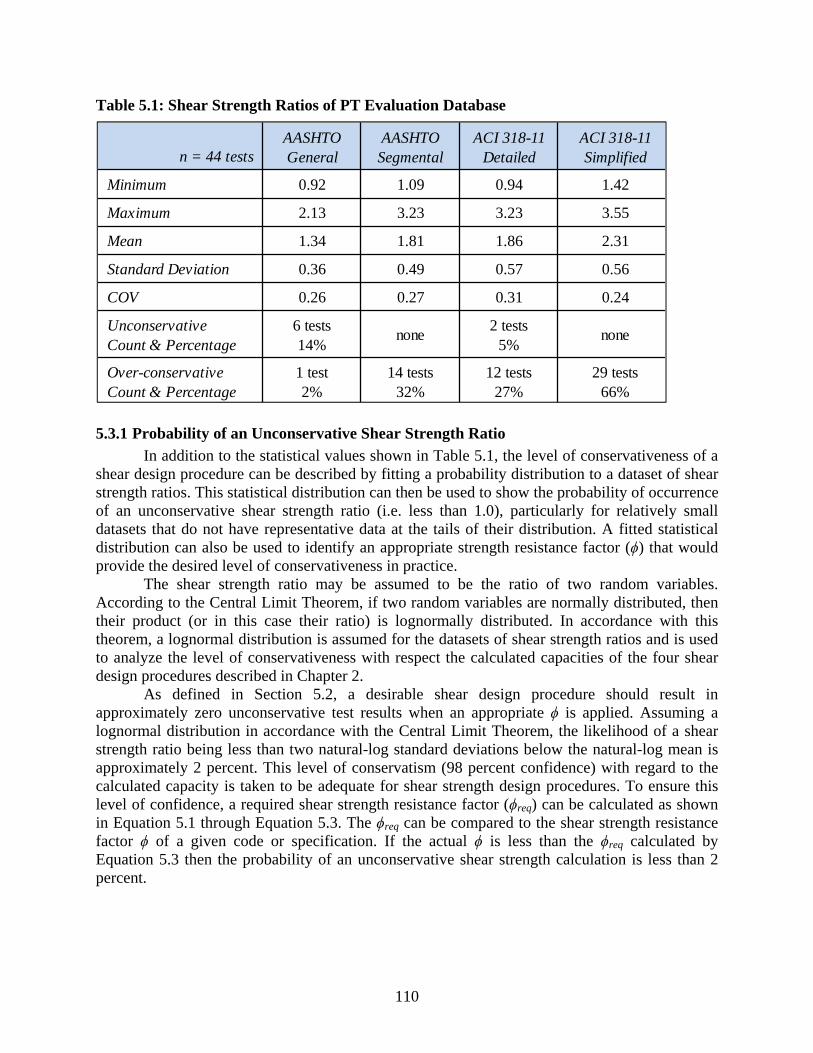
5.1 Introduction ....................................................................................................................... 107 5.2 Shear Strength Ratio ......................................................................................................... 107
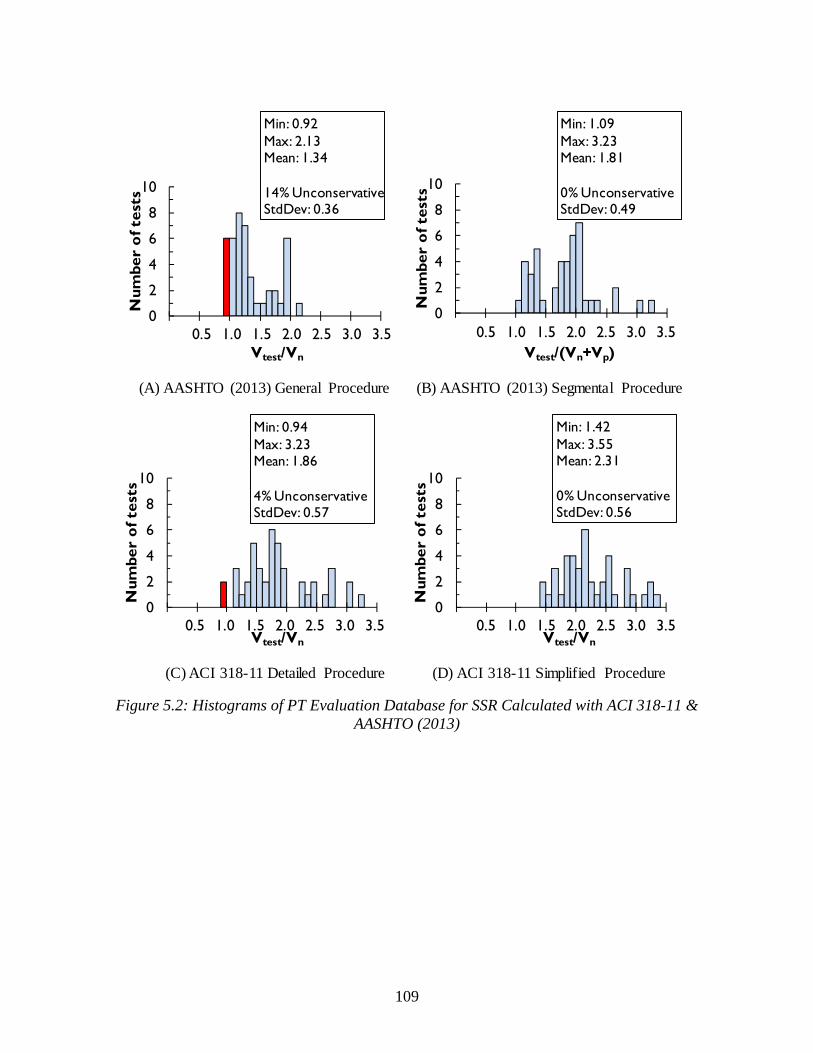
5.2.1 Use of Standard Deviation in place of the Coefficient of Variation .......................... 108 5.3 Accuracy of Shear Strength Calculation Procedures ........................................................ 108
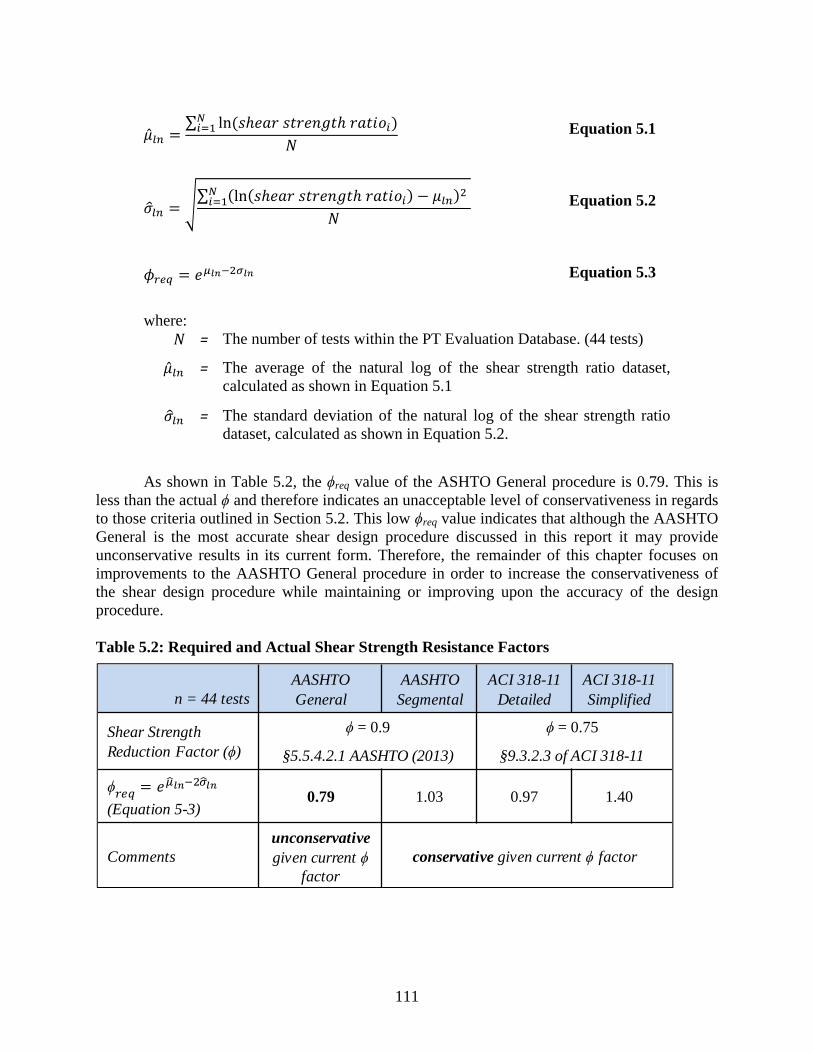
5.3.1 Probability of an Unconservative Shear Strength Ratio ............................................ 110 5.4 Investigation of Bias ......................................................................................................... 112
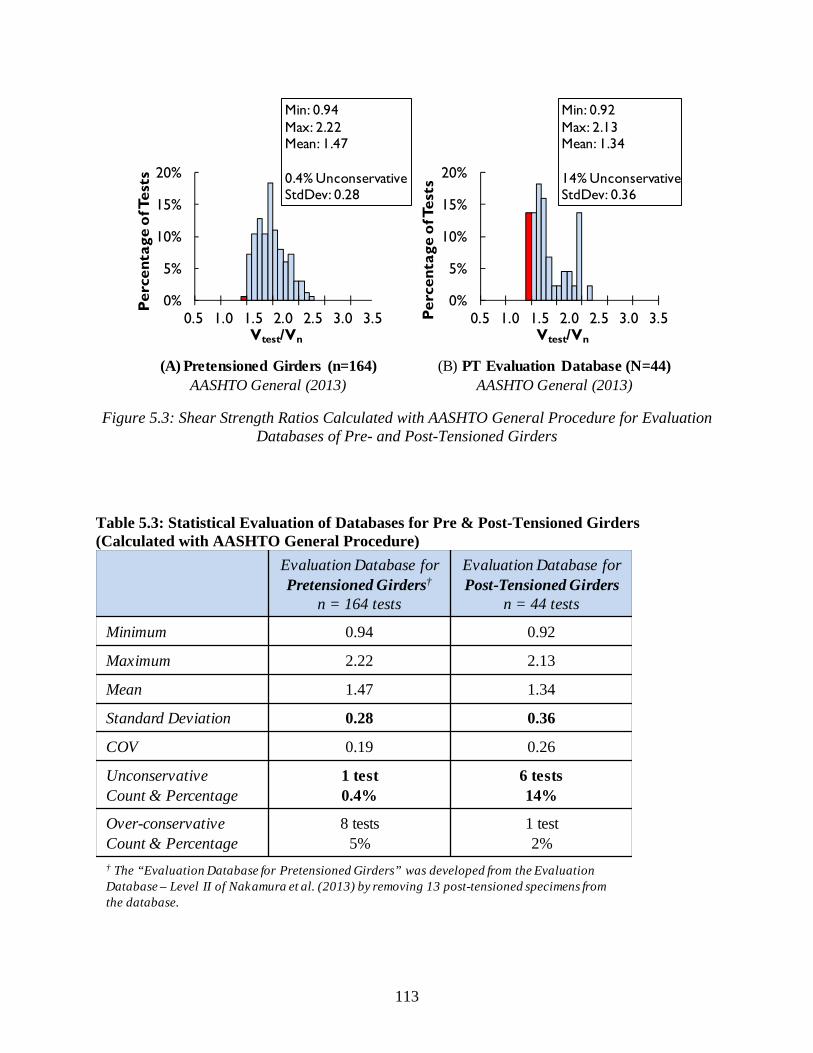
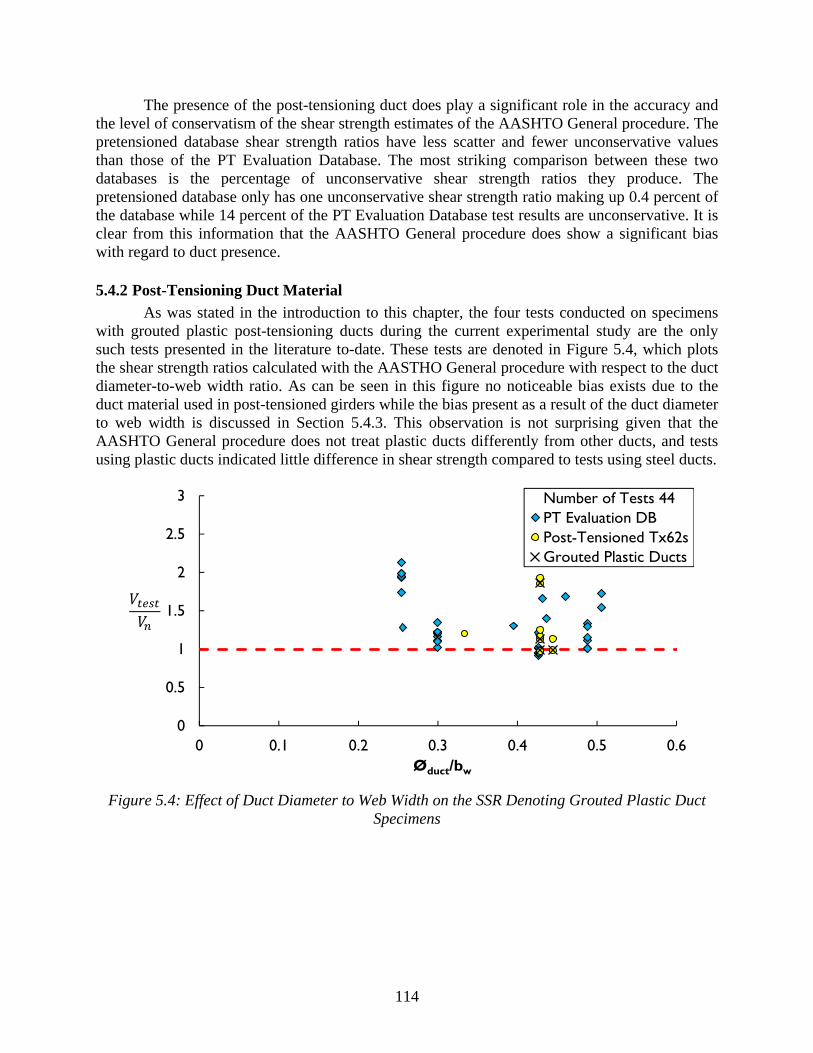
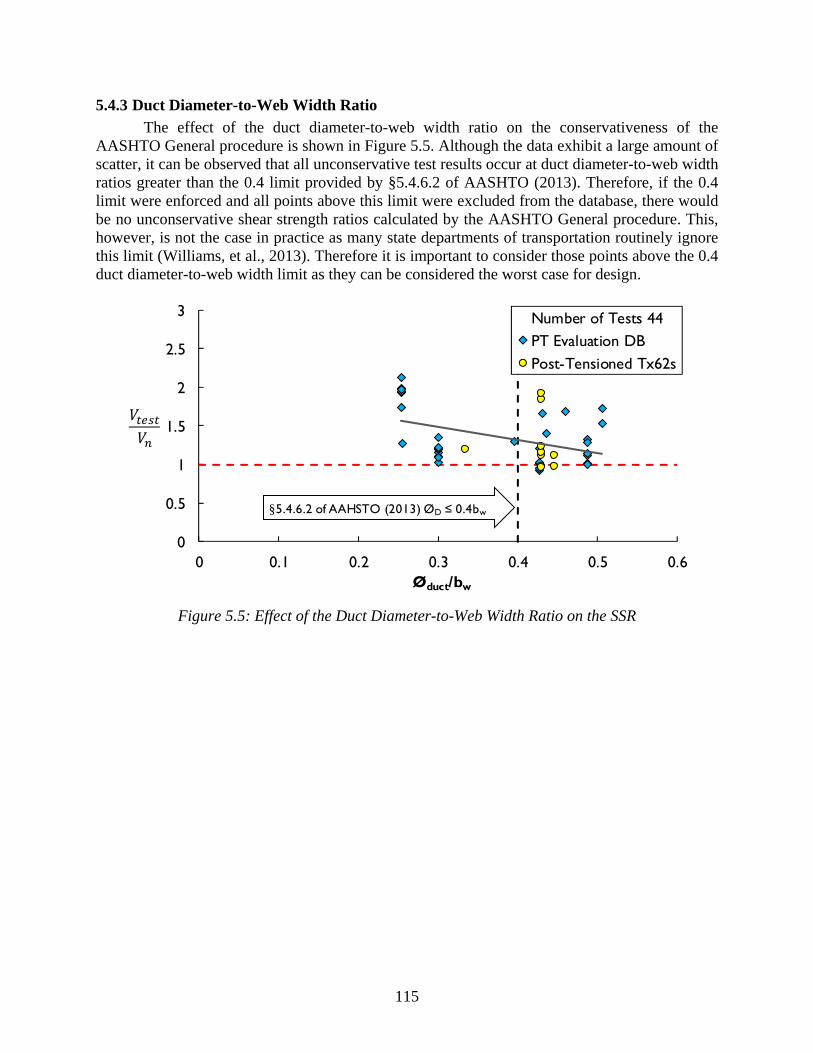
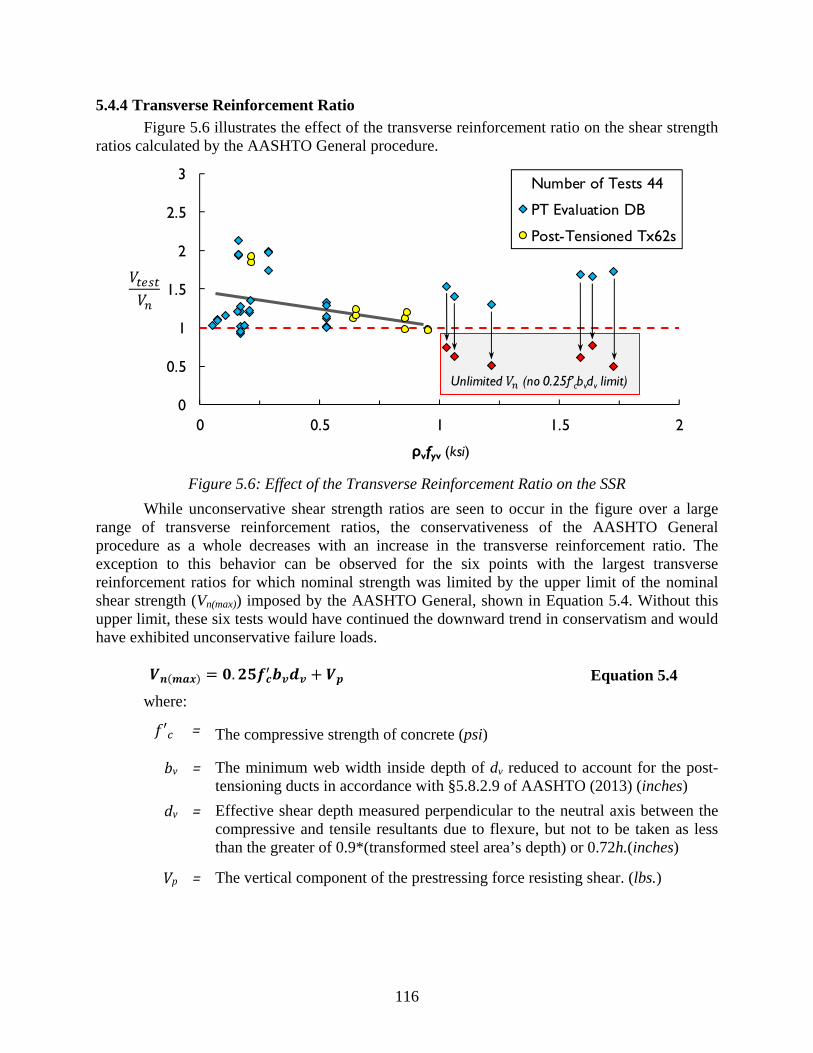
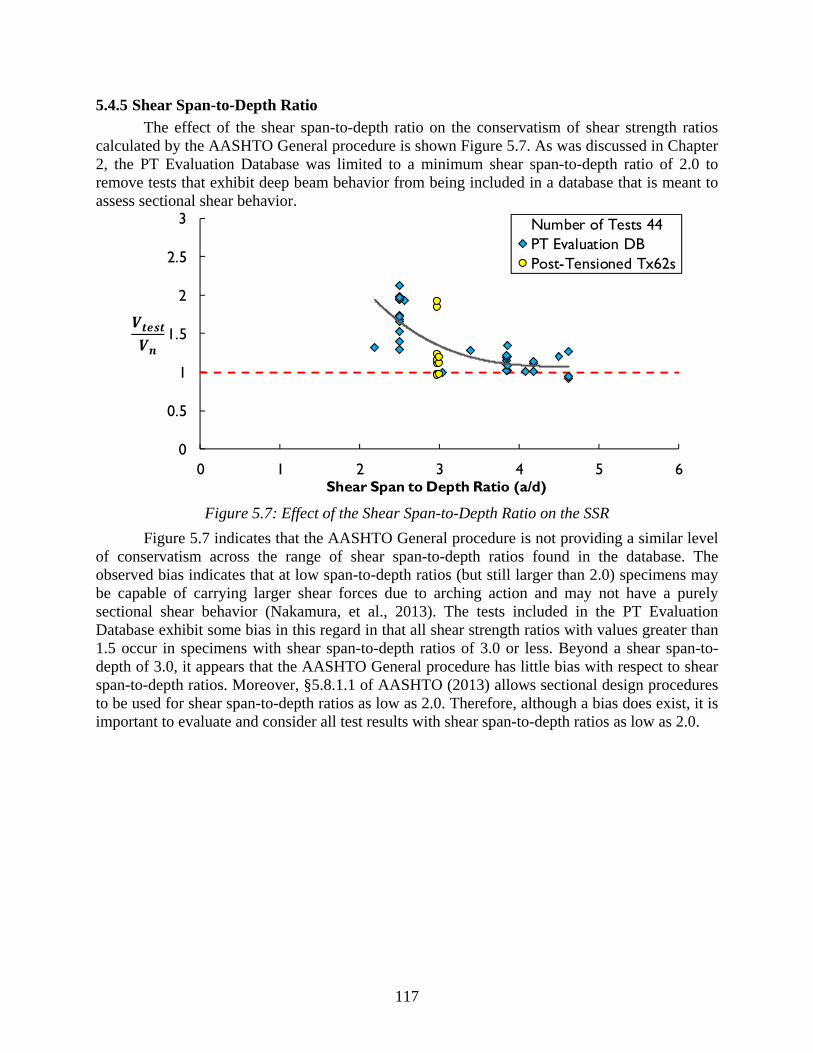
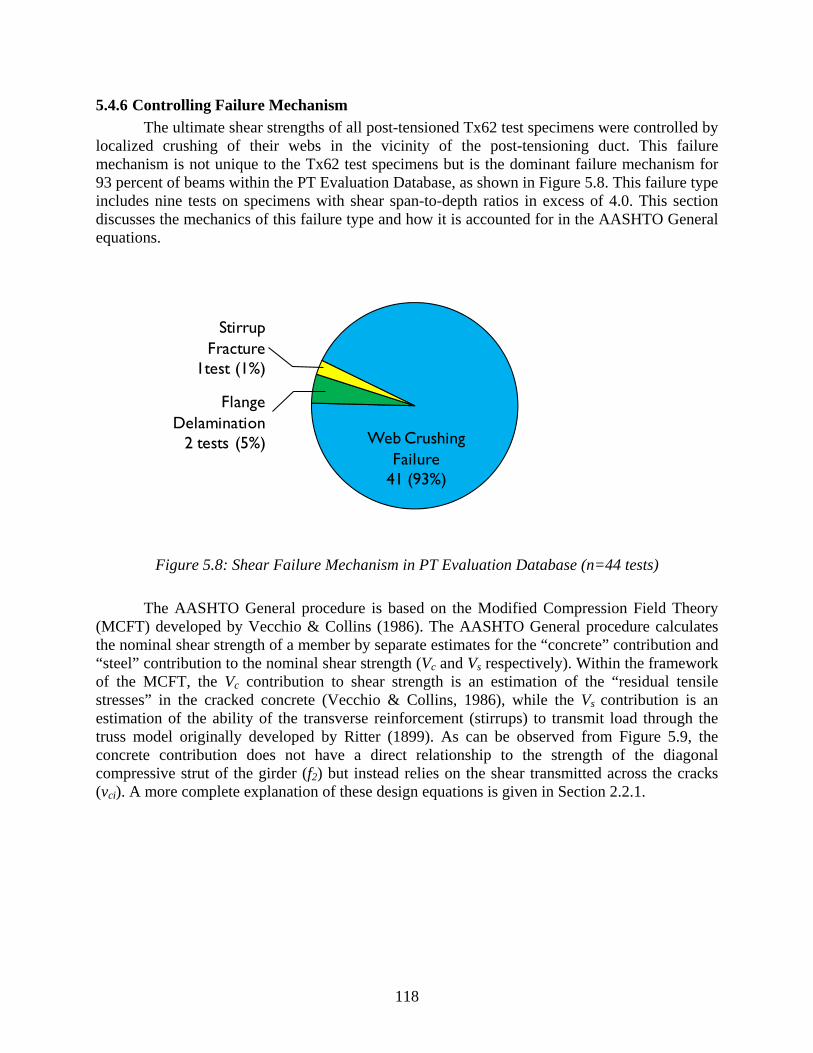
5.4.1 Presence of a Post-Tensioning Duct .......................................................................... 112 5.4.2 Post-Tensioning Duct Material .................................................................................. 114 5.4.3 Duct Diameter-to-Web Width Ratio .......................................................................... 115 5.4.4 Transverse Reinforcement Ratio ................................................................................ 116 5.4.5 Shear Span-to-Depth Ratio ........................................................................................ 117 5.4.6 Controlling Failure Mechanism ................................................................................. 118
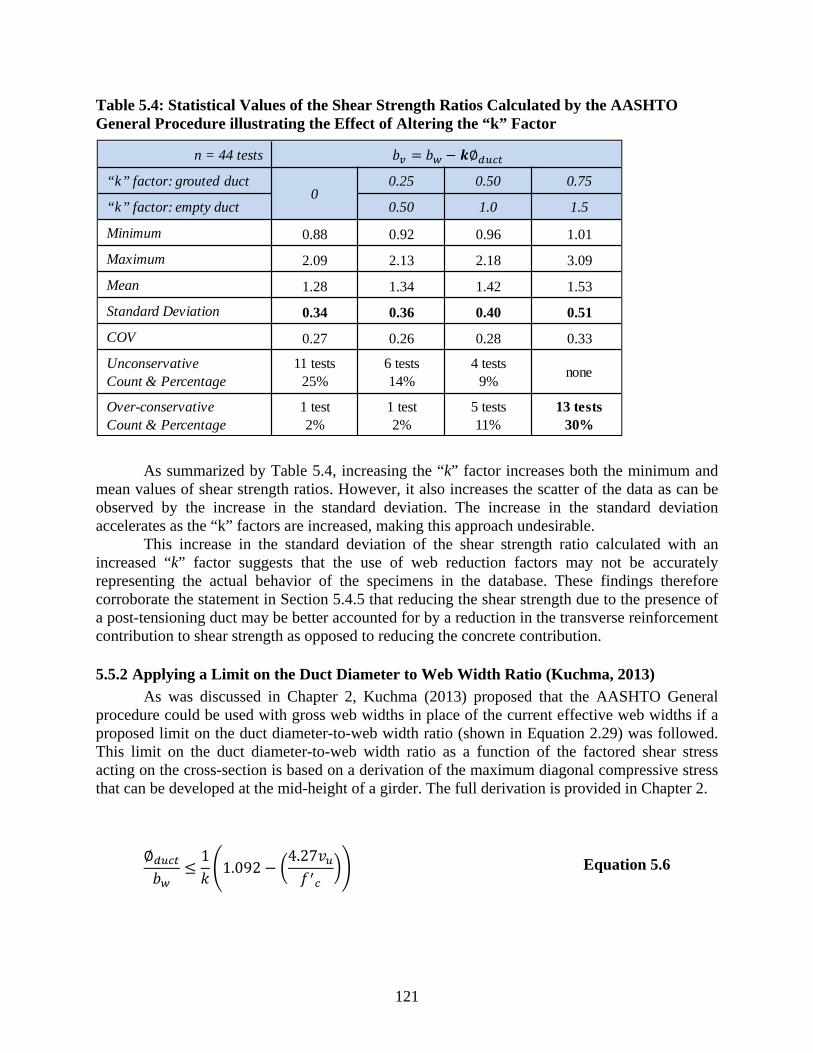
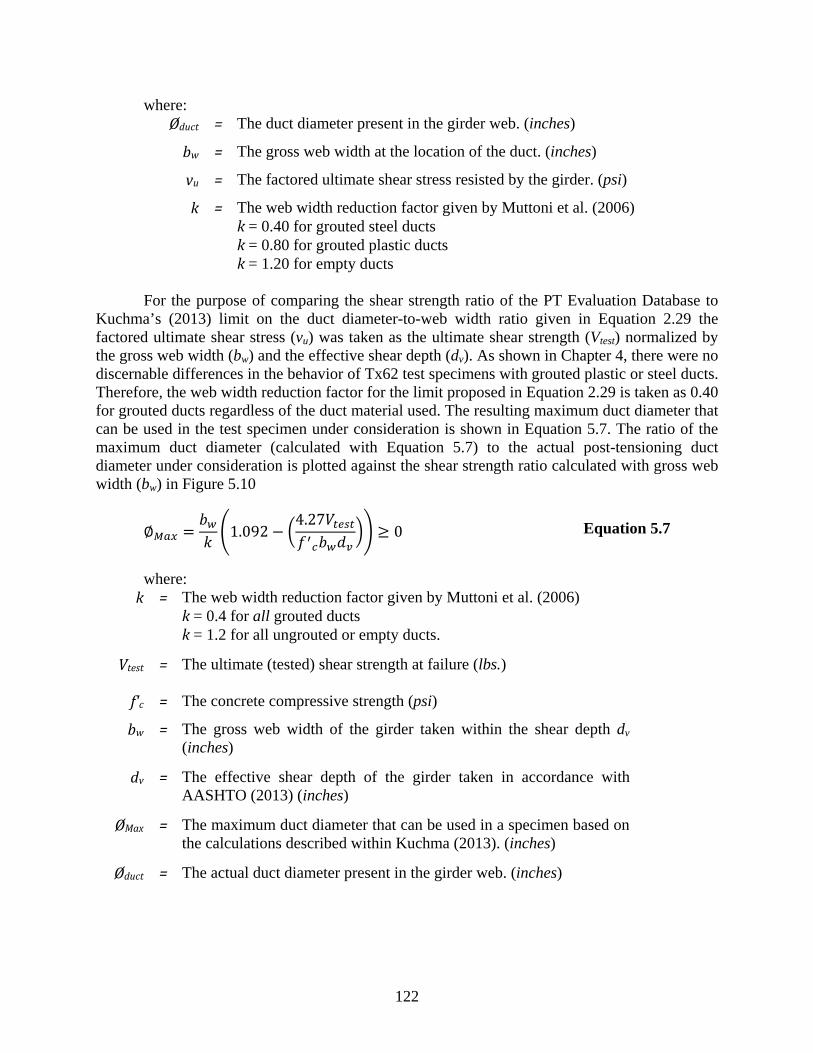
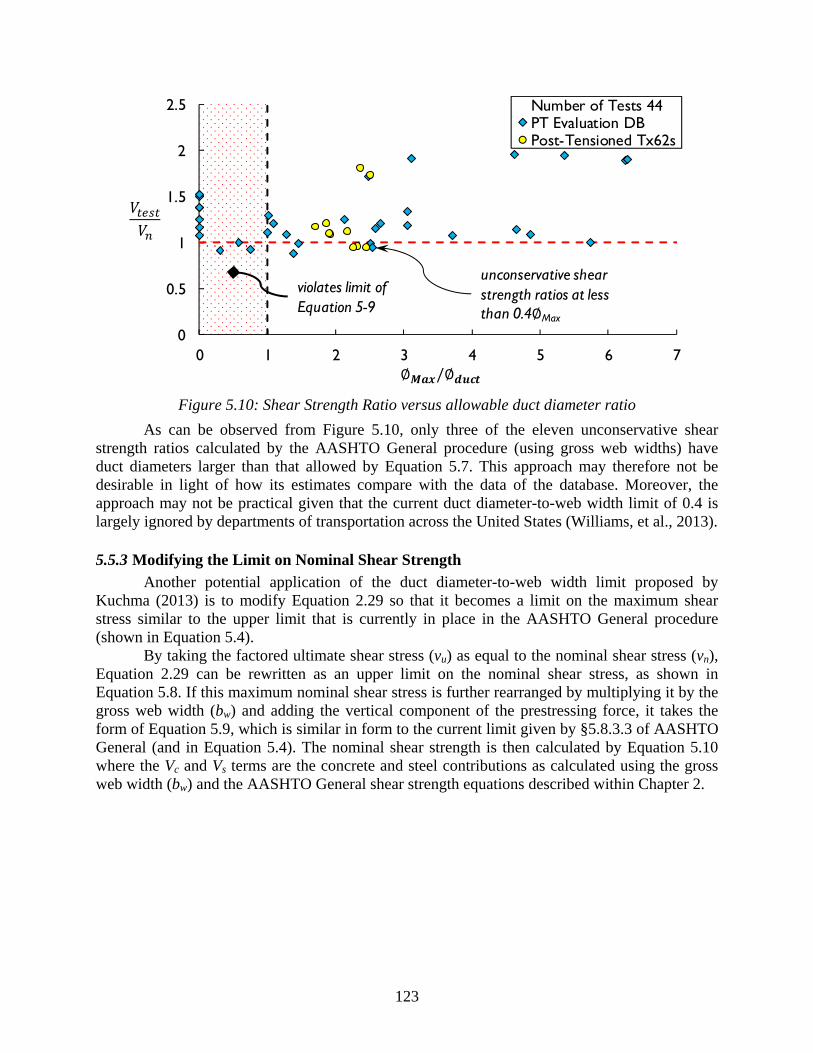
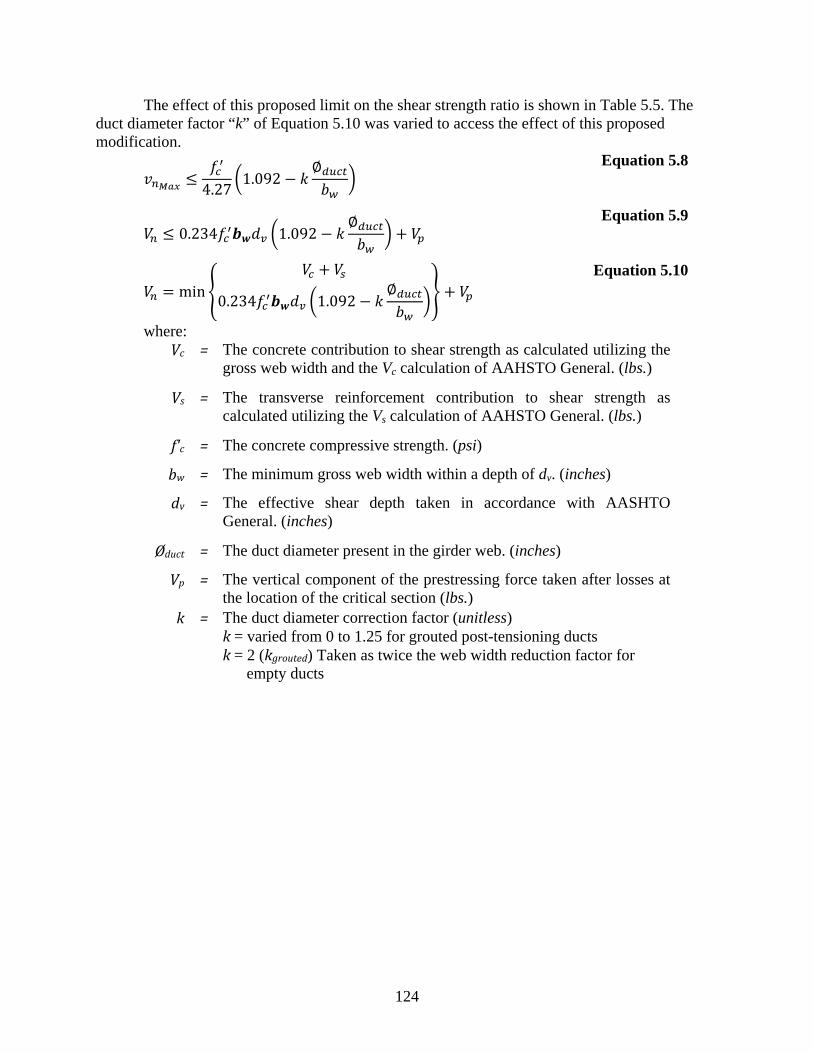
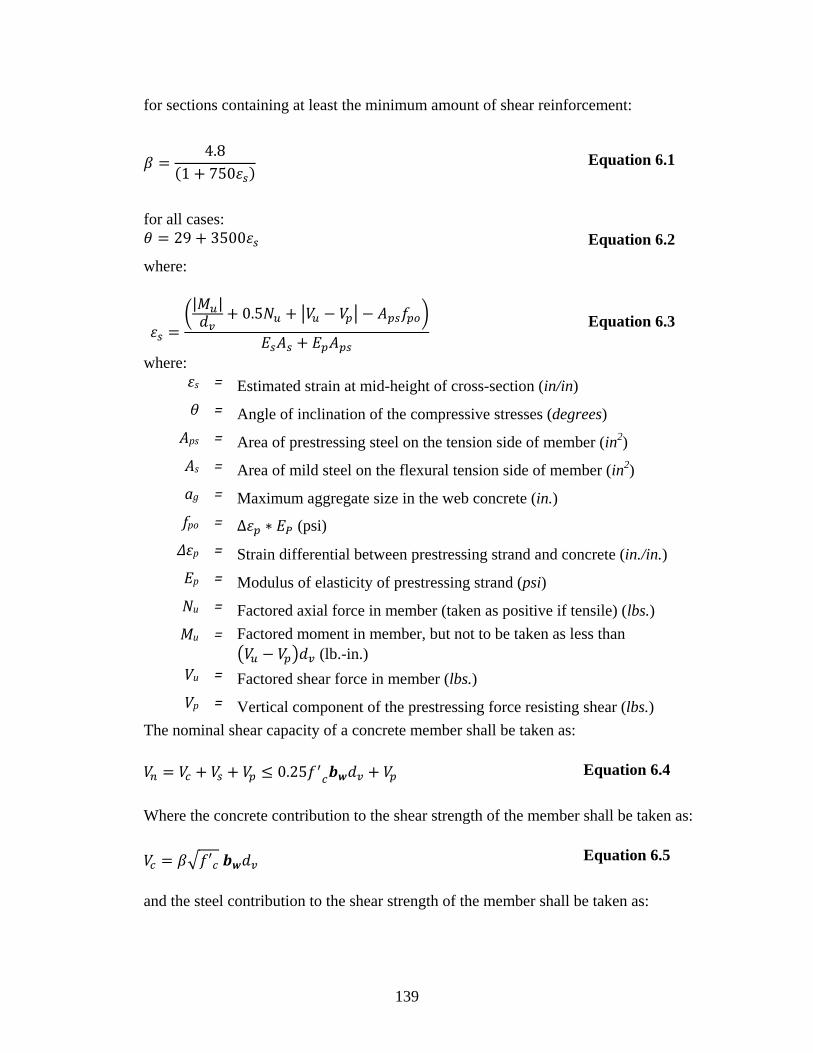
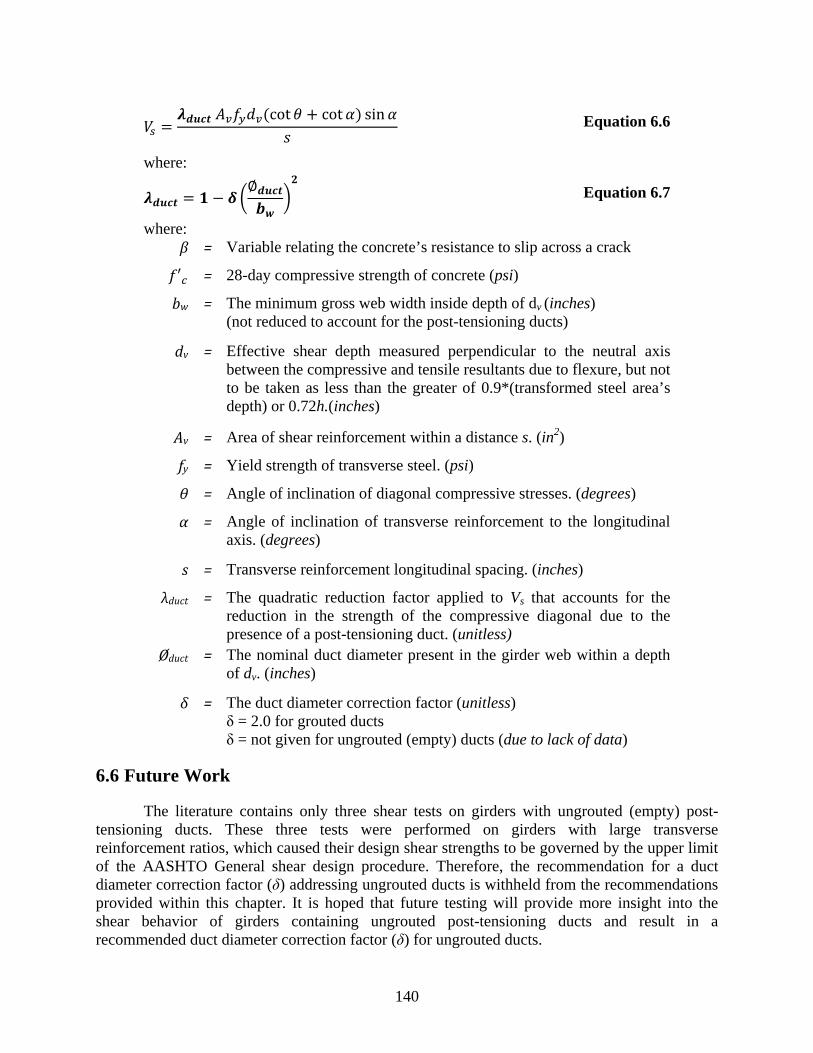
5.5 Explored Modifications to the AASHTO General Procedure .......................................... 120 5.5.1 Altering the Web Width Reduction Factor “k” .......................................................... 120 5.5.2 Applying a Limit on the Duct Diameter to Web Width Ratio (Kuchma, 2013) ........ 121 5.5.3 Modifying the Limit on Nominal Shear Strength ...................................................... 123
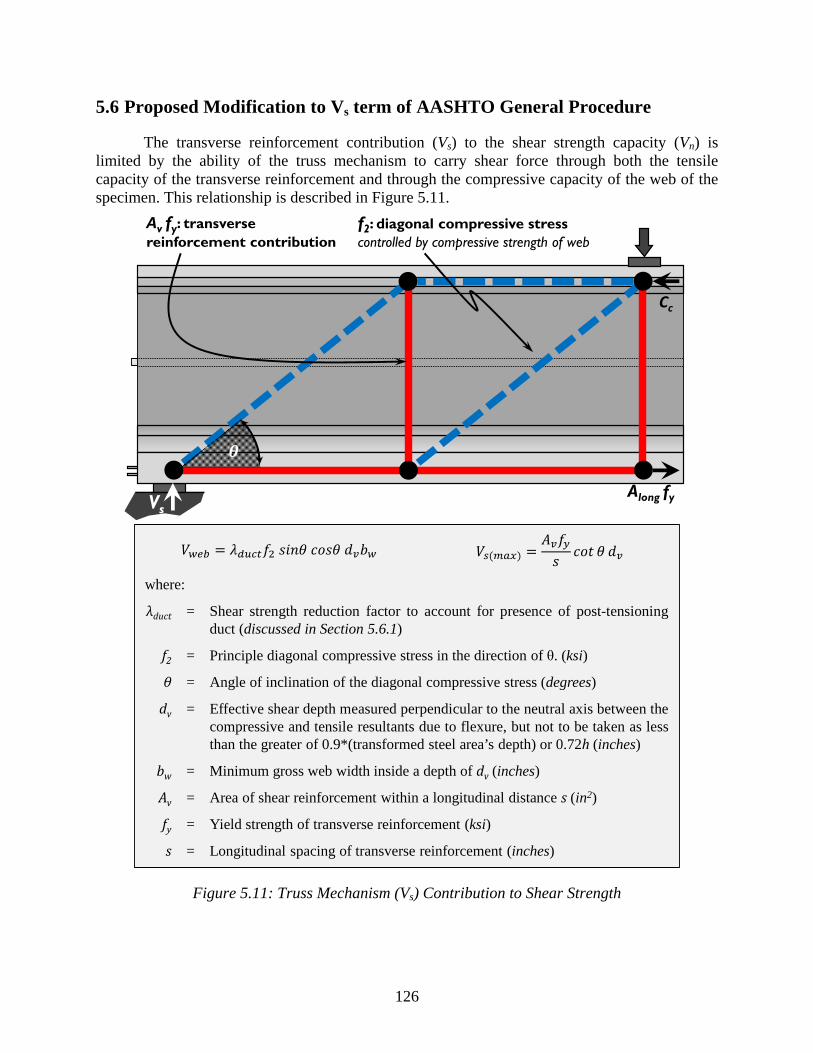
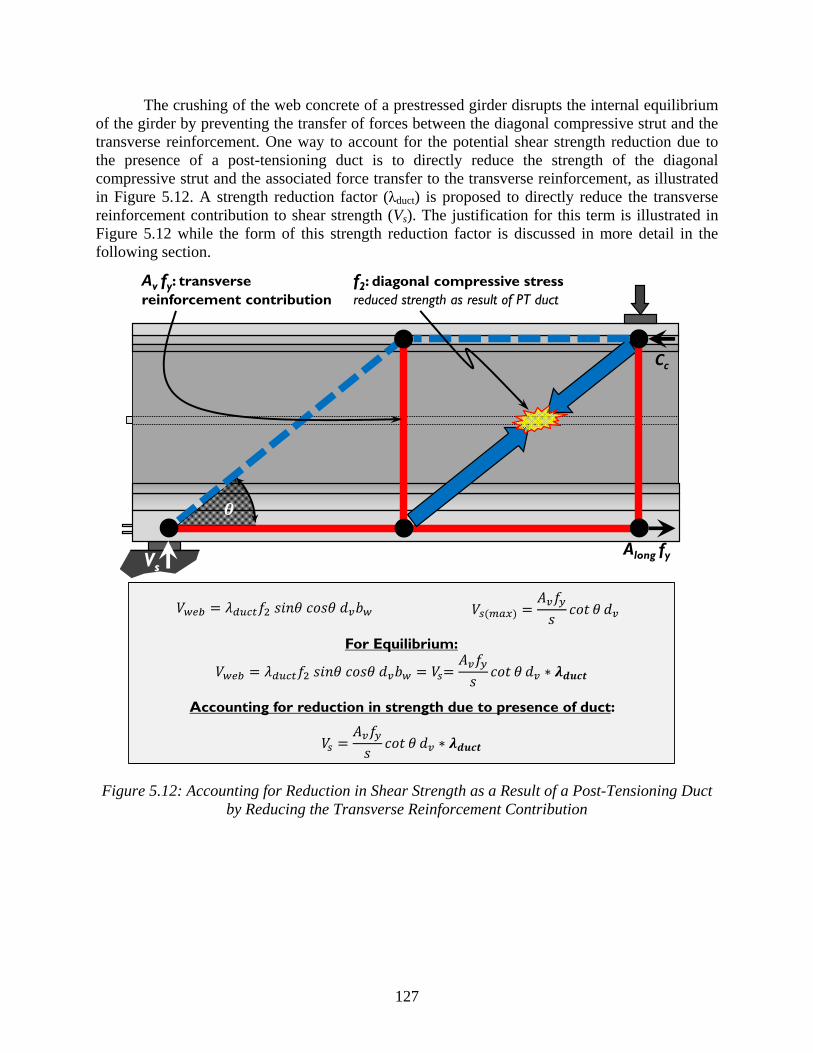
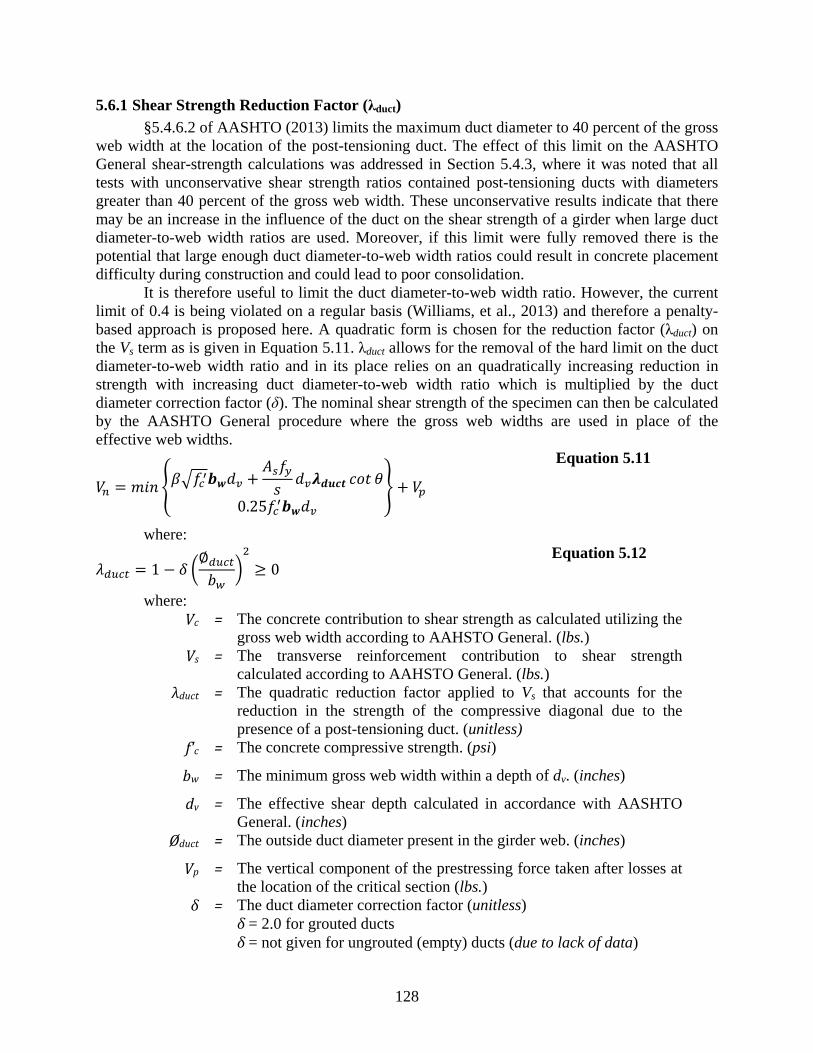
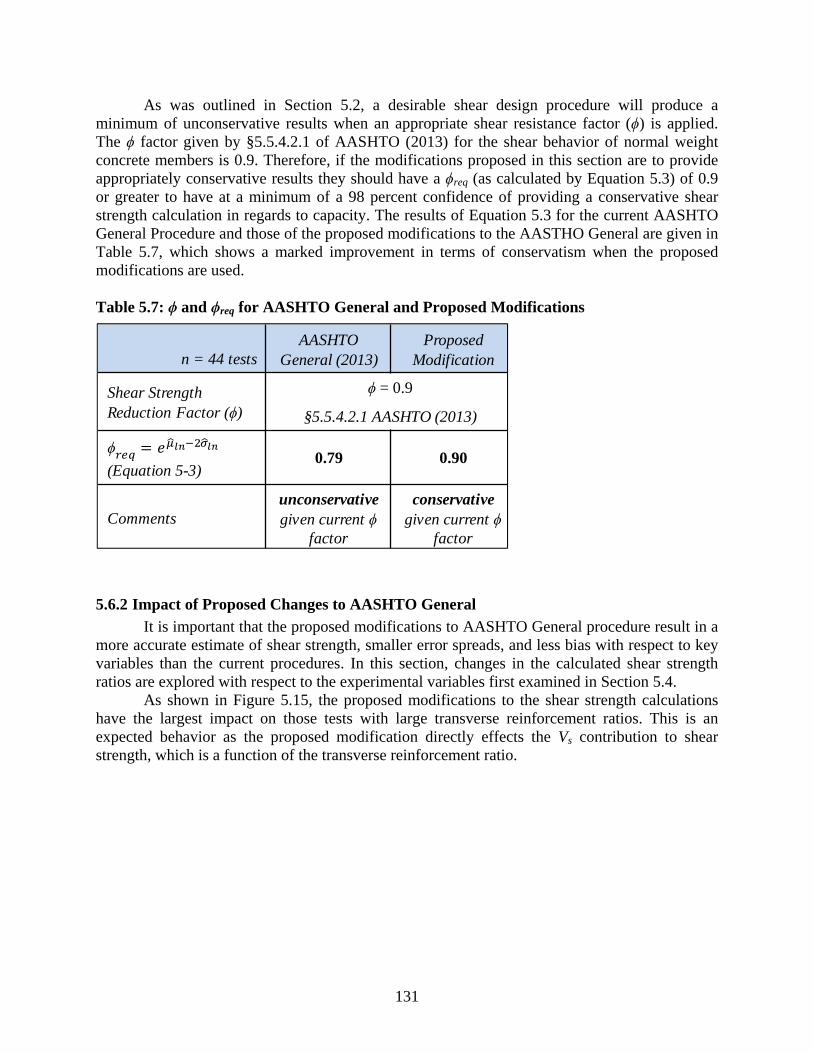
5.6 Proposed Modification to Vs term of AASHTO General Procedure ................................ 126 5.6.1 Shear Strength Reduction Factor (λduct) ..................................................................... 128 5.6.2 Impact of Proposed Changes to AASHTO General .................................................. 131
6.2.1 Presence of a Post-Tensioning Duct .......................................................................... 136 6.2.2 Post-Tensioning Duct Material (Plastic or Steel) ...................................................... 136 6.2.3 Specimen Web Width and Duct Diameter ................................................................. 137 6.2.4 Transverse Reinforcement Ratio ................................................................................ 137
6.3 Use of Panel Testing for Calibration of Full-Scale Shear Behavior ................................. 137 6.4 Proposed Changes to the AASHTO General Shear Design Procedure ............................ 138 6.5 Changes to the AASHTO (2013) General Shear Design Procedure ................................. 138 6.6 Future Work ...................................................................................................................... 140
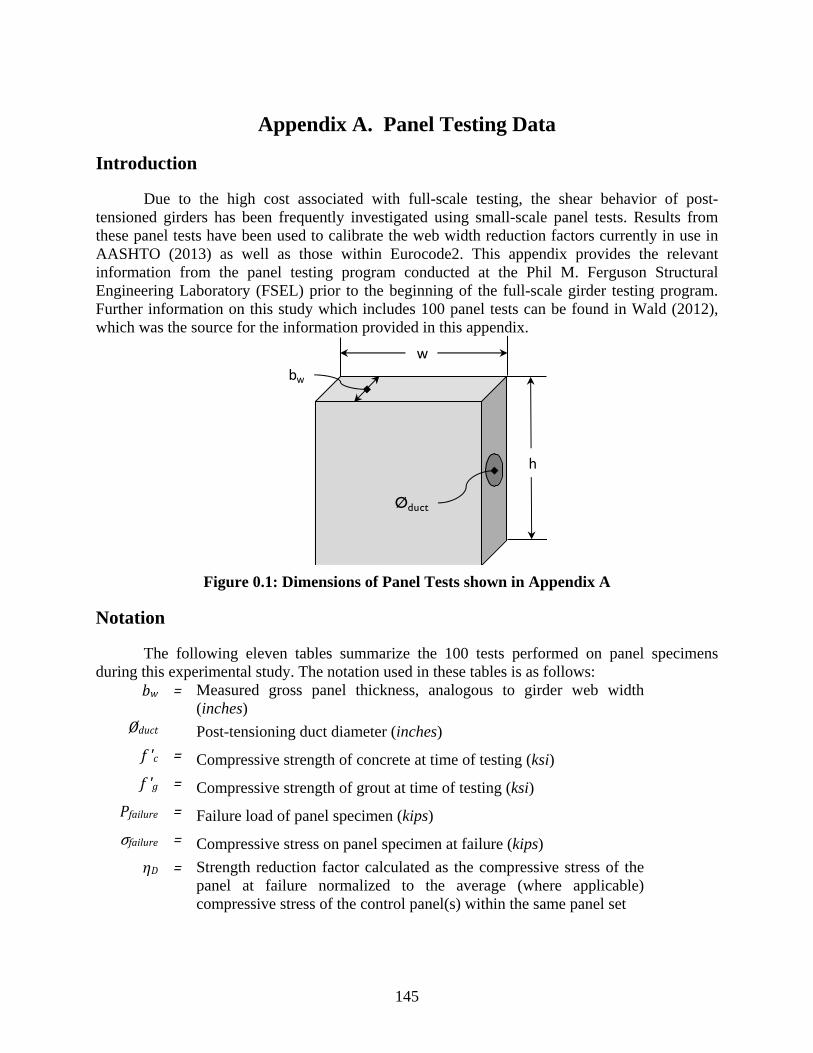
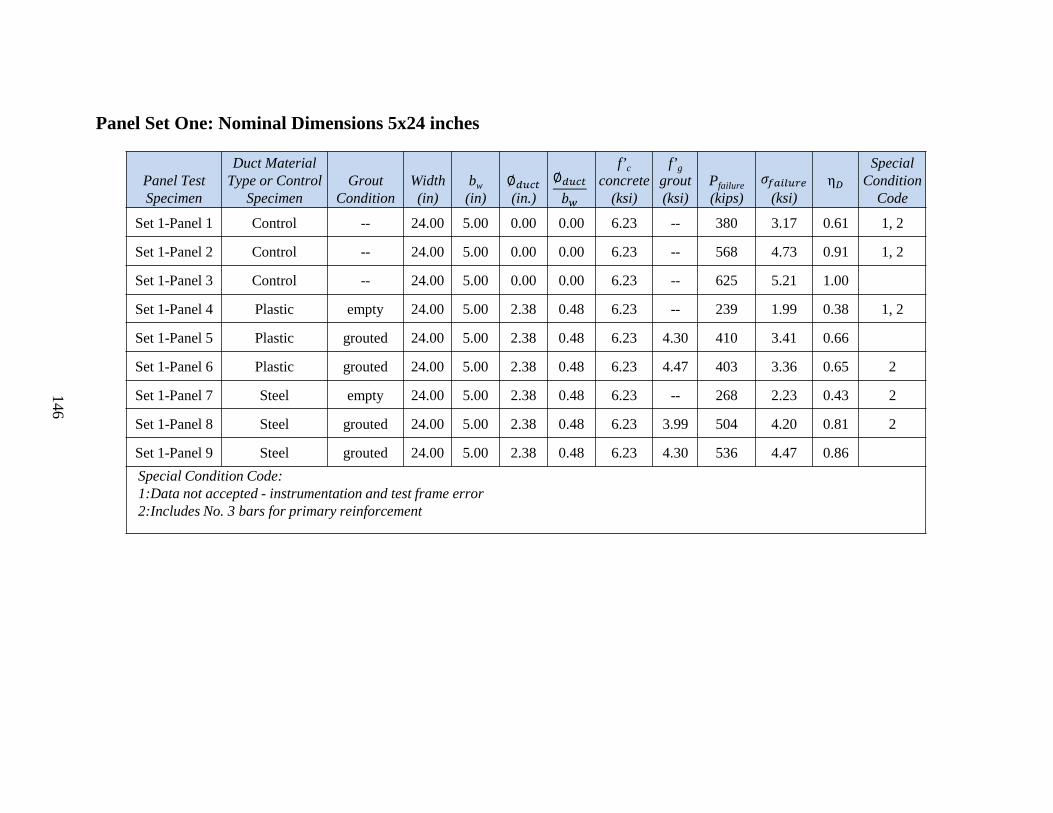
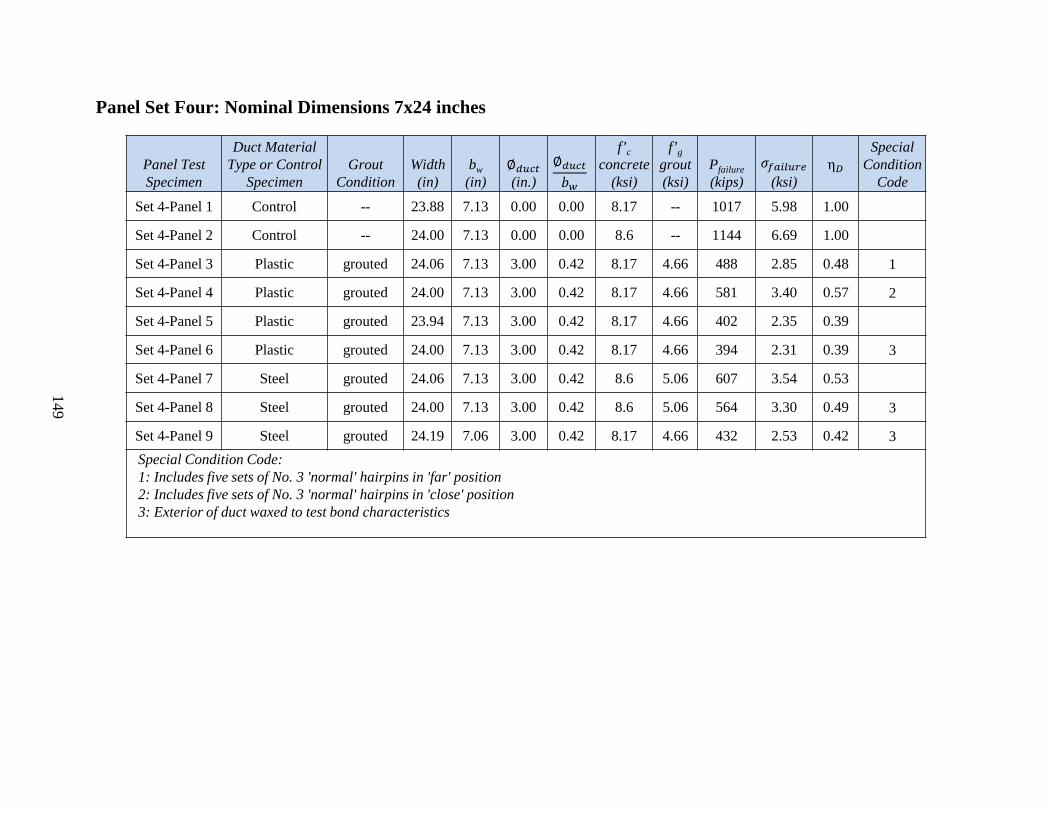
APPENDIX A. Panel Testing Data ............................................................................................ 145
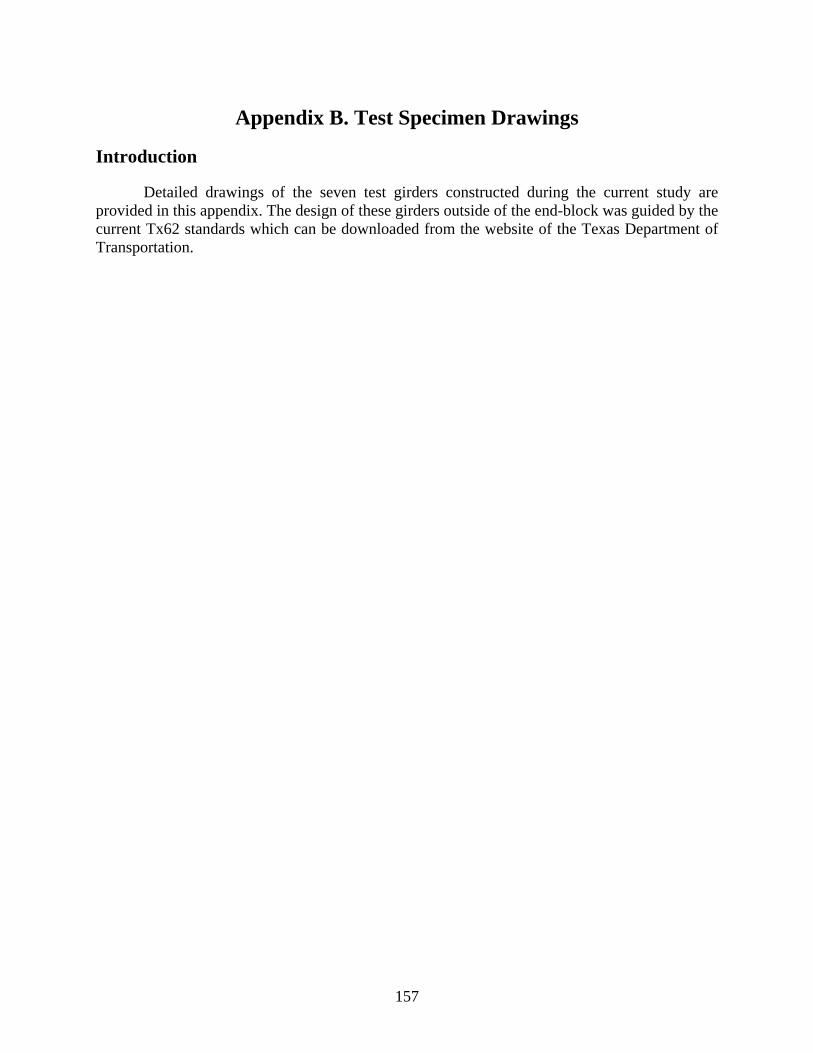
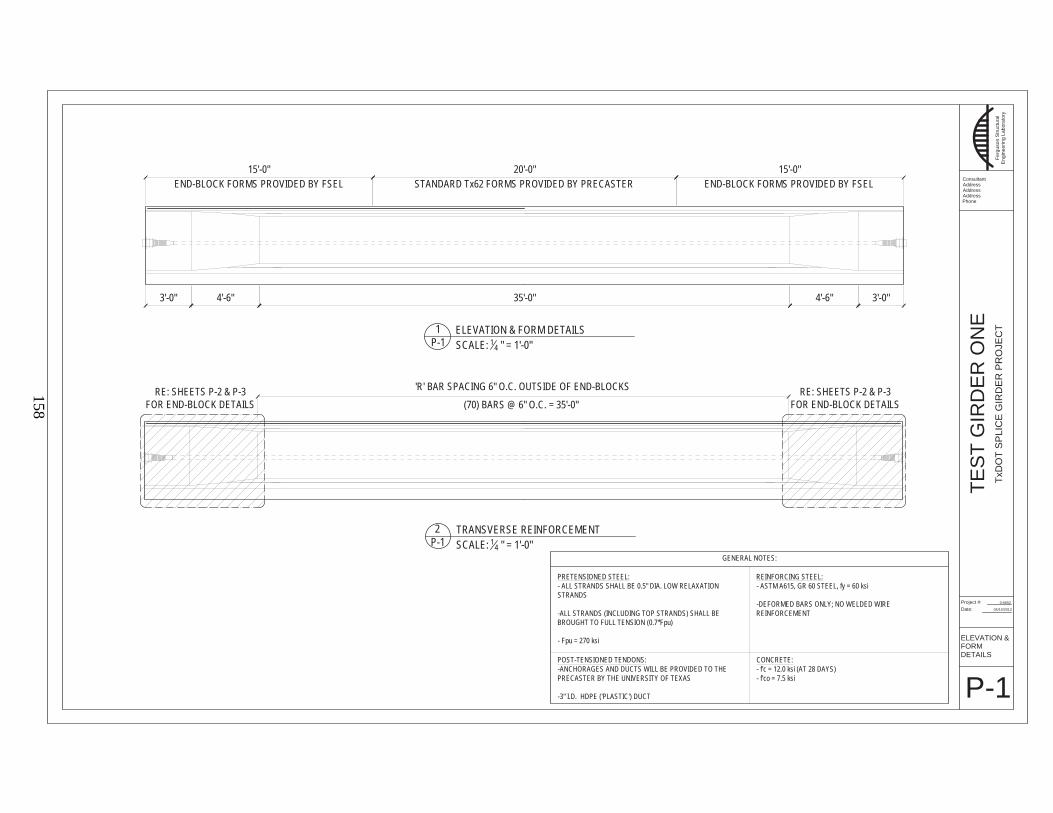
APPENDIX B. Test Specimen Drawings .................................................................................. 157
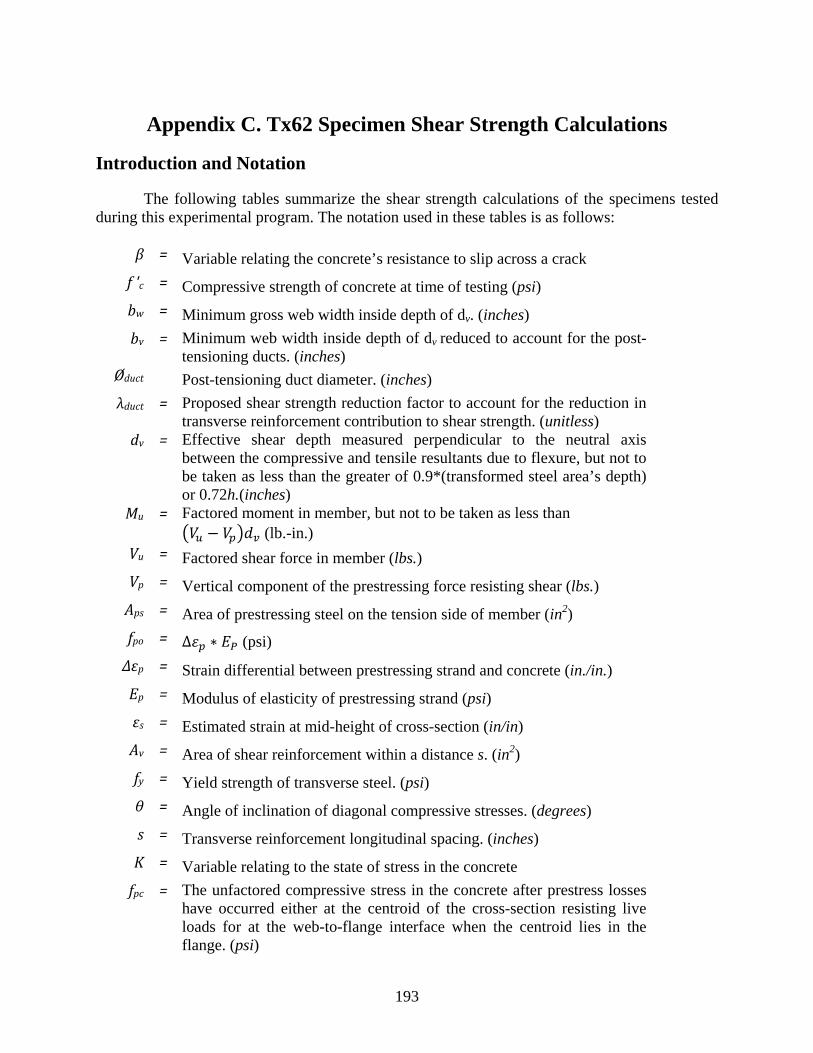
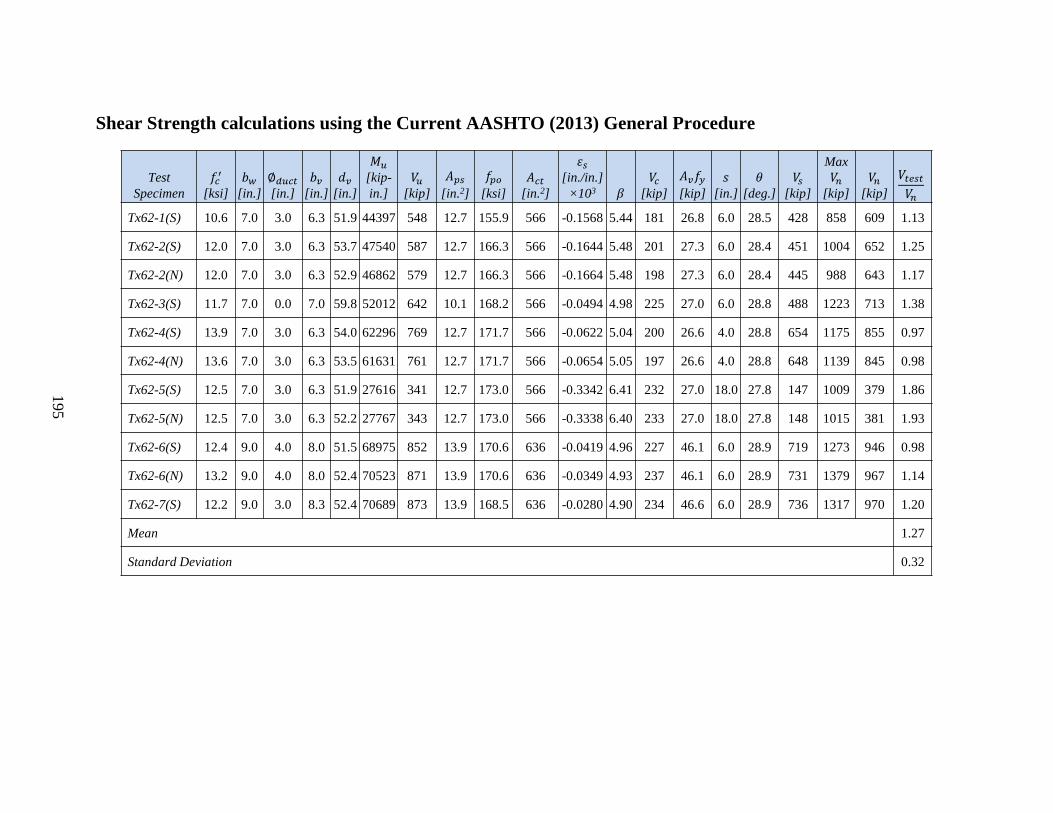
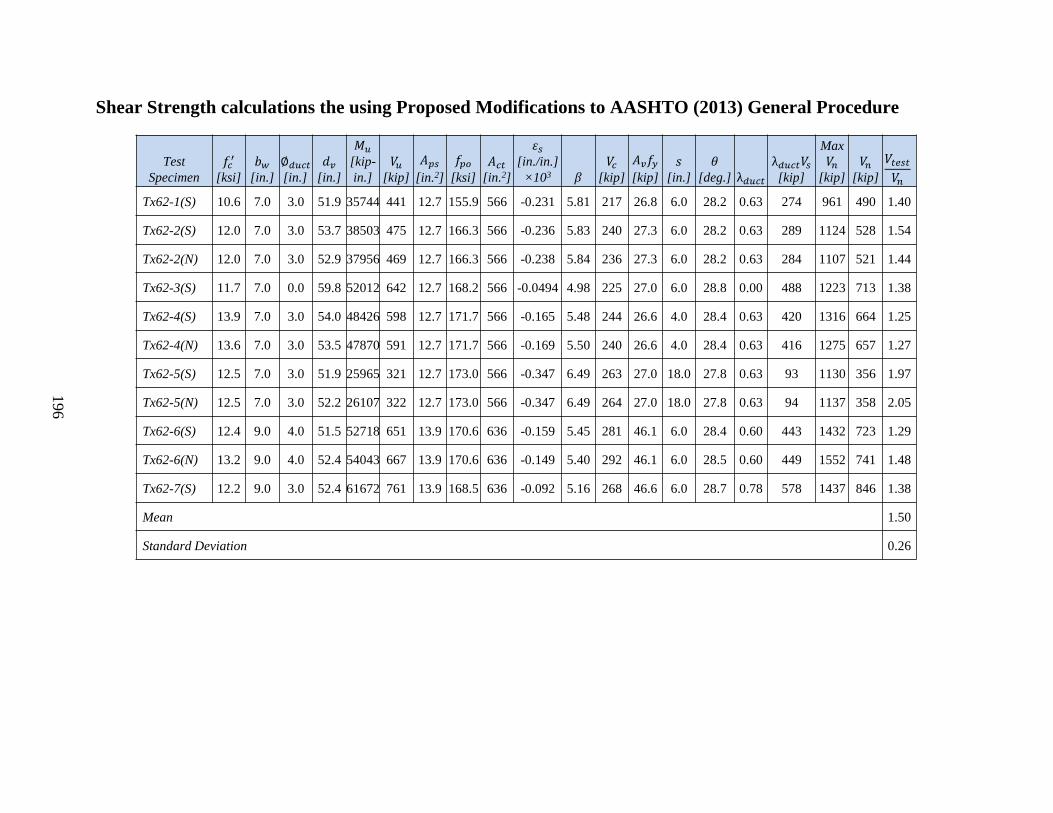
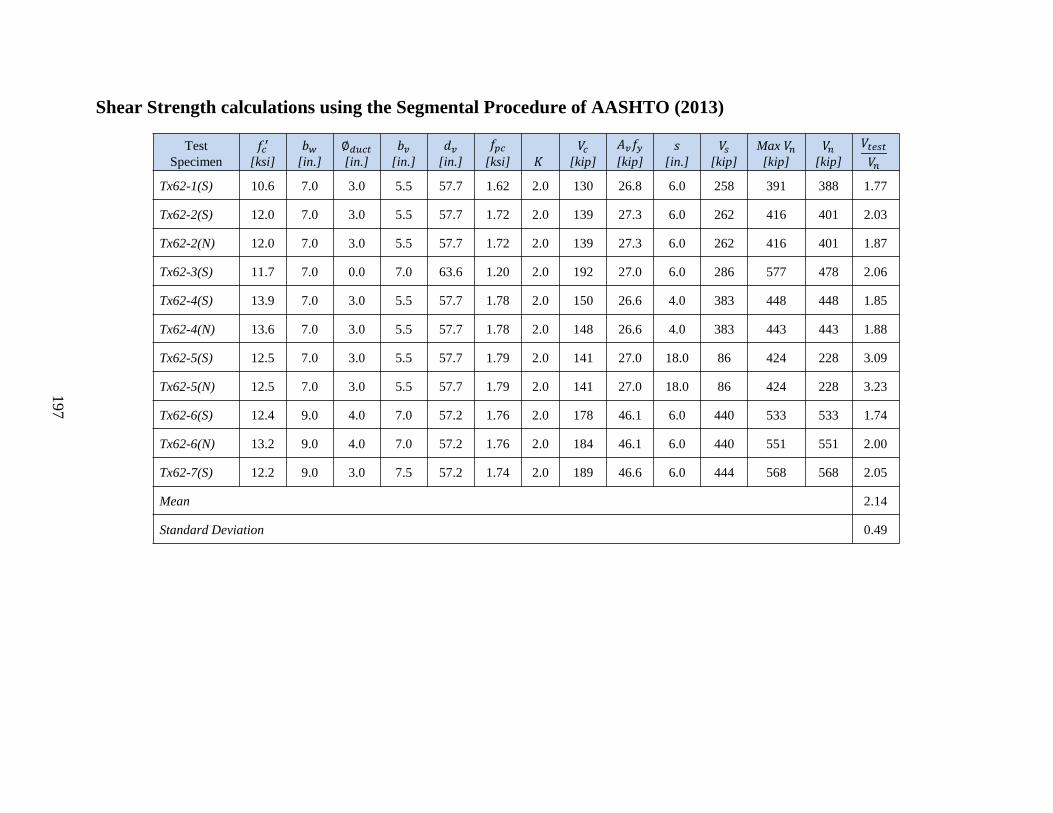
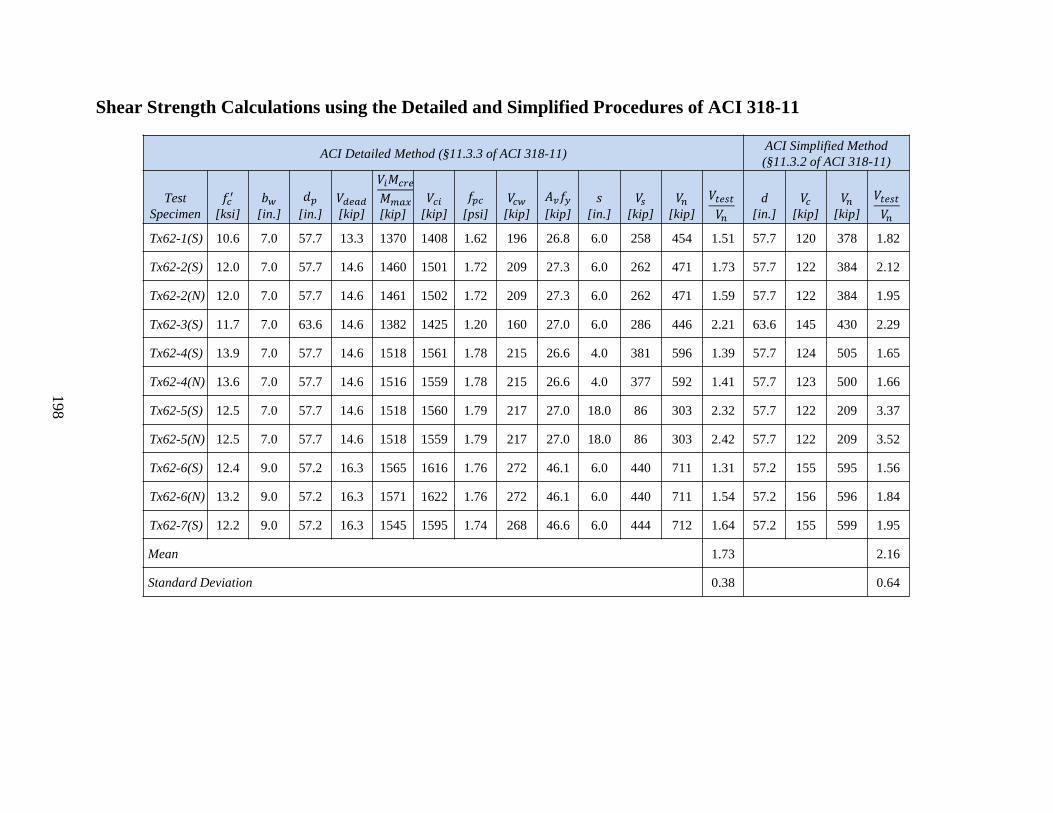
APPENDIX C. Tx62 Specimen Shear Strength Calculations .................................................... 193
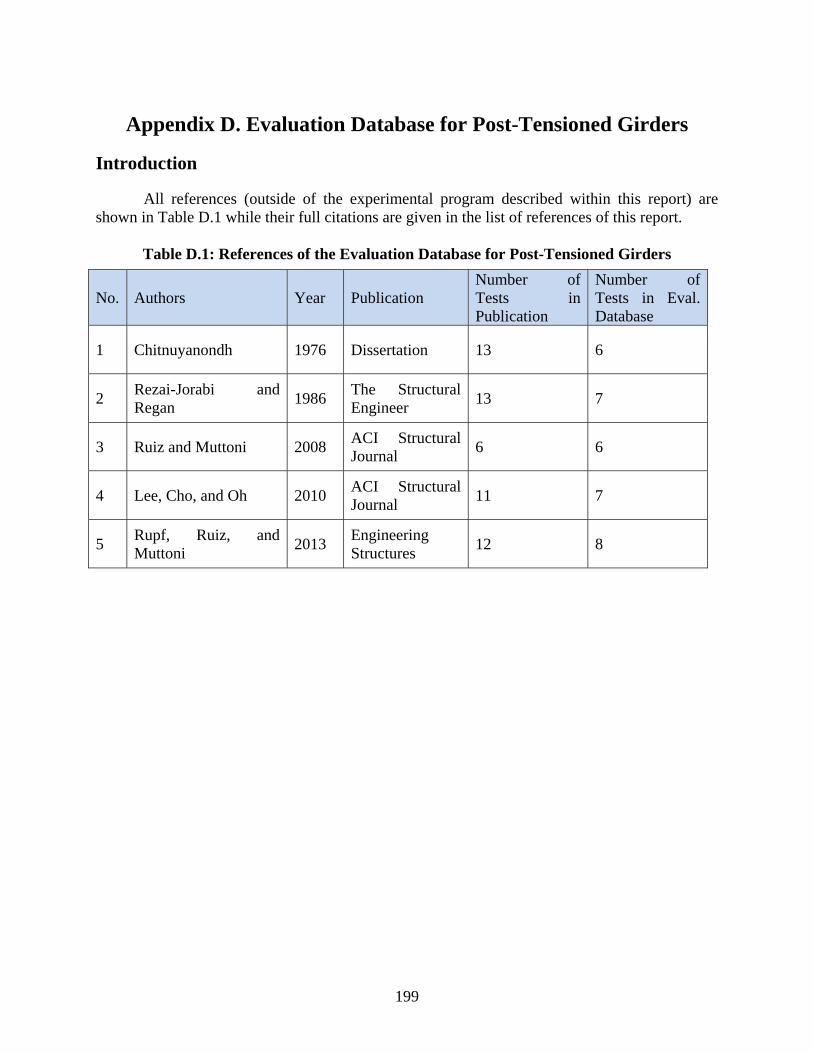
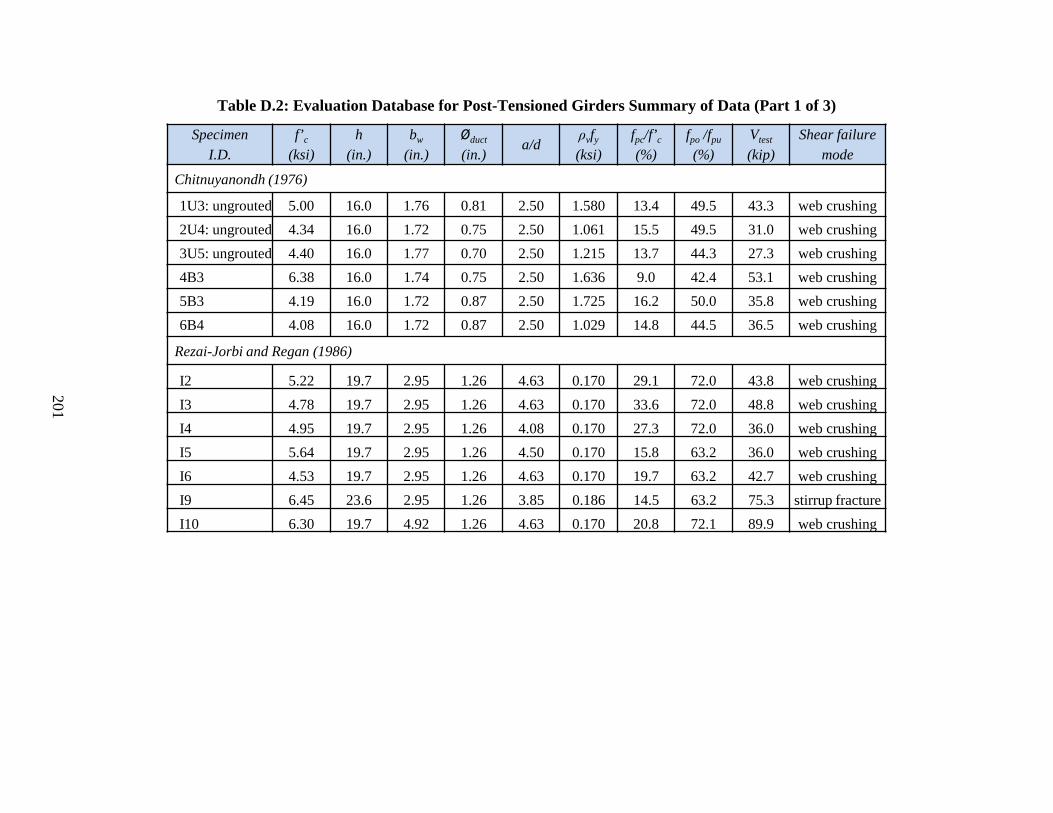
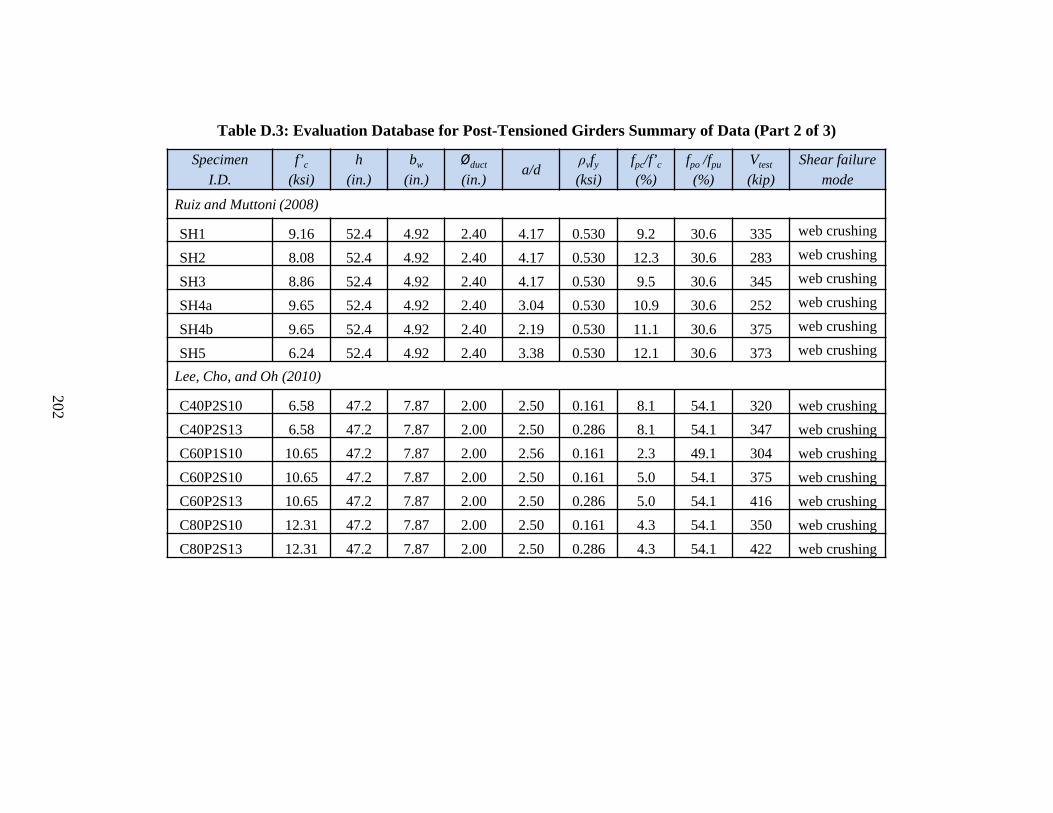
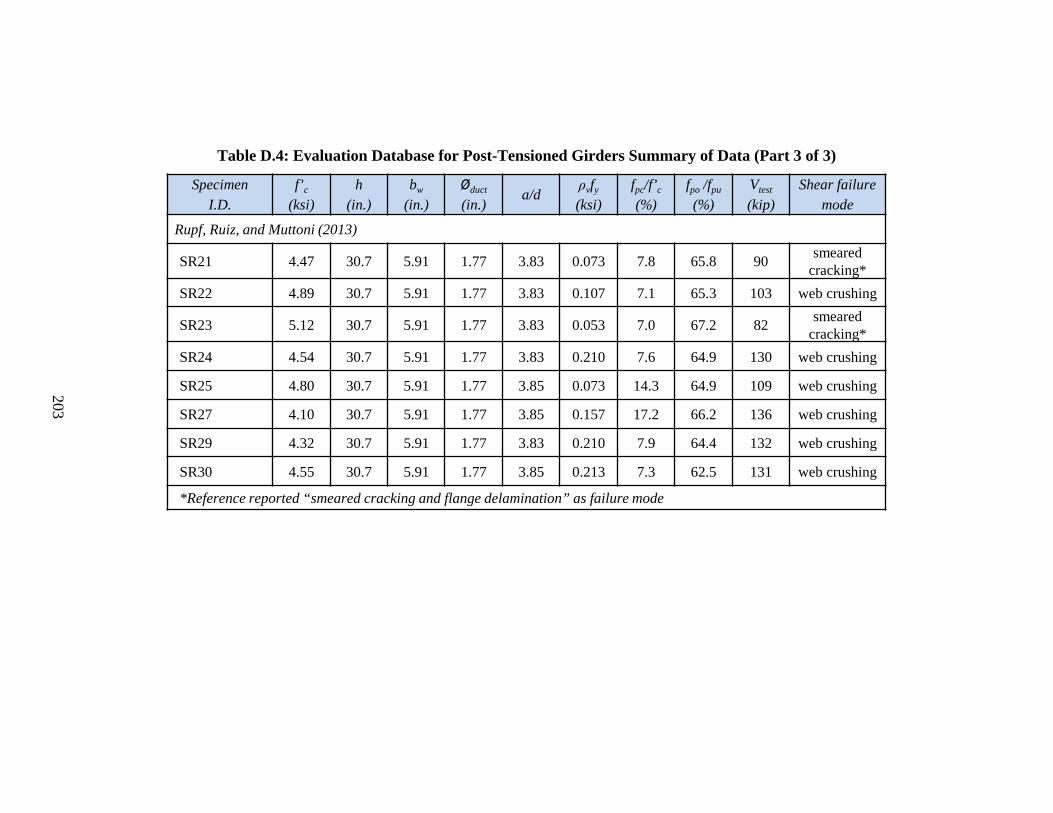
APPENDIX D. Evaluation Database for Post-Tensioned Girders ............................................. 199
xi
List of Figures
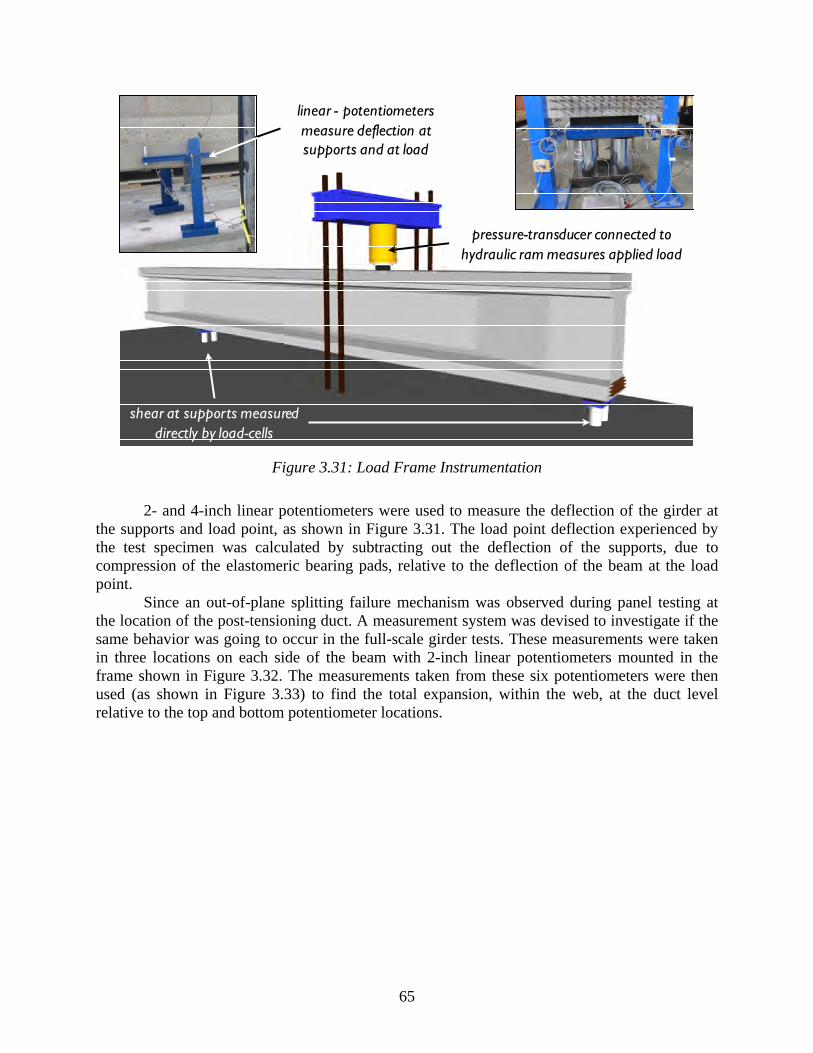
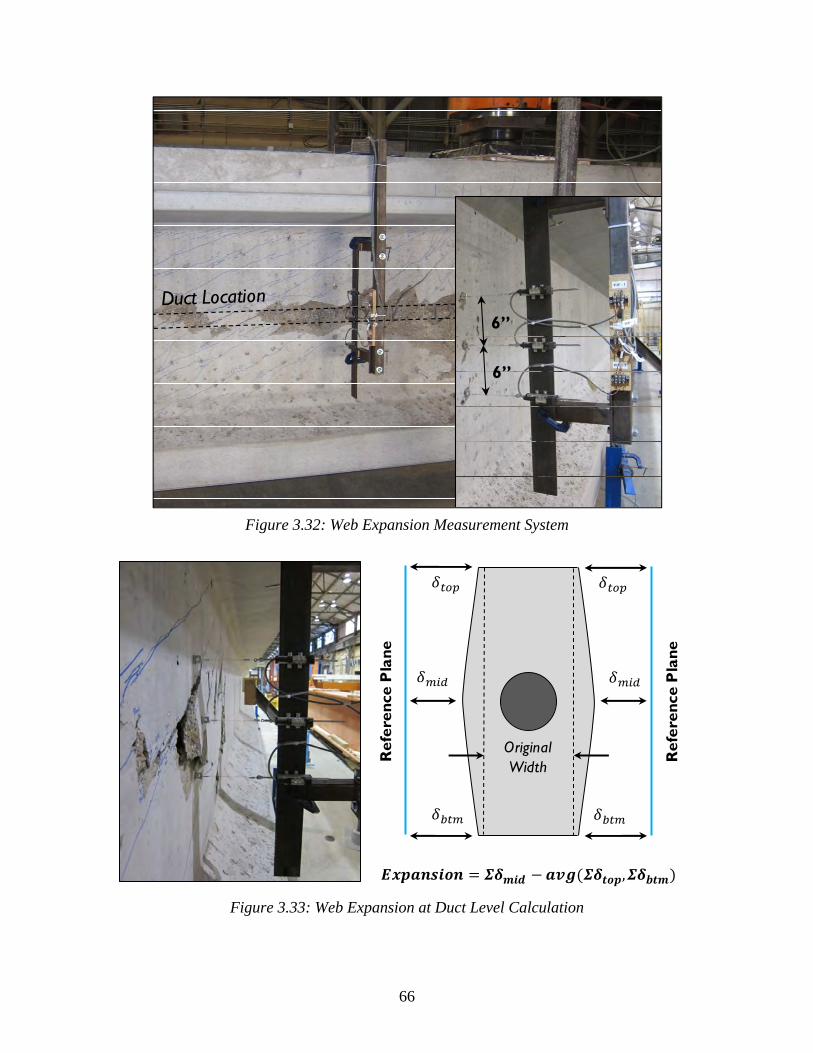
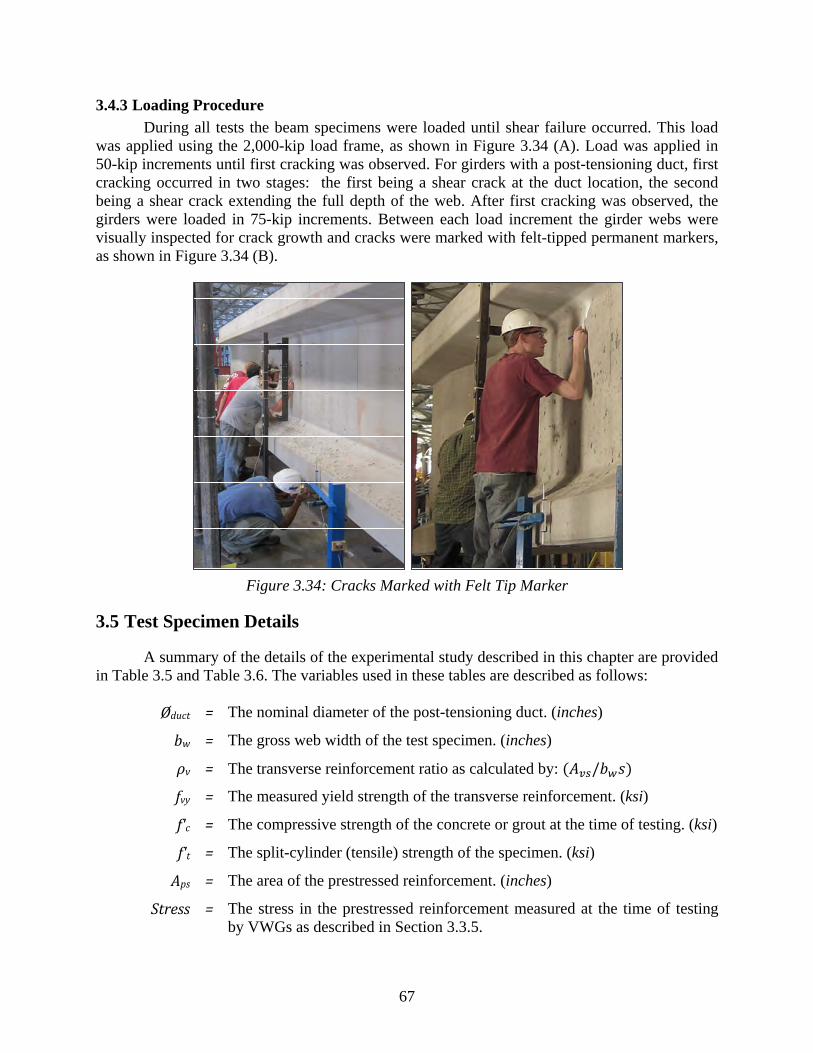
Figure 1.1: Simple and Multi-span Continuous Spliced Girder Construction ................................ 1 Figure 2.1: Tx-Girder Cross-Sections ............................................................................................. 3 Figure 2.2: Equilibrium at Diagonal Shear Crack (Khaldoun & Collins, 1999) ............................ 5 Figure 2.3: Description of η Calibration Calculations ................................................................ 14 Figure 2.4: Compressive Strut - Panel Strength Analogy (Adapted from Muttoni 2006) ............ 15 Figure 2.5: Splitting and Crushing Failure Mechansims of Panel Specimens .............................. 16 Figure 2.6: Cross-Sectional Area Experiencing Compression and Tension ................................. 17 Figure 2.7: Tested ηD Values for Ungrouted/Empty Ducts (Wald, 2012) .................................... 18 Figure 2.8: Tested ηD Values for Grouted Ducts (Wald, 2012) .................................................... 18 Figure 2.9: UT Prestressed Concrete Shear Collection Database Characteristics ........................ 21 Figure 2.10: Filtered Evaluation Database Filtering Criteria ........................................................ 22 Figure 2.11: Distribution of Concrete Strength in PT Evaluation Database ................................. 23 Figure 2.12: Distribution of Specimen Height in PT Evaluation Database .................................. 24 Figure 2.13: Distribution of Composite Girders in PT Evaluation Database ............................... 24 Figure 2.14: Distribution of Shear Span to Depth Ratios in PT Evaluation Database ................. 25 Figure 2.15: Distribution of Transverse Reinforcement Ratio in the PT Evaluation Database .... 26 Figure 2.16: Distribution of the Post-Tensioning Duct Diameter to the Web Width of Girders
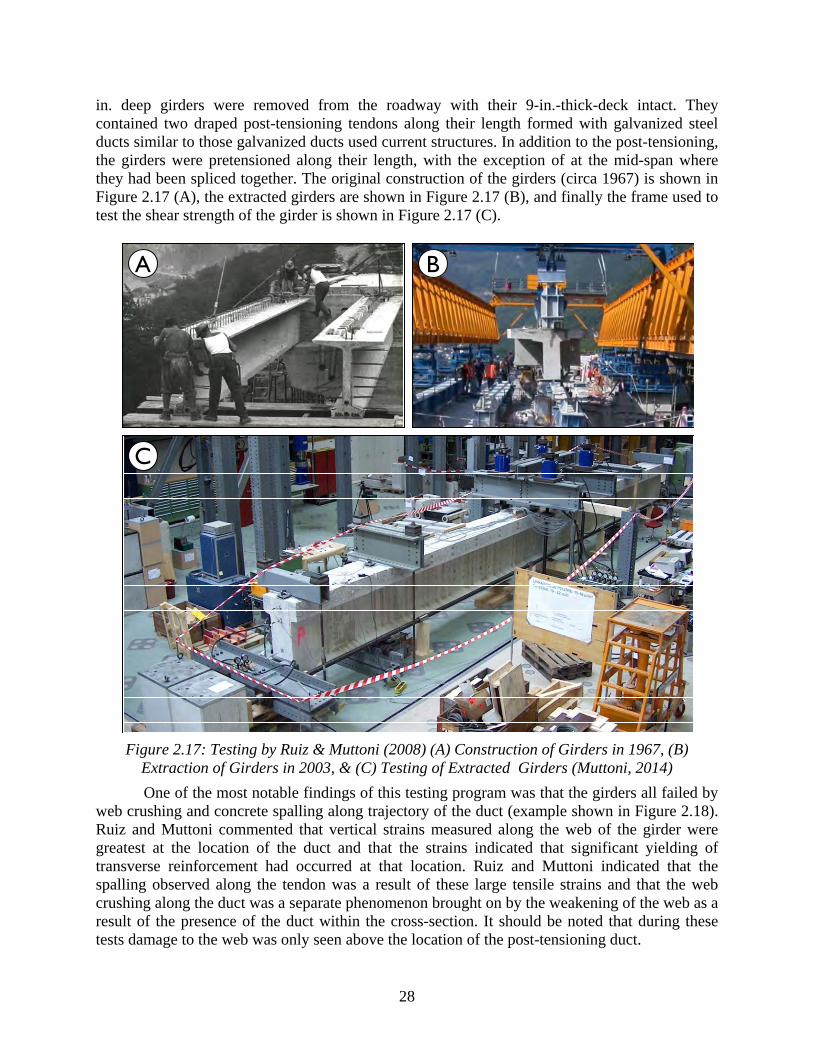
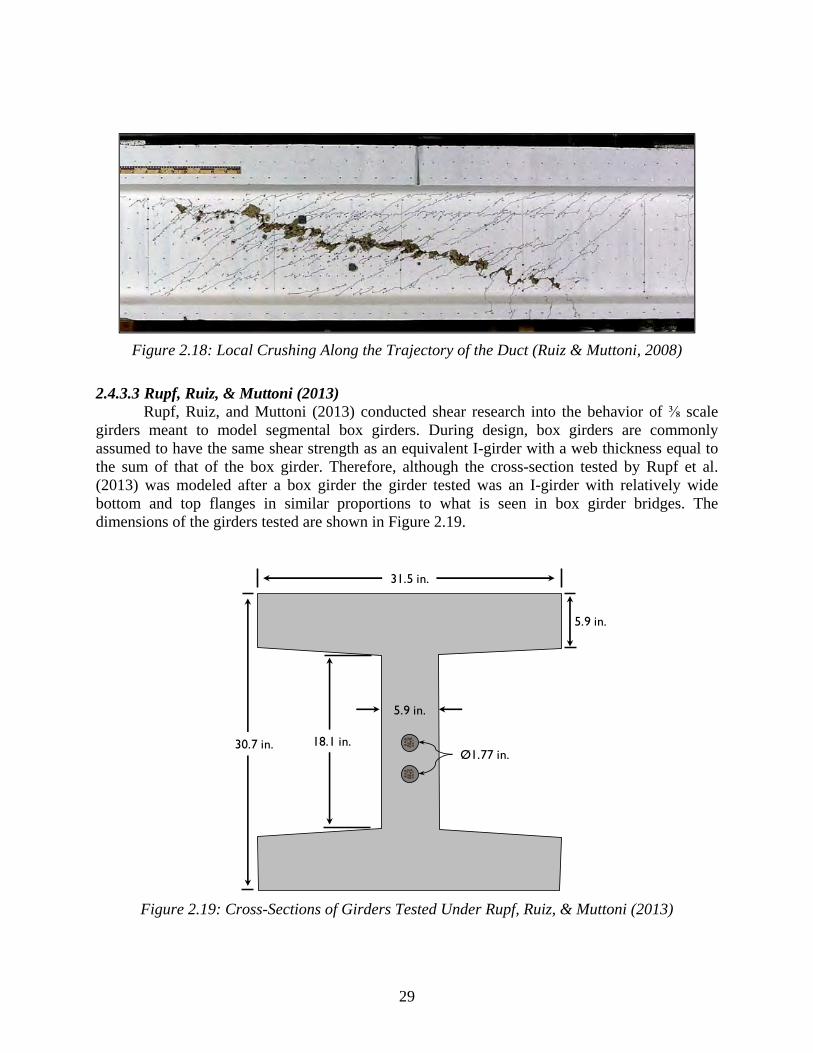
in the PT Evaluation Database ............................................................................... 26 Figure 2.17: Testing by Ruiz & Muttoni (2008) (A) Construction of Girders in 1967, (B)
Extraction of Girders in 2003, & (C) Testing of Extracted Girders ..................... 28 Figure 2.18: Local Crushing Along the Trajectory of the Duct (Ruiz & Muttoni, 2008) ............ 29 Figure 2.19: Cross-Sections of Girders Tested Under Rupf, Ruiz, & Muttoni (2013) ................. 29 Figure 2.20: Test Setup of Rupf, Ruiz, & Muttoni (2013) (Muttoni, 2014) ................................. 30 Figure 2.21: Loading Configuration, Moment, and Shear Diagrams of Tests by Rupf et al. ...... 30 Figure 3.1: Tx62 Test Specimens Showing Dimensions of 7 and 9-inch-thick Web Girders ...... 35 Figure 3.2: Pretensioning Strand Layout and Debonding ............................................................. 36 Figure 3.3: Post-Tensioning Tendon Profile at 35.25-inches from Bottom of Girder .................. 38 Figure 3.4: Post-Tensioning Anchorage ....................................................................................... 39 Figure 3.5: Possible End-Block Geometries Explored During Design ........................................ 40 Figure 3.6: Rendering of End-Block Reinforcement (Part 1 of 3) ............................................... 41 Figure 3.7: Rendering of End-Block Reinforcement (Part 2 of 3) ............................................... 42 Figure 3.8: Rendering of End-Block Reinforcement (Part 3 of 3) ............................................... 43 Figure 3.9: Local Zone Reinforcement Provided at Post-Tensioning Anchorage ........................ 44 Figure 3.10: Bursting & Splitting Reinforcement Provided in Orthogonal Directions ................ 45 Figure 3.11: Calculations for Transverse Post-tensioning Bursting Reinforcement .................... 46 Figure 3.12: Calculations for Through-Thickness Reinforcement (D & DS-bars) ...................... 47 Figure 3.13: Reinforcement Provided by RE and RC-bars (Bergmeister, et al., 1993) ................ 48 Figure 3.14: Individual Stressing of the Pretensioning Strands at Fabrication Plant ................... 49
xii
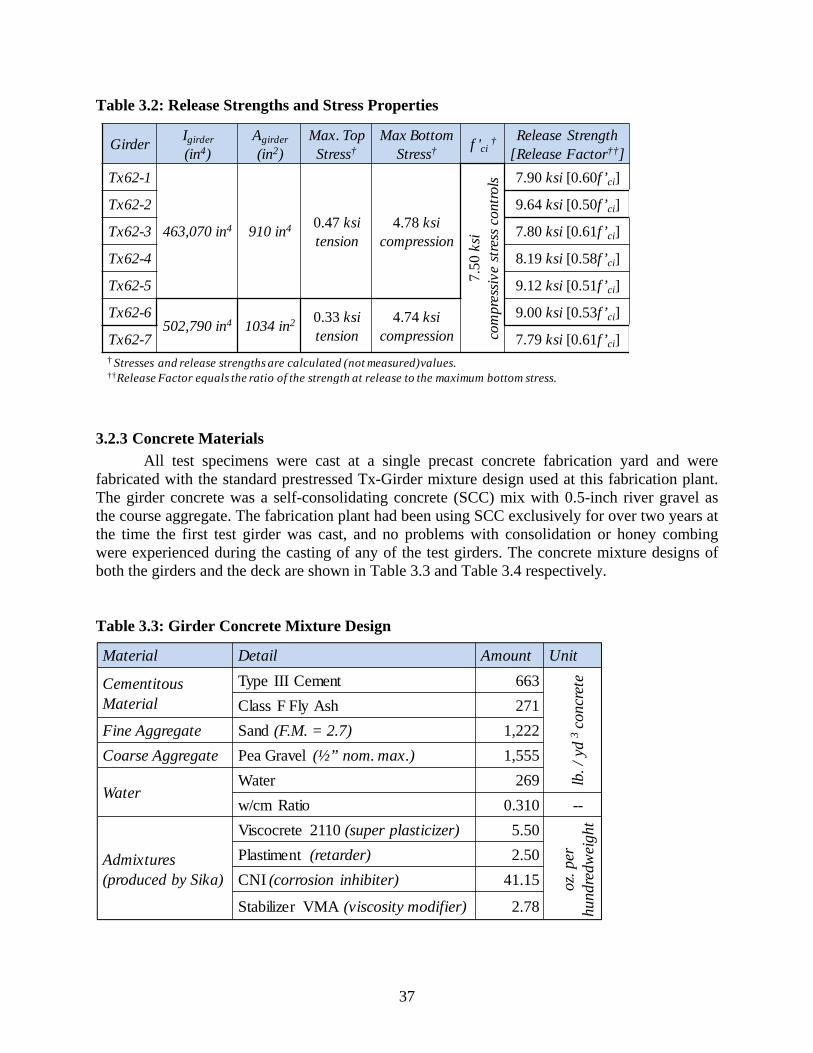
Figure 3.15: (A) Mounting and Sealing Post-Tensioned Anchorage, (B) Local Zone Reinforcement & (C) Duct Supports Spaced at 2 feet ........................................... 50
Figure 3.16: End-block reinforcing cage of Tx62-7 ..................................................................... 51 Figure 3.17: Concrete Consolidation (A) “Stinger” Type Vibrators Used within End-Block &
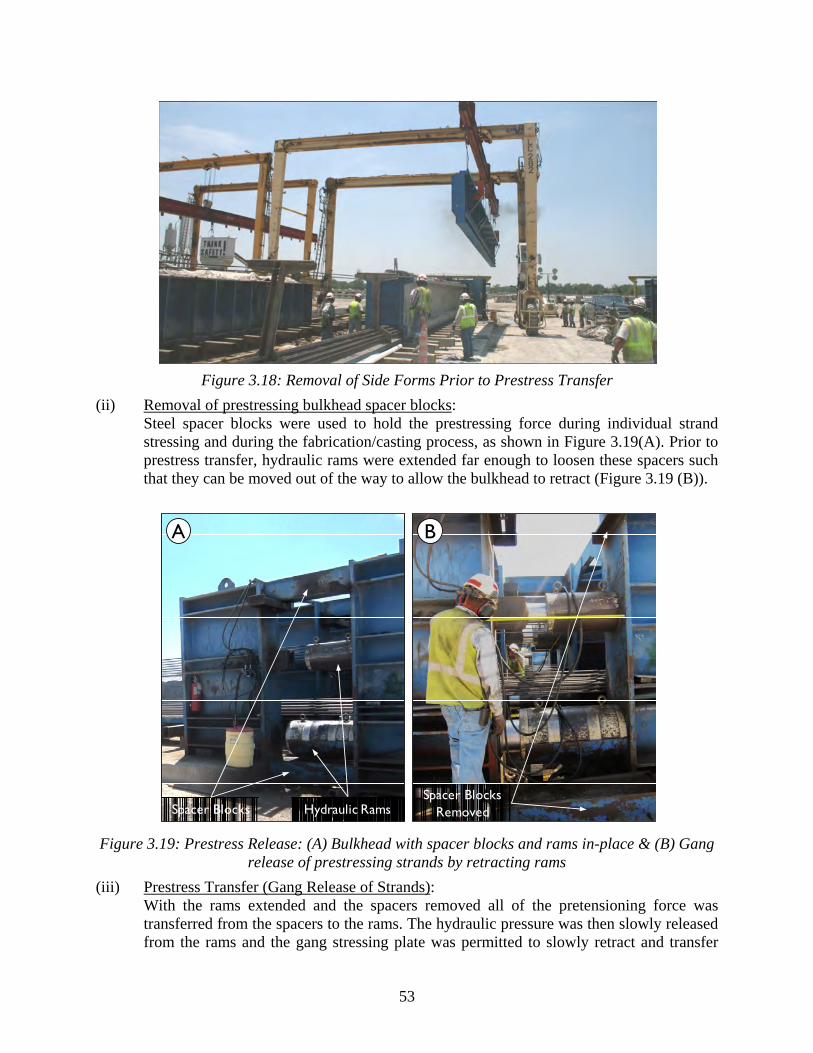
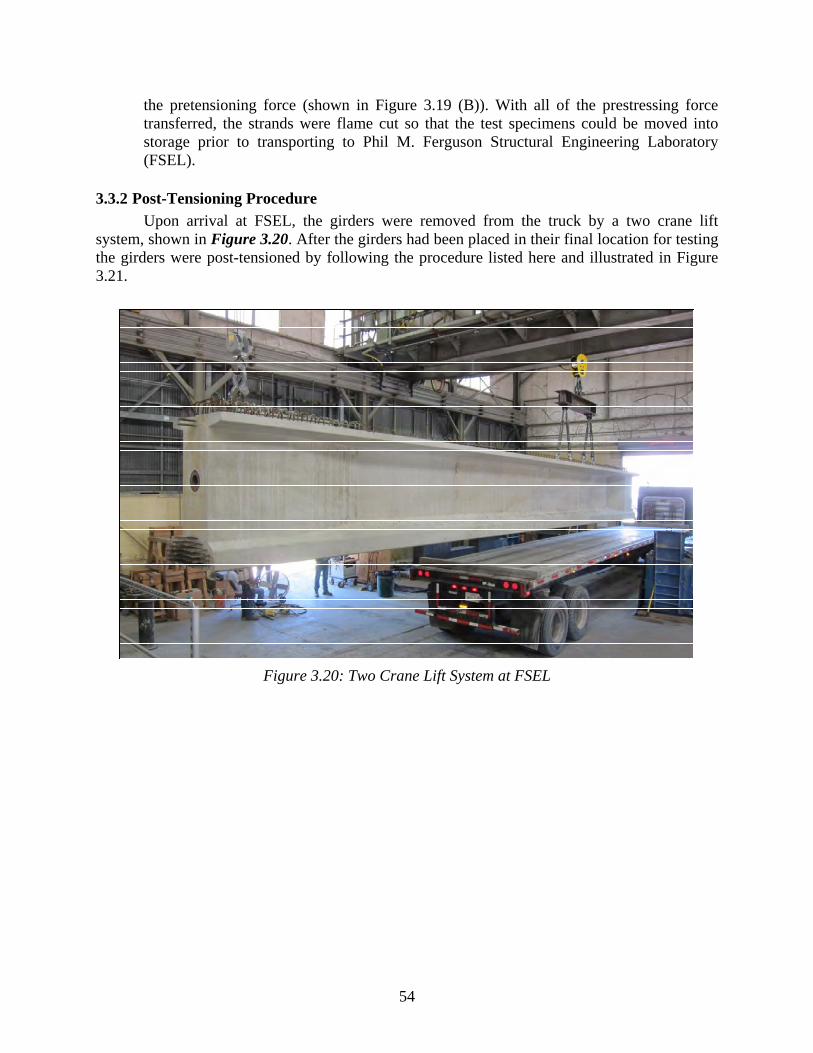
(B), (C) Self-Consolidating Concrete Flow ........................................................... 52 Figure 3.18: Removal of Side Forms Prior to Prestress Transfer ................................................. 53 Figure 3.19: Prestress Release: (A) Bulkhead with spacer blocks and rams in-place & (B)
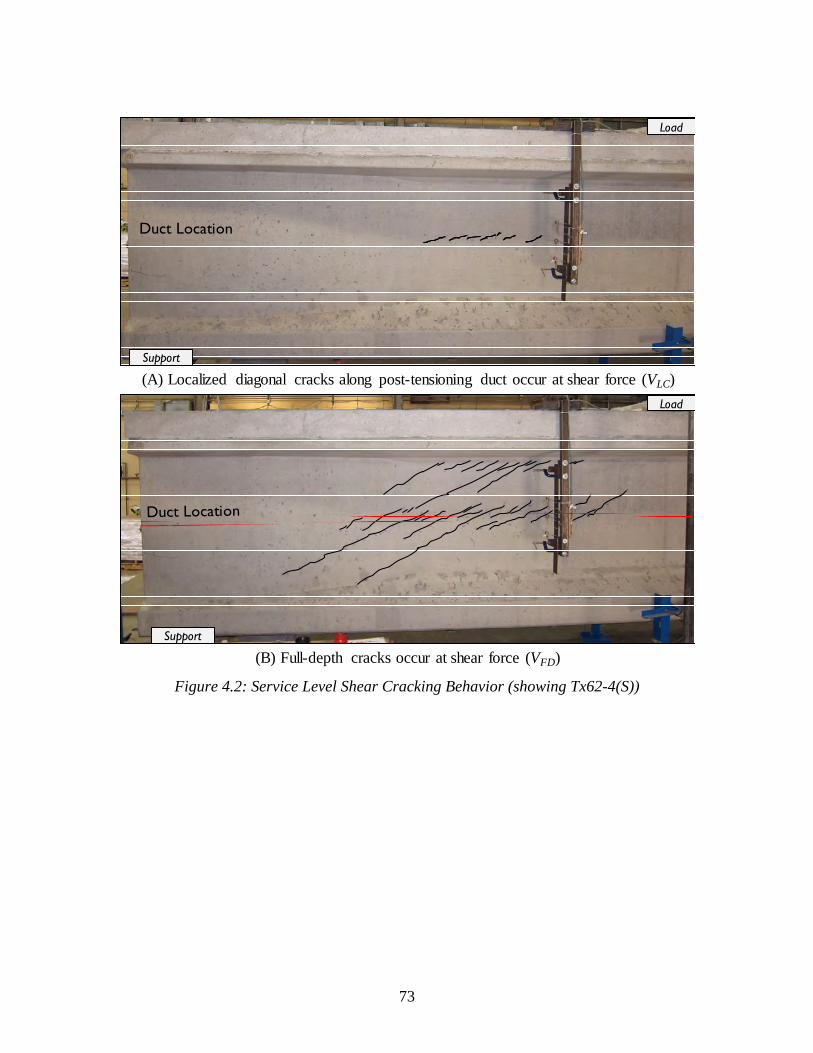
Gang release of prestressing strands by retracting rams ........................................ 53 Figure 3.20: Two Crane Lift System at FSEL .............................................................................. 54 Figure 3.21: Post-tensioning Procedure ........................................................................................ 55 Figure 3.22: Grout vent connections ............................................................................................. 57 Figure 3.23: Grout mixing procedure ........................................................................................... 58 Figure 3.24: Grout Pumping Procedure ........................................................................................ 59 Figure 3.25: Deck Dimensions (consistent dimensions not shown) ............................................. 60 Figure 3.26: Vibrating Wire Gauge Attached to Top Strands ...................................................... 61 Figure 3.27: Explanation of VWG Calculation for Prestress Losses (Gallardo, 2014) ................ 62 Figure 3.28: Explanation of Calculation for Post-Tensioning Force (Gallardo, 2014) ................ 62 Figure 3.29: 2,000-kip Load Frame .............................................................................................. 63 Figure 3.30: Shear Test Span Layout ............................................................................................ 64 Figure 3.31: Load Frame Instrumentation .................................................................................... 65 Figure 3.32: Web Expansion Measurement System ..................................................................... 66 Figure 3.33: Web Expansion at Duct Level Calculation .............................................................. 66 Figure 3.34: Cracks Marked with Felt Tip Marker ....................................................................... 67 Figure 4.1: Service Level Load as a Function of Vtest (Birrcher, et al., 2009) .............................. 71 Figure 4.2: Service Level Shear Cracking Behavior (showing Tx62-4(S)) .................................. 73 Figure 4.3: Web Expansion Measurements taken at mid-height of the web corresponding
with the Height of the Post-Tensioning Duct where applicable (Part 1 of 3) ........ 76 Figure 4.4: Web Expansion Measurements taken at mid-height of the web corresponding
with the Height of the Post-Tensioning Duct where applicable (Part 2 of 3) ........ 77 Figure 4.5: Web Expansion Measurements taken at mid-height of the web corresponding
with the Height of the Post-Tensioning Duct where applicable (Part 3 of 3) ........ 78 Figure 4.6: Failure Mechanisms of Test Specimens Primary Failure Cracks in Red (1 of 3) ...... 80 Figure 4.7: Failure Mechanisms of Test Specimens Primary Failure Cracks in Red (2 of 3) ...... 81 Figure 4.8: Failure Mechanisms of Test Specimens Primary Failure Cracks in Red (3 of 3) ...... 82 Figure 4.9: Shear Force Diagram and Explanation of Critical Section (not to scale) .................. 83 Figure 4.10: Shear Force - Deflection Plot of Tx62-2N ............................................................... 84 Figure 4.11: Load – Deflection Plots of all Test Specimens (Part 1 of 2) .................................... 85 Figure 4.12: Load – Deflection Plots of all Test Specimens (Part 2 of 2) .................................... 86 Figure 4.13: Calculation of Ultimate (Tested) Shear Stress ......................................................... 87 Figure 4.14: Normalized Ultimate Shear Stress vs. Concrete Compressive Strength .................. 88
xiii
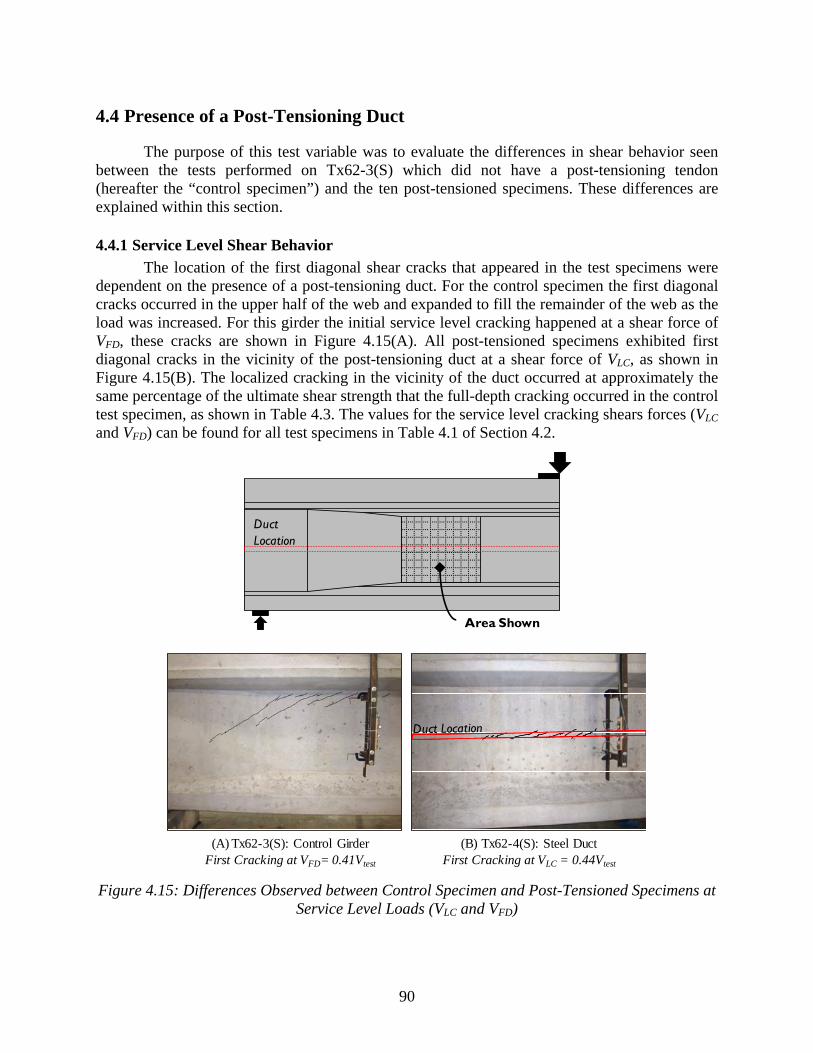
Figure 4.15: Differences Observed between Control Specimen and Post-Tensioned Specimens at Service Level Loads (VLC and VFD) ................................................. 90
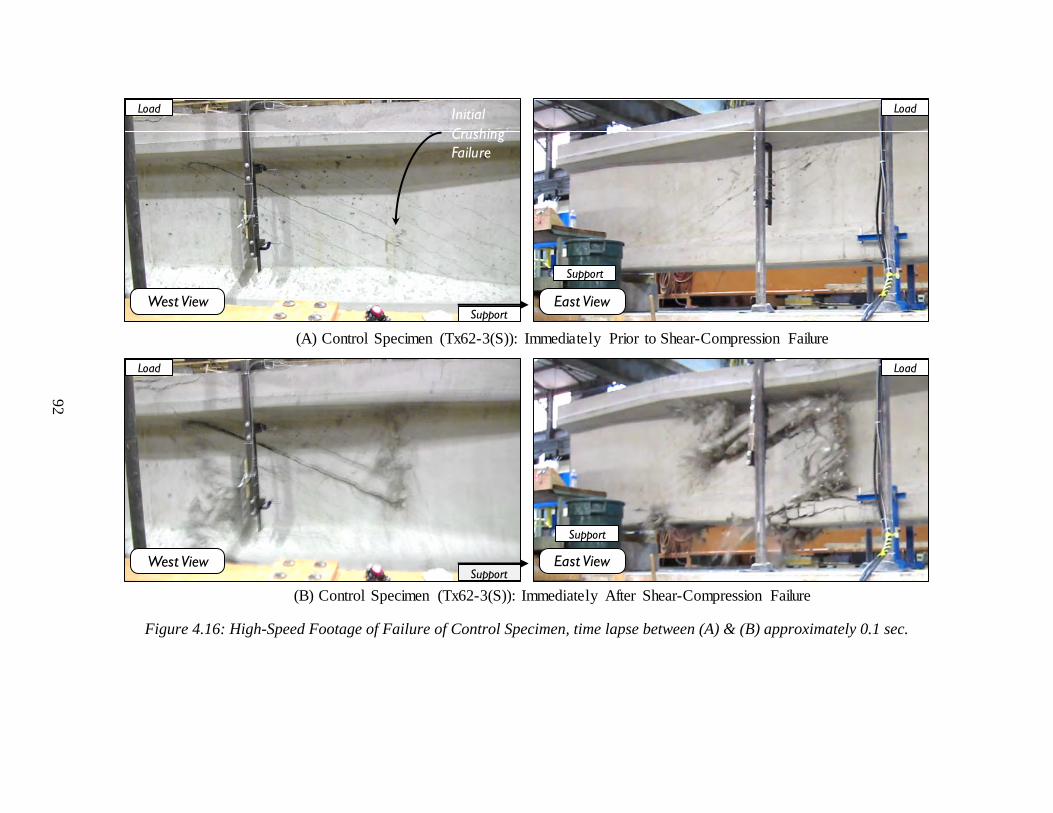
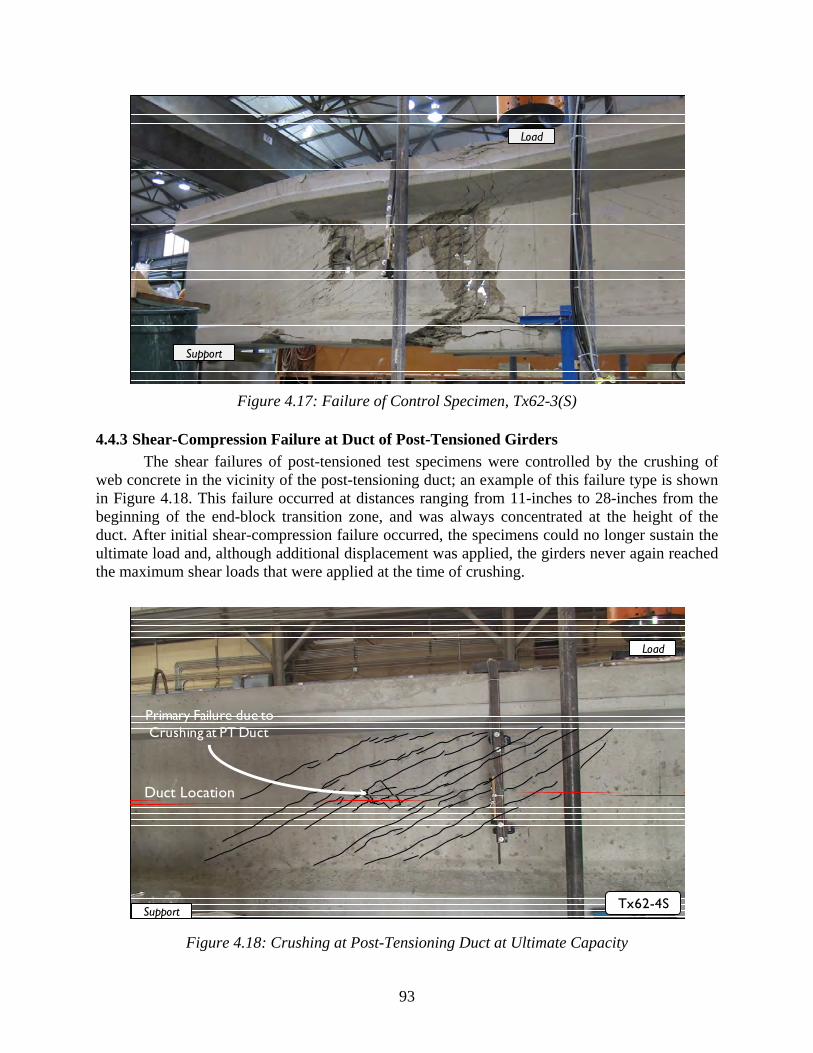
Figure 4.16: High-Speed Footage of Failure of Control Specimen, time lapse between (A) & (B) approximately 0.1 sec. ..................................................................................... 92
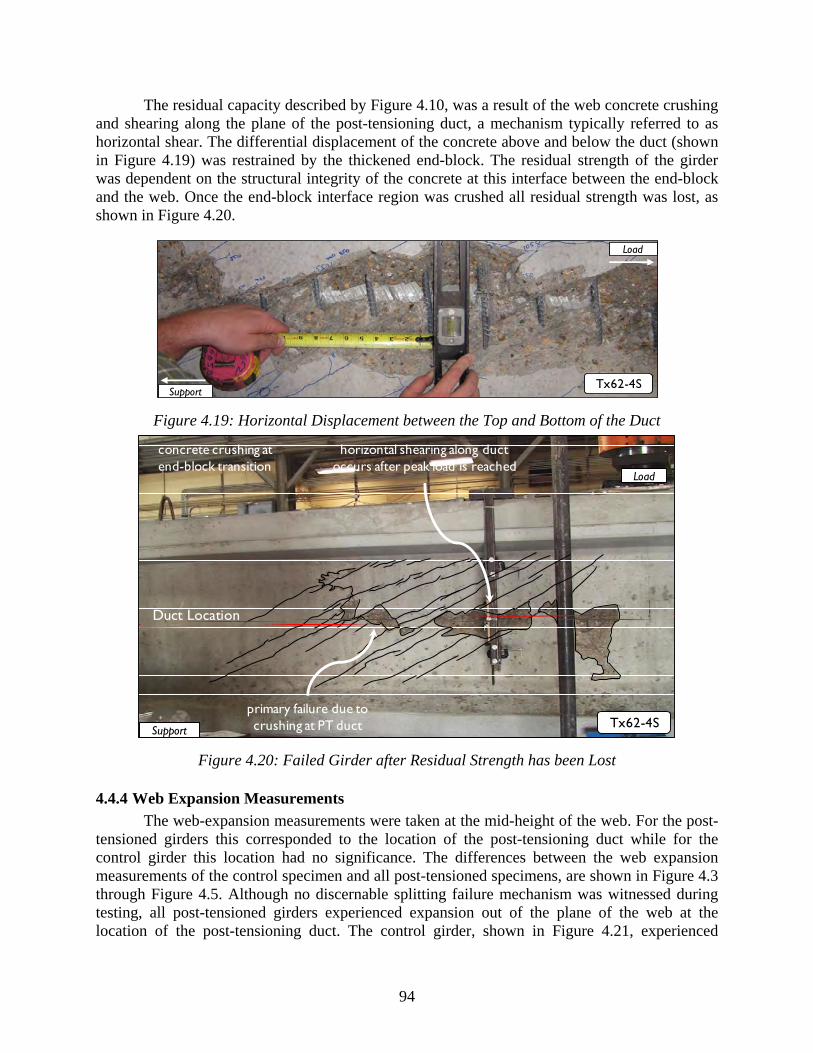
Figure 4.17: Failure of Control Specimen, Tx62-3(S) .................................................................. 93 Figure 4.18: Crushing at Post-Tensioning Duct at Ultimate Capacity ......................................... 93 Figure 4.19: Horizontal Displacement between the Top and Bottom of the Duct ....................... 94 Figure 4.20: Failed Girder after Residual Strength has been Lost ................................................ 94 Figure 4.21: Mid-Height Web Expansion Measurement of Control Specimen ............................ 95 Figure 4.22: 6-inches above Mid-Height Web Expansion Measurement of Control .................. 95 Figure 4.23: Effect of Post-Tensioning Duct Material on Failure Mechanism ............................ 98 Figure 4.24: Effect of Duct Material on Normalized Shear Stress at Ultimate ............................ 99 Figure 4.25: Effect of Duct Diameter-to-Web Width on Shear Failure Mechanism .................. 101 Figure 4.26: Normalized Ultimate Shear Stress vs. Duct Diameter-to-Web Width Ratio ......... 102 Figure 4.27: Effect of Transverse Reinforcement on Service Level Shear Cracking ................. 103 Figure 4.28: Effect of Transverse Reinforcement on the Failure Mechanism ............................ 104 Figure 4.29: Normalized Ultimate Shear Stress vs. Transverse Reinforcement Ratio ............... 105 Figure 5.1: Post-Tensioned Evaluation Database Girder Cross-Sections ................................... 107 Figure 5.2: Histograms of PT Evaluation Database for SSR Calculated with ACI 318-11 &
AASHTO (2013) .................................................................................................. 109 Figure 5.3: Shear Strength Ratios Calculated with AASHTO General Procedure for
Evaluation Databases of Pre- and Post-Tensioned Girders .................................. 113 Figure 5.4: Effect of Duct Diameter to Web Width on the SSR Denoting Grouted Plastic
Duct Specimens .................................................................................................... 114 Figure 5.5: Effect of the Duct Diameter-to-Web Width Ratio on the SSR ................................ 115 Figure 5.6: Effect of the Transverse Reinforcement Ratio on the SSR ...................................... 116 Figure 5.7: Effect of the Shear Span-to-Depth Ratio on the SSR ............................................... 117 Figure 5.8: Shear Failure Mechanism in PT Evaluation Database (n=44 tests) ......................... 118 Figure 5.9: Vc and Vs Components of Shear Strength in a Girder .............................................. 119 Figure 5.10: Shear Strength Ratio versus allowable duct diameter ratio .................................... 123 Figure 5.11: Relationship between Diagonal Compressive Strut and Transverse
Reinforcement Contributing to Shear Strength .................................................... 126 Figure 5.12: Accounting for Reduction in Shear Strength as a Result of a Post-Tensioning
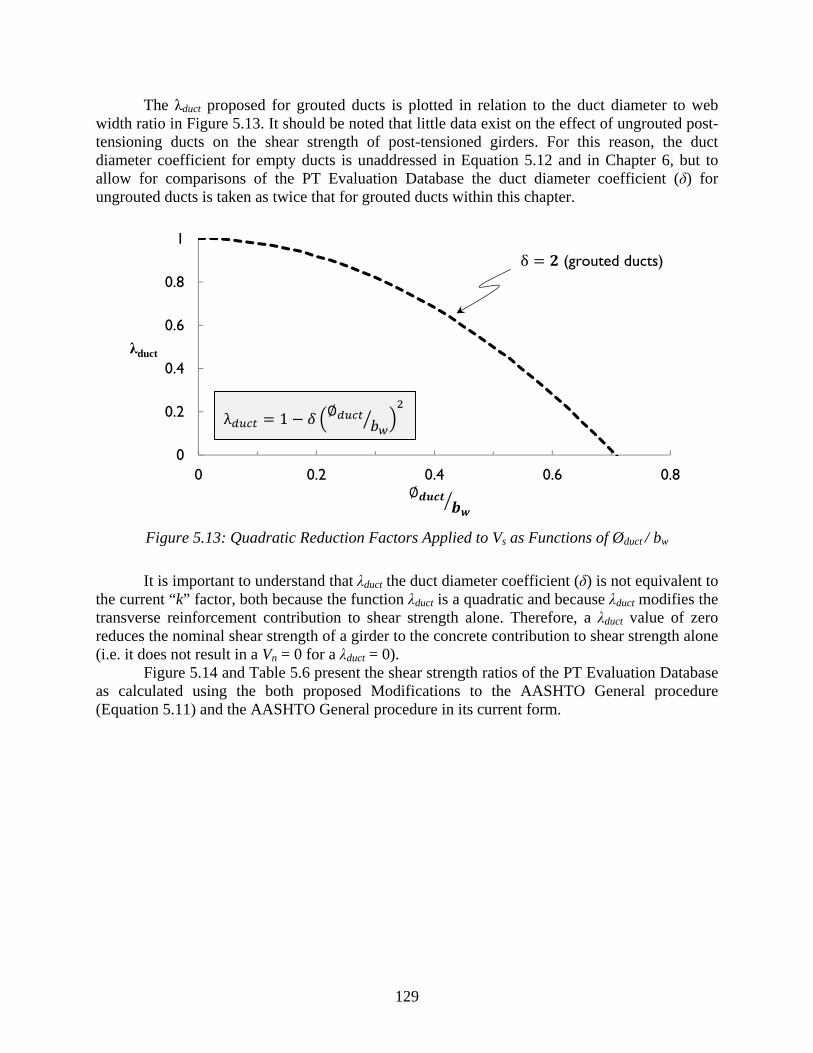
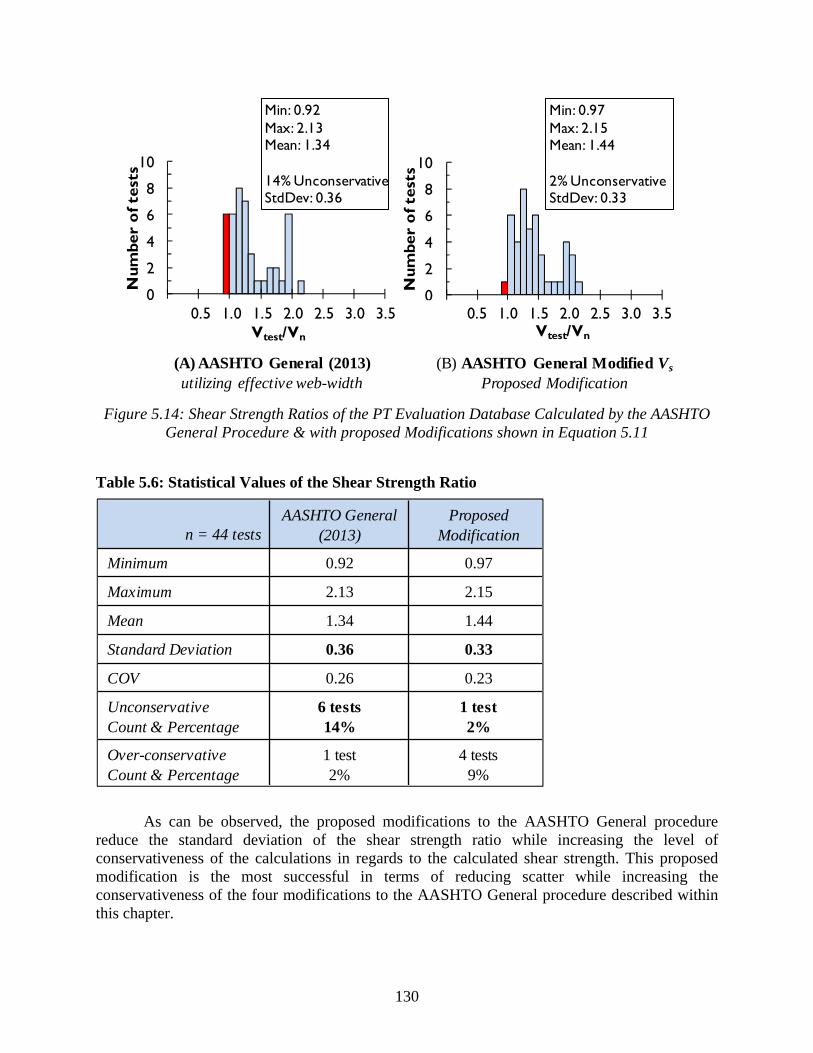
Duct by Reducing the Transverse Reinforcement Contribution .......................... 127 Figure 5.13: Quadratic Reduction Factors Applied to Vs as Functions of Øduct / bw .................. 129 Figure 5.14: Shear Strength Ratios of the PT Evaluation Database Calculated by the
AASHTO General Procedure & with proposed Modifications shown in Equation 5.11 ........................................................................................................ 130
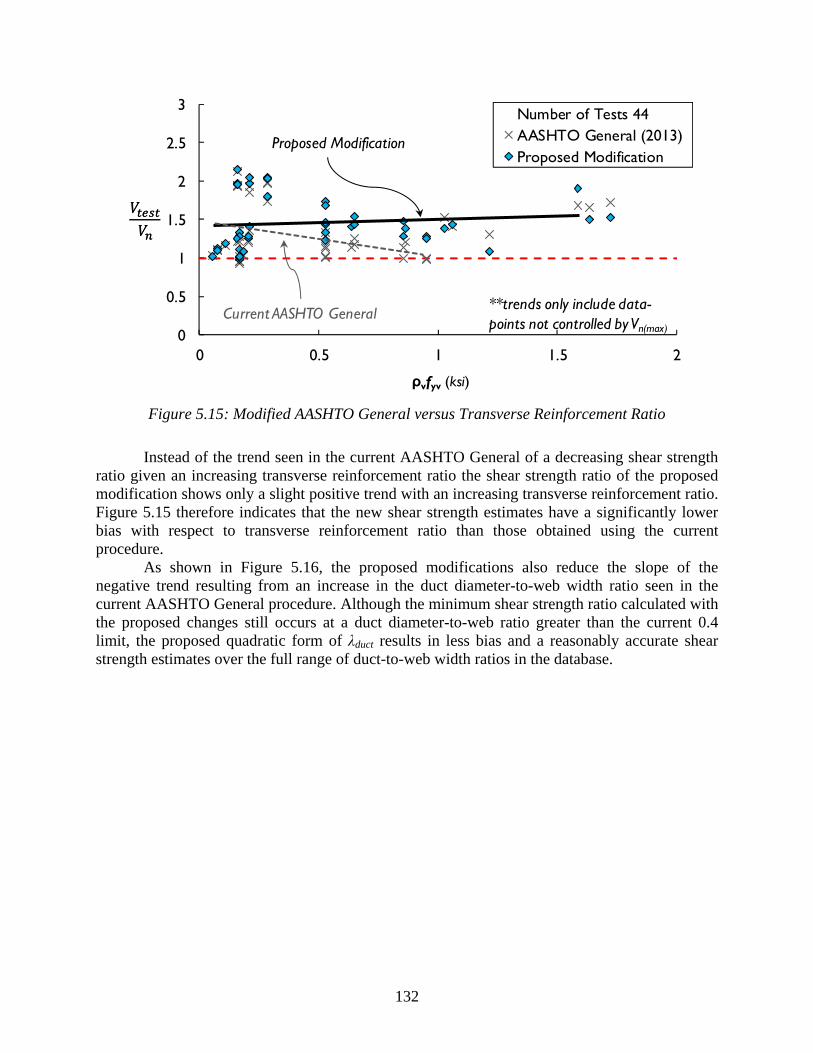
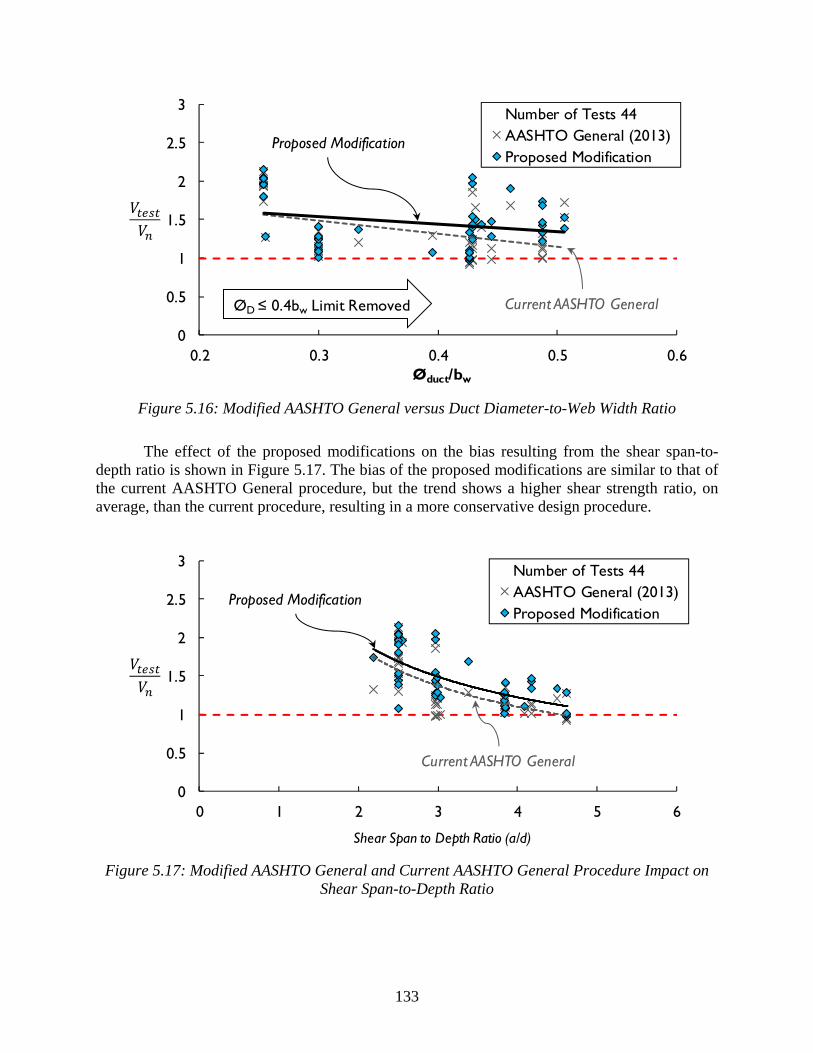
Figure 5.15: Modified AASHTO General versus Transverse Reinforcement Ratio .................. 132 Figure 5.16: Modified AASHTO General versus Duct Diameter-to-Web Width Ratio ............ 133
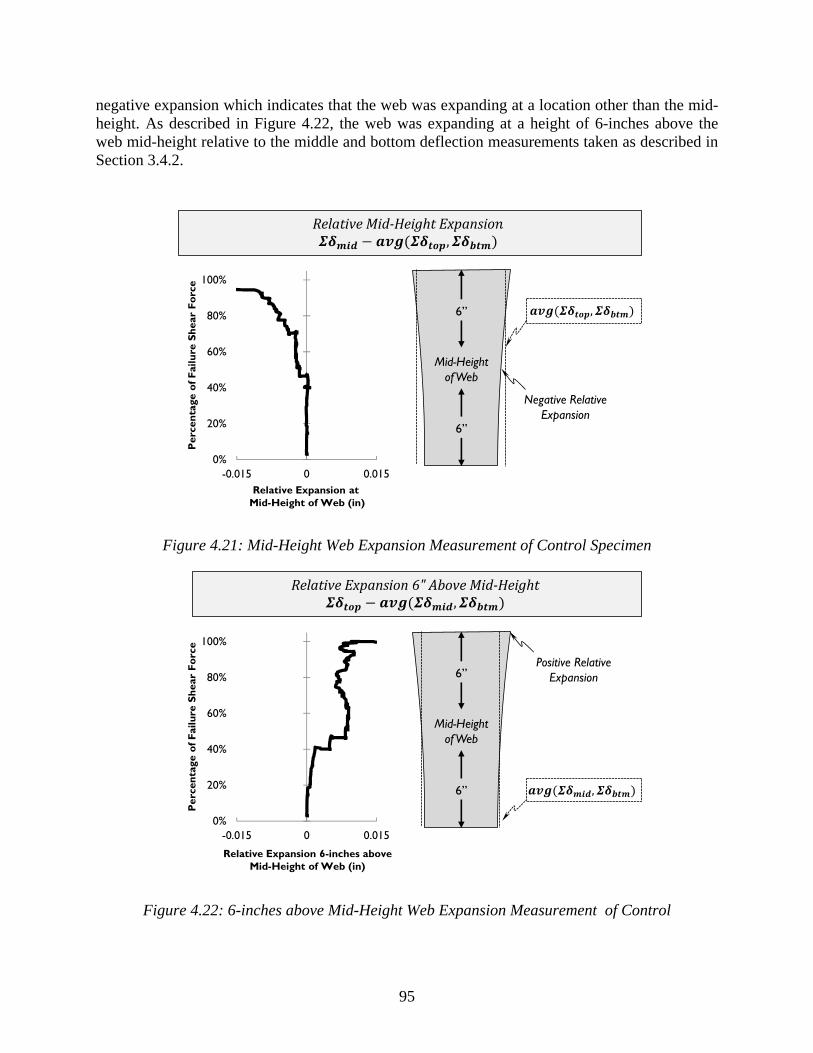
xiv
Figure 5.17: Modified AASHTO General and Current AASHTO General Procedure Impact on Shear Span-to-Depth Ratio .............................................................................. 133
Figure A.1: Dimensions of Panel Tests shown in Appendix A .................................................. 145
xv
List of Tables
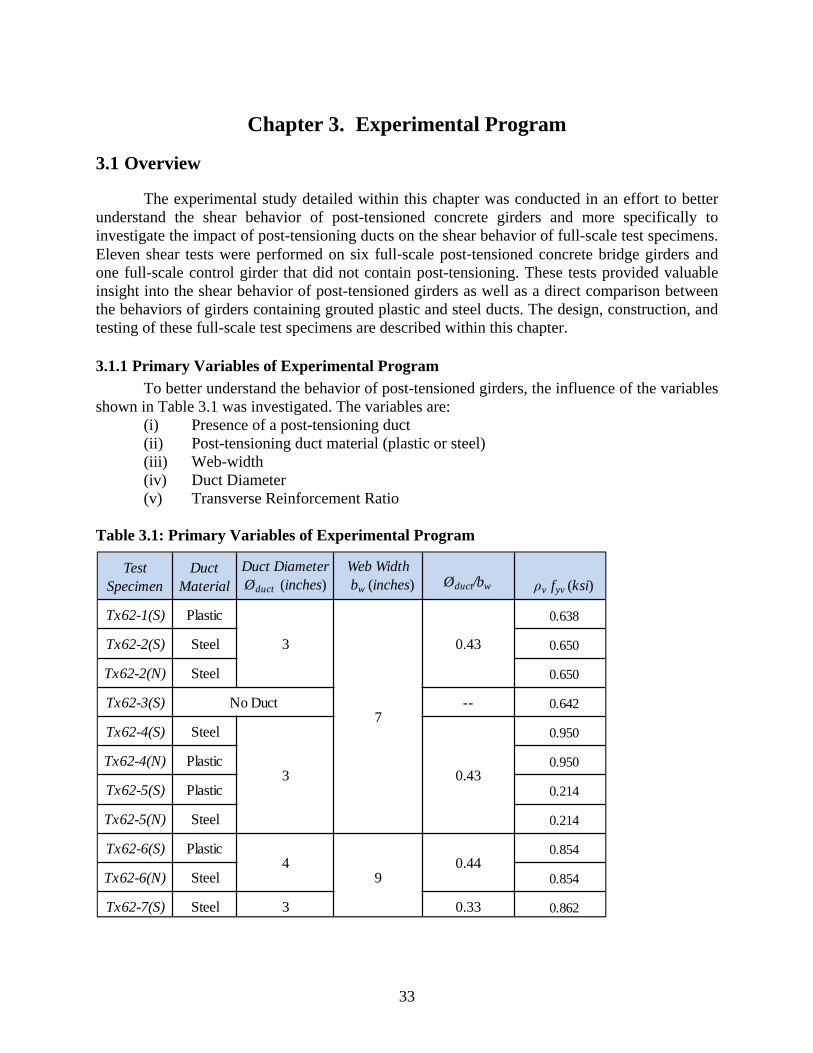
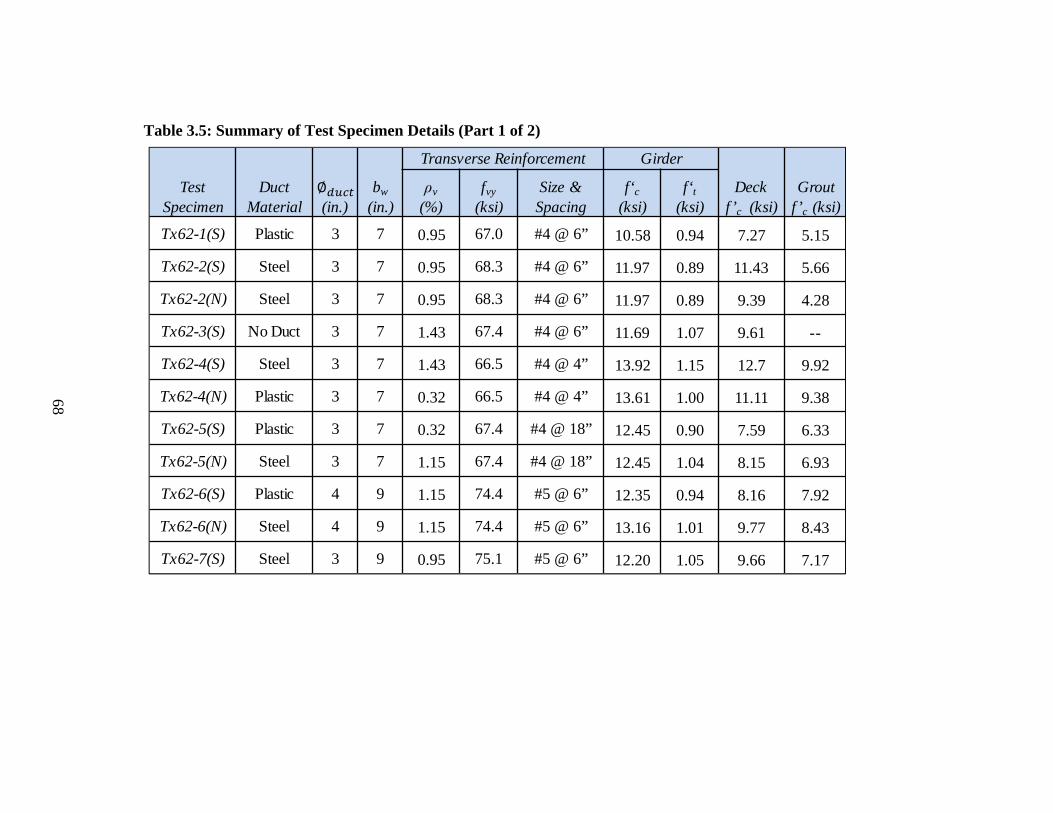
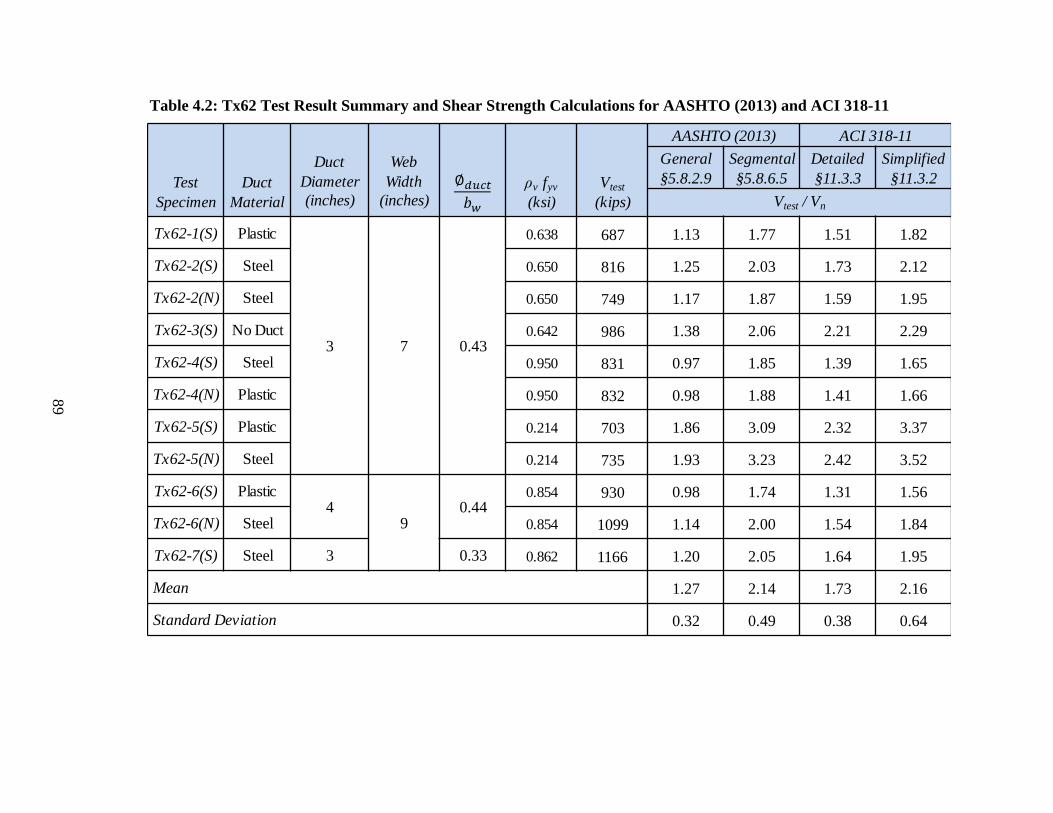
Table 2.1: Diameter Correction Factors (k) for Codes Considered ...............................................14 Table 3.1: Primary Variables of Experimental Program ...............................................................33 Table 3.2: Release Strengths and Stress Properties .......................................................................37 Table 3.3: Girder Concrete Mixture Design ..................................................................................37 Table 3.4: Deck Concrete Mixture Design ....................................................................................38 Table 3.6: Summary of Test Specimen Details (Part 1 of 2) .........................................................68 Table 3.7: Summary of Test Specimen Details (Part 2 of 2) .........................................................69 Table 4.1: Localized Cracks at Duct Documented at a Shear Force of VLC ..................................74 Table 4.2: Tx62 Test Result Summary and Shear Strength Calculations for AASHTO (2013)
and ACI 318-11 ..........................................................................................................89 Table 4.3: Service Level Cracking for Post-Tensioned and Control Specimens ...........................91 Table 4.4: Summary of Panel Test Data from Muttoni et al. (2006) & Current Study .................96 Table 4.5: Service Level Shear Behavior of Post-Tensioned Specimens ......................................97 Table 4.6: Effect of Web Width and Duct Diameter on the Service Level Behavior ..................100 Table 5.1: Shear Strength Ratios of PT Evaluation Database .....................................................110 Table 5.2: Required and Actual Shear Strength Resistance Factors ............................................111 Table 5.3: Statistical Evaluation of Databases for Pre & Post-Tensioned Girders (Calculated
with AASHTO General Procedure) .........................................................................113 Table 5.4: Statistical Values of the Shear Strength Ratios Calculated by the AASHTO
General Procedure illustrating the Effect of Altering the “k” Factor .......................121 Table 5.5: Effect of Modifing Limit on Shear Stress by Funciton of (∅ / ......................125 Table 5.6: Statistical Values of the Shear Strength Ratio ............................................................130 Table 5.7: ϕ and ϕreq for AASHTO General and Proposed Modifications ..................................131 Table D.1: References of the Evaluation Database for Post-Tensioned Girders .........................199 Table D.2: Evaluation Database for Post-Tensioned Girders Summary of Data (1 of 3) ...........201 Table D.3: Evaluation Database for Post-Tensioned Girders Summary of Data (2 of 3) ...........202 Table D.4: Evaluation Database for Post-Tensioned Girders Summary of Data (3 of 3) ...........203
1
Chapter 1. Introduction
1.1 Overview
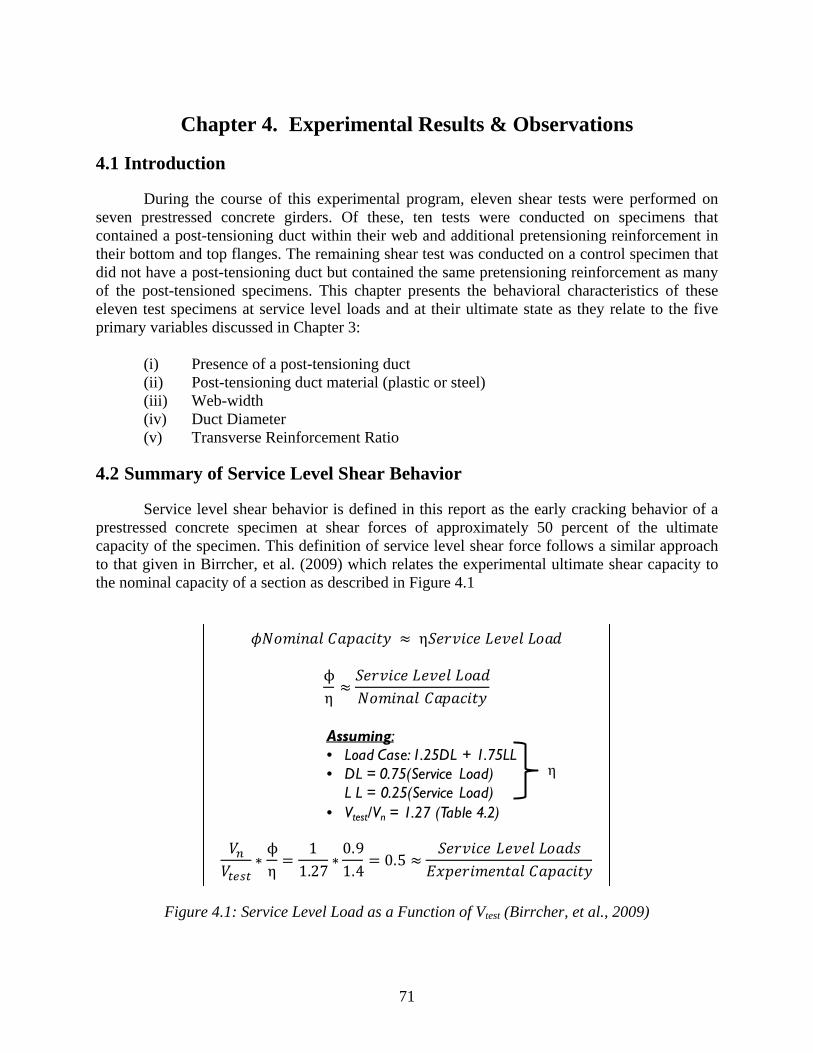
Recent technological advances have allowed prestressed concrete girder bridges to span long distances at a much lower cost than is possible with a steel girder bridge. Until recently most of these medium- to long-span prestressed girder bridges have been segmentally constructed, but the development of large bulb-tee sections has facilitated even more economical alternatives to steel girders in mid-length span applications ranging from approximately 200 to 300 feet. The purpose of this report is to evaluate the strength of these post-tensioned spliced girder bridges, and, more specifically, to evaluate the effect of the presence of a post-tensioning duct in the web of a girder on the overall shear capacity.
1.2 Brief Overview of Spliced Girder Technology
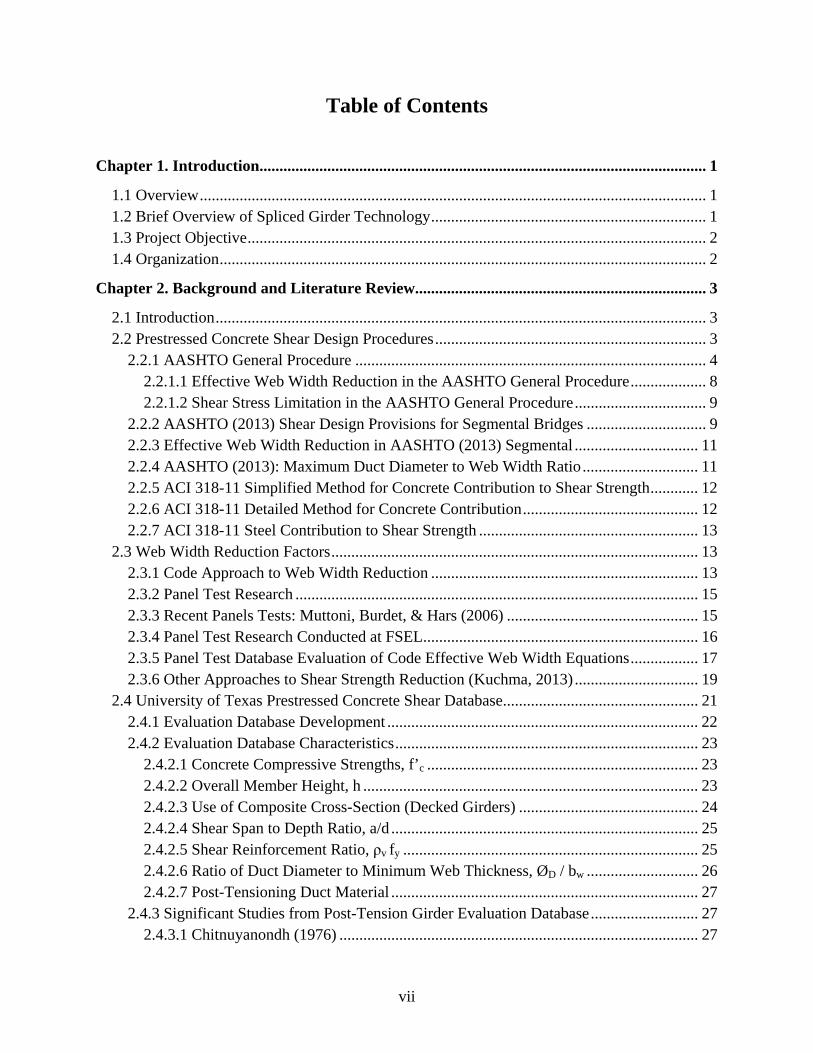
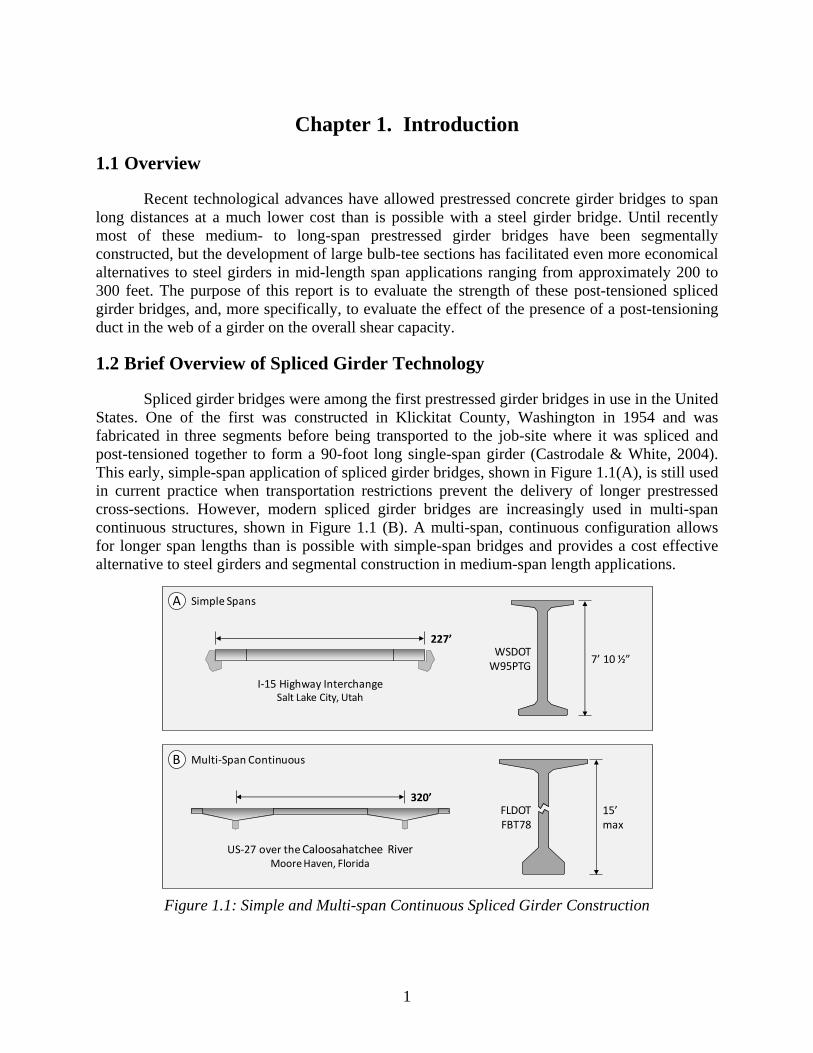
Spliced girder bridges were among the first prestressed girder bridges in use in the United States. One of the first was constructed in Klickitat County, Washington in 1954 and was fabricated in three segments before being transported to the job-site where it was spliced and post-tensioned together to form a 90-foot long single-span girder (Castrodale & White, 2004). This early, simple-span application of spliced girder bridges, shown in Figure 1.1(A), is still used in current practice when transportation restrictions prevent the delivery of longer prestressed cross-sections. However, modern spliced girder bridges are increasingly used in multi-span continuous structures, shown in Figure 1.1 (B). A multi-span, continuous configuration allows for longer span lengths than is possible with simple-span bridges and provides a cost effective alternative to steel girders and segmental construction in medium-span length applications.
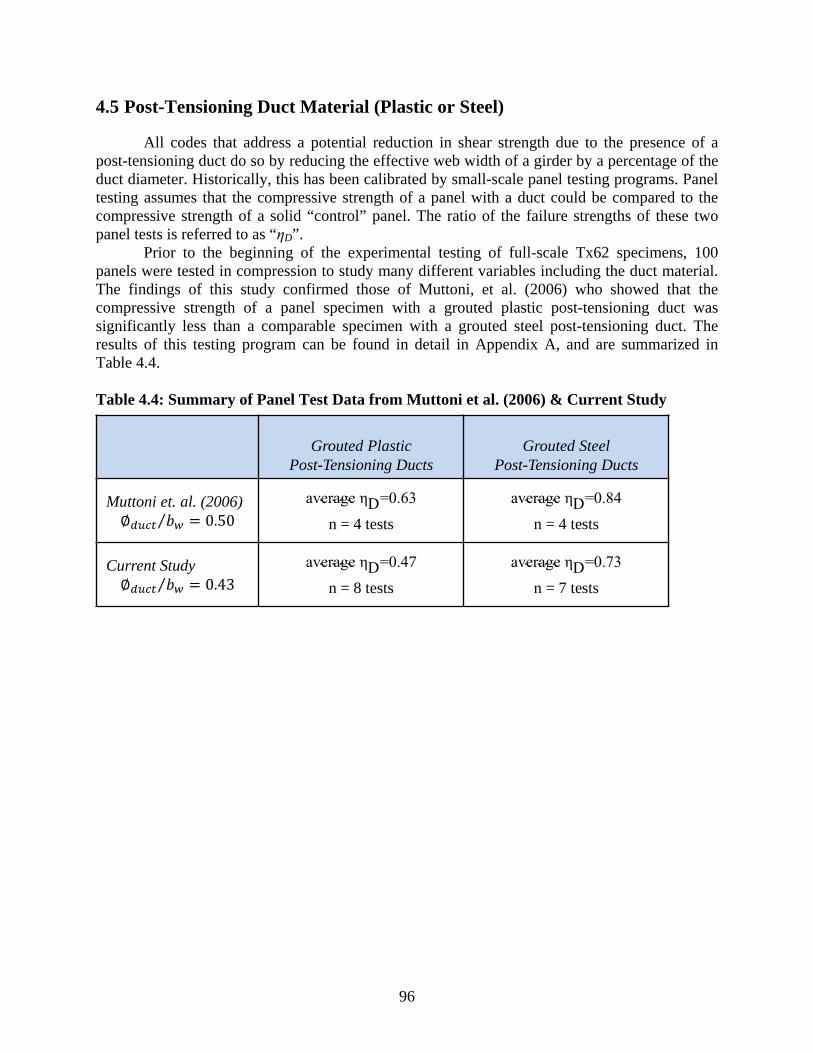
Figure 1.1: Simple and Multi-span Continuous Spliced Girder Construction
A Simple Spans
B Multi‐Span Continuous
I‐15 Highway InterchangeSalt Lake City, Utah
227’
320’
US‐27 over the Caloosahatchee RiverMoore Haven, Florida
WSDOTW95PTG
7’ 10 ½”
FLDOTFBT78
15’ max
2
1.1 Project Objective
The focus of the experimental program described in this report is the evaluation of the strength and serviceability of post-tensioned girders loaded in shear, and, more specifically, how a post-tensioning duct located in the web of a girder affects the shear transfer mechanism within a bulb-tee cross-section. A review of past literature on shear behavior revealed a limited number of test results from post-tensioned girders with ducts in their webs and a large number of test results from small-scale panels with post-tensioning ducts tested in uniform compression. These panel tests were intended to replicate behavior of the compressive stress field within a girder web and have been used to calibrate all shear design provisions in which the potential reduction in shear strength resulting from the presence of a post-tensioning duct is addressed.
Due to the limited number of tests in the literature conducted on full-scale post-tensioned girders, eleven shear tests were performed on seven prestressed concrete bulb-tee girders. Of these, ten tests were conducted on specimens that contained a post-tensioning duct within their web and additional pretensioning reinforcement in their bottom and top flanges. The remaining shear test was conducted on a control specimen that did not have a post-tensioning duct but contained the same pretensioning reinforcement as the post-tensioned girder specimens. The behavioral characteristics of these eleven test specimens at service level shear forces and at their ultimate were evaluated in regards to five primary experimental variables:
(i) Presence of a post-tensioning duct (ii) Post-tensioning duct material (plastic or steel) (iii) Web width (iv) Duct diameter (v) Transverse Reinforcement Ratio
The ten tests performed on post-tensioned specimens were added to the Evaluation Database for Post-Tensioned Girders. These ten test specimens make up 23 percent of the total evaluation database, which contains a total of 44 tests. Tests in this study represent the largest such tests performed on internally post-tensioned girders to-date. Moreover, four of these ten tests represent the only such tests performed on girders that contain grouted plastic post-tensioning ducts. Results from the analysis of the Evaluation Database for Post-Tensioned Girders, along with the eleven tests performed in the current study, collectively comprise a unique database of measurements that provides valuable insight into the shear behavior of post-tensioned girders and facilitates important new insights on the topic.
1.2 Organization
Shear strength calculation methods and research relevant to post-tensioned shear behavior are provided in Chapter 2. The collection and filtering of past research to generate the Evaluation Database for Post-Tensioned Girders is also discussed in Chapter 2. Chapter 3 provides an overview of the experimental study conducted to investigate the five primary variables of interest to this research program: (i) duct presence, (ii) duct material, (iii) web width, (iv) duct diameter, and (v) the transverse reinforcement ratio. In Chapter 4, the results of the experimental study are discussed in regard to the five primary experimental variables. Chapter 5 utilizes the tests conducted as a part of the current study along with those test results collected from the literature to provide recommendations for modifications to the current shear design specifications of the AASHTO LRFD Bridge Design Specifications (2013). Finally, all of the findings and conclusions of this research program are summarized in Chapter 6.
3
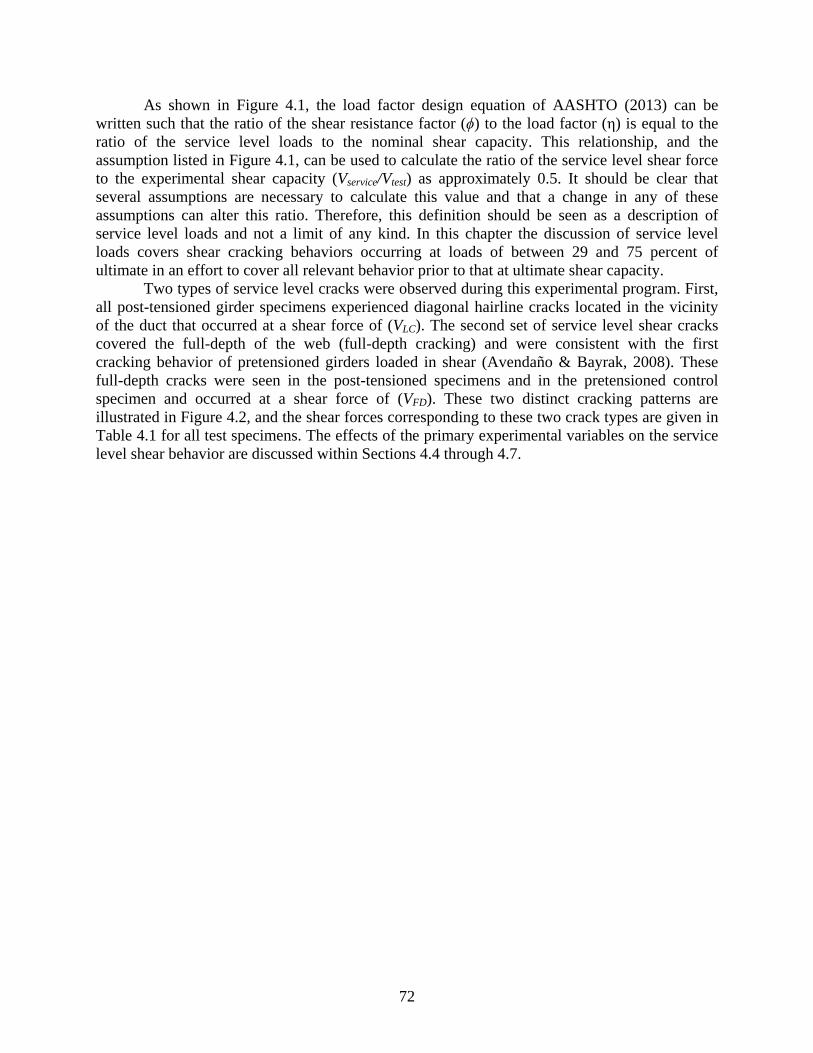
Chapter 2. Background and Literature Review
2.1 Introduction
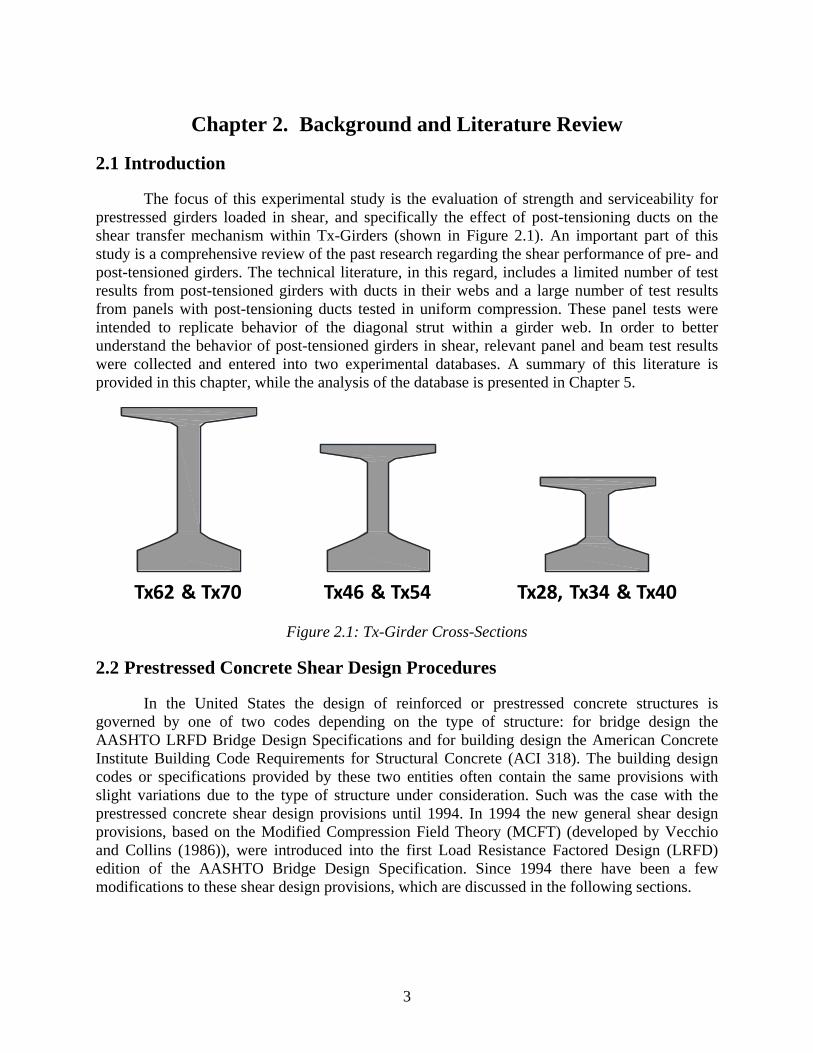
The focus of this experimental study is the evaluation of strength and serviceability for prestressed girders loaded in shear, and specifically the effect of post-tensioning ducts on the shear transfer mechanism within Tx-Girders (shown in Figure 2.1). An important part of this study is a comprehensive review of the past research regarding the shear performance of pre- and post-tensioned girders. The technical literature, in this regard, includes a limited number of test results from post-tensioned girders with ducts in their webs and a large number of test results from panels with post-tensioning ducts tested in uniform compression. These panel tests were intended to replicate behavior of the diagonal strut within a girder web. In order to better understand the behavior of post-tensioned girders in shear, relevant panel and beam test results were collected and entered into two experimental databases. A summary of this literature is provided in this chapter, while the analysis of the database is presented in Chapter 5.
Figure 2.1: Tx-Girder Cross-Sections
2.2 Prestressed Concrete Shear Design Procedures
In the United States the design of reinforced or prestressed concrete structures is governed by one of two codes depending on the type of structure: for bridge design the AASHTO LRFD Bridge Design Specifications and for building design the American Concrete Institute Building Code Requirements for Structural Concrete (ACI 318). The building design codes or specifications provided by these two entities often contain the same provisions with slight variations due to the type of structure under consideration. Such was the case with the prestressed concrete shear design provisions until 1994. In 1994 the new general shear design provisions, based on the Modified Compression Field Theory (MCFT) (developed by Vecchio and Collins (1986)), were introduced into the first Load Resistance Factored Design (LRFD) edition of the AASHTO Bridge Design Specification. Since 1994 there have been a few modifications to these shear design provisions, which are discussed in the following sections.
Tx62 & Tx70 Tx46 & Tx54 Tx28, Tx34 & Tx40
4
2.2.1 AASHTO General Procedure
The shear strength calculations discussed within this section follow the general shear provisions found in the AASHTO LRFD Bridge Design Specification 6th Edition with the applicable 2013 interim revisions (hereafter referred to as AASHTO (2013)). AASHTO (2013) contains three sectional shear calculation methodologies relevant to prestressed concrete, but only the General Procedure of §5.8.3.4.2 and the Segmental Procedure of §5.8.6.5 are discussed within this report.
The equations that make up the AASHTO (2013) general procedure for shear design (hereafter AASHTO General) were developed out of the relationships and equations proposed in the Modified Compression Field Theory (MCFT) first introduced by Vecchio and Collins (1986). This shear design methodology relies on the MCFT to provide an accurate model of the post shear-cracking behavior of concrete. Many assumptions have been made when incorporating MCFT into a simplified design procedure (Hawkins, et al., 2005). They are:
Plane sections remain plane. Strain is assumed to be linearly distributed over the depth of the member. Therefore it is
assumed the strain can be computed at the section’s mid-depth as one-half of the strain at the centroid of the tensile zone.
The direction of the compressive stress resultant (the compressive stress field of the web region) is constant over the depth of the member.
The average crack spacing is taken as 12-inches for members containing minimum transverse reinforcement. Otherwise the crack spacing is calculated and is directly related to the depth of the member (which incorporates a size effect for members not containing the minimum amount of transverse steel).
The stirrups yield prior to the concrete crushing. This is a common assumption in most design equations, which in this case is ensured by a limit on the maximum shear stress of a section (discussed in the last paragraph of this section.) The AASHTO General procedure calculates the nominal shear strength of a member by
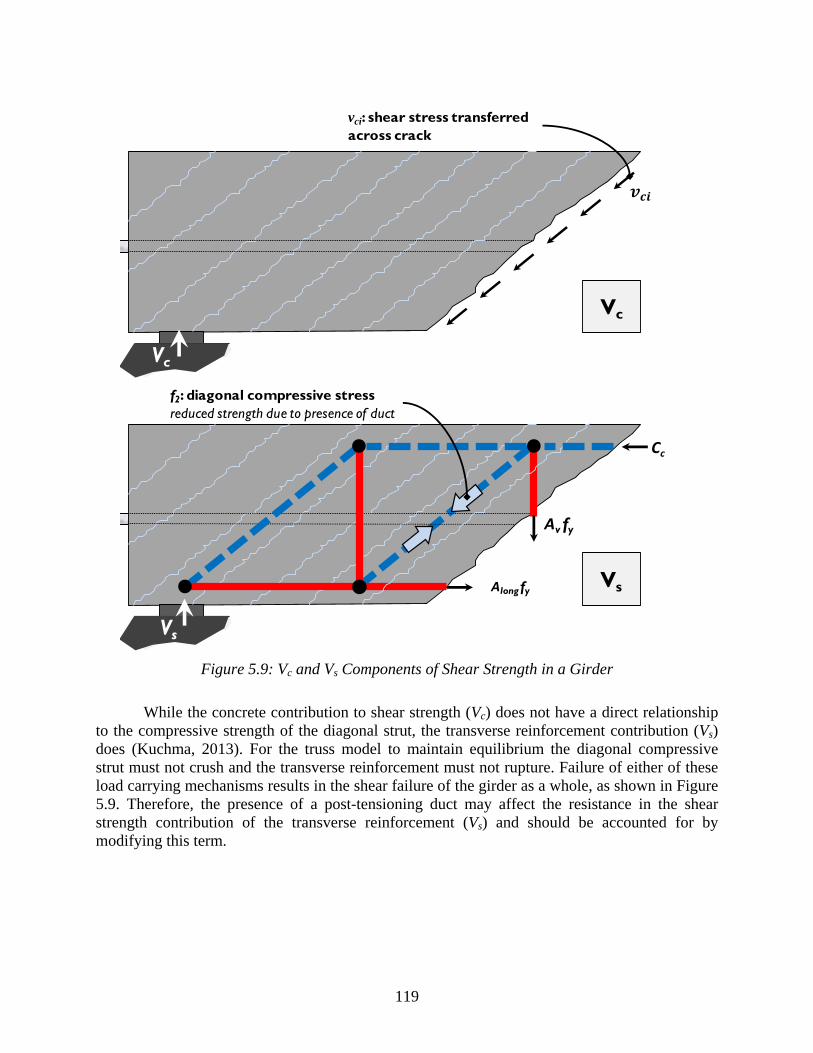
separate estimates for the “concrete” contribution and “steel” contribution to the nominal shear strength (Vc and Vs respectively). Within the framework of the MCFT, the Vc contribution to shear strength is an estimation of the “residual tensile stresses” in the cracked concrete (Vecchio & Collins, 1986), while the Vs contribution is an estimation of the ability of the transverse reinforcement (stirrups) to transmit load through the truss model originally developed by Ritter (1899). The derivation of these two contributions to the calculated shear strength is shown in Figure 2.2 and Equation 2.1 (Bentz, et al., 2006).
fz Clamping stress in vertical direction taken to be negligible in beam behavior. ( 0
ρz Transverse reinforcement ratio of girder. ( / ∗ )
v Average shear stress acting on the girder.
θ Angle of the principle diagonal compressive stress with respect to the longitudinal axis of the member.
fszcr Localized stress in transverse reinforcement at crack. Taken equal to the yield stress of transverse reinforcement. ( )
vci The shear stress along the crack (i.e., parallel to the principal diagonal compressive stress)
When Equation 2.1 is multiplied by the effective shear depth (dv) and effective web width (bv) it takes the more recognizable form shown in Equation 2.2 of the nominal shear strength of a member comprised of a concrete (Vc) and a transverse reinforcement (Vs) contribution to shear strength. The shear stress transmitted across a crack (vci) is estimated by the product of β and the
0
cossin
tan
↑ 0
V
6
square root of the concrete strength. The function β relates the concrete resistance to slip across a crack to the internal strain profile of the cross-section.
cot Equation 2.2
Equation 2.3
When these design equations were first introduced the procedure for calculating the ultimate shear capacity of concrete sections was defined through an iterative procedure and not easily performed using hand calculations. Unfortunately, in the first edition these provisions were difficult to use due to the θ and β variables which needed to be read out of graphs published in the specifications (AASHTO, 1994). This issue was partially solved when the tables listing values for θ and β were adopted into the specifications in subsequent interim revisions. These revisions allowed for computer programming to be more readily developed which could interpolate between values of β using the strain at mid-depth and the value of θ, but still required an iterative calculation method.
The final simplification was introduced in the AASHTO LFRD 2008 Interim Specifications. In this edition, linear equations were given to calculate β, εs, and θ. These equations eliminated the need for interpolation between the values of β and θ, perhaps more importantly, eliminated the need for iterations to find the angle of the diagonal compressive field (θ) which could now be calculated directly. The equations for the three variables are shown in Equation 2.4 through Equation 2.8.
For sections containing at least the minimum amount of shear reinforcement.
4.81 750
Equation 2.4
For sections containing less than the minimum amount of shear reinforcement.
4.81 750
5139
Equation 2.5
where:
12 . 1.380.63
80 . Equation 2.6
for all cases:
29 3500
Equation 2.7
7
where:
| |0.5
Equation 2.8
where:
εs = Estimated strain at mid-height of cross-section (in/in)
sxe = Equivalent value of se which accounts for the influence of aggregate size (in.)
sx = The lesser of either dv or the maximum distance between layers of longitudinal crack control reinforcement, where the area of the reinforcement in each layer is not less than 0.003bvsx (in.)
θ = Angle of inclination of the compressive stresses (degrees)
Aps = Area of prestressing steel on the tension side of member (in2)
As = Area of mild steel on the flexural tension side of member (in2)
ag = Maximum aggregate size in the web concrete (in.)
fpo = ∆ ∗ (psi)
Δεp = Strain differential between prestressing strand and concrete (in./in.)
Ep = Modulus of elasticity of prestressing strand (psi)
Nu = Factored axial force in member (taken as positive if tensile) (lbs.)
Vu = Factored shear force in member (lbs.)
Mu = Factored moment in member, but not to be taken as less than (lb.-in.)
Vp = Vertical component of the prestressing force resisting shear (lbs.)
The general equation for the shear strength of concrete members as provided in
AASHTO General is found in Equation 2.9. The concrete and steel contribution components in this equation are further detailed in Equation 2.10 and Equation 2.11 with the three variables calculated by Equation 2.4 through Equation 2.8. The contribution of harped or draped prestressing strands to the shear strength (Vp) is taken as the vertical component of the prestressing force in the shear span at the critical section. Note that all code equations have been converted to psi units for easier cross-comparison to the ACI 318 shear strength equations.
The nominal shear capacity of a concrete member shall be taken as:
0.25 Equation 2.9
See note in the following paragraphs on the “0.25f’c shear stress limit”
8
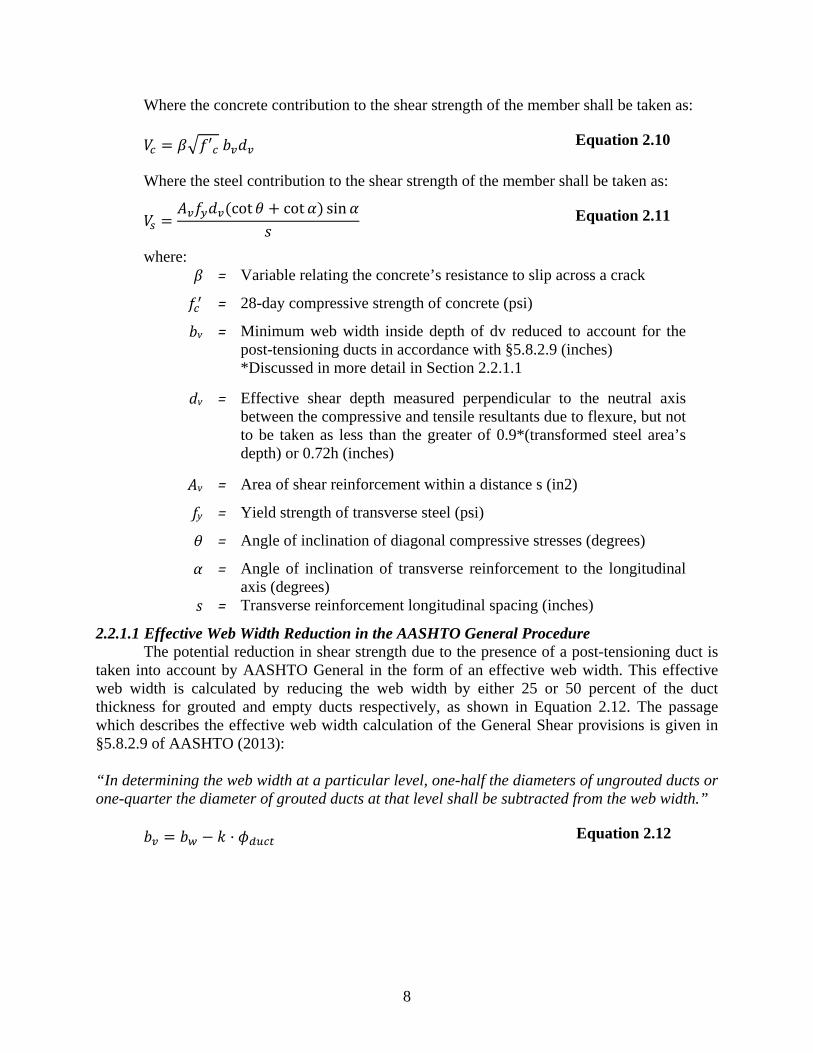
Where the concrete contribution to the shear strength of the member shall be taken as:
′ Equation 2.10
Where the steel contribution to the shear strength of the member shall be taken as:
cot cot sin Equation 2.11
where: β = Variable relating the concrete’s resistance to slip across a crack
= 28-day compressive strength of concrete (psi)
bv = Minimum web width inside depth of dv reduced to account for the post-tensioning ducts in accordance with §5.8.2.9 (inches) *Discussed in more detail in Section 2.2.1.1
dv = Effective shear depth measured perpendicular to the neutral axis between the compressive and tensile resultants due to flexure, but not to be taken as less than the greater of 0.9*(transformed steel area’s depth) or 0.72h (inches)
Av = Area of shear reinforcement within a distance s (in2)
fy = Yield strength of transverse steel (psi)
θ = Angle of inclination of diagonal compressive stresses (degrees)
α = Angle of inclination of transverse reinforcement to the longitudinal axis (degrees)
s = Transverse reinforcement longitudinal spacing (inches)
2.2.1.1 Effective Web Width Reduction in the AASHTO General Procedure The potential reduction in shear strength due to the presence of a post-tensioning duct is
taken into account by AASHTO General in the form of an effective web width. This effective web width is calculated by reducing the web width by either 25 or 50 percent of the duct thickness for grouted and empty ducts respectively, as shown in Equation 2.12. The passage which describes the effective web width calculation of the General Shear provisions is given in §5.8.2.9 of AASHTO (2013):
“In determining the web width at a particular level, one-half the diameters of ungrouted ducts or one-quarter the diameter of grouted ducts at that level shall be subtracted from the web width.”
Equation 2.12
9
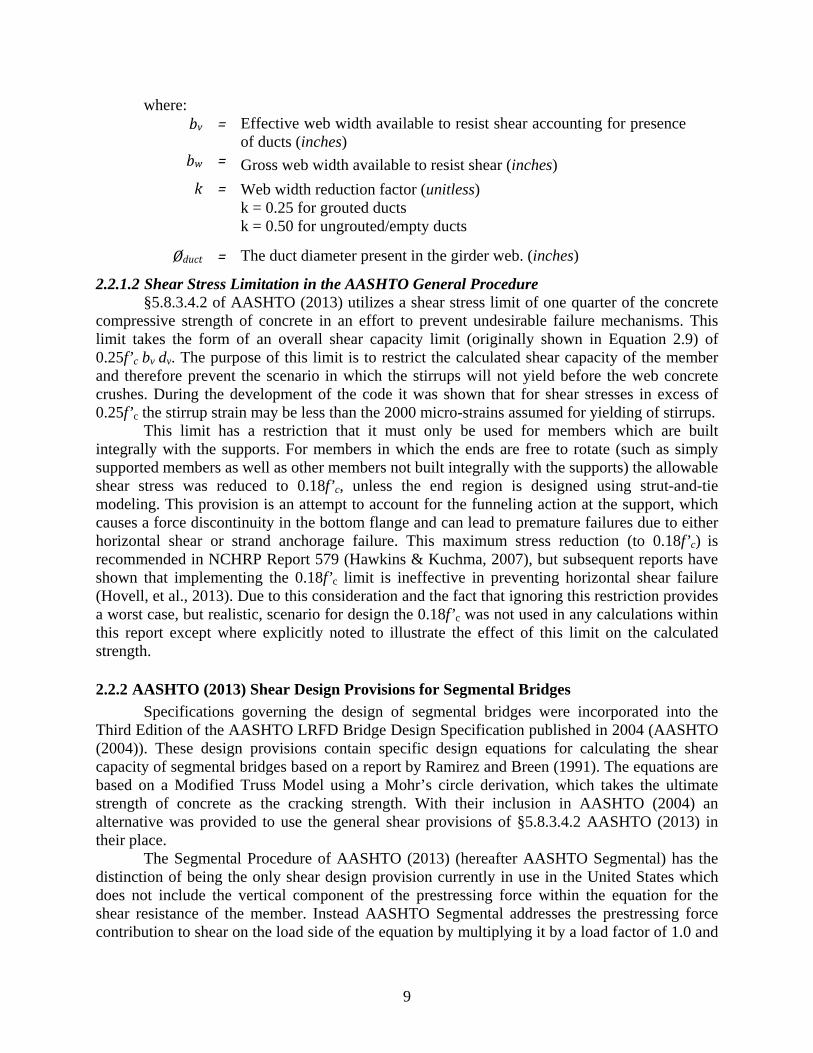
where: bv = Effective web width available to resist shear accounting for presence
of ducts (inches) bw = Gross web width available to resist shear (inches)
k = Web width reduction factor (unitless) k = 0.25 for grouted ducts k = 0.50 for ungrouted/empty ducts
Øduct = The duct diameter present in the girder web. (inches)
2.2.1.2 Shear Stress Limitation in the AASHTO General Procedure §5.8.3.4.2 of AASHTO (2013) utilizes a shear stress limit of one quarter of the concrete
compressive strength of concrete in an effort to prevent undesirable failure mechanisms. This limit takes the form of an overall shear capacity limit (originally shown in Equation 2.9) of 0.25f’c bv dv. The purpose of this limit is to restrict the calculated shear capacity of the member and therefore prevent the scenario in which the stirrups will not yield before the web concrete crushes. During the development of the code it was shown that for shear stresses in excess of 0.25f’c the stirrup strain may be less than the 2000 micro-strains assumed for yielding of stirrups.
This limit has a restriction that it must only be used for members which are built integrally with the supports. For members in which the ends are free to rotate (such as simply supported members as well as other members not built integrally with the supports) the allowable shear stress was reduced to 0.18f’c, unless the end region is designed using strut-and-tie modeling. This provision is an attempt to account for the funneling action at the support, which causes a force discontinuity in the bottom flange and can lead to premature failures due to either horizontal shear or strand anchorage failure. This maximum stress reduction (to 0.18f’c) is recommended in NCHRP Report 579 (Hawkins & Kuchma, 2007), but subsequent reports have shown that implementing the 0.18f’c limit is ineffective in preventing horizontal shear failure (Hovell, et al., 2013). Due to this consideration and the fact that ignoring this restriction provides a worst case, but realistic, scenario for design the 0.18f’c was not used in any calculations within this report except where explicitly noted to illustrate the effect of this limit on the calculated strength.
2.2.2 AASHTO (2013) Shear Design Provisions for Segmental Bridges
Specifications governing the design of segmental bridges were incorporated into the Third Edition of the AASHTO LRFD Bridge Design Specification published in 2004 (AASHTO (2004)). These design provisions contain specific design equations for calculating the shear capacity of segmental bridges based on a report by Ramirez and Breen (1991). The equations are based on a Modified Truss Model using a Mohr’s circle derivation, which takes the ultimate strength of concrete as the cracking strength. With their inclusion in AASHTO (2004) an alternative was provided to use the general shear provisions of §5.8.3.4.2 AASHTO (2013) in their place.
The Segmental Procedure of AASHTO (2013) (hereafter AASHTO Segmental) has the distinction of being the only shear design provision currently in use in the United States which does not include the vertical component of the prestressing force within the equation for the shear resistance of the member. Instead AASHTO Segmental addresses the prestressing force contribution to shear on the load side of the equation by multiplying it by a load factor of 1.0 and
10
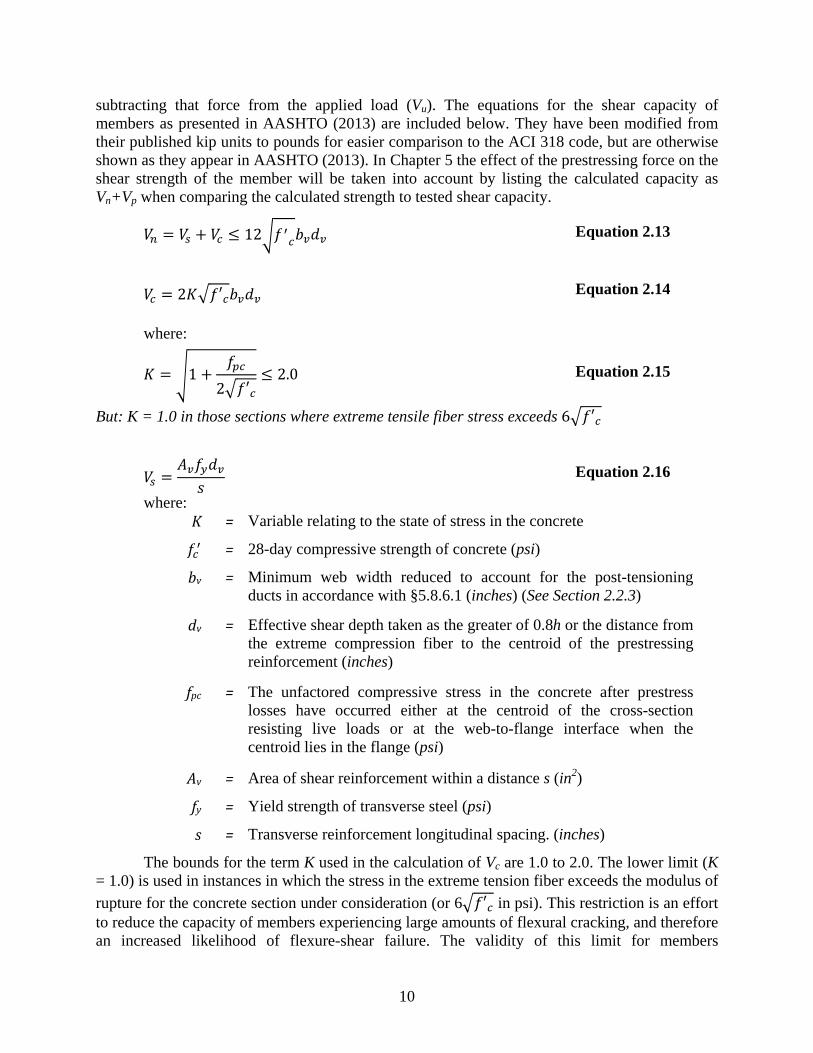
subtracting that force from the applied load (Vu). The equations for the shear capacity of members as presented in AASHTO (2013) are included below. They have been modified from their published kip units to pounds for easier comparison to the ACI 318 code, but are otherwise shown as they appear in AASHTO (2013). In Chapter 5 the effect of the prestressing force on the shear strength of the member will be taken into account by listing the calculated capacity as Vn+Vp when comparing the calculated strength to tested shear capacity.
12 Equation 2.13
2 ′ Equation 2.14
where:
12 ′
2.0 Equation 2.15
But: K = 1.0 in those sections where extreme tensile fiber stress exceeds 6 ′
Equation 2.16
where: K = Variable relating to the state of stress in the concrete
= 28-day compressive strength of concrete (psi)
bv = Minimum web width reduced to account for the post-tensioning ducts in accordance with §5.8.6.1 (inches) (See Section 2.2.3)
dv = Effective shear depth taken as the greater of 0.8h or the distance from the extreme compression fiber to the centroid of the prestressing reinforcement (inches)
fpc = The unfactored compressive stress in the concrete after prestress losses have occurred either at the centroid of the cross-section resisting live loads or at the web-to-flange interface when the centroid lies in the flange (psi)
Av = Area of shear reinforcement within a distance s (in2)
fy = Yield strength of transverse steel (psi)
s = Transverse reinforcement longitudinal spacing. (inches)
The bounds for the term K used in the calculation of Vc are 1.0 to 2.0. The lower limit (K = 1.0) is used in instances in which the stress in the extreme tension fiber exceeds the modulus of
rupture for the concrete section under consideration (or 6 ′ in psi). This restriction is an effort to reduce the capacity of members experiencing large amounts of flexural cracking, and therefore an increased likelihood of flexure-shear failure. The validity of this limit for members
11
experiencing large tensile stresses was examined in Avendaño and Bayrak (2008) and found to cause an unnecessary increase in conservativeness. In spite of this recommendation the restrictions on K remain in the current code provisions.
Although the specifications call for these shear equations to be used only in post-tensioned concrete box girder bridges the original equations were designed to be used for both prestressed and reinforced concrete members (Ramirez & Breen, 1991). In addition, these design provisions were calibrated to be used with a variable angle truss model to estimate the transverse steel’s contribution to shear strength. For this model the variable angle in prestressed concrete members ranged from 25 to 65-degrees (with a range of 30 to 65-degrees for reinforced concrete members). The exclusion of this design methodology, in addition to the limits on the K factor discussed previously, in favor of the simplified 45-degree truss model render these design equations as overly-conservative.
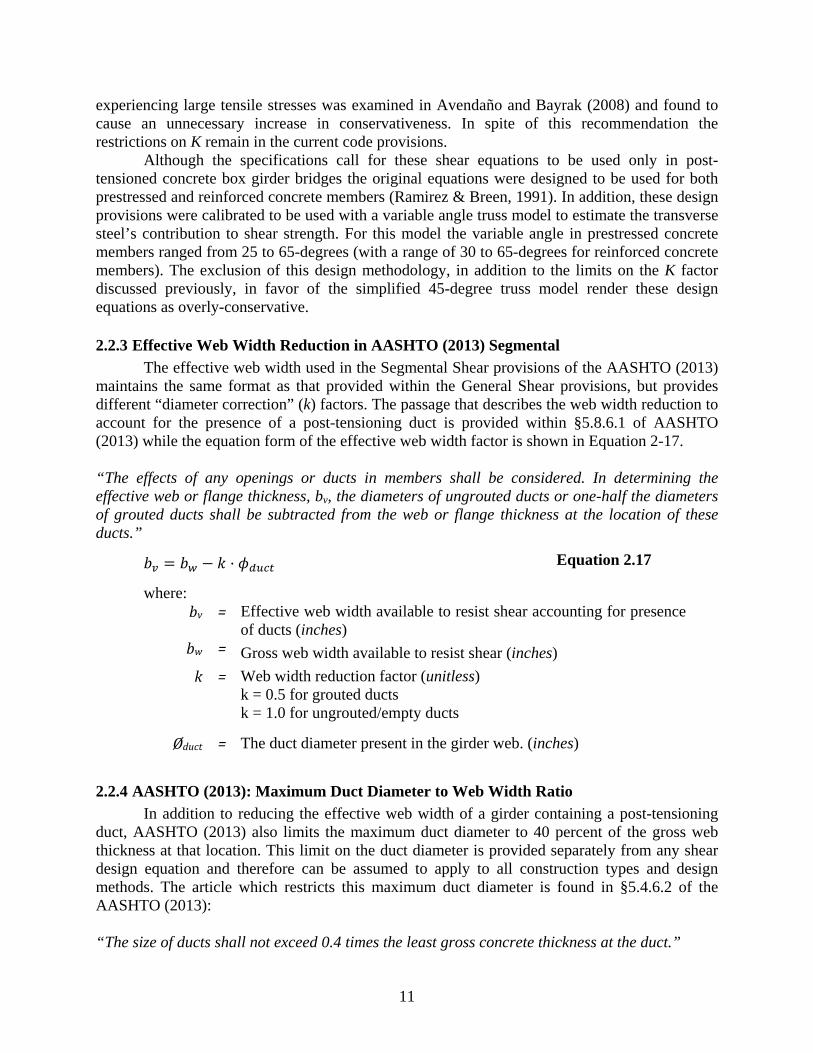
2.2.3 Effective Web Width Reduction in AASHTO (2013) Segmental
The effective web width used in the Segmental Shear provisions of the AASHTO (2013) maintains the same format as that provided within the General Shear provisions, but provides different “diameter correction” (k) factors. The passage that describes the web width reduction to account for the presence of a post-tensioning duct is provided within §5.8.6.1 of AASHTO (2013) while the equation form of the effective web width factor is shown in Equation 2-17.
“The effects of any openings or ducts in members shall be considered. In determining the effective web or flange thickness, bv, the diameters of ungrouted ducts or one-half the diameters of grouted ducts shall be subtracted from the web or flange thickness at the location of these ducts.”
Equation 2.17
where: bv = Effective web width available to resist shear accounting for presence
of ducts (inches) bw = Gross web width available to resist shear (inches)
k = Web width reduction factor (unitless) k = 0.5 for grouted ducts k = 1.0 for ungrouted/empty ducts
Øduct = The duct diameter present in the girder web. (inches)
2.2.4 AASHTO (2013): Maximum Duct Diameter to Web Width Ratio
In addition to reducing the effective web width of a girder containing a post-tensioning duct, AASHTO (2013) also limits the maximum duct diameter to 40 percent of the gross web thickness at that location. This limit on the duct diameter is provided separately from any shear design equation and therefore can be assumed to apply to all construction types and design methods. The article which restricts this maximum duct diameter is found in §5.4.6.2 of the AASHTO (2013):
“The size of ducts shall not exceed 0.4 times the least gross concrete thickness at the duct.”
12
2.2.5 ACI 318-11 Simplified Method for Concrete Contribution to Shear Strength
The current ACI 318-11 simplified equation (hereafter ACI Simple) for calculating the concrete contribution to the shear resistance of a prestressed concrete member is based on the design code proposed by MacGregor and Hanson (1969) and is given in Equation 2.18.
0.6 700 Equation 2.18
But not less than 2 nor greater than 5 .
This method allows a designer to have a simple, conservative estimate of the shear strength (Avendaño & Bayrak, 2008). It uses an empirical equation to describe concrete contribution and a 45-degree truss model originally developed by Ritter and Mörsch at the turn of the nineteenth century for the steel contribution (Collins & Mitchell, 1997). In spite of the conservativeness of this equation, it frequently draws criticism for the large experimental scatter that can be tied to its empirical basis, and its limitation for use in members with an effective prestressing force greater than 40 percent of the flexural reinforcement.
2.2.6 ACI 318-11 Detailed Method for Concrete Contribution
The traditional approach to shear design of prestressed concrete members, typically referred to as the detailed ACI design provisions for shear design (hereafter ACI detailed), was developed as a prediction of concrete strength considering two different mechanisms that initiate shear cracking. This method has its basis in the mechanics of an uncracked section, but these theories lack the ability to describe the post-cracking behavior of concrete and therefore draw criticism. Despite this lack of explanation on the post-cracking behavior, the equation Vcw has been shown to have great consistency in predicting the shear cracking load for a member, thus allowing the designer to consider serviceability along with ultimate strength. The equation for Vcw as found in §11.3.3.1 of ACI318-11 is shown below:
3.5 0.3 Equation 2.19
Despite the fact that these equations do not have any mechanistic basis for concrete after first cracking they have been shown to provide sufficient accuracy and relatively low scatter for ultimate strength calculations when evaluated using the UTPSDB (Nakamura, et al., 2013). In order to find the maximum concrete contribution to the ultimate shear capacity of the member, the lesser of Vcw and Vci is taken as the concrete shear capacity and used in conjunction with Vs. The equation for calculating Vci, which is aimed at estimating the load required to turn a flexure crack into a shear crack, is given in Equation 2.20 and Equation 2.21.
0.6 Equation 2.20
/ 6 Equation 2.21
13
where: fpc = The unfactored compressive stress in the concrete after prestress
losses have occurred either at the centroid of the cross-section resisting live loads for at the web-to-flange interface when the centroid lies in the flange (psi)
fpe = Compressive stress in concrete due to effective prestress forces only (after losses) at extreme fiber of section where tensile stress is caused by externally applied loads (psi)
yt = Distance from centroidal axis of gross section, neglecting reinforcement, to tension face (in.)
fd = Stress due to unfactored dead load, at extreme fiber of section where tensile stress is caused by externally applied loads (psi)
2.2.7 ACI 318-11 Steel Contribution to Shear Strength
The ACI 318-11 equation for the transverse steel (stirrup) contribution to shear strength is based on a 45-degree truss analogy. Therefore the principle diagonal shear crack is assumed to cross the stirrups from the bottom of the beam to the top at a 45-degree angle. This equation is shown below:
Equation 2.22
The transverse reinforcement contribution to shear strength (Vs) is limited to 8 in an effort to prevent diagonal compression failure in the web. This type of failure would reduce the steel contribution to the overall shear strength of the member by preventing it from yielding and reaching the design stress of fyt.
2.3 Web Width Reduction Factors
Due to the high cost associated with the testing of full-scale post-tensioned girders, the shear behavior of the post-tensioned girders has been frequently investigated using small-scale panel testing. Results from these panel tests have been used to calibrate the web width reduction factors currently in use in the AASHTO (2013). Within this section, the panel testing research programs will be discussed and used to introduce the web width reduction factors.
2.3.1 Code Approach to Web Width Reduction
The shear strength reduction in thin-webbed members is similarly addressed in the major structural design codes. The reduction in strength generally takes the form of an effective web width that idealizes the behavior as a loss of web cross-section at the location of the duct. This effective web width reduction has been calibrated through the use of panel tests, which have demonstrated the following three primary variables: the duct diameter-to-web width ratio, whether the tendon is grouted, and (in some codes) the duct material. Although the precise terminology within each code may vary, the effective web width concept can be summarized by Equation 2.23 through Equation 2.25.
14
∙ Equation 2.23
1 ∙ ∅ / Equation 2.24
or more simply:
∅ Equation 2.25
where: bv = The effective web width available to resist shear accounting for
presence of post-tensioning ducts (inches)
bw = The gross web width available to resist shear (inches)
ηD = The web width reduction factor (unitless)
k = The diameter correction factor (unitless)
∅ = Post-tensioning duct diameter (inches)
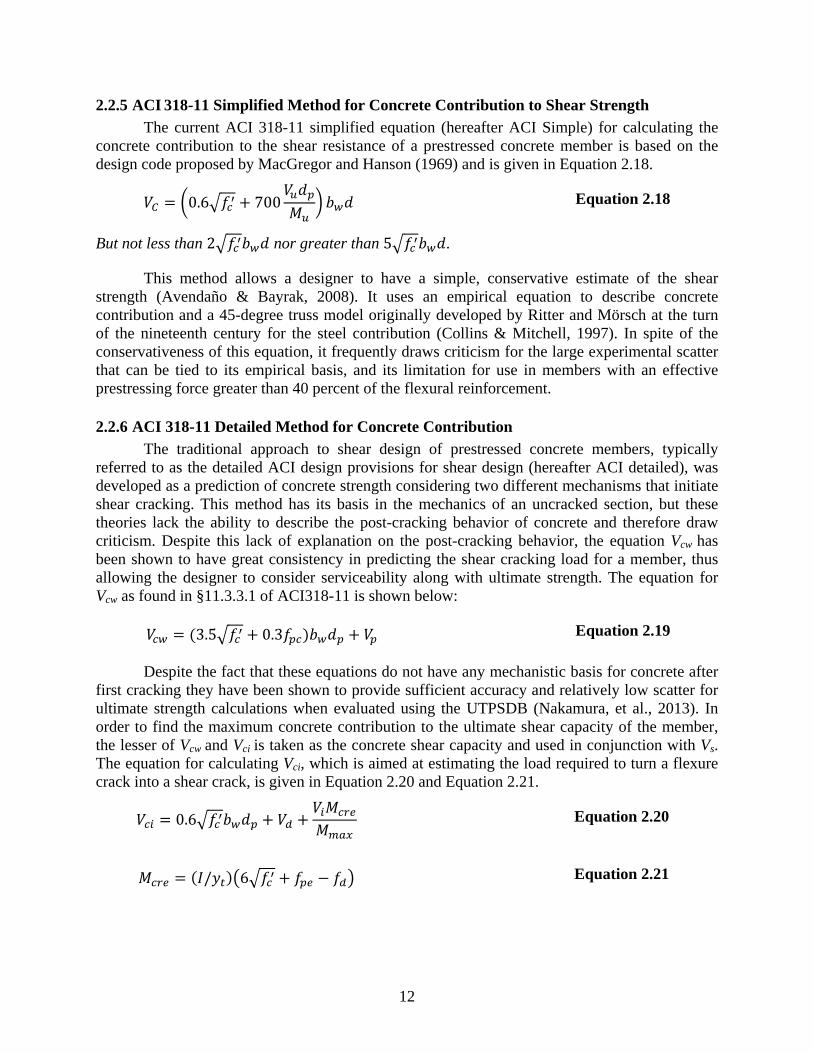
The diameter correction factor, k, is dependent on the code being considered and has been calibrated using past panel test data. These k-values were calibrated by testing panels with post-tensioning ducts and comparing the failure strength to a control specimen without a duct (Figure 2.3).
Figure 2.3: Description of Calibration Calculations
The percentage of the duct diameter to be removed from the actual web width is given by the k-factor. Depending on the structural design code, the k-factor can be defined as a function of the duct type and whether the duct is grouted or ungrouted. The k-factors for the four codes considered in this report are shown in Table 2.1.
Table 2.1: Diameter Correction Factors (k) for Codes Considered
OR ÷ηD = Control
Code ProvisionCode
ReferenceEmptySteel
GroutedSteel
EmptyPlastic
Grouted Plastic
ACI 318-11 not addressed
AASHTO General Shear §5.8.2.9 0.25 0.5 0.25 0.5
AASHTO Segmental Shear §5.8.6.1 1.0 0.5 1.0 0.5
EuroCode2 2004* §6.2.3-5 1.2 0.5 1.2 1.2
*EuroCode2 does not reduce effective web widths at Duct Diameter to Thickness values <0.125
15
In addition to the effective web width reduction factors shown above, §5.4.6.2 of AASHTO (2013) limits the maximum duct diameter to less than or equal to 40 percent of the gross web thickness. In practice this limit is ignored by many state departments of transportation as was found by an industry survey conducted as part of this experimental study and reported by Williams, et al. (2013). Therefore this limit is ignored within this document with the exception of those cases in which it is discussed directly.
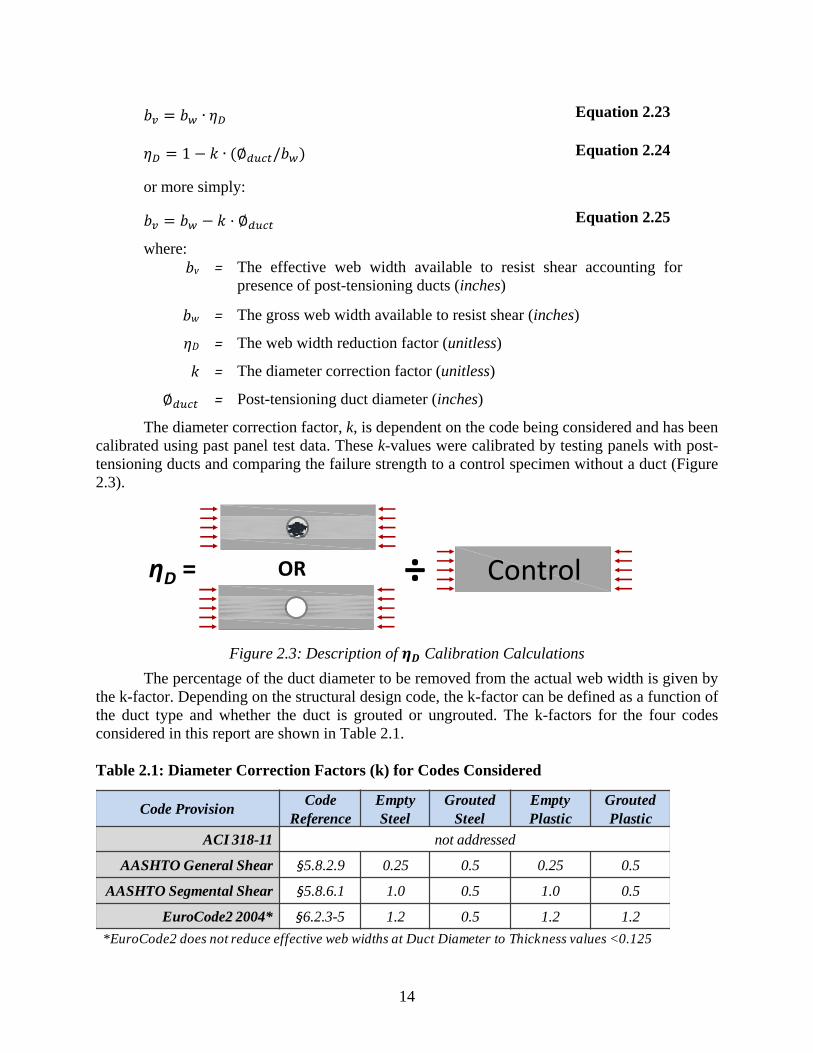
2.3.2 Panel Test Research
Historically, research into the effect of post-tensioning ducts on shear strength has been addressed by small-scale panel tests. These panel tests are meant to be representative of the inclined compressive strut formed during shear loading. As shown in Figure 2.4, the compressive stresses flow around or through the post-tensioning duct the deviation of the deviation of the compressive stress flow results in the development of tensile stresses near the duct. These tensile stresses may cause a reduction in shear strength compared to a cross-section without a post-tensioning duct within the web of a girder. Panel testing assumes that the compressive strength of a panel with duct could be compared to the compressive strength of a solid (“control”) panel. This relative reduction in strength is what has formed the basis of the strength reduction factors (“web width reduction factors” discussed in Section 2.3.1) found in all current code provisions.
Although panel testing allows for a large number of tests, due to its economic scale, it neglects many factors which influence shear behaviors in post-tensioned concrete beams; most notably the effects of transverse tension and horizontal shearing stresses on the web of a girder that contains a post-tensioning duct. Because of these concerns, and inconsistencies between panel and beam behavior, only full-scale beam shear testing can confirm the accuracy of the current code web width reduction factors.
Muttoni, Burdet, and Hars (2006) published the results from a study which is one of the first panel testing programs that included panels with plastic (high density polyethylene) ducts. The results of this study showed that the use of grouted plastic ducts resulted in as much as a 40
Stiff Grout
Inset Diagrams
Flexible Void
Transverse Tensile
Stresses
Deviation of Compressive
Stresses
16
percent reduction in strength compared to similar panels containing grouted steel ducts. Since this study was conducted at École Polytechnique Fédérale de Lausanne in Switzerland it had the most direct impact on the local building code, Eurocode2. The changes made to Eurocode2 are more thoroughly illustrated in the following section in which comparisons to other codes of practice are made. The main difference between codes was a drastic increase in the conservativeness of the code equations for grouted plastic post-tensioning ducts and for empty ducts (ungrouted). This result may not be justified as the small-scale panel tests were never verified with full-scale post-tensioned beam tests on girders with plastic post-tensioning ducts. The effect of duct material type on the shear strength of full-scale girders will be addressed within Chapter 4.
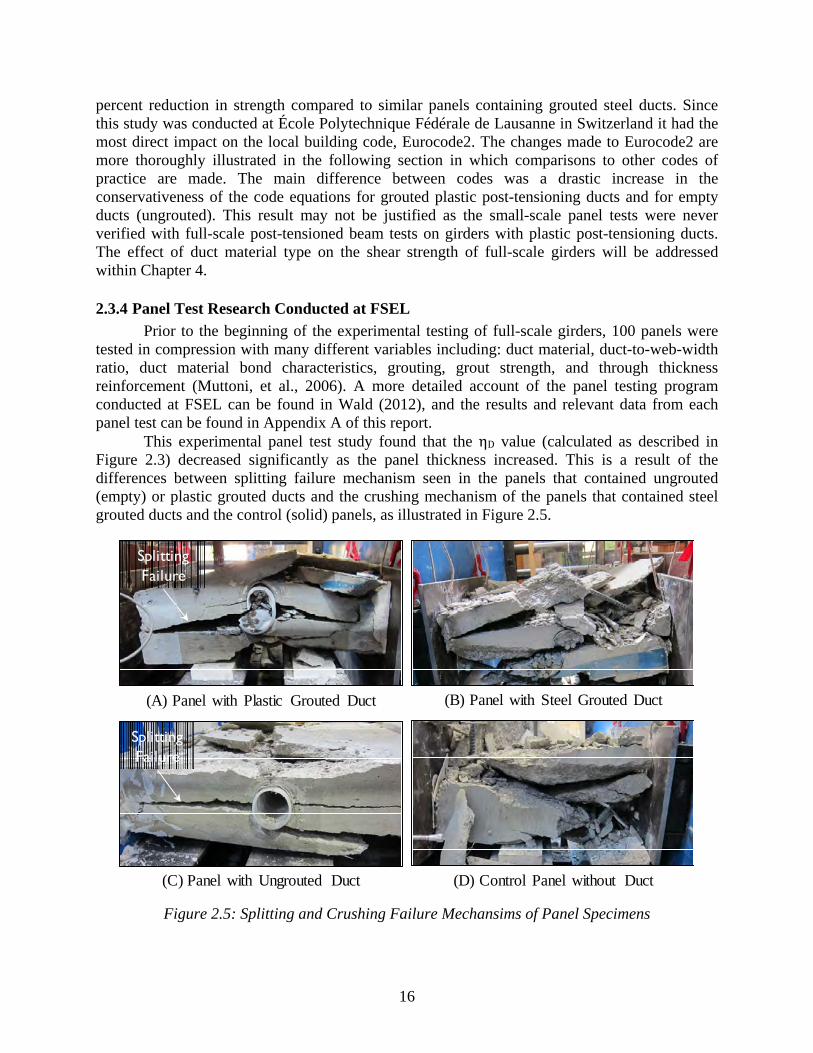
2.3.4 Panel Test Research Conducted at FSEL
Prior to the beginning of the experimental testing of full-scale girders, 100 panels were tested in compression with many different variables including: duct material, duct-to-web-width ratio, duct material bond characteristics, grouting, grout strength, and through thickness reinforcement (Muttoni, et al., 2006). A more detailed account of the panel testing program conducted at FSEL can be found in Wald (2012), and the results and relevant data from each panel test can be found in Appendix A of this report.
This experimental panel test study found that the ηD value (calculated as described in Figure 2.3) decreased significantly as the panel thickness increased. This is a result of the differences between splitting failure mechanism seen in the panels that contained ungrouted (empty) or plastic grouted ducts and the crushing mechanism of the panels that contained steel grouted ducts and the control (solid) panels, as illustrated in Figure 2.5.
Figure 2.5: Splitting and Crushing Failure Mechansims of Panel Specimens
SplittingFailure
SplittingFailure
(A) Panel with Plastic Grouted Duct (B) Panel with Steel Grouted Duct
(C) Panel with Ungrouted Duct (D) Control Panel without Duct
17
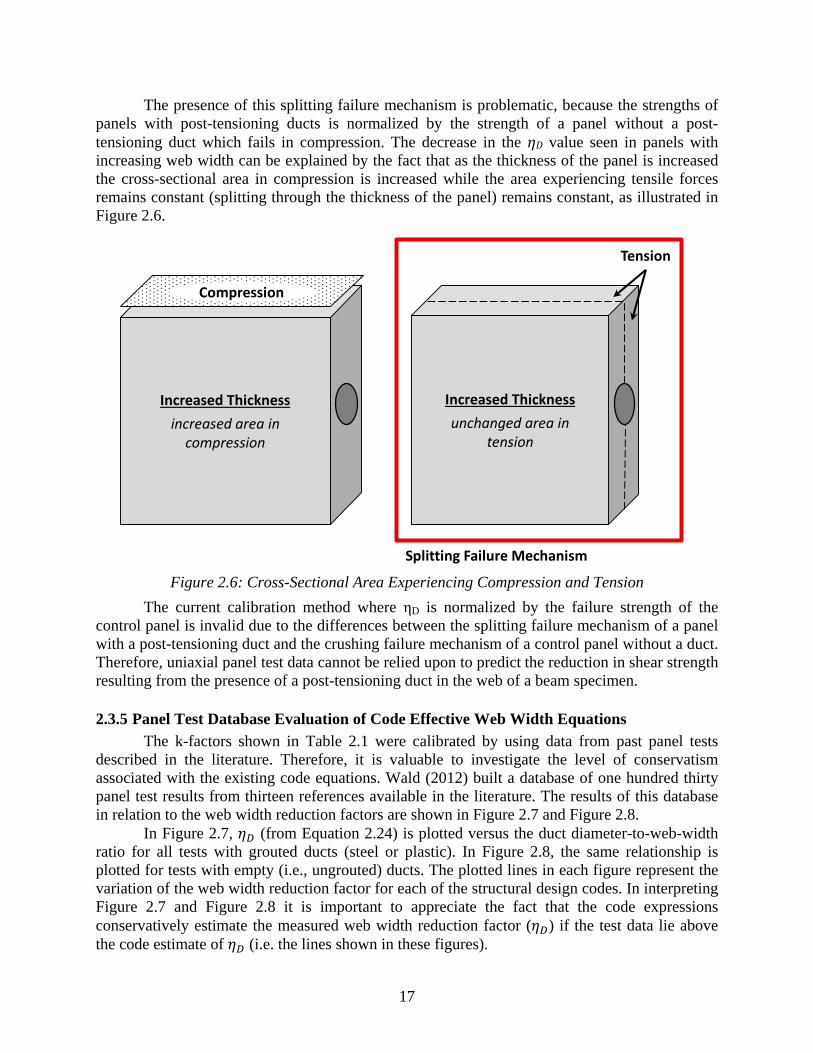
The presence of this splitting failure mechanism is problematic, because the strengths of panels with post-tensioning ducts is normalized by the strength of a panel without a post-tensioning duct which fails in compression. The decrease in the ηD value seen in panels with increasing web width can be explained by the fact that as the thickness of the panel is increased the cross-sectional area in compression is increased while the area experiencing tensile forces remains constant (splitting through the thickness of the panel) remains constant, as illustrated in Figure 2.6.
Figure 2.6: Cross-Sectional Area Experiencing Compression and Tension
The current calibration method where ηD is normalized by the failure strength of the control panel is invalid due to the differences between the splitting failure mechanism of a panel with a post-tensioning duct and the crushing failure mechanism of a control panel without a duct. Therefore, uniaxial panel test data cannot be relied upon to predict the reduction in shear strength resulting from the presence of a post-tensioning duct in the web of a beam specimen.
2.3.5 Panel Test Database Evaluation of Code Effective Web Width Equations
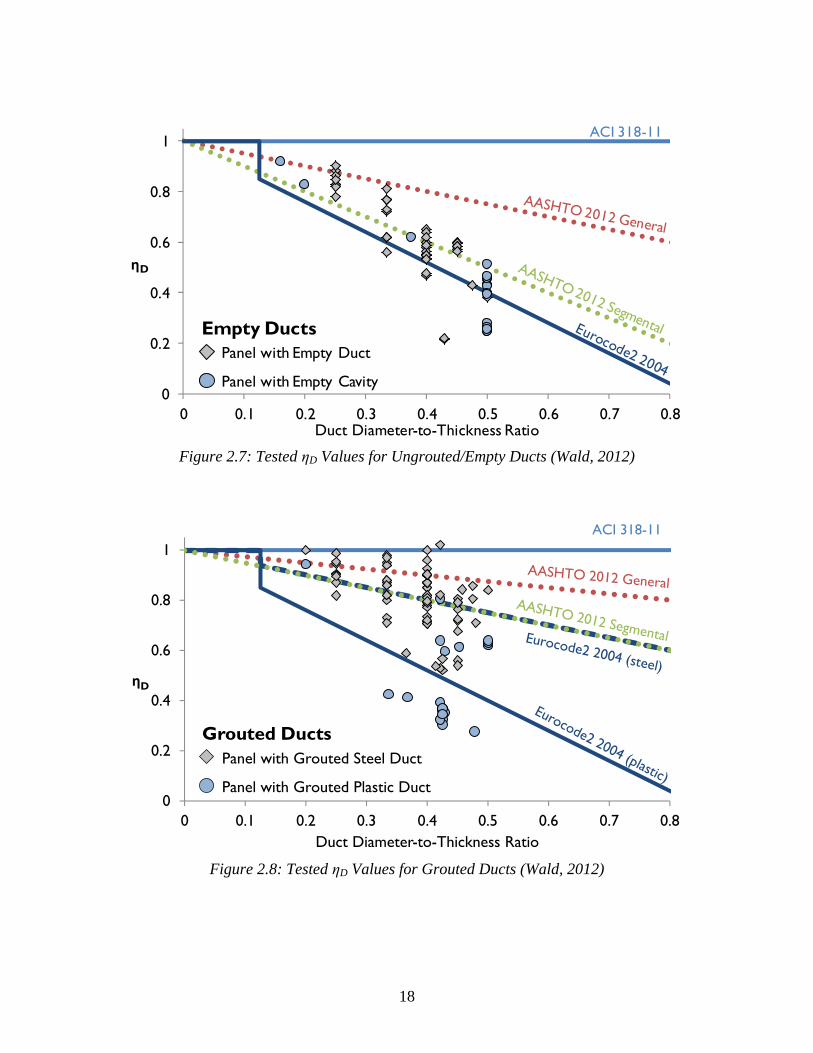
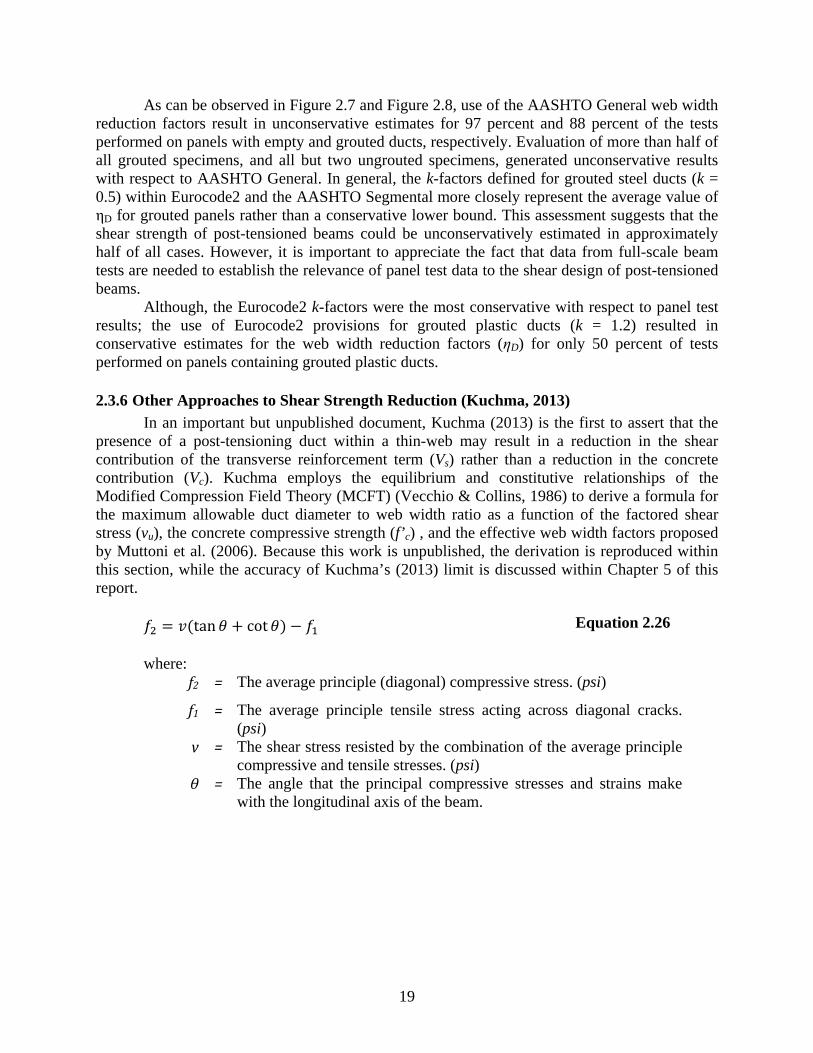
The k-factors shown in Table 2.1 were calibrated by using data from past panel tests described in the literature. Therefore, it is valuable to investigate the level of conservatism associated with the existing code equations. Wald (2012) built a database of one hundred thirty panel test results from thirteen references available in the literature. The results of this database in relation to the web width reduction factors are shown in Figure 2.7 and Figure 2.8.
In Figure 2.7, (from Equation 2.24) is plotted versus the duct diameter-to-web-width ratio for all tests with grouted ducts (steel or plastic). In Figure 2.8, the same relationship is plotted for tests with empty (i.e., ungrouted) ducts. The plotted lines in each figure represent the variation of the web width reduction factor for each of the structural design codes. In interpreting Figure 2.7 and Figure 2.8 it is important to appreciate the fact that the code expressions conservatively estimate the measured web width reduction factor ( ) if the test data lie above the code estimate of (i.e. the lines shown in these figures).
Increased Thickness
unchanged area in tension
Increased Thickness
increased area in compression
Compression
Tension
Splitting Failure Mechanism
18
Figure 2.7: Tested ηD Values for Ungrouted/Empty Ducts (Wald, 2012)
Figure 2.8: Tested ηD Values for Grouted Ducts (Wald, 2012)
As can be observed in Figure 2.7 and Figure 2.8, use of the AASHTO General web width reduction factors result in unconservative estimates for 97 percent and 88 percent of the tests performed on panels with empty and grouted ducts, respectively. Evaluation of more than half of all grouted specimens, and all but two ungrouted specimens, generated unconservative results with respect to AASHTO General. In general, the k-factors defined for grouted steel ducts (k = 0.5) within Eurocode2 and the AASHTO Segmental more closely represent the average value of ηD for grouted panels rather than a conservative lower bound. This assessment suggests that the shear strength of post-tensioned beams could be unconservatively estimated in approximately half of all cases. However, it is important to appreciate the fact that data from full-scale beam tests are needed to establish the relevance of panel test data to the shear design of post-tensioned beams.
Although, the Eurocode2 k-factors were the most conservative with respect to panel test results; the use of Eurocode2 provisions for grouted plastic ducts (k = 1.2) resulted in conservative estimates for the web width reduction factors (ηD) for only 50 percent of tests performed on panels containing grouted plastic ducts.
2.3.6 Other Approaches to Shear Strength Reduction (Kuchma, 2013)
In an important but unpublished document, Kuchma (2013) is the first to assert that the presence of a post-tensioning duct within a thin-web may result in a reduction in the shear contribution of the transverse reinforcement term (Vs) rather than a reduction in the concrete contribution (Vc). Kuchma employs the equilibrium and constitutive relationships of the Modified Compression Field Theory (MCFT) (Vecchio & Collins, 1986) to derive a formula for the maximum allowable duct diameter to web width ratio as a function of the factored shear stress (vu), the concrete compressive strength (f’c) , and the effective web width factors proposed by Muttoni et al. (2006). Because this work is unpublished, the derivation is reproduced within this section, while the accuracy of Kuchma’s (2013) limit is discussed within Chapter 5 of this report.
tan cot Equation 2.26
where: f2 = The average principle (diagonal) compressive stress. (psi)
f1 = The average principle tensile stress acting across diagonal cracks. (psi)
v = The shear stress resisted by the combination of the average principle compressive and tensile stresses. (psi)
θ = The angle that the principal compressive stresses and strains make with the longitudinal axis of the beam.
20
0.8 170
0.85
Equation 2.27
where: f2max = The maximum attainable concrete stress of the principle compressive
stress (psi) ε1 = The average principle tensile strain of the concrete acting
perpendicular to the diagonal tensile stress. (in/in)
Equation 2.28
where: εx = The average longitudinal strain acting on the member. (in/in)
εt = The strain in the transverse reinforcement. (in/in)
ε2 = The average principle compressive strain of the concrete in the direction of the principle diagonal compressive stress. (in/in)
assuming: f1 = 0.05f’c (The principle tensile stress is assumed to be 0.05f’c which is
approximately half of the cracking strength of concrete.)
θ = 30 degrees (The minimum angle that can be calculated with the AASHTO (2013) General Shear provisions is 29 degrees. A reasonable worst case assumption for this angle can be 30 degrees.)
εx = 0.001 (The longitudinal strain at the ultimate shear strength is taken to be the yield strength of the mild reinforcement (0.002). For the purposes of this derivation the duct location is taken to be at the mid-height of the girder and therefore the longitudinal strain is taken as 0.002/2.)
εt = 0.002 (negative taken as compression) (The transverse reinforcement strain at the ultimate shear strength is taken to be the yield strength of the mild reinforcement (0.002))
ε2 = 0.002 (The maximum concrete compressive strain can be taken as 0.002 (Bentz, et al., 2006, p. 616).)
The equation presented in Equation 2.29 is a result of the previous assumptions, and Kuchma (2013) asserts that it provides a maximum duct diameter which will ensure that the transverse reinforcement of a girder will yield prior to the crushing of the web concrete. The application of Equation 2.29 is presented in Chapter 5.
∅ 11.092
4.27 Equation 2.29
21
where:
Øduct = The duct diameter present in the girder web. (inches)
bw = The gross web thickness at the location of the duct. (inches)
vu = The factored ultimate shear stress resisted by the girder. (psi)
kd = The web width reduction factor given by Muttoni et al. (2006) kd = 0.40 for grouted steel ducts kd = 0.80 for grouted plastic ducts kd = 1.20 for empty ducts
2.4 University of Texas Prestressed Concrete Shear Database
The beam test database developed during this literature review expanded upon the existing University of Texas Prestressed Concrete Shear Database (UTPCSDB). The UTPCSDB was originally published in 2008 by The University of Texas at Austin (Avendaño & Bayrak, 2008) and was subsequently updated in 2011 (Nakamura, et al., 2013) to include a large number of tests of Japanese origin. The development of this database is covered extensively in the previous two references and will therefore not be repeated here, but the characteristics of the database are outlined in Figure 2.9 for the reader’s convenience. The 2011 version of the database contained 1,696 tests. An additional five references containing a total of thirty-four shear tests on post-tensioned beams were uncovered during the course of this study; the addition of those tests brought the number of shear test results in the database to 1,730. As shown in Figure 2.9, only 37 percent of the database contains tests performed on girders with internal post-tensioning ducts, and 78 percent of tests were performed on girders with composite heights less than 2 ft. By comparison the overall height of the Tx62 girders tested within this experimental program is 70-in. (62-in. girder and 8-in. deck), which lies within the top 2 percent of all test results found in the collection database. The test specimens of the current research study are the largest internally post-tensioned girder specimens found in the database.
Figure 2.9: UT Prestressed Concrete Shear Collection Database Characteristics
Overall HeightPrestressing TypeOrigin of Research
North America
& Europe
Japan
External PT
Pretensioned Internal PT
N = 1730
> 4 ft80 (5%)
2 to 3 ft166 (10%)
< 2 ft
3 to 4 ft137 (8%)
N = 1730 N = 1730Non-prestressed
1347(78%)
383(22%)
47 (3%)
155 (9%)
641(37%)887
(51%)1347(78%)
22
2.4.1 Evaluation Database Development
Initial filtering of the UTPCSDB was completed in accordance with the guidelines established by Nakamura et al. (2013). Additional filtering criteria were applied to the remaining tests to ensure that they are directly applicable to spliced post-tensioned bridges. Specifically, specimens in the final database contained post-tensioning ducts within the shear span of the girder. The filtering criteria are described in Figure 2.10.
Filtered for Prestressing Type: Removed 737 tests without post-tensioning ducts within the web of the shear span or those tests which did not report PT duct information
Evaluation Database:
Post-Tensioned Girders(34 tests)
Evaluation Database Criteria: Removed 409 tests.Database Contains Tests Specimens with:• Concrete Strength: f ’c > 4.0 ksi• Specimen Height: h > 12 in.• Span to Depth a/dp >2.0• Normal Weight Concrete• AASHTO Minimum Shear Reinforcement• I-Girder, Bulb-Tee, or Box Cross-Section
23
2.4.2 Evaluation Database Characteristics
The collection of the 34 tests is referred to as the Evaluation Database for Post-Tensioned Girders (hereafter the PT Evaluation Database). An overview of the characteristics and primary experimental variables of these 34 tests are shown in the following seven sections.
2.4.2.1 Concrete Compressive Strengths, f’c
The PT Evaluation Database was restricted to a minimum concrete compressive strength of 4 ksi and contains tests on girders whose concrete compressive strength is between 4.1 and 12.3 ksi. The majority of tests in the database (71 percent) are made up of girders with compressive strengths below 8 ksi, as shown in Figure 2-10.
Figure 2.11: Distribution of Concrete Strength in PT Evaluation Database
Due to the current widespread use of high strength concrete (in excess of 10 ksi compressive strength) there is a great need to expand the database to include specimens made with higher strength concretes. In this context, it is important to note that of the eleven tests performed during this research program all were above 10.5 ksi, and 27 percent of the tested girders reached strengths in excess of 13.0 ksi.
2.4.2.2 Overall Member Height, h
The member height of the specimens in the PT Evaluation Database (as reported in Figure 2.12) is taken as the either the total height of the girder tested or the composite height of the girder plus the deck when applicable. The height of girders within the evaluation database is restricted to a minimum of 12 inches. The minimum height of the test specimens included within the database was 16 inches and the maximum was 53.4 inches. Thirty-eight percent of tests were performed on girders under 2 feet in height.
0
5
10
15
20
2 4 6 8 10 12 14
Num
ber
of t
ests
f 'c (ksi)
4 ≤ f'c < 824 (71%)
8 ≤ f‘c < 128 (23%)
12 ≤ f‘c2 (6%)
Min: 4.1 ksiMax: 12.3 ksi
Mean: 6.6 ksi0. 2 4 6 8 10 12 14
24
Figure 2.12: Distribution of Specimen Height in PT Evaluation Database
The importance of full-scale testing cannot be overstated. The complexities associated with post-tensioned girder design and construction requires full-scale girders to accurately assess the capacity of these girders and compare them to those in use in bridges and roadways. Therefore, the tests performed during this experimental program consisted of 62-inch deep girders with an 8-inch topping slab for a composite height of 70 inches. It is important to observe that in Figure 2.12 there are no test specimens in this range.
2.4.2.3 Use of Composite Cross-Section (Decked Girders)
As shown in Figure 2.13, 82 percent of tests in the PT Evaluation Database were performed on girders without a cast-in-place deck. Although adding a concrete deck to a test specimen is resource-intensive, it is the most realistic way to model the behavior of a bridge girders which will almost always be topped with a cast-in-place slab before use. This slab increases the moment capacity of the girder, but more importantly it changes the state of strain in the web of the girder by shifting the compression region upward. Therefore all girders tested during this program were decked with an 8-inch-thick concrete slab, which was cast after the girder had been post-tensioned and grouted.
Figure 2.13: Distribution of Composite Girders in PT Evaluation Database
0
5
10
15
20
12 24 36 48 60 72 84
Num
ber
of t
ests
height (in.)
h < 2413 (38%)
24 ≤ h < 4815 (44%)
48 ≤ h6 (18%)
Min: 16-in.Max: 52-in.
Mean: 33-in.0 12 24 36 48 60 72 84 .
Non‐composite28 (82%)
Composite6 (18%)
25
2.4.2.4 Shear Span to Depth Ratio, a/d
The shear span-to-depth ratio (a/d) is often used in the literature to demonstrate that the shear test under consideration is exhibiting sectional rather than deep beam behavior characteristics. The shear span-to-depth ratio was limited to a minimum of 2.0 for all tests included in the PT Evaluation Database to prevent deep beam behavior from being included in the database. Of the tests in the evaluation database 41 percent were performed on specimens with shear span-to-depth ratios under 3.0 with a minimum span-to-depth ratio of 2.19 as shown in Figure 2.14.
Figure 2.14: Distribution of Shear Span to Depth Ratios in PT Evaluation Database
For non-prestressed girders, the shear span-to-depth ratio at which the behavior
transitions from sectional shear to deep beam behavior is generally accepted as 2.0. When prestressing steel is introduced into the beam, this transition point can increase slightly to approximately 2.5 (Nakamura, et al., 2013). Because the transition point for prestressed girders is more subjective, to be consistent with the AASHTO (2013) definition of beam shear, the 2.0 limit was chosen as the criterion. Specimens with a shear span-to-depth ratio between 2.0 and 2.5 are further analyzed in Chapter 5 to evaluate the transitional behavior of these specimens. The girders tested in the experimental program were tested at shear span-to-depth ratios of 3.0 to ensure sectional shear failure.
2.4.2.5 Shear Reinforcement Ratio, ρv fy
The PT Evaluation Database is restricted to girders containing at least the minimum shear reinforcement required by AASHTO (2013). The minimum normalized shear reinforcement ratio is 0.05 ksi and the maximum is 1.73 ksi. Of the tests in the PT Evaluation Database 65 percent were performed on girders with normalized shear reinforcement ratios less than 0.5 ksi.
0
5
10
15
20
1 2 3 4 5 6
Num
ber
of t
ests
a/d ratio
a/d < 3.014 (41%)
3.0 ≤ a/d < 4.011 (32%)
4.0 ≤ a/d 9 (27%)
Min: 2.19Max: 4.63
Mean: 3.390 1 2 3 4 5 6
26
Figure 2.15: Distribution of Transverse Reinforcement Ratio in the PT Evaluation Database
2.4.2.6 Ratio of Duct Diameter to Minimum Web Thickness, ØD / bw
50 percent of the tests in the PT Evaluation Database consist of girders having duct diameters greater than forty percent of the web width (the limit stated in §5.4.6.2 of AASHTO (2013)). The maximum duct diameter-to-web-thickness ratio was 0.51 and the minimum was 0.25 as is shown Figure 2.16.
Figure 2.16: Distribution of the Post-Tensioning Duct Diameter to the Web Width of Girders in
the PT Evaluation Database
0
5
10
15
20
0.2 0.4 0.6 0.8 1 1.2 1.4 1.6 1.8 2
Num
ber
of t
ests
ρvfy (ksi)
ρfy < 0.522 (65%)
0.5 ≤ ρfy < 1.59 (26%)
1.5 ≤ ρfy 3 (9%)
Min: 0.05 ksiMax: 1.73 ksi
Mean: 0.45 ksi0 0.4 0.8 1.2 1.6 2.0
0
5
10
15
20
0.1 0.2 0.3 0.4 0.5 0.6
Num
ber
of t
ests
ØD /bw
Ø/b < 0.38 (24%)
0.3≤Ø/b<0.49 (26%)
0.4 ≤ Ø/b 17 (50%)
Min: 0.25Max: 0.51
Mean: 0.370 0.1 0.2 0.3 0.4 0.5 0.6
27
Exactly one half of test girders exceeded the “ØD/bw = 0.4” limit stated in AAHSTO (2013). Many state departments of transportation ignore this limit and routinely design girders with ratios of 0.51 (Williams, et al., 2013). In keeping with this trend, in the experimental program, nine of the post-tensioned girders tested maintained a duct diameter to thickness of 0.43 to 0.44, while the final test girder had a ratio of 0.33.
2.4.2.7 Post-Tensioning Duct Material
It is particularly important to note that, prior to the experimental program conducted as part of this research study, there have been no shear tests conducted on girders containing plastic post-tensioning ducts. This appears to be an especially concerning fact given that there was as much as a 40 percent decrease in the capacity of panels containing grouted plastic ducts compared to similar panels with grouted steel ducts (Muttoni, et al., 2006). Although there has been a documented drop in panel compressive strength, this phenomenon has never been studied in girder shear testing. Many of the girder tests conducted during this research study provide direct comparisons between the shear strength of girders containing grouted plastic and steel ducts, and the current experimental study contributed a total of four tests on girders containing grouted plastic ducts to the PT Evaluation Database.
2.4.3 Significant Studies from Post-Tension Girder Evaluation Database
Of the additional five sources uncovered and added to the UTPSCSDB during this literature review, only three contained research conducted with the express purpose of evaluating the effects of post-tensioning ducts within the webs of girders. These three research programs are discussed in the following three sections, while the resulting experimental data was included in the Post-Tension Girder Evaluation Database.
2.4.3.1 Chitnuyanondh (1976)
Chitnuyanondh (1976) published the first paper that utilized beam shear tests in an effort to explore the effect of a post-tensioning duct on the shear strength of a thin-webbed member. These tests were performed on 16-inch tall girders with relatively low concrete compressive strengths and relatively large transverse reinforcement ratios (compared to contemporary post-tensioned bridge girders). These beam tests were supplemented by panel tests, which were designed to represent the web sections of the I-beams, which contributed to the panel test database mentioned in Section 2.3. There are three factors that should be considered prior to implementing the results from this research study: (1) the relatively small size of the post-tensioned girders, (2) the relatively low concrete compressive strength of the girders (3.5 ≤ f’c ≤ 6.4 ksi), and (3) the large transverse reinforcement ratios (0.87 ≤ ρv fy ≤ 1.73 ksi) of the test girders. This large amount of transverse reinforcement, in conjunction with the low concrete strength caused them to be well in excess of the maximum nominal shear stress allowed by AASHTO (2013) of 0.25f’c.. 2.4.3.2 Ruiz & Muttoni (2008)
Ruiz and Muttoni (2008) performed shear tests on five I-girder specimens extracted from a bridge replaced after decades of service. This bridge was built in 1967, before the modern design code requirements for concrete cover were established. Therefore the duct diameter to web width ratio of 0.48 found in these bridge girders was large in comparison to the current limit of 0.4, although similar to current design practice in the US (Williams, et al., 2013). These 43.3 -
28
in. deep girders were removed from the roadway with their 9-in.-thick-deck intact. They contained two draped post-tensioning tendons along their length formed with galvanized steel ducts similar to those galvanized ducts used current structures. In addition to the post-tensioning, the girders were pretensioned along their length, with the exception of at the mid-span where they had been spliced together. The original construction of the girders (circa 1967) is shown in Figure 2.17 (A), the extracted girders are shown in Figure 2.17 (B), and finally the frame used to test the shear strength of the girder is shown in Figure 2.17 (C).
Figure 2.17: Testing by Ruiz & Muttoni (2008) (A) Construction of Girders in 1967, (B)
Extraction of Girders in 2003, & (C) Testing of Extracted Girders (Muttoni, 2014)
One of the most notable findings of this testing program was that the girders all failed by web crushing and concrete spalling along trajectory of the duct (example shown in Figure 2.18). Ruiz and Muttoni commented that vertical strains measured along the web of the girder were greatest at the location of the duct and that the strains indicated that significant yielding of transverse reinforcement had occurred at that location. Ruiz and Muttoni indicated that the spalling observed along the tendon was a result of these large tensile strains and that the web crushing along the duct was a separate phenomenon brought on by the weakening of the web as a result of the presence of the duct within the cross-section. It should be noted that during these tests damage to the web was only seen above the location of the post-tensioning duct.
A B
C
29
Figure 2.18: Local Crushing Along the Trajectory of the Duct (Ruiz & Muttoni, 2008)
2.4.3.3 Rupf, Ruiz, & Muttoni (2013)
Rupf, Ruiz, and Muttoni (2013) conducted shear research into the behavior of ⅜ scale girders meant to model segmental box girders. During design, box girders are commonly assumed to have the same shear strength as an equivalent I-girder with a web thickness equal to the sum of that of the box girder. Therefore, although the cross-section tested by Rupf et al. (2013) was modeled after a box girder the girder tested was an I-girder with relatively wide bottom and top flanges in similar proportions to what is seen in box girder bridges. The dimensions of the girders tested are shown in Figure 2.19.
Figure 2.19: Cross-Sections of Girders Tested Under Rupf, Ruiz, & Muttoni (2013)
5.9 in.
Ø1.77 in.
31.5 in.
5.9 in.
30.7 in. 18.1 in.
30
The primary test variables of the research program were the amount of transverse reinforcement, the anchorage detailing of that reinforcement, the post-tensioning force, and the cross-sectional shape (a rectangular or a flanged shape). These test girders are the only ones within the PT Evaluation Database that were conducted on shear spans which included a negative moment region. These girders were loaded to produce an inflection point at the center of the shear span. This was accomplished by two point load applications as shown in Figure 2.20 and Figure 2.21.
Figure 2.20: Test Setup of Rupf, Ruiz, & Muttoni (2013) (Muttoni, 2014)
Figure 2.21: Loading Configuration, Moment, and Shear Diagrams of Tests by Rupf et al. (2013)
-PPP
2P P
P 2Pa a2a
Pa
-Pa
Applied Moment
Applied Shear
tendon profile
31
Rupf et al. found that the presence of flanges contributed greatly to the shear behavior of beam shear. The large flanges used in the I-girders of the testing program tended to redistribute loads throughout the web of the girder, which resulted in a less brittle failure, and a slightly higher shear capacity than those tests conducted on rectangular girders. Additionally, they found that when the controlling (observed) failure mechanism was localized crushing at the tendon the maximum compressive strain at the level of the tendon was close to 2 percent, which is consistent with the maximum compressive strain of a diagonal strut assumed in the development of the AASHTO General equations described in Section 2.2.1 (Bentz, et al., 2006, p. 616).
2.5 Summary
A primary concern of post-tensioned girder design is how to account for a reduction in shear strength that may occur due to the presence of a post-tensioning duct in the web of a girder. The high cost of large scale research endeavors has resulted in a limited number of tests being performed on full-scale post-tensioned girders. Instead, the current procedure for reducing the strength of a post-tensioning girder to account for the presence of a duct is based on small-scale panel compression tests. These panel tests showed conclusively that panels containing grouted plastic ducts failed at significantly lower loads than panels that contained grouted steel ducts (Muttoni, et al., 2006), (Wald, 2012). This finding was incorporated into the Eurocode2 as a web width reduction factor (ηD) that accounted for the duct material as well as its diameter and the presence of grout. It is important to understand that no full-scale shear tests have ever been conducted on girders containing plastic ducts, and therefore, the importance of duct material on girder shear behavior has never been fully studied. Chapters 3 and 4 describe an experimental study which includes the first full-scale shear tests on girders containing plastic post-tensioning ducts and direct comparisons between the strengths of girders containing grouted plastic and steel post-tensioning ducts.
33
Chapter 3. Experimental Program
3.1 Overview
The experimental study detailed within this chapter was conducted in an effort to better understand the shear behavior of post-tensioned concrete girders and more specifically to investigate the impact of post-tensioning ducts on the shear behavior of full-scale test specimens. Eleven shear tests were performed on six full‐scale post‐tensioned concrete bridge girders and one full-scale control girder that did not contain post-tensioning. These tests provided valuable insight into the shear behavior of post-tensioned girders as well as a direct comparison between the behaviors of girders containing grouted plastic and steel ducts. The design, construction, and testing of these full-scale test specimens are described within this chapter.
3.1.1 Primary Variables of Experimental Program
To better understand the behavior of post-tensioned girders, the influence of the variables shown in Table 3.1 was investigated. The variables are:
(i) Presence of a post-tensioning duct (ii) Post-tensioning duct material (plastic or steel) (iii) Web-width (iv) Duct Diameter (v) Transverse Reinforcement Ratio
Table 3.1: Primary Variables of Experimental Program
Test Specimen
DuctMaterial
Duct Diameter Øduct (inches)
Web Widthbw (inches) Øduct/bw . ρv fyv (ksi)
Tx62-1(S) Plastic
3
7
0.43
0.638
Tx62-2(S) Steel 0.650
Tx62-2(N) Steel 0.650
Tx62-3(S) No Duct -- 0.642
Tx62-4(S) Steel
3 0.43
0.950
Tx62-4(N) Plastic 0.950
Tx62-5(S) Plastic 0.214
Tx62-5(N) Steel 0.214
Tx62-6(S) Plastic4
90.44
0.854
Tx62-6(N) Steel 0.854
Tx62-7(S) Steel 3 0.33 0.862
34
3.2 Test Specimen Design
The tests specimens used in this experimental program were 50-feet-long Tx62 girders with 7.5-foot long thickened end-blocks built to accommodate the post-tensioning anchorages. These test girders did not have a splice region. Instead they were designed to model the behavior of spliced bulb-tee girders in regions away from the splice. The dimensions of these girders are detailed in Figure 3.1.
Figure 3.1: Tx62 Test Specimens Showing Dimensions of 7 and 9-inch-thick Web Girders
bw= 7-inches 9-inches
bTF= 42-inches 44-inches
bEB= 22-inches 24-inches
bBF= 32-inches 34-inches
3’ 4’ - 6" 17’ - 6"
Symm
etricabout
A
A
B
B3 ½”
1 ½”
bEB
10”
45 ¾”
5”2 ½”
8 ¾”
bTF
bBF
2”2 ½”3 ½”
15 ½”2”
3” 9 ½”3”
8 ¾”
4 ¾”
37 ½”
bTF
bBF
bw
Cross-Section A-A Cross-Section B-B
35
3.2.1 Pretensioning Strand Layout
All girders, with the exception of the control (Tx62-3), contained both pretensioning and post-tensioning. The pretensioning strands for all girders consisted of 0.5-inch diameter seven wire low-relaxation prestressing strands (ASTM-A416). For all girders with consistent cross-sections the strand patterns were also consistent; Tx62-1 through 5 (7-inch web girders) contained seventy fully stressed strands. Of these strands, four were located within the top flange and sixteen were debonded for 4.5 feet from the end of the girder, as shown in Figure 3.2, to control stresses at prestress transfer. This debonding length was chosen so that at the end of the end-block transition all strands were fully bonded and the length of the bonded portion of the strands within the end-block exceeded the strand’s transfer length.
The final two girder cross-sections were two inches wider than the first five. These girders contained 80 fully stressed strands. Of these strands, six were located within the top flange and fourteen were debonded for 4.5 feet (for the reasons stated previously), as shown in Figure 3.2.
Figure 3.2: Pretensioning Strand Layout and Debonding
3.2.2 Prestress Transfer Stress Calculations
Top and bottom fiber stresses at prestress transfer were calculated by the use of gross section properties, shown in Table 3.2. The minimum concrete compressive strength at release (f ’ci) of pretensioning force was calculated in accordance with §5.9.4 of AASHTO (2013), and was controlled by the compressive stress at the bottom of all girders cast during this research program. The calculated release tensile and compressive stresses, the required compressive release strength, and the actual compressive strength at the time of release are shown in Table 3.2.
2.5” 2.5”
7” 9”
58.5”58.5”
All Strand on 2-in. Grid(vertically and horizontally)
Indicates Debonded Strand(all debonding terminates 4.5-ft. from girder end)
36
37
Table 3.2: Release Strengths and Stress Properties
3.2.3 Concrete Materials
All test specimens were cast at a single precast concrete fabrication yard and were fabricated with the standard prestressed Tx-Girder mixture design used at this fabrication plant. The girder concrete was a self-consolidating concrete (SCC) mix with 0.5-inch river gravel as the course aggregate. The fabrication plant had been using SCC exclusively for over two years at the time the first test girder was cast, and no problems with consolidation or honey combing were experienced during the casting of any of the test girders. The concrete mixture designs of both the girders and the deck are shown in Table 3.3 and Table 3.4 respectively.
Table 3.3: Girder Concrete Mixture Design
GirderIgirder
(in4)Agirder
(in2)Max. Top
Stress†Max Bottom
Stress† f 'ci † Release Strength
[Release Factor††]
Tx62-1
463,070 in4 910 in4 0.47 ksitension
4.78 ksicompression
7.50
ksi
com
pres
sive
str
ess
cont
rols 7.90 ksi [0.60f ’ci]
Tx62-2 9.64 ksi [0.50f ’ci]
Tx62-3 7.80 ksi [0.61f ’ci]
Tx62-4 8.19 ksi [0.58f ’ci]
Tx62-5 9.12 ksi [0.51f ’ci]
Tx62-6502,790 in4 1034 in2 0.33 ksi
tension4.74 ksi
compression
9.00 ksi [0.53f ’ci]
Tx62-7 7.79 ksi [0.61f ’ci]† Stresses and release strengths are calculated (not measured)values.††Release Factor equals the ratio of the strength at release to the maximum bottom stress.
Material Detail Amount Unit
CementitousMaterial
Type III Cement 663
lb. /
yd
3co
ncre
te
Class F Fly Ash 271
Fine Aggregate Sand (F.M. = 2.7) 1,222
Coarse Aggregate Pea Gravel (½” nom. max.) 1,555
WaterWater 269
w/cm Ratio 0.310 --
Admixtures(produced by Sika)
Viscocrete 2110 (super plasticizer) 5.50
oz. p
er
hund
redw
eigh
t
Plastiment (retarder) 2.50
CNI (corrosion inhibiter) 41.15
Stabilizer VMA (viscosity modifier) 2.78
38
Table 3.4: Deck Concrete Mixture Design
3.2.4 Post-Tensioning Anchorage and Tendon Layout
Each test specimen contained one post-tensioning tendon comprised of 12 - 0.6-inch diameter low-relaxation prestressing strands. This tendon had a straight profile throughout the length of the girder and was located at the mid-height of the web (at 35.25-inches from the bottom of the girder), as shown in Figure 3.3. Each end of the tendon was anchored by a multi-plane cast steel anchor-head provided by BBR Network (model: CONA-CMI 1206), as shown in Figure 3.4 (A) and (B). The tendons were housed in post-tensioning ducts that varied both in diameter and material (either plastic or steel) depending on the test variable under consideration.
Figure 3.3: Post-Tensioning Tendon Profile at 35.25-inches from Bottom of Girder
Standard pretensioned Tx62 girders have a constant cross-section throughout their length (i.e. they do not have thickened end-blocks or other changes of cross-section throughout their length). All Tx62 test specimens constructed during this experimental study were modified to include a thickened end-block to accommodate the post-tensioning anchorages necessary in post-tensioned construction.
To aid in the design of the end-block, cross-sections and end-block lengths from the Florida Department of Transportation (FDOT) and the Washington State Department of Transportation (WSDOT) were reviewed and evaluated for their advantages and disadvantages. The three potential Tx62 end-block geometries based on these designs (shown in Figure 3.5) were discussed with the members of the Project Advisory Panel (Khaleghi, et al., 2011). The final design selected for construction most closely follows that of WSDOT, as shown in Figure 3.5(B)). The dimensions of the Tx62 end-blocks used during this experimental study are shown in detail in Figure 3.1.
40
Figure 3.5: Possible End-Block Geometries Explored During Design
(A) “FDOT Style” End-Block(not built)
(B) “WSDOT Style” End-Block(final design used for test specimens)
(C) Hybrid of FDOT & WSDOT Style End-Blocks(not built)
41
3.2.6 End-Block Reinforcement Design
Although the overall geometry of the end-block was inspired by WSDOT standards, the end-block reinforcement was designed specifically to provide adequate resistance to the bursting and splitting forces which may be introduced during this research program. The end-block reinforcement design procedures fall into one of two categories: local zone reinforcement or general zone reinforcement. The local zone reinforcement is provided at the anchorage and is described in Section 3.2.8 while the calculations for the general zone reinforcement are described in Section 3.2.9. The end-block reinforcement details are described in the following section for clarity of the bar type being designed.
3.2.7 End-Block Reinforcement Details
The end-block reinforcement was designed to accommodate up to three post-tensioning tendons in anticipation of a future experimental study, but for all test specimens fabricated during this experimental program only one post-tensioning tendon was used. Full drawings of each test specimen are provided in Appendix B, but a rendering of the end-block reinforcement is shown in Figure 3.6 through Figure 3.7. All end-block reinforcement calculations can be found in Sections 3.2.7 and 3.2.9.
Figure 3.6: Rendering of End-Block Reinforcement (Part 1 of 3)
42
Figure 3.7: Rendering of End-Block Reinforcement (Part 2 of 3)
A-bars C-bars
E-bars H-bars
D-bars DS-bars
43
Figure 3.8: Rendering of End-Block Reinforcement (Part 3 of 3)
SpiralRE-bars
RC-barsR-bars
U-barsT-bars
44
3.2.8 Local Zone Reinforcement
As explained in §5.10.9.7.3 of AASHTO (2013), it is required that the post-tensioning anchorage manufacturer specify the local zone reinforcement to be used with a specific anchorage device. For the anchorages used in this study, BBR Network specifies spiral reinforcement made of No.5 rebar (10.25-inch diameter, 2-inch pitch, and 10-inch long) and 12-inch square stirrups to enclose their CONA-CMI 1206 anchorage, this reinforcement is shown in Figure 3.6(D) in place surrounding the anchorage.
Figure 3.9: Local Zone Reinforcement Provided at Post-Tensioning Anchorage
3.2.9 General Zone Reinforcement Calculations
This general zone reinforcement was provided in two orthogonal directions as transverse and “through-thickness” reinforcement, as shown in Figure 3.10. The reinforcing bar types (D, DS, RE, and RC-bars) are illustrated in Figure 3.6 through Figure 3.8 of Section 3.2.7.
E-bars: No. 5 12-in.
square stirrups(5 bars spaced at 4-in.)
Spiral:No. 5 10.25-in.
diameter, 2-in. pitch, and 10-in. long
45
Figure 3.10: Bursting & Splitting Reinforcement Provided in Orthogonal Directions
The general zone reinforcement was designed to resist the stresses developed during
prestress release (pretensioning) and during the stressing of the post-tensioning anchorages. The worst case for the design of the end-block reinforcement assumes the presence of three post-tensioning anchorages and seventy 0.5-inch diameter pretensioning strands. All prestressed reinforcement was assumed to be stressed to 0.75fpu or (202.5 ksi). The post-tensioning bursting reinforcement was designed using the strut-and-tie provisions for post-tensioned anchorages of AASHTO (2013) (§5.10.9.4) while the pretensioning splitting reinforcement was provided in accordance with the “four-percent” method of AASHTO (2013) (§5.10.10.1). These calculations are shown in detail in Figure 3.11 through Figure 3.13.
“Through-Thickness” Reinforcement(D & DS–bars )
Transverse Reinforcement(RE & RC–bars )
46
Figure 3.11: Calculations for Transverse Post-tensioning Bursting Reinforcement
The anchors will be stressed individually. Therefore, all tensile forces shown above must be resisted by reinforcement.
. .∗ ∗ 0.75 1.2 ∗ 12strands
anchorage3anchorages0.217
instrand
0.75 ∗ 270ksi
,
Ttt(1)
Ttt(2)
Ttt(3)
3
3
3
.
.
21
PPT
Ttt = Ttt(1) + Ttt(2) + Ttt(3)
2
2
Required PT Bursting Reinforcement:
0.75 60
.
47
Figure 3.12: Calculations for Through-Thickness Reinforcement (D & DS-bars)
AA
PPT PPT
Through Thickness Reinforcement ProvidedSlope: 2:1
Slope: 36:5
Ttt(1) Ttt(2)
,
.
.
.
/
.
Taper Reinforcement: DS-bars
6 5 0.2
.
.
General Zone Reinforcement: D-bars
6 9 0.2
.
3
3
3
Section A-A
48
Figure 3.13: Reinforcement Provided by RE and RC-bars (Bergmeister, et al., 1993)
Pretensioning Splitting Reinforcement: §5.10.10.1 of AASHTO (2013)
. within a distance of h/4 from the end of the member
. within a distance of 15.5-in. from the end of the member
No. 5 RE and RC - bars Spaced at 4-inches provide 4.8-in.2 within first 15.5-in. of beam.
PT Bursting Reinforcement : .
Provide reinforcement over a distance h beginning at 0.2h from end of beam (Bergmeister, et al.,1993)
Provide 10.6 in.2 Reinforcement between 12-in. and 74-in. from beam endNo. 5 RE and RC bars Spaced at 4-inches provide 14.8-in2 of transverse reinforcement
between 12-in. and 74-in. from beam end
. .
49
3.3 Test Specimen Fabrication
Although pretensioned girder construction is common in the state of Texas, post-tensioned construction is more specialized and the difficulties of constructing a post-tensioned end-block cannot be overlooked. This complex construction necessitated that the fabrication of the test girders be done offsite by a precast prestressed beam fabrication plant. The procedure followed during the fabrication of the pretensioned beam specimens (prior to the release of pretensioning force) is discussed in detail in this section. More specifically this section includes detailed descriptions of: (i) stressing of pretensioning strands, (ii) tying mild reinforcement, (iii) assembly of post-tensioning hardware, and (iv) concrete placement.
(i) Pretensioning strand stressing:
Prior to tying the reinforcement cage the pretensioning strands were strung the length of the prestressing bed (550 feet), and the strands were individually stressed to 0.75fpu (202.5 ksi) to a tolerance of ±5 percent, as shown in Figure 3.14.
Figure 3.14: Individual Stressing of the Pretensioning Strands at Fabrication Plant
(ii) Assembly of reinforcement and post-tensioning hardware:
With the strands fully stressed, the multi-plane anchor head was bolted to the steel end-forms and sealed with silicone to prevent cement paste from leaking into the anchor head during concrete placement (shown in Figure 3.15 (A)). After the anchor head was secured, the end-block reinforcing cage was tied around the anchor head beginning with the local zone reinforcement (shown in Figure 3.15 (B)) and the transverse reinforcement was put in place along the length of the beam. Then, with most of the reinforcement in place, the post-tensioning duct was threaded through the reinforcement cage, coupled together as necessary, and supported at a minimum of 2-foot intervals along the length of the girder to prevent any movement during casting (as shown in Figure 3.15 (C)). Finally,
50
the reinforcement for the top flange was tied, which completed the reinforcement assembly for the test girder (fully tied rebar cage of Tx62-7 shown in Figure 3.16).
Figure 3.15: (A) Mounting and Sealing Post-Tensioned Anchorage, (B) Local Zone
Reinforcement & (C) Duct Supports Spaced at 2 feet
A
B C
51
Figure 3.16: End-block reinforcing cage of Tx62-7
(iii) Concrete Placement:
The precast beam fabrication plant chosen for constructing the test specimens had extensive experience with self-consolidating concrete (SCC). The experience of this fabrication plant with SCC was a result of increasing use of this material in the state of Texas. As a result a SCC was used in constructing all of the test specimens. Typically this fabrication plant only uses internal “stinger” type vibrators to consolidate SCC, neglecting the external vibrators required to properly consolidate conventional concrete mixtures. Due to the tight clearances present in the web at the height of the duct and the congestion within the end-block, both external and internal vibrators were used in fabricating test specimens. The internal “stinger” type vibrators were used in the end-blocks (shown in Figure 3.17 (A)), but could not pass the duct level. Proper consolidation around the duct and into the bottom flange was achieved by taking advantage of the low viscosity of the SCC mixture and external vibrators (shown in Figure 3.17 (B) and (C)). This proper consolidation was confirmed upon cutting of the beams after testing in which consistent aggregate distribution was seen throughout the depth of the test specimens.
52
Figure 3.17: Concrete Consolidation (A) “Stinger” Type Vibrators Used within End-Block &
(B), (C) Self-Consolidating Concrete Flow
3.3.1 Prestress Transfer
After casting, the test specimens were allowed to cure with the side forms in place until the specified release strength (7.50 ksi for all girders) was reached. Once the actual compressive strength of concrete (fci) exceeded its design value (fci’) the girder was be prepared for prestress transfer. This procedure is described below:
(i) Removal of formwork:
Prior to prestress transfer, both side forms were removed while end forms and soffit remained in place, as shown in Figure 3.18. Then the girder ends were lifted and small Teflon shims were installed between the soffit of the beams and the steel forms to prevent any damage during the sliding that is routinely observed in this plant operation.
A B
C
53
Figure 3.18: Removal of Side Forms Prior to Prestress Transfer
(ii) Removal of prestressing bulkhead spacer blocks: Steel spacer blocks were used to hold the prestressing force during individual strand stressing and during the fabrication/casting process, as shown in Figure 3.19(A). Prior to prestress transfer, hydraulic rams were extended far enough to loosen these spacers such that they can be moved out of the way to allow the bulkhead to retract (Figure 3.19 (B)).
Figure 3.19: Prestress Release: (A) Bulkhead with spacer blocks and rams in-place & (B) Gang
release of prestressing strands by retracting rams
(iii) Prestress Transfer (Gang Release of Strands): With the rams extended and the spacers removed all of the pretensioning force was transferred from the spacers to the rams. The hydraulic pressure was then slowly released from the rams and the gang stressing plate was permitted to slowly retract and transfer
Spacer Blocks Hydraulic Rams
A B
Spacer Blocks Removed
54
the pretensioning force (shown in Figure 3.19 (B)). With all of the prestressing force transferred, the strands were flame cut so that the test specimens could be moved into storage prior to transporting to Phil M. Ferguson Structural Engineering Laboratory (FSEL).
3.3.2 Post-Tensioning Procedure
Upon arrival at FSEL, the girders were removed from the truck by a two crane lift system, shown in Figure 3.20. After the girders had been placed in their final location for testing the girders were post-tensioned by following the procedure listed here and illustrated in Figure 3.21.
Figure 3.20: Two Crane Lift System at FSEL
55
(i) Installation of strands: For each test specimen, 12 - 0.6-inch diameter prestressing strands were manually installed in the duct, as shown Figure 3.21(A)).
Figure 3.21: Post-tensioning Procedure
Pipe to set strand chucks
A B
Installation of strand
Post-tensioning “button”
Automotive valve springsC D
1,300-kip center hole ram
E F
Setting outer anchor-head Elongation measurements
56
(ii) Installation of stressing anchor heads: The stressing anchor heads were then installed with their chucks as shown in Figure 3.21 (B) on both live and dead-end anchorages. The chucks were set by striking them with a metal pipe threaded onto the individual prestressing strand.
(iii) Installation of the post-tensioning button: A stressing “button” was used to react against the post-tensioning anchor head during stressing, as shown in Figure 3.21 (C). The “button” benefitted from the automotive valve springs used to prevent excessive set losses at the completion of post-tensioning.
(iv) Installation of 1,300 kip center-hole ram: A 1,300 kip center-hole ram was used to apply the post-tensioning force, as shown in Figure 3.21 (D). A system calibration was conducted on this ram coupled with a pressure transducer. Strain readings obtained from a vibrating wire gauge and strand elongation measurements were also used to double check the magnitude of the post-tensioning force
(v) Installation and seating of the outer, stressing anchor head: An additional post-tensioning anchor head was used to stress the strands as shown in Figure 3.21 (E). After the strands were fully stressed the ram was retracted and the strands were cut between the ram and this second stressing anchor head.
(vi) Stressing post-tensioning tendon by 20 percent increments: With all equipment in place, the tendon was slowly stressed to 105 percent of the jacking force (jacking force equal to 0.75fpu, 202.5 ksi, 44 kips per strand, or 527 kips total) in 20 percent increments. At each interval, elongation and vibrating wire gauge readings were taken, as shown in Figure 3.21 (F). These values were then compared to the expected values given the load applied by the ram to ensure both accuracy and safety of the operation.
(vii) Retracting ram and set loss calculations: As previously stated, the post-tensioning tendon was over-stressed to 105 percent to account, in part, for the set losses of the chucks. Once this force level was reached vibrating wire gauge readings were taken, the hydraulic pressure on the ram was released allowing set losses to occur, and final vibrating wire gauge readings were taken. The readings of the vibrating wire gauges (in addition to the tested elastic modulus of the concrete) were then used as described in Section 3.3.5 to calculate the losses and determine the final post-tensioning force.
3.3.3 Grouting Procedure
After the post-tensioning tendon was stressed, the tendon was grouted with BASF’s Masterflow 1205 post-tensioning grout by following the procedure outlined within this section. Four grout vents were used in all post-tensioned girders. Two of these were mounted on grout caps, which were used to seal the exterior of the anchor head for grouting, as shown in Figure 3.22 (A). The remaining two grout vents originated from the top of each anchor head, as shown in Figure 3.22 (B), and extended through the top of the girder, shown in Figure 3.22 (C). To prepare the vents for grouting, brass shut-off valves were installed at all exits, and the grout vents
57
extending through the top of the girder were supported to prevent the hose from kinking, as shown in Figure 3.22 (C). Finally, the vents extending through the top of the girder were connected to the grout plant by a series of two pressure gauges and an additional shut-off valve, as shown in Figure 3.22 (D).
Figure 3.22: Grout vent connections
Prior to mixing, grout and water were weighed out in the correct proportions specified by
the grout manufacturer. Due to mechanical problems with the grout plant’ mixing apparatus, the grout plant was used only for pumping and the grout mixing was performed in barrels with mixing heads attached to drills, as shown in Figure 3.23. The grout was mixed in three 50 lb. bag batches and tested by the modified flow cone test method (ASTM C939-modified) to ensure the grout efflux time was within the 5 to 15 seconds (a 5-30 second range is recommended by the Post-Tensioning Institute (PTI (2012)) §4.4.5)). If the grout did not meet the recommended flow rate, water was added and the process was repeated (as illustrated in Figure 3.23) until the grout reached the correct viscosity.
A B
C D
Grout cap and vent
Grout vent Grout vent
Grout vent from top of anchor head
Vent extending through top of girder Pressure gauges and shut-off at pump
Grout vent from anchor head
Connection to grout pump
58
Figure 3.23: Grout mixing procedure
Once the grout met the specified viscosity, equal samples from each batch were taken and
used to cast 2-inch cubes for future compression testing (in accordance with ASTM C109). Once the quality of the mixed grout was verified and compression samples were taken, the grouting of the tendon was performed by the procedure shown in Figure 3.24 and described in this section.
YES
mix
add
wat
er
test
meetsspecification?
NO
more water
to grout pump
59
Figure 3.24: Grout Pumping Procedure
(i) Priming the pump and pumping grout: Grout was manually poured into the grout hopper, as shown in Figure 3.24 (A), to prime the grout pump. Once the hopper had been filled, the pump was engaged and the hopper was monitored and refilled to ensure that fresh grout was always present. During this time, all grout not currently being pumped was slowly agitated to ensure it did not set.
(ii) Shutting grout vents: In accordance with the Post-Tensioning Institute “Specification for Grouting of Post-tensioned Structures” (PTI, 2012), all of the grout vent valves were open during initial grout pumping. The grout vents were closed in succession when 2 gallons of grout was expelled, as shown in Figure 3.24 (B).
(iii) Checking for Leaks: Immediately after the final grout vent was closed, the grout inlet port was sealed and the pump was powered down. With this valve closed the pressure gauge (shown in Figure 3.24 (C)) was monitored for any loss of pressure, i.e. a leak in the system.
A B
C D
Checking for leaks (no pressure drop)
Closing vents after 2 gal. grout expelledPriming pump by filling grout hopper
Grout inlet closed
Hose connected to pump for cleaning
60
(iv) Sealing grout system for curing: Once the system had been checked for leaks the final shut-off valve was closed and the grout plant was detached from the grout vent. The grout plant was then cleaned and the grouted duct left to cure (shown in Figure 3.24 (D)).
3.3.4 Deck Placement
After the test specimens had been grouted, an 8-inch-thick deck was placed to increase moment capacity and to provide test conditions that reflect field conditions more closely. This deck was two inches narrower than the top flange of the girder, as shown in Figure 3.25, to ease formwork construction. The concrete used for the deck was sourced from a local ready-mix concrete supplier. The concrete material properties for the deck can be found in Section 3.2.3.
Figure 3.25: Deck Dimensions (consistent dimensions not shown)
3.3.5 Vibrating Wire Gauge Installation and Usage
Vibrating wire gauges (VWG) (shown in Figure 3.26) were the only internal instrumentation used during the testing program. This type of gauge has the advantage of not requiring continuous monitoring (as is common with many other strain gauges), as well as being able to monitor the internal temperature of the girder by the use of an internal thermocouple. These VWGs were used to monitor the pretensioning losses due to elastic shortening, creep, and shrinkage between the time of prestress transfer and the time of testing. They were also used to monitor the post-tensioning force applied to the girder, and, more importantly, to calculate the set-loss of the post-tensioning strands after the post-tensioning operation was completed. Because VWGs measure strains, they are unable to capture relaxation losses; these losses are
7”
42”
Tx62 - 1 to 5
7” 9”
44”
40”8” 42”
Tx62 - 6 & 7
61
small in magnitude and can be accurately estimated using AASHTO (2013) prestress loss calculation methods.
Figure 3.26: Vibrating Wire Gauge Attached to Top Strands
Three gauges, located at mid-span and spaced vertically, were used for the prestressing
loss measurements. A “zero” reading was taken immediately before the pretensioning strands were released, but after the side forms were removed. After the gang stressing plate was fully retracted and the strands were flame cut to remove any residual tension, additional readings were taken, which, when processed, revealed the immediate prestress losses. Readings were also taken both before and after the girder was post-tensioned to account for any prestress losses that occurred as a result of the elastic shortening during the post-tensioning process.
VWG data requires little post-processing to convert measured micro-strain output to prestress loss. A temperature correction is required to normalize strain readings for varying temperatures the girder experiences throughout a day (Gallardo, 2014). The corrected strains were then applied in the manner shown in Figure 3.27 to find the strain at the centroid of the prestressing steel in question. The stress at the centroid of the prestressing steel was then found by multiplying this strain by the elastic modulus of the prestressing strand and subtracting the initial “jacking” stress (measured by the precaster at approximately 202.5 ksi).
The primary difference between the calculations for determining the pretensioning losses and the calculations for determining the post-tensioning force applied to the girder is that the stress in the pretensioned strands are assumed to initially be 202.5 ksi (0.75fpu). In the case of the post-tensioning the applied force must be directly calculated as a result of the strains experienced by the three vibrating wire gauges located at the mid-span of the girder. In order to accurately calculate this value the elastic modulus of the girder concrete must first be tested (in accordance to ASTM C469) and used in the equation as explained in Figure 3.28.
62
Figure 3.27: Explanation of VWG Calculation for Prestress Losses (Gallardo, 2014)
Figure 3.28: Explanation of Calculation for Post-Tensioning Force (Gallardo, 2014)
Compression
Embedded VWGs
yp tension zone
yp post-tensioned
yp top strand
Compression
∆ ∗
stra
in fr
om
pret
ensi
onin
g
∆ ∗
∆ ∗
∆ ∗
∗ ∗ ∆ ∗
63
3.4 Specimen Testing and Protocol
All girders were tested to failure in shear at the FSEL. The test specimens were designed to accommodate two shear tests per specimen, but in several cases the damage incurred during the first test proved too extensive to perform a subsequent test. Therefore, eleven shear tests were successfully performed on seven test specimens over the course of this experimental program. The layout, instrumentation, and loading procedures for the shear testing of these girders is described in the following sections.
3.4.1 Shear Span and Loading Configuration
All girder end-regions contained two 7.5-foot long thickened end-blocks. It was important that a significant portion of the shear span be outside of the thickened end-block region so that the capacity of the thinner (weaker) section of girder could be evaluated. The second major consideration was the weight of the girder. Once the deck was placed on the girder the weight of the girder (78-kips) was too great to be lifted with the two overhead cranes available at FSEL. Since two tests were expected out of every girder it was important that the specimen configuration was such that it did not require lifting between two successive tests. After all of these items were considered the final configuration decided on was a shear span of 14.25 feet and a back span of 20 feet, as shown in Figure 3.30. The 14.25-foot shear span yields a shear span-to-depth ratio of 3.0 for all girders with the exception of the control specimen (Tx62-3) for which the shear span-to-depth ratio was 2.7. In this context, it is important to appreciate that in testing the control specimen the same shear span used in testing other specimens was used but lack of post-tensing reinforcement changed the center of gravity of the strands by resulting in an increased dp. After testing the first girder, this layout was modified slightly by increasing the back span to 22 feet but keeping the shear span at the original 14.25 feet. This configuration (shown in Figure 3.29 and Figure 3.30) was maintained throughout the remaining ten tests and allowed for the second test region to remain undamaged during the first test by overhanging it over the far support.
Figure 3.29: 2,000-kip Load Frame
64
Figure 3.30: Shear Test Span Layout
3.4.2 Shear Test Instrumentation
Several types of external instrumentation used during testing included: linear potentiometers, pressure transducers, and load cells in various configurations. The VWG were not monitored during shear testing, but a single reading was taken prior to the first test to determine the amount of prestressing force on the girder (as discussed in Section 3.3.5).
Four 1,000-kip load cells were used to measure the load flowing through each support (as shown in Figure 3.31). To ensure accuracy, load readings were taken at the time a test specimen was lowered onto the support (dead load of the test specimen), when the load frame (shown in Figure 3.31) was placed on the girder (dead load of load frame), and continuously during shear testing (applied load). Because these force measurements were being taken from the support by the load-cells it was possible to accurately determine the shear loads applied to each girder end, and therefore accurately determine the total shear force acting on the girder during testing. In addition to the load cell readings a pressure transducer was used to confirm the applied load during shear testing, as noted in Figure 3.31.
Second Test
14’ - 3” 22’ - 0”9” 13’ - 0”Tx62-1(N): 20’ - 0”
First Test
(test span) (back span)
14’ - 3”22’ - 0” 9”13’ - 0”
(test span)(back span)
overhang majority of damaged region
65
Figure 3.31: Load Frame Instrumentation
2- and 4-inch linear potentiometers were used to measure the deflection of the girder at
the supports and load point, as shown in Figure 3.31. The load point deflection experienced by the test specimen was calculated by subtracting out the deflection of the supports, due to compression of the elastomeric bearing pads, relative to the deflection of the beam at the load point.
Since an out-of-plane splitting failure mechanism was observed during panel testing at the location of the post-tensioning duct. A measurement system was devised to investigate if the same behavior was going to occur in the full-scale girder tests. These measurements were taken in three locations on each side of the beam with 2-inch linear potentiometers mounted in the frame shown in Figure 3.32. The measurements taken from these six potentiometers were then used (as shown in Figure 3.33) to find the total expansion, within the web, at the duct level relative to the top and bottom potentiometer locations.
shear at supports measured directly by load-cells
linear - potentiometers measure deflection at supports and at load
pressure-transducer connected to hydraulic ram measures applied load
66
Figure 3.32: Web Expansion Measurement System
Figure 3.33: Web Expansion at Duct Level Calculation
6”
6”
,
OriginalWidth
Ref
eren
ce P
lane
Ref
eren
ce P
lane
67
3.4.3 Loading Procedure
During all tests the beam specimens were loaded until shear failure occurred. This load was applied using the 2,000-kip load frame, as shown in Figure 3.34 (A). Load was applied in 50-kip increments until first cracking was observed. For girders with a post-tensioning duct, first cracking occurred in two stages: the first being a shear crack at the duct location, the second being a shear crack extending the full depth of the web. After first cracking was observed, the girders were loaded in 75-kip increments. Between each load increment the girder webs were visually inspected for crack growth and cracks were marked with felt-tipped permanent markers, as shown in Figure 3.34 (B).
Figure 3.34: Cracks Marked with Felt Tip Marker
3.5 Test Specimen Details
A summary of the details of the experimental study described in this chapter are provided in Table 3.5 and Table 3.6. The variables used in these tables are described as follows:
Øduct = The nominal diameter of the post-tensioning duct. (inches)
bw = The gross web width of the test specimen. (inches)
ρv = The transverse reinforcement ratio as calculated by: /
fvy = The measured yield strength of the transverse reinforcement. (ksi)
f'c = The compressive strength of the concrete or grout at the time of testing. (ksi)
f't = The split-cylinder (tensile) strength of the specimen. (ksi)
Aps = The area of the prestressed reinforcement. (inches)
Stress = The stress in the prestressed reinforcement measured at the time of testing by VWGs as described in Section 3.3.5.
Table 3.5: Summary of Test Specimen Details (Part 1 of 2)
In order to meet the objective of this experimental study, seven full scale Tx62 bulb-tee test specimens were constructed at a fabrication plant, and eleven shear tests were performed on these specimens at FSEL. The primary variables under investigation were the transverse reinforcement ratio, the duct diameter-to-web width ratio, and the duct material. The information on their construction and their material properties has been provided within this chapter. The following chapters provide the results and conclusions that were reached as a result of the tests performed on these test specimens.
71
Chapter 4. Experimental Results & Observations
4.1 Introduction
During the course of this experimental program, eleven shear tests were performed on seven prestressed concrete girders. Of these, ten tests were conducted on specimens that contained a post-tensioning duct within their web and additional pretensioning reinforcement in their bottom and top flanges. The remaining shear test was conducted on a control specimen that did not have a post-tensioning duct but contained the same pretensioning reinforcement as many of the post-tensioned specimens. This chapter presents the behavioral characteristics of these eleven test specimens at service level loads and at their ultimate state as they relate to the five primary variables discussed in Chapter 3:
(i) Presence of a post-tensioning duct (ii) Post-tensioning duct material (plastic or steel) (iii) Web-width (iv) Duct Diameter (v) Transverse Reinforcement Ratio
4.2 Summary of Service Level Shear Behavior
Service level shear behavior is defined in this report as the early cracking behavior of a prestressed concrete specimen at shear forces of approximately 50 percent of the ultimate capacity of the specimen. This definition of service level shear force follows a similar approach to that given in Birrcher, et al. (2009) which relates the experimental ultimate shear capacity to the nominal capacity of a section as described in Figure 4.1
Figure 4.1: Service Level Load as a Function of Vtest (Birrcher, et al., 2009)
L L = 0.25(Service Load)• Vtest/Vn = 1.27 (Table 4.2)
∗ϕη
11.27
∗0.91.4
0.5
η
72
As shown in Figure 4.1, the load factor design equation of AASHTO (2013) can be written such that the ratio of the shear resistance factor (ϕ) to the load factor (η) is equal to the ratio of the service level loads to the nominal shear capacity. This relationship, and the assumption listed in Figure 4.1, can be used to calculate the ratio of the service level shear force to the experimental shear capacity (Vservice/Vtest) as approximately 0.5. It should be clear that several assumptions are necessary to calculate this value and that a change in any of these assumptions can alter this ratio. Therefore, this definition should be seen as a description of service level loads and not a limit of any kind. In this chapter the discussion of service level loads covers shear cracking behaviors occurring at loads of between 29 and 75 percent of ultimate in an effort to cover all relevant behavior prior to that at ultimate shear capacity.
Two types of service level cracks were observed during this experimental program. First, all post-tensioned girder specimens experienced diagonal hairline cracks located in the vicinity of the duct that occurred at a shear force of (VLC). The second set of service level shear cracks covered the full-depth of the web (full-depth cracking) and were consistent with the first cracking behavior of pretensioned girders loaded in shear (Avendaño & Bayrak, 2008). These full-depth cracks were seen in the post-tensioned specimens and in the pretensioned control specimen and occurred at a shear force of (VFD). These two distinct cracking patterns are illustrated in Figure 4.2, and the shear forces corresponding to these two crack types are given in Table 4.1 for all test specimens. The effects of the primary experimental variables on the service level shear behavior are discussed within Sections 4.4 through 4.7.
73
Figure 4.2: Service Level Shear Cracking Behavior (showing Tx62-4(S))
Duct Location
(A) Localized diagonal cracks along post-tensioning duct occur at shear force (VLC)
(B) Full-depth cracks occur at shear force (VFD)
Load
Support
Load
Support
Table 4.1: Localized Cracks at Duct Documented at a Shear Force of VLC
Test Specimen
DuctMaterial
DuctDiameter
bw
(inches)
Web Width
(inches)ρv fyv
(ksi)
Localized Cracking at Duct (VLC)
Full-Depth Cracking(VFD)
VLC
(kips)VFD
(kips)
Tx62-1(S) Plastic
3 7 0.43
0.638 196 0.29 371 0.54
Tx62-2(S) Steel 0.650 272 0.33 478 0.59
Tx62-2(N) Steel 0.650 286 0.38 476 0.64
Tx62-3(S) No Duct 0.642 -- 404 0.41
Tx62-4(S) Steel 0.950 364 0.44 546 0.66
Tx62-4(N) Plastic 0.950 281 0.34 539 0.65
Tx62-5(S) Plastic 0.214 272 0.39 469 0.67
Tx62-5(N) Steel 0.214 331 0.45 452 0.61
Tx62-6(S) Plastic4
90.44
0.854 319 0.34 699 0.75
Tx62-6(N) Steel 0.854 315 0.29 669 0.61
Tx62-7(S) Steel 3 0.33 0.862 411 0.35 600 0.51
*Vtest is the ultimate tested shear strength of the girder including the dead load as described in Section 4.3.3
74
75
4.3 Summary of Strength Data
All specimens fabricated during this experimental program were loaded in shear as described in Chapter 3 until they reached shear failure. This section summarizes the results of this experimental program in relation to the ultimate shear capacities of all test specimens.
4.3.1 Web Expansion Measurements
As discussed in Section 3.4.2, linear potentiometers were used to measure the out-of-plane expansion of each test specimen web at the centroid of the post-tensioning duct. The localized out-of-plane expansion at the duct level was determined by subtracting expansion measurements taken six inches above and below the duct centroid. This localized expansion was measured as a means of detecting and monitoring a splitting failure of the concrete in the direct vicinity of the duct. This splitting mechanism has its basis in the small scale panel testing which is discussed in Chapter 2 and is covered in more detail in Appendix A. The splitting failure mechanism assumes that the webs of a test specimen will split out of the plane of the web as the compressive stresses flow out and around the post-tensioning duct. No splitting failure mechanism was explicitly witnessed during the girder testing program, but the web expansion measurements did prove useful in confirming the visual confirmations of service level cracking. The web expansion measurements of all test specimens are shown in Figure 4.3 through Figure 4.5 with the exception of the measurements from Tx62-1(S) which was tested before the web expansion measurement system was implemented. The service level cracking loads (VLC and VFD) are denoted in each figure.
76
Figure 4.3: Web Expansion Measurements taken at mid-height of the web corresponding with the Height of the Post-Tensioning Duct where applicable (Part 1 of 3)
(an explanation of the web expansion measurements is provided in section 3.4.2)
Øduct/bw = 3”/7” = 0.43
ρv fy = 0.650 ksi
0%
20%
40%
60%
80%
100%
-0.015 -0.01 -0.005 0 0.005 0.01 0.015 0.02 0.025
Per
cen
tage
of F
ailu
re S
hea
r F
orc
e
Expansion at Center of Duct (in)
Tx62-2N: Steel Duct
Tx62-2S: Steel Duct
Visual Identification Local Cracking at Duct
Visual Identification of Full Depth Cracks
0%
20%
40%
60%
80%
100%
-0.015 -0.005 0.005 0.015 0.025
Per
cen
tage
of F
ailu
re S
hea
r F
orc
e
Expansion at Center of Duct (in)
Tx62-3S: Control
no duct control specimen
ρv fy = 0.642ksi
**the negative expansion measurement shown here is explained in Section 4.4.3
77
Figure 4.4: Web Expansion Measurements taken at mid-height of the web corresponding with the Height of the Post-Tensioning Duct where applicable (Part 2 of 3)
(an explanation of the web expansion measurements is provided in section 3.4.2)
Visual Identification Local Cracking at Duct
Visual Identification of Full Depth Cracks
Øduct/bw = 3”/7” = 0.43
ρv fy = 0.950 ksi
0%
20%
40%
60%
80%
100%
-0.015 -0.01 -0.005 0 0.005 0.01 0.015 0.02 0.025
Per
cen
tage
of F
ailu
re S
hea
r F
orc
e
Expansion at Center of Duct (in)
Tx62-4N: Plastic Duct
Tx62-4S: Steel Duct
Øduct/bw = 3”/7” = 0.43
ρv fy = 0.214 ksi
0%
20%
40%
60%
80%
100%
-0.015 -0.01 -0.005 0 0.005 0.01 0.015 0.02 0.025
Per
cen
tage
of F
ailu
re S
hea
r F
orc
e
Expansion at Center of Duct (in)
Tx62-5S: Plastic Duct
Tx62-5N: Steel Duct
78
Figure 4.5: Web Expansion Measurements taken at mid-height of the web corresponding with the Height of the Post-Tensioning Duct where applicable (Part 3 of 3)
(an explanation of the web expansion measurements is provided in section 3.4.2)
Visual Identification Local Cracking at Duct
Visual Identification of Full Depth Cracks
Øduct/bw = 4”/9” = 0.44
ρv fy = 0.854 ksi
0%
20%
40%
60%
80%
100%
-0.015 -0.01 -0.005 0 0.005 0.01 0.015 0.02 0.025
Per
cen
tage
of F
ailu
re S
hea
r F
orc
e
Expansion at Center of Duct (in)
Tx62-6N: Steel Duct
Tx62-6S: Plastic Duct
Øduct/bw = 3”/9” = 0.33
ρv fy = 0.862 ksi
0%
20%
40%
60%
80%
100%
-0.015 -0.01 -0.005 0 0.005 0.01 0.015 0.02 0.025
Per
cen
tage
of F
ailu
re S
hea
r F
orc
e
Expansion at Center of Duct (in)
Tx62-7S: Steel Duct
79
4.3.2 Shear-Compression Failure Mechanism
The failure mechanism observed in all of the test specimens was characterized by shear-compression failure of the web concrete. For the ten tests performed on the post-tensioned specimens this crushing occurred in the vicinity of the post-tensioning duct, while for the control specimen it occurred over the full-depth of the web. The differences between these failure mechanisms as it pertains to the first primary experimental variable (duct presence) are discussed in detail in Section 4.4.
After initial shear-compression failure occurred, the specimens could no longer sustain the ultimate load and, although additional displacement was applied, the girders never again reached the maximum shear force applied at the time of crushing. The failure cracks of all post-tensioned specimens are shown in Figure 4.6 through Figure 4.8. The cracks which caused concrete spalling at the time that the ultimate shear force was applied are shown in red in Figure 4.6 through Figure 4.8 and referred to as the “primary failure cracks”. The average angle for the primary failure cracks are denoted below each figure.
Figure 4.6: Failure Mechanisms of Test Specimens Primary Failure Cracks in Red (Part 1 of 3)
Duct Location
Tx62‐2(N)
°
19”
Duct Location
Tx62‐1(S)
°
14”
No DuctControl Specimen
Tx62‐3(S)
°
13”
Duct Location
Tx62‐2(S)
°
11”
80
Figure 4.7: Failure Mechanisms of Test Specimens Primary Failure Cracks in Red (Part 2 of 3)
Duct Location
Tx62‐4(N)
°
Duct Location
Tx62‐5(S)
°
Duct Location
Tx62‐4(S)
°
Duct Location
Tx62‐5(N)
°
12” 21”
24” 16”
81
Figure 4.8: Failure Mechanisms of Test Specimens Primary Failure Cracks in Red (Part 3 of 3)
Duct Location
Tx62‐6(S)
Duct Location
Tx62‐6(N)
Duct Location
Tx62‐7(S)
°
°
°
28” 21”
26”
82
82
83
4.3.3 Critical Section and Calculation of Shear Force at Ultimate State
The total shear force that the girder experienced during testing consisted of three components: girder self-weight, load frame self-weight, and applied load. As was discussed in Chapter 3, these forces were measured by load cells at each support. While the load readings at the support were measured, additional calculations were needed to determine the shear force at the critical section. Determination of the location of the critical section was made more complicated by the thickened end-block and the taper to the standard cross-section. The shear force diagram shown in Figure 4.9 was used to calculate the shear force at the critical section. The critical section was taken at the maximum of the location according to AASHTO (2013) or the termination of the end-block (Equation 4.1). The location at the termination of the end-block controlled the critical section for all test specimens. This location is reasonably close to the location of the failure cracks shown in Figure 4.6 through Figure 4.8.
The weight of the load frame and the applied load were both taken as point loads. In summary, the shear force at failure can be calculated as the sum of the shear force due to the self-weight of the girder at the critical section, the weight of the load frame transmitted through the “test-region” side support, and the maximum applied load transmitted to the support during testing.
Figure 4.9: Shear Force Diagram and Explanation of Critical Section (not to scale)
Applied ShearShear Span (a)
Back Span Overhang
Shear from Load Frame (L.F.)Self Weight
(S.W.)
L.F.
S.W.
AppliedShear
S.W.
critical section at xcrit from support: taken as
maximum of that calculated in accordance with
AASHTO (2013) or end of the end-block transition
Criti
cal S
ectio
n
84
. Equation 4.1
where: xcrit The distance from the center of the support to the critical section.
(inches) lbp = The length of the bearing pad in the direction of the shear span.
(inches) dv = The effective shear depth of the girder taken in accordance with
AASHTO (2013) (inches) θ = Angle of the principle diagonal compressive stress with respect to the
longitudinal axis of the member taken in accordance with AASHTO (2013)
xeb = The distance from the center of the “test-region” side support to the termination of the end-block taper. (inches)
4.3.4 Load-Deflection Behavior
As shown in Figure 4.10, many post-tensioned girders exhibited some level of residual strength after the peak load was reached. To ensure that two tests were possible for each girder, the first test was halted after the initial crushing of the concrete was visible at the vicinity of the post-tensioning duct and the ultimate applied load had dropped as a result of this crushing failure (Figure 4.10(A)). When testing the second half of the girder (as described in Chapter 3), the beams were subjected to additional displacements until the residual strength (Figure 4.10(B)) of the girder had been exhausted (Figure 4.10(C)). The load-deflection plots of all specimens tested during this study are shown in Figure 4.11 and Figure 4.12.
Figure 4.10: Shear Force - Deflection Plot of Tx62-2N
*shear force includes dead load at critical section see section 4.3.3 for an explanation
0
200
400
600
800
1000
1200
0 0.25 0.5 0.75 1 1.25 1.5
Sh
ear
Fo
rce
(kip
s)*
Deflection at Load Point (in)
Tx62-2N-Steel DuctØduct/bw = 3”/7” = 0.43
ρv fy = 0.650 ksi
(A) Peak Loadweb concrete
crushes at duct
(B) Residual Capacityadditional displacement
at constant load
(C) Loss of Residual Capacity
85
Figure 4.11: Load – Deflection Plots of all Test Specimens (Part 1 of 2)
*shear force includes dead load at critical section see section 4.3.3 for an explanation
0
200
400
600
800
1000
1200
0 0.5 1 1.5 2 2.5
Sh
ear
Fo
rce*
(ki
ps)
Deflection at Load Point (in)
0
200
400
600
800
1000
1200
0 0.5 1 1.5 2 2.5
Sh
ear
Fo
rce*
(ki
ps)
Deflection at Load Point (in)
(A) Load – Deflection Plot of Tx62-1(S) (B) Load – Deflection Plot of Tx62-2(S)
(C) Load – Deflection Plot of Tx62-2(N) (D) Load – Deflection Plot of Tx62-3(S)
(E) Load – Deflection Plot of Tx62-4(S) (F) Load – Deflection Plot of Tx62-4(N)
0
200
400
600
800
1000
1200
0 0.5 1 1.5 2 2.5
Sh
ear
Fo
rce*
(ki
ps)
Deflection at Load Point (in)
0
200
400
600
800
1000
1200
0 0.5 1 1.5 2 2.5
Sh
ear
Fo
rce*
(ki
ps)
Deflection at Load Point (in)
0
200
400
600
800
1000
1200
0 0.5 1 1.5 2 2.5
Sh
ear
Fo
rce*
(ki
ps)
Deflection at Load Point (in)
0
200
400
600
800
1000
1200
0 0.5 1 1.5 2 2.5
Sh
ear
Fo
rce*
(ki
ps)
Deflection at Load Point (in)
Tx62-1(S)Ø/b = 0.43
ρvfy = 0.638 ksi
Tx62-2(N)Ø/b = 0.43
ρvfy = 0.650 ksi
Tx62-4(S)Ø/b = 0.43ρvfy = 0.950
Tx62-2(S)Ø/b = 0.43
ρvfy = 0.650 ksi
Tx62-3(S)control
ρvfy = 0.642 ksi
Tx62-4(N)Ø/b = 0.43ρvfy = 0.950
86
Figure 4.12: Load – Deflection Plots of all Test Specimens (Part 2 of 2)
*shear force includes dead load at critical section see section 4.3.3 for an explanation
(G) Load – Deflection Plot of Tx62-5(S) (H) Load – Deflection Plot of Tx62-5(N)
(I) Load – Deflection Plot of Tx62-6(S) (J) Load – Deflection Plot of Tx62-6(N)
(K) Load – Deflection Plot of Tx62-7(S)
0
200
400
600
800
1000
1200
0 0.5 1 1.5 2 2.5
Sh
ear
Fo
rce*
(ki
ps)
Deflection at Load Point (in)
0
200
400
600
800
1000
1200
0 0.5 1 1.5 2 2.5
Sh
ear
Fo
rce*
(ki
ps)
Deflection at Load Point (in)
0
200
400
600
800
1000
1200
0 0.5 1 1.5 2 2.5
Sh
ear
Fo
rce*
(ki
ps)
Deflection at Load Point (in)
0
200
400
600
800
1000
1200
0 0.5 1 1.5 2 2.5
Sh
ear
Fo
rce*
(ki
ps)
Deflection at Load Point (in)
0
200
400
600
800
1000
1200
0 0.5 1 1.5 2 2.5
Sh
ear
Fo
rce*
(ki
ps)
Deflection at Load Point (in)
Tx62-5(S)Ø/b = 0.43
ρvfy = 0.638 ksi
Tx62-6(S)Ø/b = 0.43
ρvfy = 0.650 ksi
Tx62-4(S)Ø/b = 0.43ρvfy = 0.950
Tx62-5(N)Ø/b = 0.43
ρvfy = 0.650 ksi
Tx62-3(S)control
ρvfy = 0.642 ksi
87
4.3.5 Average Shear Stress at Ultimate
The average shear stress calculation used in this chapter is described by Equation 2.8 and Figure 4.13. The approach taken in Figure 4.13 implies that the average shear stress at ultimate state is primarily carried by the web (bwdv) and that the vertical component of post-tensioning force (Vp) contributes to the shear stress by reducing the applied shear force (Vtest). All specimens tested in this study, with the exception of the control specimen, had a post-tensioning tendon profile with a constant eccentricity and zero slope. Conversely, it is important to appreciate the fact that Vp was not zero for some specimens included in the Evaluation Database for Post-Tensioned Girders.
Figure 4.13: Calculation of Ultimate (Tested) Shear Stress
Equation 4.2
where: Vtest = The maximum shear force carried by specimen. (kips)
Vp = The vertical component of the prestressing force. (kips)
bw = The gross web width of specimen(inches)
dv = Effective shear depth measured perpendicular to the neutral axis between the compressive and tensile resultants due to flexure, but not to be taken as less than the greater of 0.9*(transformed steel area’s depth) or 0.72h.(inches)
τ
τtest
τtestactual shear stress distribution
88
It is beneficial to normalize the shear stress of these specimens by some function of the concrete strength before examining the effects of other variables. The two most common methods for normalizing the ultimate shear stress are by the concrete strength (typically done for shear-compression failures) or the square root of the compressive strength (typically for sectional-shear type failures) (Birrcher, et al., 2009). As AASHTO (2013) utilizes both values in various provisions of shear design, both could be considered relevant methods for normalizing the stress. Normalization by the concrete strength was chosen for use here because of the relevance to the 0.25f’c maximum shear stress limit on calculated shear stress imposed by §5.8.3.3 of AASHTO (2013) for the General Shear Procedure. The purpose of this limit is to prevent the web concrete from crushing before the transverse reinforcement can fully yield; therefore, the relationship of the tested shear stress capacity to this limit was deemed to be a relevant variable and more useful than normalizing by the square root of the concrete strength. It is also important to recognize that this decision is consistent with the principles on which the Modified Compression Field Theory is founded. The relationship of the normalized ultimate shear stress is shown in relation to the concrete compressive strength in Figure 4.14.
Figure 4.14: Normalized Ultimate Shear Stress vs. Concrete Compressive Strength
4.3.6 Comparison of Tested Capacities to Shear Design Procedure Calculations
The tested shear capacities of the Tx62 test specimens are compared to four shear design procedures from ACI 318-11 and AASHTO (2013) in Table 4.2. As shown in Table 4.2, the General Procedure of §5.8.2.9 of AASHTO (2013) results in the lowest mean and standard deviation when the calculated capacity is compared to the tested capacity (Vtest/Vn). This topic is discussed in more detail in Chapter 5 with the analysis of the Evaluation Database for Post-Tensioned Girders and the full calculations for the shear strengths of all test specimens are given in Appendix C.
0
0.05
0.1
0.15
0.2
0.25
10 10.5 11 11.5 12 12.5 13 13.5 14f‘c (ksi)
/
Tx62‐3 Control Test‐‐no duct‐‐
Tx62 Plastic PT DuctsØduct/bw= 0.43 to 0.44
Tx62‐7 Steel PT DuctØduct/bw= 0.33
Tx62 Steel PT DuctsØduct/bw= 0.43 to 0.44
Table 4.2: Tx62 Test Result Summary and Shear Strength Calculations for AASHTO (2013) and ACI 318-11
The purpose of this test variable was to evaluate the differences in shear behavior seen between the tests performed on Tx62-3(S) which did not have a post-tensioning tendon (hereafter the “control specimen”) and the ten post-tensioned specimens. These differences are explained within this section.
4.4.1 Service Level Shear Behavior
The location of the first diagonal shear cracks that appeared in the test specimens were dependent on the presence of a post-tensioning duct. For the control specimen the first diagonal cracks occurred in the upper half of the web and expanded to fill the remainder of the web as the load was increased. For this girder the initial service level cracking happened at a shear force of VFD, these cracks are shown in Figure 4.15(A). All post-tensioned specimens exhibited first diagonal cracks in the vicinity of the post-tensioning duct at a shear force of VLC, as shown in Figure 4.15(B). The localized cracking in the vicinity of the duct occurred at approximately the same percentage of the ultimate shear strength that the full-depth cracking occurred in the control test specimen, as shown in Table 4.3. The values for the service level cracking shears forces (VLC and VFD) can be found for all test specimens in Table 4.1 of Section 4.2.
Figure 4.15: Differences Observed between Control Specimen and Post-Tensioned Specimens at
Service Level Loads (VLC and VFD)
Duct Location
Area Shown
(A) Tx62-3(S): Control GirderFirst Cracking at VFD= 0.41Vtest
(B) Tx62-4(S): Steel DuctFirst Cracking at VLC = 0.44Vtest
91
Table 4.3: Service Level Cracking for Post-Tensioned and Control Specimens
4.4.2 Shear Failure Mechanism
All specimens tested during this experimental program failed due to the crushing of the compression field in the web of the specimen, commonly referred to as a shear-compression failure mechanism. Although both the control and the post-tensioned specimens failed in this manner the following two sections highlight the differences between these two failure mechanisms in regard to the location of this crushing failure. Shear-Compression Failure in Control Specimen
The control specimen (Tx62-3) was flexurally reinforced with 66 - 0.5-in. diameter pretensioned strands in the bottom flange and 4 – 0.5-in. diameter strands in the top flange (i.e. it did not have a post-tensioning duct). This girder was designed to provide a direct comparison between the shear behavior of a post-tensioned girder (with a duct in the web region) and that of a pretensioned girder. The failure mechanism of this girder was the crushing of the diagonal stress field through the full-depth of the web. The moment of failure was captured with a pair of high-definition video cameras, as shown in Figure 4.16 (the time lapse between photos (A) and (B) is approximately 0.1 second). The initial crushing of the web concrete at the base of the primary diagonal strut near the beginning of the end-block transition can be seen in Figure 4.16(A) while the moment of failure (as the entire web of the girder crushes) is shown in Figure 4.16(B). The girder is shown post-failure in Figure 4.17.
Control Specimen Mean of all Post-Tensioned Specimens
n = 1 test n = 10 tests
Tx62-3(S) -- 0.41 Mean 0.36 0.63
Figure 4.16: High-Speed Footage of Failure of Control Specimen, time lapse between (A) & (B) approximately 0.1 sec.
(B) Control Specimen (Tx62-3(S)): Immediately After Shear-Compression Failure
(A) Control Specimen (Tx62-3(S)): Immediately Prior to Shear-Compression Failure
West View East View
West View East View
Load
Support
Support
Load
Load
Support
Support
Load
Initial Crushing Failure
92
93
Figure 4.17: Failure of Control Specimen, Tx62-3(S)
4.4.3 Shear-Compression Failure at Duct of Post-Tensioned Girders
The shear failures of post-tensioned test specimens were controlled by the crushing of web concrete in the vicinity of the post-tensioning duct; an example of this failure type is shown in Figure 4.18. This failure occurred at distances ranging from 11-inches to 28-inches from the beginning of the end-block transition zone, and was always concentrated at the height of the duct. After initial shear-compression failure occurred, the specimens could no longer sustain the ultimate load and, although additional displacement was applied, the girders never again reached the maximum shear loads that were applied at the time of crushing.
Figure 4.18: Crushing at Post-Tensioning Duct at Ultimate Capacity
Load
Support
Tx62-4S
Primary Failure due to Crushing at PT Duct
Support
Load
Duct Location
94
The residual capacity described by Figure 4.10, was a result of the web concrete crushing and shearing along the plane of the post-tensioning duct, a mechanism typically referred to as horizontal shear. The differential displacement of the concrete above and below the duct (shown in Figure 4.19) was restrained by the thickened end-block. The residual strength of the girder was dependent on the structural integrity of the concrete at this interface between the end-block and the web. Once the end-block interface region was crushed all residual strength was lost, as shown in Figure 4.20.
Figure 4.19: Horizontal Displacement between the Top and Bottom of the Duct
Figure 4.20: Failed Girder after Residual Strength has been Lost
4.4.4 Web Expansion Measurements
The web-expansion measurements were taken at the mid-height of the web. For the post-tensioned girders this corresponded to the location of the post-tensioning duct while for the control girder this location had no significance. The differences between the web expansion measurements of the control specimen and all post-tensioned specimens, are shown in Figure 4.3 through Figure 4.5. Although no discernable splitting failure mechanism was witnessed during testing, all post-tensioned girders experienced expansion out of the plane of the web at the location of the post-tensioning duct. The control girder, shown in Figure 4.21, experienced
Tx62-4SSupport
Load
horizontal shearing along duct occurs after peak load is reached
Tx62-4S
concrete crushing at end-block transition
primary failure due to crushing at PT duct
Load
Support
Load
Duct Location
95
negative expansion which indicates that the web was expanding at a location other than the mid-height. As described in Figure 4.22, the web was expanding at a height of 6-inches above the web mid-height relative to the middle and bottom deflection measurements taken as described in Section 3.4.2.
Figure 4.21: Mid-Height Web Expansion Measurement of Control Specimen
Figure 4.22: 6-inches above Mid-Height Web Expansion Measurement of Control
0%
20%
40%
60%
80%
100%
-0.015 0 0.015
Per
cen
tage
of F
ailu
re S
hear
Fo
rce
Relative Expansion at Mid-Height of Web (in)
Mid-Heightof Web
6”
6”
Negative RelativeExpansion
Relative Expansion 6-inches above Mid-Height of Web (in)
0%
20%
40%
60%
80%
100%
-0.015 0 0.015
Per
cen
tage
of
Fai
lure
Sh
ear
Fo
rce
Mid-Heightof Web
6”
6”
Positive RelativeExpansion
96
4.5 Post-Tensioning Duct Material (Plastic or Steel)
All codes that address a potential reduction in shear strength due to the presence of a post-tensioning duct do so by reducing the effective web width of a girder by a percentage of the duct diameter. Historically, this has been calibrated by small-scale panel testing programs. Panel testing assumes that the compressive strength of a panel with a duct could be compared to the compressive strength of a solid “control” panel. The ratio of the failure strengths of these two panel tests is referred to as “ηD”.
Prior to the beginning of the experimental testing of full-scale Tx62 specimens, 100 panels were tested in compression to study many different variables including the duct material. The findings of this study confirmed those of Muttoni, et al. (2006) who showed that the compressive strength of a panel specimen with a grouted plastic post-tensioning duct was significantly less than a comparable specimen with a grouted steel post-tensioning duct. The results of this testing program can be found in detail in Appendix A, and are summarized in Table 4.4.
Table 4.4: Summary of Panel Test Data from Muttoni et al. (2006) & Current Study
Grouted Plastic Post-Tensioning Ducts
Grouted Steel Post-Tensioning Ducts
Muttoni et. al. (2006)
n = 4 tests n = 4 tests
Current Study 7
n = 8 tests n = 7 tests
97
4.5.1 Service Level Shear Behavior
No differences were observed between grouted plastic and steel post-tensioning ducts under service level loads. Both the localized cracking in the vicinity of the post-tensioning duct (VLC) and the full depth cracking (VFD) occurred at approximately the same percent of the ultimate capacity for post-tensioned specimens regardless of their duct material type as shown in Table 4.5. = Table 4.5: Service Level Shear Behavior of Post-Tensioned Specimens
Test Specimens with Plastic Ducts Test Specimens with Steel Ducts
TestSpecimen
TestSpecimen
Tx62-1(S) 0.29 0.54 Tx62-2(S) 0.33 0.59
Tx62-4(N) 0.34 0.65 Tx62-2(N) 0.38 0.64
Tx62-5(S) 0.39 0.69 Tx62-4(S) 0.44 0.66
Tx62-6(S) 0.34 0.75 Tx62-5(N) 0.45 0.66
Mean 0.34 0.66 Tx62-6(N) 0.29 0.61
Tx62-7(S) 0.35 0.51
Mean 0.37 0.61
98
4.5.2 Shear Failure Mechanism
All post-tensioned specimens failed due to localized crushing of the web concrete in the direct vicinity of the post-tensioning duct. The duct material had no influence on this failure mechanism, as shown in Figure 4.23.
Figure 4.23: Effect of Post-Tensioning Duct Material on Failure Mechanism
Tx62-4(S)Steel Duct
primary failure due to crushing at PT duct
Load
Support
Load
Duct Location
primary failure due to crushing at PT ductSupport
Load
Tx62-4(N)Plastic Duct
99
4.5.3 Shear Stress at Failure
As is illustrated by Figure 4.24, the duct material had no effect on the shear stress carried by the girders at their ultimate state. The significance of this observation cannot be over-emphasized; as discussed in Chapter 2, the effective width of a girder web is reduced by 120 percent of the duct diameter for a grouted plastic duct in Eurocode2, compared to only a 50 percent duct diameter reduction for a grouted steel duct. This design provision has its basis in the small-scale panel testing programs, which have been used to calibrate the effective web width equations. As shown in Figure 4.24, the results of the present full-scale testing program did not substantiate these findings and show no difference in the ultimate shear stress carried by the girder specimens containing grouted plastic or steel post-tensioning ducts.
Figure 4.24: Effect of Duct Material on Normalized Shear Stress at Ultimate
only showing post-tensioned test specimens with Øduct/bw=0.43 to 0.44
4.6 Influence of Web Width and Duct Diameter
Although the duct material had no impact on the shear behavior of the test specimens, the web width and the duct diameter did play a role in the shear capacity of the specimens. Although the influence of a girder web width is well understood as it pertains to shear strength, the influence of the duct diameter and the corresponding duct diameter to web width has been less studied. This section addresses this behavior in light of the tests performed during this experimental program.
4.6.1 Service Level Shear Behavior
As can be observed from Table 4.6, localized cracking in the vicinity of the post-tensioning duct (VLC) occurred at approximately the same percentage of their ultimate capacity for all post-tensioned girders regardless of their web width or duct diameter-to-web width ratio. However, the test performed on Tx62-7(S) with a duct diameter-to-web width ratio of 0.33 did
Plastic PT Ducts Steel PT Ducts
Tx6
2-1(
S)
Tx6
2-4(
N)
Tx6
2-5(
S)
Tx6
2-6(
S)
Tx6
2-2(
N)
Tx6
2-2(
S)
Tx6
2-4(
S)
Tx6
2-5(
N)
Tx6
2-6(
N)
0
0.05
0.1
0.15
0.20.18
0.160.16 0.16 0.17
0.18
0.16 0.160.18
100
exhibit “full-depth” shear cracks at the lowest percentage of its ultimate capacity when compared to the other test specimens. Table 4.6: Effect of Web Width and Duct Diameter on the Service Level Behavior
4.6.2 Shear Failure Mechanism
The representation of the failure crack shown in Figure 4.8 indicates a significant level of crushing throughout the depth of the web for Tx62-7(S) which had a duct diameter-to-web width ratio of 0.33. This figure can be misleading, but the “primary failure cracks,” shown in red, are not. The initial failure of the Tx62-7(S) test specimen was caused by localized crushing in the vicinity of the post-tensioning duct. This failure mechanism was similar in nature to all other post-tensioned test specimens. The difference between the failure mechanism observed in Tx62-7(S) and the remaining nine post-tensioned test specimens was the speed at which the residual strength was lost. The image shown in Figure 4.25 was taken from a video of the shear failure of Tx62-7(S). Figure 4.25(A) shows the specimen at the moment that ultimate load was applied and the web concrete crushed in the direct vicinity of the post-tensioning duct while Figure 4.25(B) shows the same specimen 3 seconds after the initial failure. Therefore, the duct diameter-to-web width ratio is not thought to influence the shear failure mechanism of any of the post-tensioned girders tested, but did have the effect of minimizing the residual strength of the specimen, as discussed in Section 4.3.4.
Post-Tensioned Specimens(bw = 7-in. and Øduct /bw = 0.43)
Post-Tensioned Specimens(bw = 9-in. and Øduct /bw = 0.44)
Figure 4.25: Effect of Duct Diameter-to-Web Width on Shear Failure Mechanism
Support
Load
Support
Load
(A) Tx62-7(S) at Shear Failure
(B) Tx62-7(S) Three Seconds Post Shear Failure
102
4.6.3 Shear Stress at Failure
The duct diameter-to-web width ratio played a significant role in the shear stress carried by the test specimen at its ultimate state, as shown in Figure 4.26. The control specimen and the specimen that used the smallest duct diameter-to-web width ratio both carried a maximum shear stress of 0.20f’c. The remaining nine test specimens had approximately the same duct diameter-to-web width ratio (Øduct/bw = 0.43 to 0.44) and consistently carried ultimate shear stresses between 0.16f’c and 0.18f’c. Based on this information, the variable having the greatest influence on the ultimate shear stress carried by a test specimen was the duct diameter-to-web width ratio. Moreover, this behavior may also indicate that there is a distinct ratio at which the presence of a post-tensioning duct may result in a more significant strength reduction of a member, but more tests are needed to confirm this effect. This point is further discussed in Chapter 5 in light of additional test results from the Evaluation Database for Post-Tensioned Girders.
Figure 4.26: Normalized Ultimate Shear Stress vs. Duct Diameter-to-Web Width Ratio
4.7 Transverse Reinforcement Ratio
The amount of transverse reinforcement included within the web has been shown to have a large effect on the shear strength (Nakamura, et al., 2013). This reinforcement provides the ability for the concrete to transfer load across cracks and therefore dramatically improves the shear capacity of a girder. This section examines the effect of varying the transverse reinforcement ratio on the shear performance of the Tx62 specimens in relation to their shear behavior at service level and ultimate.
0
0.05
0.1
0.15
0.2
0.25
0 0.1 0.2 0.3 0.4 0.5Øduct / bw
/
Tx62‐3 Control Test‐‐no duct‐‐
Tx62 Plastic PT DuctsØduct/bw= 0.43 to 0.44
Tx62‐7 Steel PT DuctØduct/bw= 0.33
Tx62 Steel PT DuctsØduct/bw= 0.43 to 0.44
103
4.7.1 Service Level Behavior
The transverse reinforcement included in a specimen has little effect on the shear behavior of that specimen until significant cracking has occurred. Therefore, the transverse reinforcement ratio does not have an impact on the service level cracking behavior of the specimens, as can be observed in Figure 4.27.
Figure 4.27: Effect of Transverse Reinforcement on Service Level Shear Cracking
0
0.2
0.4
0.6
0.8
1
0 0.25 0.5 0.75 1ρvfyv (ksi)
Post-Tensioned Specimens
Post-Tensioned Specimens
Control
104
4.7.2 Failure Mechanism
All post-tensioned test specimens failed due to localized crushing of the web concrete in the vicinity of the post-tensioning duct. The transverse reinforcement ratio had no effect on the failure mechanism of the post-tensioned test specimens, as shown in Figure 4.28 for two of the specimens containing the highest and lowest levels of transverse reinforcement.
Figure 4.28: Effect of Transverse Reinforcement on the Failure Mechanism
(the image of Tx62-5(N) was mirrored to display the same configuration as Tx62-4(S))
4.7.3 Shear Stress at Failure
Transverse reinforcement is only effective in increasing the shear capacity of a specimen until the capacity is controlled by the crushing of the compression field within the web. This crushing failure mechanism can be problematic if it occurs before the transverse reinforcement has fully yielded, which is why all design codes impose an upper limit either on the transverse reinforcement contribution to shear strength or a limit on the overall shear stress capacity of a member. This concern is addressed within the AASHTO General procedure by limiting the
Tx62-4(S)ρvfyv = 0.950 ksi
primary failure due to crushing at PT ductSupport
Load
Duct Location
Support
Load
Duct Location
primary failure due to crushing at PT duct
Tx62-5(N)ρvfyv = 0.214 ksi
105
calculated shear stress capacity of a member to 0.25f’c, which can be reached when large amounts of transverse reinforcement are used to provide additional shear capacity.
No girders tested during this experimental program reached this upper limit on the calculated shear stress or reached ultimate shear stresses in excess of 0.25f’c at failure. In spite of the shear stresses remaining below the 0.25f’c limit, all specimens failed due to localized crushing in the vicinity of the post-tensioning duct.
As can be seen in Figure 4.29, there was only a slight upward trend in the ultimate shear stress carried by the test specimens resulting from large increases in the transverse reinforcement ratio. This is consistent with the localized failure mechanism that was observed during testing in that an increase in transverse reinforcement does not directly increase the compressive strength of the web concrete. The interaction between the strength of the compressive stress field of the web concrete and the transverse reinforcement ratio are discussed in more detail with the benefit of the test results from the Evaluation Database for Post-Tensioned Girders in Chapter 5.
Figure 4.29: Normalized Ultimate Shear Stress vs. Transverse Reinforcement Ratio
4.8 Summary
In 2004, the Eurocode2 was modified in order to differentiate between the behaviors of girders containing grouted plastic ducts from those containing grouted steel ducts. This differentiation resulted in a significantly larger reduction in the effective web width of girders containing grouted plastic post-tensioning ducts (compared to those containing grouted steel ducts). These changes were a result of a small-scale panel testing program that showed a significant reduction in the crushing capacity for panels containing grouted plastic ducts compared to those containing grouted steel ducts (Muttoni, et al., 2006). Contrary to Eurocode2’s suggestions in this regard, the testing program described within this report has shown that grouted plastic ducts do not cause a significant reduction in beam shear strength when compared to those containing grouted steel ducts. Further analysis of the results of this testing program and the inclusion of these results into the Evaluation Database for Post-Tensioned Girders is included in Chapter 5 of this report.
0
0.05
0.1
0.15
0.2
0.25
0 0.25 0.5 0.75 1ρvfyv (ksi)
/
Tx62‐3 Control Test‐‐no duct‐‐
Tx62 Plastic PT DuctsØduct/bw= 0.43 to 0.44
Tx62‐7 Steel PT DuctØduct/bw= 0.33
Tx62 Steel PT DuctsØduct/bw= 0.43 to 0.44
107
Chapter 5. Database Analysis and Recommendations
5.1 Introduction
Of the eleven shear tests performed during this experimental program, the ten performed on the post-tensioned Tx62 test specimens were added to the Evaluation Database for Post-Tensioned Girders (PT Evaluation Database). These ten test specimens makeup 23 percent of the total evaluation database and represent the largest such tests performed on internally post-tensioned girders to-date. Moreover, four of these ten tests represent the only such tests performed on girders that contained grouted plastic post-tensioning ducts. The cross-sections of all specimens included in the PT Evaluation Database including those Tx62 test specimens from the current research program are provided in Figure 5.1.
The shear strength ratio (SSR) is defined here as the ratio of the ultimate (tested) shear capacity to the calculated shear capacity (Vtest/Vn) for the code or specification under consideration. The statistical values that describe a desirable shear strength calculation procedure are as follows:
The mean of the shear strength ratio should be close to 1.0. There should be a minimal number of overly conservative results (defined here as a test
specimen with a shear strength ratio greater than 2.0) Although a reasonable amount of scatter can be expected it should be kept to a minimum.
The amount of scatter can be measured numerically by the standard deviation of the shear strength ratio.
There should be a minimum of unconservative results (shear strength ratio less than 1.0) when an appropriate shear resistance factor (ϕ) is applied as presented in Section 5.3.1 (Avendaño & Bayrak, 2008).
Chitnuyanondh(1975)
Rezai-Jorabi(1986)
Rupf, Ruiz, & Muttoni(2013)
Lee, Cho, & Oh(2010)
Ruiz & Muttoni(2008)
Tx62 Test Specimens
108
5.2.1 Use of Standard Deviation in place of the Coefficient of Variation
It is desirable for a dataset of shear strength ratios to have a mean close to 1.0 and a minimal standard deviation. It is noteworthy that many studies, which have evaluated prestressed concrete shear behavior, have relied upon minimizing the coefficient of variation (COV) to ensure the accuracy of shear design procedures. Although the use of the COV can be helpful in some circumstances, it may cause confusion when comparing data sets with a desired mean value of 1.0 and actual mean values that are substantially different from 1.0 (i.e., the datasets of the shear strength ratios). In such cases, the standard deviation is a more appropriate measure of scatter, as it measures scatter with respect to the desired mean of 1.0 as opposed to the possibly much higher mean of the dataset. For example, a dataset of shear strength ratios with a mean above 2.0 may show a significantly smaller COV than another dataset with a mean close to 1.0, but the dataset with a mean value above 2.0 may have a significantly larger standard deviation and therefore more scatter. In the remainder of this report, the standard deviation will be used to quantify the scatter of a dataset in place of the COV.
5.3 Accuracy of Shear Strength Calculation Procedures
Shear strength ratios were calculated using the four shear design procedures outlined in Chapter 2 and the test results from the PT Evaluation Database. The shear strength ratios shown in this section used the appropriate effective web width calculation as they are given in each specific shear design procedure (i.e. ACI 318-11 calculations used gross web widths and AASHTO (2013) calculations used their respective effective web width equations). A full description of both the shear strength calculation procedures and the effective web widths used in these calculations are provided within Chapter 2.
As can be observed from the distribution of the histograms shown in Figure 5.2, the AASHTO (2013) General Shear calculation procedure (hereafter referred to as the AASHTO General procedure) provides the most accurate estimation of the shear strength of all design provisions explored, but it does result in unconservative shear strength ratios (less than 1.0) for six tests (14 percent of the database). The remaining three shear design procedures produced shear strength ratios with significantly larger means and standard deviations as well as a large number of overly-conservative results (defined as having a shear strength ratio greater than 2.0), as shown in Table 5.1. Therefore, although these shear strength calculation methods are conservative they do not provide an accurate estimate of shear behavior and are not discussed further in this chapter.
109
Figure 5.2: Histograms of PT Evaluation Database for SSR Calculated with ACI 318-11 &
Table 5.1: Shear Strength Ratios of PT Evaluation Database
5.3.1 Probability of an Unconservative Shear Strength Ratio
In addition to the statistical values shown in Table 5.1, the level of conservativeness of a shear design procedure can be described by fitting a probability distribution to a dataset of shear strength ratios. This statistical distribution can then be used to show the probability of occurrence of an unconservative shear strength ratio (i.e. less than 1.0), particularly for relatively small datasets that do not have representative data at the tails of their distribution. A fitted statistical distribution can also be used to identify an appropriate strength resistance factor (ϕ) that would provide the desired level of conservativeness in practice.
The shear strength ratio may be assumed to be the ratio of two random variables. According to the Central Limit Theorem, if two random variables are normally distributed, then their product (or in this case their ratio) is lognormally distributed. In accordance with this theorem, a lognormal distribution is assumed for the datasets of shear strength ratios and is used to analyze the level of conservativeness with respect the calculated capacities of the four shear design procedures described in Chapter 2.
As defined in Section 5.2, a desirable shear design procedure should result in approximately zero unconservative test results when an appropriate ϕ is applied. Assuming a lognormal distribution in accordance with the Central Limit Theorem, the likelihood of a shear strength ratio being less than two natural-log standard deviations below the natural-log mean is approximately 2 percent. This level of conservatism (98 percent confidence) with regard to the calculated capacity is taken to be adequate for shear strength design procedures. To ensure this level of confidence, a required shear strength resistance factor (ϕreq) can be calculated as shown in Equation 5.1 through Equation 5.3. The ϕreq can be compared to the shear strength resistance factor ϕ of a given code or specification. If the actual ϕ is less than the ϕreq calculated by Equation 5.3 then the probability of an unconservative shear strength calculation is less than 2 percent.
n = 44 testsAASHTO General
AASHTO Segmental
ACI 318-11Detailed
ACI 318-11Simplified
Minimum 0.92 1.09 0.94 1.42
Maximum 2.13 3.23 3.23 3.55
Mean 1.34 1.81 1.86 2.31
Standard Deviation 0.36 0.49 0.57 0.56
COV 0.26 0.27 0.31 0.24
UnconservativeCount & Percentage
6 tests14%
none2 tests
5%none
Over-conservativeCount & Percentage
1 test2%
14 tests32%
12 tests27%
29 tests66%
111
∑ ln
Equation 5.1
∑ ln Equation 5.2
Equation 5.3
where: N = The number of tests within the PT Evaluation Database. (44 tests)
= The average of the natural log of the shear strength ratio dataset, calculated as shown in Equation 5.1
= The standard deviation of the natural log of the shear strength ratio dataset, calculated as shown in Equation 5.2.
As shown in Table 5.2, the ϕreq value of the ASHTO General procedure is 0.79. This is
less than the actual ϕ and therefore indicates an unacceptable level of conservativeness in regards to those criteria outlined in Section 5.2. This low ϕreq value indicates that although the AASHTO General is the most accurate shear design procedure discussed in this report it may provide unconservative results in its current form. Therefore, the remainder of this chapter focuses on improvements to the AASHTO General procedure in order to increase the conservativeness of the shear design procedure while maintaining or improving upon the accuracy of the design procedure.
Table 5.2: Required and Actual Shear Strength Resistance Factors
n = 44 testsAASHTO General
AASHTO Segmental
ACI 318-11Detailed
ACI 318-11Simplified
Shear StrengthReduction Factor (ϕ)
ϕ = 0.9
§5.5.4.2.1 AASHTO (2013)
ϕ = 0.75
§9.3.2.3 of ACI 318-11
ϕ
(Equation 5-3)0.79 1.03 0.97 1.40
Commentsunconservativegiven current ϕ
factorconservative given current ϕ factor
112
5.4 Investigation of Bias
Although the AASHTO General procedure does produce slightly unconservative shear strength ratios, it is the most accurate of the codes discussed above. In this section, the shear strength ratios calculated using the AASHTO General procedure are plotted against primary experimental variables to identify any biases the shear design procedure may have with respect to the six experimental variables listed below. The study of bias is performed to identify shortcomings in the AASHTO General procedure in estimating the shear strength of post-tensioned girders and to identify possible ways of improving its accuracy.
(i) Presence of a post-tensioning duct (ii) Duct material type (steel or plastic) (iii)Duct diameter-to-web width ratio (iv) Transverse reinforcement ratio (v) Span-to-depth ratio (vi) Controlling shear failure mechanism
5.4.1 Presence of a Post-Tensioning Duct
Chapter 4 addressed the behavioral differences between the ten post-tensioned test specimens and the one control specimen, which only contained pretensioned reinforcement. This section assesses any bias in the shear strength estimates of the AASHTO General procedure may hNave with respect to the presence of a post-tensioning duct. Two prestressed concrete shear evaluation databases are used in this assessment, one limited to pretensioned girders without ducts and the other limited to post-tensioned girders with ducts.
The Evaluation Database - Level II as presented in Nakamura et al. (2013) contains the results of 177 shear tests on pre- and post-tensioned girders and was restricted to include only what Nakamura et al. (2013) called “typical shear failure”. 164 of the test specimens included in this evaluation database were performed on pretensioned concrete test specimens, while only thirteen were conducted on post-tensioned specimens. To isolate the differences between pre- and post-tensioned girders these thirteen test results were removed from Evaluation Database Level II. The resulting restricted evaluation database is referred to here as the Evaluation Database for Pretensioned Girders and contains 164 test results from test specimens that only contain pretensioned reinforcement. The statistical values of the datasets resulting from the AASHTO General procedure shear strength ratios are provided for both the PT Evaluation Database and the restricted Evaluation Database – Level II in Figure 5.3 and Table 5.3.
113
Figure 5.3: Shear Strength Ratios Calculated with AASHTO General Procedure for Evaluation
Databases of Pre- and Post-Tensioned Girders
Table 5.3: Statistical Evaluation of Databases for Pre & Post-Tensioned Girders (Calculated with AASHTO General Procedure)
(B) PT Evaluation Database (N=44)AASHTO General (2013)
† The “Evaluation Database for Pretensioned Girders” was developed from the Evaluation Database – Level II of Nakamura et al. (2013) by removing 13 post-tensioned specimens from the database.
114
The presence of the post-tensioning duct does play a significant role in the accuracy and the level of conservatism of the shear strength estimates of the AASHTO General procedure. The pretensioned database shear strength ratios have less scatter and fewer unconservative values than those of the PT Evaluation Database. The most striking comparison between these two databases is the percentage of unconservative shear strength ratios they produce. The pretensioned database only has one unconservative shear strength ratio making up 0.4 percent of the database while 14 percent of the PT Evaluation Database test results are unconservative. It is clear from this information that the AASHTO General procedure does show a significant bias with regard to duct presence.
5.4.2 Post-Tensioning Duct Material
As was stated in the introduction to this chapter, the four tests conducted on specimens with grouted plastic post-tensioning ducts during the current experimental study are the only such tests presented in the literature to-date. These tests are denoted in Figure 5.4, which plots the shear strength ratios calculated with the AASTHO General procedure with respect to the duct diameter-to-web width ratio. As can be seen in this figure no noticeable bias exists due to the duct material used in post-tensioned girders while the bias present as a result of the duct diameter to web width is discussed in Section 5.4.3. This observation is not surprising given that the AASHTO General procedure does not treat plastic ducts differently from other ducts, and tests using plastic ducts indicated little difference in shear strength compared to tests using steel ducts.
Figure 5.4: Effect of Duct Diameter to Web Width on the SSR Denoting Grouted Plastic Duct
Specimens
0
0.5
1
1.5
2
2.5
3
0 0.1 0.2 0.3 0.4 0.5 0.6
Number of Tests 44PT Evaluation DBPost-Tensioned Tx62sGrouted Plastic Ducts
Øduct/bw
115
5.4.3 Duct Diameter-to-Web Width Ratio
The effect of the duct diameter-to-web width ratio on the conservativeness of the AASHTO General procedure is shown in Figure 5.5. Although the data exhibit a large amount of scatter, it can be observed that all unconservative test results occur at duct diameter-to-web width ratios greater than the 0.4 limit provided by §5.4.6.2 of AASHTO (2013). Therefore, if the 0.4 limit were enforced and all points above this limit were excluded from the database, there would be no unconservative shear strength ratios calculated by the AASHTO General procedure. This, however, is not the case in practice as many state departments of transportation routinely ignore this limit (Williams, et al., 2013). Therefore it is important to consider those points above the 0.4 duct diameter-to-web width limit as they can be considered the worst case for design.
Figure 5.5: Effect of the Duct Diameter-to-Web Width Ratio on the SSR
0
0.5
1
1.5
2
2.5
3
0 0.1 0.2 0.3 0.4 0.5 0.6
Number of Tests 44PT Evaluation DBPost-Tensioned Tx62s
Øduct/bw
§5.4.6.2 of AAHSTO (2013) ØD ≤ 0.4bw
116
5.4.4 Transverse Reinforcement Ratio
Figure 5.6 illustrates the effect of the transverse reinforcement ratio on the shear strength ratios calculated by the AASHTO General procedure.
Figure 5.6: Effect of the Transverse Reinforcement Ratio on the SSR
While unconservative shear strength ratios are seen to occur in the figure over a large range of transverse reinforcement ratios, the conservativeness of the AASHTO General procedure as a whole decreases with an increase in the transverse reinforcement ratio. The exception to this behavior can be observed for the six points with the largest transverse reinforcement ratios for which nominal strength was limited by the upper limit of the nominal shear strength (Vn(max)) imposed by the AASHTO General, shown in Equation 5.4. Without this upper limit, these six tests would have continued the downward trend in conservatism and would have exhibited unconservative failure loads.
. Equation 5.4
where:
′ = The compressive strength of concrete (psi)
bv = The minimum web width inside depth of dv reduced to account for the post-tensioning ducts in accordance with §5.8.2.9 of AASHTO (2013) (inches)
dv = Effective shear depth measured perpendicular to the neutral axis between the compressive and tensile resultants due to flexure, but not to be taken as less than the greater of 0.9*(transformed steel area’s depth) or 0.72h.(inches)
Vp = The vertical component of the prestressing force resisting shear. (lbs.)
Unlimited (no 0.25f’cbvdv limit)
0
0.5
1
1.5
2
2.5
3
0 0.5 1 1.5 2
Number of Tests 44
PT Evaluation DB
Post-Tensioned Tx62s
ρvfyv (ksi)
117
5.4.5 Shear Span-to-Depth Ratio
The effect of the shear span-to-depth ratio on the conservatism of shear strength ratios calculated by the AASHTO General procedure is shown Figure 5.7. As was discussed in Chapter 2, the PT Evaluation Database was limited to a minimum shear span-to-depth ratio of 2.0 to remove tests that exhibit deep beam behavior from being included in a database that is meant to assess sectional shear behavior.
Figure 5.7: Effect of the Shear Span-to-Depth Ratio on the SSR
Figure 5.7 indicates that the AASHTO General procedure is not providing a similar level of conservatism across the range of shear span-to-depth ratios found in the database. The observed bias indicates that at low span-to-depth ratios (but still larger than 2.0) specimens may be capable of carrying larger shear forces due to arching action and may not have a purely sectional shear behavior (Nakamura, et al., 2013). The tests included in the PT Evaluation Database exhibit some bias in this regard in that all shear strength ratios with values greater than 1.5 occur in specimens with shear span-to-depth ratios of 3.0 or less. Beyond a shear span-to-depth of 3.0, it appears that the AASHTO General procedure has little bias with respect to shear span-to-depth ratios. Moreover, §5.8.1.1 of AASHTO (2013) allows sectional design procedures to be used for shear span-to-depth ratios as low as 2.0. Therefore, although a bias does exist, it is important to evaluate and consider all test results with shear span-to-depth ratios as low as 2.0.
0
0.5
1
1.5
2
2.5
3
0 1 2 3 4 5 6
Number of Tests 44PT Evaluation DBPost-Tensioned Tx62s
Shear Span to Depth Ratio (a/d)
118
5.4.6 Controlling Failure Mechanism
The ultimate shear strengths of all post-tensioned Tx62 test specimens were controlled by localized crushing of their webs in the vicinity of the post-tensioning duct. This failure mechanism is not unique to the Tx62 test specimens but is the dominant failure mechanism for 93 percent of beams within the PT Evaluation Database, as shown in Figure 5.8. This failure type includes nine tests on specimens with shear span-to-depth ratios in excess of 4.0. This section discusses the mechanics of this failure type and how it is accounted for in the AASHTO General equations.
The AASHTO General procedure is based on the Modified Compression Field Theory
(MCFT) developed by Vecchio & Collins (1986). The AASHTO General procedure calculates the nominal shear strength of a member by separate estimates for the “concrete” contribution and “steel” contribution to the nominal shear strength (Vc and Vs respectively). Within the framework of the MCFT, the Vc contribution to shear strength is an estimation of the “residual tensile stresses” in the cracked concrete (Vecchio & Collins, 1986), while the Vs contribution is an estimation of the ability of the transverse reinforcement (stirrups) to transmit load through the truss model originally developed by Ritter (1899). As can be observed from Figure 5.9, the concrete contribution does not have a direct relationship to the strength of the diagonal compressive strut of the girder (f2) but instead relies on the shear transmitted across the cracks (vci). A more complete explanation of these design equations is given in Section 2.2.1.
Web Crushing Failure
41 (93%)
Flange Delamination
2 tests (5%)
Stirrup Fracture
1test (1%)
119
Figure 5.9: Vc and Vs Components of Shear Strength in a Girder
While the concrete contribution to shear strength (Vc) does not have a direct relationship
to the compressive strength of the diagonal strut, the transverse reinforcement contribution (Vs) does (Kuchma, 2013). For the truss model to maintain equilibrium the diagonal compressive strut must not crush and the transverse reinforcement must not rupture. Failure of either of these load carrying mechanisms results in the shear failure of the girder as a whole, as shown in Figure 5.9. Therefore, the presence of a post-tensioning duct may affect the resistance in the shear strength contribution of the transverse reinforcement (Vs) and should be accounted for by modifying this term.
Av fy
Vc
Along fyVs
Cc
f2: diagonal compressive stressreduced strength due to presence of duct
vci: shear stress transferred across crack
Vs
Vc
120
5.5 Explored Modifications to the AASHTO General Procedure
Four approaches are investigated in this section in an effort to improve the accuracy and conservatism observed in the calculations of the AASHTO General procedure as it specifically applies to post-tensioned shear behavior. These approaches include:
(i) Providing alternate effective web width reduction factors (“k” factors) (ii) Limiting the maximum allowed duct diameter-to-web width ratio in accordance with
Kuchma (2013) (Detailed in Chapter 2) (iii) Modifying the upper limit on the nominal shear strength (Vn(max)). (iv) Modifying the transverse reinforcement contribution to shear strength (Vs). (Discussed in
Section 5.6) Ultimately, the approach that modifies the Vs term in the shear strength calculations (iv)
produced the best improvement. The results of this modification are discussed in detail in the subsequent section and are contrasted to the other approaches presented in this section.
5.5.1 Altering the Web Width Reduction Factor “k”
The current AASHTO General procedure accounts for a potential reduction in shear strength due to a post-tensioning duct by reducing the effective web width by some fraction of the duct diameter, as shown in Equation 5.5. Additionally, the duct diameter is restricted to a maximum of forty percent of the gross web width at the location of the duct. As was discussed within Chapter 2 this last limitation has been largely ignored by many state departments of transportation and therefore was also ignored in the calculations provided in this report (Williams, et al., 2013). Table 5.4 illustrates the effects of altering the “k” factors in the current procedure.
∅ Equation 5.5
where: bv = The effective web width of the girder within the depth dv and reduced
to account for the presence of a post-tensioning duct. (inches) bw = The gross web width of the girder taken within the shear depth dv
(inches) k = The duct diameter correction factor (unitless)
k= varied from 0 to 1 for grouted ducts k = 2 (kgrouted) Taken as twice the web width reduction factor for empty ducts in accordance with the current practice in AASHTO (2013).
Øduct = The duct diameter in the girder web. (inches)
121
Table 5.4: Statistical Values of the Shear Strength Ratios Calculated by the AASHTO General Procedure illustrating the Effect of Altering the “k” Factor
As summarized by Table 5.4, increasing the “k” factor increases both the minimum and
mean values of shear strength ratios. However, it also increases the scatter of the data as can be observed by the increase in the standard deviation. The increase in the standard deviation accelerates as the “k” factors are increased, making this approach undesirable.
This increase in the standard deviation of the shear strength ratio calculated with an increased “k” factor suggests that the use of web reduction factors may not be accurately representing the actual behavior of the specimens in the database. These findings therefore corroborate the statement in Section 5.4.5 that reducing the shear strength due to the presence of a post-tensioning duct may be better accounted for by a reduction in the transverse reinforcement contribution to shear strength as opposed to reducing the concrete contribution.
5.5.2 Applying a Limit on the Duct Diameter to Web Width Ratio (Kuchma, 2013)
As was discussed in Chapter 2, Kuchma (2013) proposed that the AASHTO General procedure could be used with gross web widths in place of the current effective web widths if a proposed limit on the duct diameter-to-web width ratio (shown in Equation 2.29) was followed. This limit on the duct diameter-to-web width ratio as a function of the factored shear stress acting on the cross-section is based on a derivation of the maximum diagonal compressive stress that can be developed at the mid-height of a girder. The full derivation is provided in Chapter 2.
∅ 11.092
4.27 Equation 5.6
n = 44 tests ∅
“k” factor: grouted duct0
0.25 0.50 0.75
“k” factor: empty duct 0.50 1.0 1.5
Minimum 0.88 0.92 0.96 1.01
Maximum 2.09 2.13 2.18 3.09
Mean 1.28 1.34 1.42 1.53
Standard Deviation 0.34 0.36 0.40 0.51
COV 0.27 0.26 0.28 0.33
UnconservativeCount & Percentage
11 tests25%
6 tests14%
4 tests9%
none
Over-conservativeCount & Percentage
1 test2%
1 test2%
5 tests11%
13 tests30%
122
where: Øduct = The duct diameter present in the girder web. (inches)
bw = The gross web width at the location of the duct. (inches)
vu = The factored ultimate shear stress resisted by the girder. (psi)
k = The web width reduction factor given by Muttoni et al. (2006) k= 0.40 for grouted steel ducts k= 0.80 for grouted plastic ducts k= 1.20 for empty ducts
For the purpose of comparing the shear strength ratio of the PT Evaluation Database to
Kuchma’s (2013) limit on the duct diameter-to-web width ratio given in Equation 2.29 the factored ultimate shear stress (vu) was taken as the ultimate shear strength (Vtest) normalized by the gross web width (bw) and the effective shear depth (dv). As shown in Chapter 4, there were no discernable differences in the behavior of Tx62 test specimens with grouted plastic or steel ducts. Therefore, the web width reduction factor for the limit proposed in Equation 2.29 is taken as 0.40 for grouted ducts regardless of the duct material used. The resulting maximum duct diameter that can be used in the test specimen under consideration is shown in Equation 5.7. The ratio of the maximum duct diameter (calculated with Equation 5.7) to the actual post-tensioning duct diameter under consideration is plotted against the shear strength ratio calculated with gross web width (bw) in Figure 5.10
∅ 1.0924.27
0 Equation 5.7
where: k = The web width reduction factor given by Muttoni et al. (2006)
k= 0.4 for all grouted ducts k= 1.2 for all ungrouted or empty ducts.
Vtest = The ultimate (tested) shear strength at failure (lbs.)
f'c = The concrete compressive strength (psi)
bw = The gross web width of the girder taken within the shear depth dv (inches)
dv = The effective shear depth of the girder taken in accordance with AASHTO (2013) (inches)
ØMax = The maximum duct diameter that can be used in a specimen based on the calculations described within Kuchma (2013). (inches)
Øduct = The actual duct diameter present in the girder web. (inches)
123
Figure 5.10: Shear Strength Ratio versus allowable duct diameter ratio
As can be observed from Figure 5.10, only three of the eleven unconservative shear strength ratios calculated by the AASHTO General procedure (using gross web widths) have duct diameters larger than that allowed by Equation 5.7. This approach may therefore not be desirable in light of how its estimates compare with the data of the database. Moreover, the approach may not be practical given that the current duct diameter-to-web width limit of 0.4 is largely ignored by departments of transportation across the United States (Williams, et al., 2013).
5.5.3 Modifying the Limit on Nominal Shear Strength
Another potential application of the duct diameter-to-web width limit proposed by Kuchma (2013) is to modify Equation 2.29 so that it becomes a limit on the maximum shear stress similar to the upper limit that is currently in place in the AASHTO General procedure (shown in Equation 5.4).
By taking the factored ultimate shear stress (vu) as equal to the nominal shear stress (vn), Equation 2.29 can be rewritten as an upper limit on the nominal shear stress, as shown in Equation 5.8. If this maximum nominal shear stress is further rearranged by multiplying it by the gross web width (bw) and adding the vertical component of the prestressing force, it takes the form of Equation 5.9, which is similar in form to the current limit given by §5.8.3.3 of AASHTO General (and in Equation 5.4). The nominal shear strength is then calculated by Equation 5.10 where the Vc and Vs terms are the concrete and steel contributions as calculated using the gross web width (bw) and the AASHTO General shear strength equations described within Chapter 2.
0
0.5
1
1.5
2
2.5
0 1 2 3 4 5 6 7
Number of Tests 44PT Evaluation DBPost-Tensioned Tx62s
∅ /∅
violates limit ofEquation 5-9
unconservative shear strength ratios at less than 0.4∅Max
124
The effect of this proposed limit on the shear strength ratio is shown in Table 5.5. The duct diameter factor “k” of Equation 5.10 was varied to access the effect of this proposed modification.
4.271.092
∅
Equation 5.8
0.234 1.092∅
Equation 5.9
min0.234 1.092
∅ Equation 5.10
where: Vc = The concrete contribution to shear strength as calculated utilizing the
gross web width and the Vc calculation of AAHSTO General. (lbs.)
Vs = The transverse reinforcement contribution to shear strength as calculated utilizing the Vs calculation of AAHSTO General. (lbs.)
f'c = The concrete compressive strength. (psi)
bw = The minimum gross web width within a depth of dv. (inches)
dv = The effective shear depth taken in accordance with AASHTO General. (inches)
Øduct = The duct diameter present in the girder web. (inches)
Vp = The vertical component of the prestressing force taken after losses at the location of the critical section (lbs.)
k = The duct diameter correction factor (unitless) k= varied from 0 to 1.25 for grouted post-tensioning ducts k= 2 (kgrouted) Taken as twice the web width reduction factor for empty ducts
125
Table 5.5: Effect of Modifing Limit on Shear Stress by Funciton of (∅ /
Although this modification does address the correct behavioral mechanism by reducing
the capacity of the girder with respect to the strength of a diagonal compressive strut (by limiting the shear stress), it results in large scatter and a large number of overly-conservative shear strength ratios as can be seen in Table 5.5. This scatter increases with an increasing duct correction factor and therefore this proposed modification is not desirable.
n = 44 tests
“k” factor: grouted duct0
0.75 2.0 1.25
“k” factor: empty duct 1.5 2.0 2.5
Minimum 0.88 0.88 0.88 0.986
Maximum 2.09 2.76 4.23 9.09
Mean (μ) 1.28 1.41 1.53 1.87
Standard Deviation (σ) 0.34 0.47 0.68 1.46
COV (σ/μ) 0.27 0.33 0.44 0.78
UnconservativeCount & Percentage
11 tests25%
11 tests25%
7 tests16%
3 tests7%
Over-conservativeCount & Percentage
1 test2%
6 tests14 %
7 tests16%
8 tests18%
126
5.6 Proposed Modification to Vs term of AASHTO General Procedure
The transverse reinforcement contribution (Vs) to the shear strength capacity (Vn) is limited by the ability of the truss mechanism to carry shear force through both the tensile capacity of the transverse reinforcement and through the compressive capacity of the web of the specimen. This relationship is described in Figure 5.11.
Figure 5.11: Truss Mechanism (Vs) Contribution to Shear Strength
where:
λduct = Shear strength reduction factor to account for presence of post-tensioningduct (discussed in Section 5.6.1)
f2 = Principle diagonal compressive stress in the direction of θ. (ksi)
θ = Angle of inclination of the diagonal compressive stress (degrees)
dv = Effective shear depth measured perpendicular to the neutral axis between thecompressive and tensile resultants due to flexure, but not to be taken as lessthan the greater of 0.9*(transformed steel area’s depth) or 0.72h (inches)
bw = Minimum gross web width inside a depth of dv (inches)
Av = Area of shear reinforcement within a longitudinal distance s (in2)
fy = Yield strength of transverse reinforcement (ksi)
s = Longitudinal spacing of transverse reinforcement (inches)
f2: diagonal compressive stresscontrolled by compressive strength of web
Av fy: transverse reinforcement contribution
Cc
Along fyVs
127
The crushing of the web concrete of a prestressed girder disrupts the internal equilibrium of the girder by preventing the transfer of forces between the diagonal compressive strut and the transverse reinforcement. One way to account for the potential shear strength reduction due to the presence of a post-tensioning duct is to directly reduce the strength of the diagonal compressive strut and the associated force transfer to the transverse reinforcement, as illustrated in Figure 5.12. A strength reduction factor (λduct) is proposed to directly reduce the transverse reinforcement contribution to shear strength (Vs). The justification for this term is illustrated in Figure 5.12 while the form of this strength reduction factor is discussed in more detail in the following section.
Figure 5.12: Accounting for Reduction in Shear Strength as a Result of a Post-Tensioning Duct
by Reducing the Transverse Reinforcement Contribution
For Equilibrium:
Accounting for reduction in strength due to presence of duct:
f2: diagonal compressive stressreduced strength as result of PT duct
Av fy: transverse reinforcement contribution
Cc
Along fyVs
128
5.6.1 Shear Strength Reduction Factor (λduct)
§5.4.6.2 of AASHTO (2013) limits the maximum duct diameter to 40 percent of the gross web width at the location of the post-tensioning duct. The effect of this limit on the AASHTO General shear-strength calculations was addressed in Section 5.4.3, where it was noted that all tests with unconservative shear strength ratios contained post-tensioning ducts with diameters greater than 40 percent of the gross web width. These unconservative results indicate that there may be an increase in the influence of the duct on the shear strength of a girder when large duct diameter-to-web width ratios are used. Moreover, if this limit were fully removed there is the potential that large enough duct diameter-to-web width ratios could result in concrete placement difficulty during construction and could lead to poor consolidation.
It is therefore useful to limit the duct diameter-to-web width ratio. However, the current limit of 0.4 is being violated on a regular basis (Williams, et al., 2013) and therefore a penalty-based approach is proposed here. A quadratic form is chosen for the reduction factor (λduct) on the Vs term as is given in Equation 5.11. λduct allows for the removal of the hard limit on the duct diameter-to-web width ratio and in its place relies on an quadratically increasing reduction in strength with increasing duct diameter-to-web width ratio which is multiplied by the duct diameter correction factor (δ). The nominal shear strength of the specimen can then be calculated by the AASHTO General procedure where the gross web widths are used in place of the effective web widths.
0.25
Equation 5.11
where:
1∅
0 Equation 5.12
where: Vc = The concrete contribution to shear strength as calculated utilizing the
gross web width according to AAHSTO General. (lbs.) Vs = The transverse reinforcement contribution to shear strength
calculated according to AAHSTO General. (lbs.) λduct = The quadratic reduction factor applied to Vs that accounts for the
reduction in the strength of the compressive diagonal due to the presence of a post-tensioning duct. (unitless)
f'c = The concrete compressive strength. (psi)
bw = The minimum gross web width within a depth of dv. (inches)
dv = The effective shear depth calculated in accordance with AASHTO General. (inches)
Øduct = The outside duct diameter present in the girder web. (inches)
Vp = The vertical component of the prestressing force taken after losses at the location of the critical section (lbs.)
δ
= The duct diameter correction factor (unitless) δ= 2.0 for grouted ducts δ= not given for ungrouted (empty) ducts (due to lack of data)
129
The λduct proposed for grouted ducts is plotted in relation to the duct diameter to web width ratio in Figure 5.13. It should be noted that little data exist on the effect of ungrouted post-tensioning ducts on the shear strength of post-tensioned girders. For this reason, the duct diameter coefficient for empty ducts is unaddressed in Equation 5.12 and in Chapter 6, but to allow for comparisons of the PT Evaluation Database the duct diameter coefficient (δ) for ungrouted ducts is taken as twice that for grouted ducts within this chapter.
Figure 5.13: Quadratic Reduction Factors Applied to Vs as Functions of Øduct / bw
It is important to understand that λduct the duct diameter coefficient (δ) is not equivalent to
the current “k” factor, both because the function λduct is a quadratic and because λduct modifies the transverse reinforcement contribution to shear strength alone. Therefore, a λduct value of zero reduces the nominal shear strength of a girder to the concrete contribution to shear strength alone (i.e. it does not result in a Vn = 0 for a λduct = 0).
Figure 5.14 and Table 5.6 present the shear strength ratios of the PT Evaluation Database as calculated using the both proposed Modifications to the AASHTO General procedure (Equation 5.11) and the AASHTO General procedure in its current form.
0
0.2
0.4
0.6
0.8
1
0 0.2 0.4 0.6 0.8
(grouted ducts)
λduct
130
Figure 5.14: Shear Strength Ratios of the PT Evaluation Database Calculated by the AASHTO
General Procedure & with proposed Modifications shown in Equation 5.11
Table 5.6: Statistical Values of the Shear Strength Ratio
As can be observed, the proposed modifications to the AASHTO General procedure
reduce the standard deviation of the shear strength ratio while increasing the level of conservativeness of the calculations in regards to the calculated shear strength. This proposed modification is the most successful in terms of reducing scatter while increasing the conservativeness of the four modifications to the AASHTO General procedure described within this chapter.
As was outlined in Section 5.2, a desirable shear design procedure will produce a minimum of unconservative results when an appropriate shear resistance factor (ϕ) is applied. The ϕ factor given by §5.5.4.2.1 of AASHTO (2013) for the shear behavior of normal weight concrete members is 0.9. Therefore, if the modifications proposed in this section are to provide appropriately conservative results they should have a ϕreq (as calculated by Equation 5.3) of 0.9 or greater to have at a minimum of a 98 percent confidence of providing a conservative shear strength calculation in regards to capacity. The results of Equation 5.3 for the current AASHTO General Procedure and those of the proposed modifications to the AASTHO General are given in Table 5.7, which shows a marked improvement in terms of conservatism when the proposed modifications are used.
Table 5.7: ϕ and ϕreq for AASHTO General and Proposed Modifications
5.6.2 Impact of Proposed Changes to AASHTO General
It is important that the proposed modifications to AASHTO General procedure result in a more accurate estimate of shear strength, smaller error spreads, and less bias with respect to key variables than the current procedures. In this section, changes in the calculated shear strength ratios are explored with respect to the experimental variables first examined in Section 5.4.
As shown in Figure 5.15, the proposed modifications to the shear strength calculations have the largest impact on those tests with large transverse reinforcement ratios. This is an expected behavior as the proposed modification directly effects the Vs contribution to shear strength, which is a function of the transverse reinforcement ratio.
n = 44 testsAASHTO
General (2013)Proposed
Modification
Shear StrengthReduction Factor (ϕ)
ϕ = 0.9
§5.5.4.2.1 AASHTO (2013)
ϕ
(Equation 5-3)0.79 0.90
Commentsunconservativegiven current ϕ
factor
conservativegiven current ϕ
factor
132
Figure 5.15: Modified AASHTO General versus Transverse Reinforcement Ratio
Instead of the trend seen in the current AASHTO General of a decreasing shear strength
ratio given an increasing transverse reinforcement ratio the shear strength ratio of the proposed modification shows only a slight positive trend with an increasing transverse reinforcement ratio. Figure 5.15 therefore indicates that the new shear strength estimates have a significantly lower bias with respect to transverse reinforcement ratio than those obtained using the current procedure.
As shown in Figure 5.16, the proposed modifications also reduce the slope of the negative trend resulting from an increase in the duct diameter-to-web width ratio seen in the current AASHTO General procedure. Although the minimum shear strength ratio calculated with the proposed changes still occurs at a duct diameter-to-web ratio greater than the current 0.4 limit, the proposed quadratic form of λduct results in less bias and a reasonably accurate shear strength estimates over the full range of duct-to-web width ratios in the database.
0
0.5
1
1.5
2
2.5
3
0 0.5 1 1.5 2
Number of Tests 44AASHTO General (2013)Proposed Modification
ρvfyv (ksi)
Current AASHTO General
Proposed Modification
**trends only include data-points not controlled by Vn(max)
133
Figure 5.16: Modified AASHTO General versus Duct Diameter-to-Web Width Ratio
The effect of the proposed modifications on the bias resulting from the shear span-to-
depth ratio is shown in Figure 5.17. The bias of the proposed modifications are similar to that of the current AASHTO General procedure, but the trend shows a higher shear strength ratio, on average, than the current procedure, resulting in a more conservative design procedure.
Figure 5.17: Modified AASHTO General and Current AASHTO General Procedure Impact on
Shear Span-to-Depth Ratio
0
0.5
1
1.5
2
2.5
3
0.2 0.3 0.4 0.5 0.6
Number of Tests 44AASHTO General (2013)Proposed Modification
Øduct/bw
ØD ≤ 0.4bw Limit Removed Current AASHTO General
Proposed Modification
0
0.5
1
1.5
2
2.5
3
0 1 2 3 4 5 6
Number of Tests 44AASHTO General (2013)Proposed Modification
Shear Span to Depth Ratio (a/d)
Current AASHTO General
Proposed Modification
134
5.7 Summary
The shear strength design procedures of the AASHTO General provide the most accurate predictions amongst available procedures of the shear capacity of girders with post-tensioning ducts. This procedure may, however, produce unconservative estimates on shear strength for 14 percent of the tests in the PT Evaluation Database. In the PT database, 93 percent of the girders failed by crushing of the web at the level of the duct. The current AASHTO General shear strength calculations account for a potential reduction in shear strength reduction due to the presence of a post-tensioning duct by reducing the concrete contribution (Vc) to the shear strength. This term (Vc) represents the concrete’s ability to transmit tensile stresses across inclined cracks. Since the observed failure mode of 93 percent of test specimens in the PT Evaluation Database was the crushing of compression struts, it was proposed to introduce a shear strength reduction factor for the AASHTO General procedure by directly reducing the transverse reinforcement contribution to shear strength (Vs) which is limited by the ability of the strength of the compression struts in a truss shear-resistance mechanism.
The proposed reduction factor (λduct), which accounts for the shear strength reduction due to the presence of a post-tensioning duct, is applied directly to the transverse reinforcement contribution as (λductVs). This proposed modification, along with the use of the gross web width (bw) for all other shear strength calculations, resulted in shear-strength estimates for specimens in the PT database with fewer unconservative estimates, a smaller standard deviation, and less bias with respect to key influential variables than obtained with the current procedure.
135
Chapter 6. Summary and Conclusions
6.1 Summary
Several factors influencing the shear behavior of prestressed concrete girders remain less studied. Among these is the reduction in strength that may occur due to the presence of a post-tensioning duct in the web of a prestressed girder. The high cost of large scale research has resulted in a limited number of tests being performed on full-scale post-tensioned specimens. Instead, the design expression for reducing the shear strength of a post-tensioning girder to account for the presence of a duct is based on small-scale panel compression tests. These panel tests showed conclusively that panels containing grouted plastic ducts failed at significantly lower loads than panels that contained grouted steel ducts (Muttoni, et al., 2006), (Wald, 2012).
In 2004, the Eurocode2 was modified in order to differentiate between the strength reduction behaviors of girders containing grouted plastic ducts from those containing grouted steel ducts. This change resulted in a significantly larger reduction in the effective web width of girders containing grouted plastic post-tensioning ducts (compared to those containing grouted steel ducts). It is important to understand that prior to the completion of the current research no full-scale shear tests had ever been conducted on girders containing grouted plastic ducts.
Seven full-scale Tx62 bulb-tee test specimens were constructed at a precast concrete fabrication plant, and eleven shear tests were performed on these specimens at the Phil M. Ferguson Structural Engineering Laboratory. The five primary experimental variables of this testing program were evaluated for their impact at service level shear force, at ultimate state, and were investigated for bias in regard to the General Procedure for shear design (§5.8.2.9 of AASHTO (2013)) using the Evaluation Database for Post-Tensioned Girders. The five primary experimental variables were:
(i) Presence of a post-tensioning duct (ii) Post-tensioning duct material (plastic or steel) (iii)Web-width (iv) Duct Diameter (v) Transverse Reinforcement Ratio
6.2 Experimental Observations
The following sections detail the performance of the Tx62 test specimens in regard to the primary variables listed in the previous section and relate their effect to the specimen behavior at service level, ultimate state, and their influence on the AASHTO General shear design procedure.
136
6.2.1 Presence of a Post-Tensioning Duct
Service Level Behavior (Section 4.4.1): The presence of a post-tensioning duct within the web of a specimen resulted in localized cracking in the direct vicinity of the duct at service level shear forces (approximately 0.5Vtest). This behavior was not observed in the pretensioned control specimen, but service level hairline cracks were observed over the depth of the control specimen at approximately the same percentage of the ultimate shear strength as the localized cracks seen in the pretensioned specimen.
Shear Behavior at Ultimate State (Section 4.4.2): The presence of a post-tensioning duct within the web of a Tx62 test specimen resulted in localized crushing of the web concrete in the direct vicinity of the duct. Although the failure mechanism for the control girder was also crushing of the web concrete, this occurred throughout the full depth of the web (i.e. not localized crushing), and it was consistent with other documented cases of shear-compression failure.
Statistical Performance of the AASHTO General procedure (Section 5.4.1): The presence of a post-tensioning duct within the web of a specimen does play a role in the accuracy and the level of conservatism of the AASHTO General shear design procedure. The evaluation database that specifically addresses the shear behavior of prestressed girders has a shear strength ratio (Vtest/Vn) with less scatter and is significantly more conservative in regard to the calculated shear capacity than is seen in the Evaluation Database for Post-Tensioned Girders.
6.2.2 Post-Tensioning Duct Material (Plastic or Steel)
Service Level Behavior (Section 4.5.1): No difference was seen between grouted plastic and grouted steel post-tensioning ducts at service level loads. Both the localized cracking in the vicinity of the post-tensioning duct and the full-depth cracking occurred at approximately the same percentage of the ultimate capacity for all post-tensioned specimens regardless of their duct material type.
Shear Behavior at Ultimate State (Section 4.5.2 & 4.5.3): The testing program described within this report has shown that grouted plastic ducts do not cause a reduction in beam shear strength when compared to those containing grouted steel ducts. Therefore, no distinction between post-tensioning duct material types should be made on the basis of their impact on the shear performance of a post-tensioned girder.
Statistical Performance of the AASHTO General procedure (Section 5.4.2): The post-tensioning duct material did not influence the statistical performance of the AASHTO General procedure in regards to the accuracy or the level of conservativeness in regard to the shear strength ratio (Vtest/Vn).
137
6.2.3 Specimen Web Width and Duct Diameter
The experimental variables of specimen web width and duct diameter were used to vary the duct diameter-to-web width ratio of several test specimens. All duct diameters were taken as the nominal dimensions provided by the manufacturer.
Service Level Behavior (Section 4.6.1): No differences were seen as a result of the duct diameter or web width variables at service level shear forces. The same localized hairline width cracks were seen in the test of Tx62-7(S) which contained a 3-inch duct in a 9-inch web (Øduct /bw = 0.33) as were seen with all other girders which had duct diameter-to-web width ratios of 0.43 to 0.44.
Shear Behavior at Ultimate State (Section 4.6.2 & 4.6.3): Duct diameter-to-web width ratios of 0.33 to 0.44 were tested during this experimental program. No differences were seen in the shear failure mechanisms from the tests performed on this range of duct diameter-to-web width ratios. However, variations were seen in the shear stress carried at failure. The specimens with a duct diameter-to-web width ratio of 0.33 had a shear stress of 0.20f’c at failure while all other post-tensioned specimens with duct diameter-to-web width ratios of 0.43 to 0.44 had a shear stress of 0.16f’c to 0.18f’c at failure.
Statistical Performance of the AASHTO General procedure (Section 5.4.4): All unconservative test results, in relation to the shear strength calculations of the AASHTO General procedure, in its current form, occurred at duct diameter-to-web width ratios greater than the 0.4 limit provided by §5.4.6.2 of AASHTO (2013).
6.2.4 Transverse Reinforcement Ratio
Service Level Behavior (Section 4.7.1): No differences were found among test specimens with varying levels of transverse reinforcement at service level loads.
Shear Behavior at Ultimate State (Section 4.7.2 & 4.7.3): All post-tensioned test specimens failed due to localized crushing of the web concrete in the direct vicinity of the post-tensioning duct. The transverse reinforcement ratio had no effect on the failure mechanism of the post-tensioned test specimens.
Statistical Performance of the AASHTO General Procedure (Section 5.4.5): While unconservative shear strength ratios occur over a large range of transverse reinforcement ratios within the Evaluation Database for Post-Tensioned Girders, the conservativeness of the current AASHTO General procedure as a whole decreases with an increase in the transverse reinforcement ratio.
6.3 Use of Panel Testing for Calibration of Full-Scale Shear Behavior
The use of ηD as calibrated by panel test data is not recommended because it does not take into account the differences between the splitting failure mechanism of a panel with a post-tensioning duct and the crushing failure mechanism of a control panel without a duct (as described in Section 2.3.2.2). Therefore, small-scale uniaxial panel tests cannot be relied upon to calibrate the shear strength reduction that may result from the presence of a post-tensioning duct in the web of a full-scale girder specimen.
138
6.4 Proposed Changes to the AASHTO General Shear Design Procedure
Although the AASHTO General procedure was the most accurate method investigated for calculating the shear strength of post-tensioned girders, this shear design procedure, in its current form, produces unconservative estimates of shear strengths for 14 percent of the tests in the Evaluation Database for Post-Tensioned Girders. In this evaluation database, 93 percent of the girders failed by crushing of the web at the level of the post-tensioning duct. The current AASHTO General procedure accounts for a potential reduction in shear strength due to the presence of a post-tensioning duct by reducing the concrete contribution (Vc) to the shear strength. This term (Vc) represents the concrete’s ability to transmit tensile stresses across inclined cracks. Since the observed failure mode of the vast majority of the evaluation database was the crushing of compression struts, it is proposed to introduce a shear strength reduction factor into the AASHTO General procedure by directly reducing the transverse reinforcement contribution to shear strength (Vs) which is limited by the diagonal compressive field in a truss shear-resistance mechanism.
The proposed reduction factor (λduct), which accounts for the shear strength reduction due to the presence of a post-tensioning duct, is applied directly to the transverse reinforcement contribution as (λductVs). This proposed modification, along with the use of the gross web width (bw) for all other shear strength calculations and the removal of the 0.4 limit on the duct diameter-to-web width ratio, results in shear-strength estimates for girders in the PT database with fewer unconservative estimates, a smaller standard deviation, and less bias with respect to key influential variables than obtained by the use of the current procedure. The details of these proposed modifications to the AASHTO General procedure are provided in Section 6.5 and in-line revisions to the AASHTO (2013) specifications are found in Appendix E.
6.5 Changes to the AASHTO (2013) General Shear Design Procedure
On the condition that the recommendations for the quadratically decreasing strength reduction factor (λduct) are adopted, the provisions of §5.4.6.2 of AASHTO (2013) should be amended to remove the current maximum duct diameter limit of 40 percent of the web width.
On the condition that the recommendations for the quadratically decreasing strength reduction factor (λduct) are adopted, the reduction for the effective web width provided in §5.8.2.9 of AASHTO (2013) should be removed.
On the condition that the recommendations for the quadratically decreasing strength reduction factor (λduct) are adopted, the gross web width (referred to as bw within this report) should be used to calculate the shear strength of a member within the confines of 5.8.2.9 of AASHTO (2013) (referred to as the AASHTO General procedure within this report).
The transverse reinforcement contribution to shear strength should be modified by a quadratically reducing term (λduct) to account for the reduction in the shear strength of a girder which contains a post-tensioning duct within its web. The equation governing the term λduct and the equations for the nominal shear strength of a member should be calculated as follows (modifications shown in bold):
139
for sections containing at least the minimum amount of shear reinforcement:
4.81 750
Equation 6.1
for all cases:
29 3500 Equation 6.2
where:
| |0.5
Equation 6.3
where: εs = Estimated strain at mid-height of cross-section (in/in)
θ = Angle of inclination of the compressive stresses (degrees)
Aps = Area of prestressing steel on the tension side of member (in2)
As = Area of mild steel on the flexural tension side of member (in2)
ag = Maximum aggregate size in the web concrete (in.)
fpo = ∆ ∗ (psi)
Δεp = Strain differential between prestressing strand and concrete (in./in.)
Ep = Modulus of elasticity of prestressing strand (psi)
Nu = Factored axial force in member (taken as positive if tensile) (lbs.)
Mu = Factored moment in member, but not to be taken as less than (lb.-in.)
Vu = Factored shear force in member (lbs.)
Vp = Vertical component of the prestressing force resisting shear (lbs.)
The nominal shear capacity of a concrete member shall be taken as:
0.25 Equation 6.4
Where the concrete contribution to the shear strength of the member shall be taken as:
′ Equation 6.5
and the steel contribution to the shear strength of the member shall be taken as:
140
cot cot sin Equation 6.6
where:
∅ Equation 6.7
where: β = Variable relating the concrete’s resistance to slip across a crack
′ = 28-day compressive strength of concrete (psi)
bw = The minimum gross web width inside depth of dv (inches) (not reduced to account for the post-tensioning ducts)
dv = Effective shear depth measured perpendicular to the neutral axis between the compressive and tensile resultants due to flexure, but not to be taken as less than the greater of 0.9*(transformed steel area’s depth) or 0.72h.(inches)
Av = Area of shear reinforcement within a distance s. (in2)
fy = Yield strength of transverse steel. (psi)
θ = Angle of inclination of diagonal compressive stresses. (degrees)
α = Angle of inclination of transverse reinforcement to the longitudinal axis. (degrees)
s = Transverse reinforcement longitudinal spacing. (inches)
λduct = The quadratic reduction factor applied to Vs that accounts for the reduction in the strength of the compressive diagonal due to the presence of a post-tensioning duct. (unitless)
Øduct = The nominal duct diameter present in the girder web within a depth of dv. (inches)
δ = The duct diameter correction factor (unitless) δ = 2.0 for grouted ducts δ = not given for ungrouted (empty) ducts (due to lack of data)
6.6 Future Work
The literature contains only three shear tests on girders with ungrouted (empty) post-tensioning ducts. These three tests were performed on girders with large transverse reinforcement ratios, which caused their design shear strengths to be governed by the upper limit of the AASHTO General shear design procedure. Therefore, the recommendation for a duct diameter correction factor (δ) addressing ungrouted ducts is withheld from the recommendations provided within this chapter. It is hoped that future testing will provide more insight into the shear behavior of girders containing ungrouted post-tensioning ducts and result in a recommended duct diameter correction factor (δ) for ungrouted ducts.
141
References
AASHTO, 1994. LRFD Bridge Design Specifications, Washington D.C.: American Association of State and Highway Transportation Officials.
AASHTO, 2013. LRFD Bridge Design Specifications. 6th ed. Washington D. C.: American Association of State and Highway Transportation Officials.
Avendaño, A. R. & Bayrak, O., 2008. Shear Strength and Behavior of Prestressed Concrete Beams, Austin: Center for Transportation Research.
Bentz, E. C., Vecchio, F. J. & Collins, M. P., 2006. Simplified Modified Compression Field Theory for Calculating Shear Stregnth of Reinforced Concrete Elements. ACI Structural Journal, July-August.pp. 614-624.
Bergmeister, K., Breen, J. E., Jirsa, J. O. & Kreger, M. E., 1993. Detailing for Structural Concrete, s.l.: Center for Transportation Research.
Birrcher, D. et al., 2009. Strength and Serviceability Design of Reinforced Concrete Deep Beams, s.l.: Center for Transportation Research at The University of Texas at Austin.
Campbell, T. I. & Batchelor, B. d. V., 1981. Effective Width of Girder Web Containing Prestressing Duct. Journal of the Structural Division Proceedings of the American Society of Civil Engineers, 107(ST5), pp. 733-744.
Campbell, T. I., Batchelor, B. d. V. & Chitnuyanondh, L., 1979. Web Crushing in Concrete Girders With Prestressing Ducts in the Web. Journal of the Prestressed Concrete Institute .
Castrodale, R. W. & White, C. D., 2004. Extending Span Ranges of Precast Prestressed Concrete Girders, Washington DC: National Cooperative Highway Research Program.
Chitnuyanondh, L., 1976. Shear Failure of Concrete I-Beams with Prestressing Ducts in the Webs, Kingston, Ontario, Canada: Queen's University.
Collins, M. P. & Mitchell, D., 1997. Prestressed Concrete Structures. Ontario: Response Publications.
Gallardo, J. M., 2014. Model of Strain-Related Prestress Losses in Pretensioned Simply Supported Bridge Girders, Austin: The University of Texas at Austin.
Hawkins, N. M. & Kuchma, D. A., 2007. Application of LRFD Bridge Design Specifications to High-Strength Structural Concrete: Shear Provisions, Washington, D.C.: National Coopertative Highway Research Program.
Hawkins, N. M. et al., 2005. NCHRP Report 549: Simplified Shear Design of Structural Concrete Members, Washington, D.C.: Transportation Research Board.
142
Hovell, C. et al., 2013. Structural Performance of Texas U-Beams at Prestress Transfer and Under Shear-Critical Loads, s.l.: University of Texas at Austin. Center for Transportation Research (CTR).
Khaldoun, R. N. & Collins, M. P., 1999. Background to the general method of shear design in the 1994 CSA-A23.3 standard. Canadian Journal of Civil Engineering, Volume 26, pp. 827-839.
Khaleghi, B., Seguirant, S. & White, C., 2011. Project Advisory Panel Review of Phase I Experimental Program. Austin, s.n.
Kuchma, D., 2013. Effect of Ducts on Shear Strength of Prestressed and Non-Prestressed Members [Interview] (15 June 2013).
Lee, S.-C., Cho, J.-Y. & Oh, B.-H., 2010. Shear Behavior of Large-Scale Post-Tensioned Girders with Small Shear Span-Depth Ratio. ACI Structural Journal, March-April, 107(2), pp. 137-145.
MacGregor, J. G. & Hanson, J. M., 1969. Proposed Changes in Shear Provisions for Reinforced and Prestressed Concrete Beams. ACI Journal, April.pp. 276-288.
Muttoni, A., 2014. Influence of post-tensioning ducts on shear strength what we know and what remains to be investigated [Interview] (24 April 2014).
Muttoni, A., Burdet, O. L. & Hars, E., 2006. Effect of Duct Type on Shear Strength of Thin Webs. ACI Structural Journal, pp. 729-735.
Nakamura, E., Avendano, A. R. & Bayrak, O., 2013. Shear Database for Prestressed Concrete Members. ACI Structural Journal, 110(6).
PTI, 2012. Specification for Grouting of Post-Tensioned Structures. 3rd ed. Farmington Hills(MI): The Post-Tensioning Institute.
Ramirez, J. A. & Breen, J. E., 1991. Evaluation of a Modified Truss-Model Approach for Beams in Shear. ACI Structural Journal, pp. 562-571.
Rezai-Jorabi, H. & Regan, P. E., 1986. Shear resistance of presterssed concrete beams with inclined tendons. The Structural Engineer, 64B(3), pp. 63-75.
Ritter, W., 1899. Die Bauweise Hennebique. Schweizerische Bauzeitung, 33(7), pp. 59-61.
Ruiz, M. F. & Muttoni, A., 2008. Shear Strength of Thin-Webbed Post-Tensioned Beams. ACI Structural Journal, Issue May-June.
Rupf, M., Ruiz, M. F. & Muttoni, A., 2013. Post-tensioned girders with low amounts of shear reinforcement: Shear strength and influence of flanges. Engineering Structures, pp. 357-371.
143
Vecchio, F. J. & Collins, M. P., 1986. The Modified Compression-Field Theory for Reinforced Concrete Elements Subjected to Shear. ACI Journal , pp. 219-231.
Wald, D. M., 2012. Experimental Investigation of Crushing Capacity of I-Girder Webs Containing Post-Tensioning Ducts, s.l.: The University of Texas at Austin.
Williams, C. et al., 2013. TxDOT Project 0-6652 Interim Technical Memorandum – Task 5: Industry Survey, s.l.: s.n.
145
Appendix A. Panel Testing Data
Introduction
Due to the high cost associated with full-scale testing, the shear behavior of post-tensioned girders has been frequently investigated using small-scale panel tests. Results from these panel tests have been used to calibrate the web width reduction factors currently in use in AASHTO (2013) as well as those within Eurocode2. This appendix provides the relevant information from the panel testing program conducted at the Phil M. Ferguson Structural Engineering Laboratory (FSEL) prior to the beginning of the full-scale girder testing program. Further information on this study which includes 100 panel tests can be found in Wald (2012), which was the source for the information provided in this appendix.
Figure 0.1: Dimensions of Panel Tests shown in Appendix A
Notation
The following eleven tables summarize the 100 tests performed on panel specimens during this experimental study. The notation used in these tables is as follows:
bw = Measured gross panel thickness, analogous to girder web width (inches)
Øduct Post-tensioning duct diameter (inches)
f'c = Compressive strength of concrete at time of testing (ksi)
f'g = Compressive strength of grout at time of testing (ksi)
Pfailure = Failure load of panel specimen (kips)
σfailure = Compressive stress on panel specimen at failure (kips)
ηD = Strength reduction factor calculated as the compressive stress of the panel at failure normalized to the average (where applicable) compressive stress of the control panel(s) within the same panel set
h
w
bw
Øduct
Panel Set One: Nominal Dimensions 5x24 inches
Panel Test Specimen
Duct Material Type or Control
SpecimenGrout
ConditionWidth(in)
bw
(in) (in.)
f’c
concrete(ksi)
f’g
grout(ksi)
Pfailure
(kips) (ksi)
Special Condition
Code
Set 1-Panel 1 Control -- 24.00 5.00 0.00 0.00 6.23 -- 380 3.17 0.61 1, 2
Set 1-Panel 2 Control -- 24.00 5.00 0.00 0.00 6.23 -- 568 4.73 0.91 1, 2
Set 1-Panel 3 Control -- 24.00 5.00 0.00 0.00 6.23 -- 625 5.21 1.00
Special Condition Code:1: Includes five sets of No. 3 'normal' hairpins in 'far' position2: Includes five sets of No. 3 'normal' hairpins in 'close' position3: Exterior of duct waxed to test bond characteristics
149
Panel Set Five: Nominal Dimensions 7x24 inches
Panel Test Specimen
Duct Material Type or Control
SpecimenGrout
ConditionWidth(in)
bw
(in) (in.)
f’c
concrete(ksi)
f’g
grout(ksi)
Pfailure
(kips) (ksi)
Special Condition
Code
Set 5-Panel 1 Control -- 23.75 7.00 0.00 0.00 3.62 -- 515 3.10 1.03
Set 5-Panel 2 Control -- 24.00 7.06 0.00 0.00 3.62 -- 494 2.91 0.97
Special Condition Code:1: Includes No. 3 'normal' hairpins in 'far' position at outer two vertical bars2: Includes No. 3 'normal' hairpins in 'far' position at all vertical bars3: Includes No. 3 'normal' hairpins in 'midway' position at outer two vertical bars4: Includes No. 3 'normal' hairpins in 'midway' position at all vertical bars5: Includes No. 3 'normal' hairpins in 'close' position at outer two vertical bars6: Includes #3 'normal' hairpins in 'close' position at all vertical bars7: Includes #3 'normal' hairpins against duct at outer two vertical bars
151
Panel Set Seven: Nominal Dimensions 7x24 inches
Panel Test Specimen
Duct Material Type or Control
SpecimenGrout
ConditionWidth(in)
bw
(in) (in.)
f’c
concrete(ksi)
f’g
grout(ksi)
Pfailure
(kips) (ksi)
Special Condition
Code
Set 7-Panel 1 Control -- 23.94 7.00 0.00 0.00 10.15 -- 1217 7.26 1.00
Set 7-Panel 2 Control -- 23.94 7.00 0.00 0.00 10.62 -- 1219 7.28 1.00
Special Condition Code:1:Includes two ducts spaced vertically apart by one duct diameter center-to-center2:Includes two ducts spaced vertically apart by two duct diameters center-to-center3:Includes two ducts spaced vertically apart by three duct diameters center-to-center4: Includes No. 3 'normal' hairpins against duct at middle vertical bar5: Includes No. 3 single-side, inverted hairpins against duct at outer two vertical bars6: Exterior of duct sanded to test bond condition
152
Panel Set Eight: Nominal Dimensions 7x24 inches
Panel Test Specimen
Duct Material Type or Control
SpecimenGrout
ConditionWidth(in)
bw
(in) (in.)
f’c
concrete(ksi)
f’g
grout(ksi)
Pfailure
(kips) (ksi)
Special Condition
Code
Set 8-Panel 1 Control -- 23.88 7.13 0.00 0.00 11.16 -- 1643 9.66 1.00
Set 8-Panel 2 Control -- 23.88 7.00 0.00 0.00 11.16 -- 1654 9.89 1.00
Special Condition Code:1: Includes No. 3 'normal' hairpins against duct at outer two vertical bars2: Includes No. 3 'normal' hairpins against duct at all vertical bars3: Includes No. 3 'normal' hairpins in 'far' position at outer two vertical bars
153
Panel Set Nine: Nominal Dimensions 7x24 inches
Panel Test Specimen
Duct Material Type or Control
SpecimenGrout
ConditionWidth(in)
bw
(in) (in.)
f’c
concrete(ksi)
f’g
grout(ksi)
Pfailure
(kips) (ksi)
Special Condition
Code
Set 9-Panel 1 Control -- 24.00 7.13 0.00 0.00 10.19 -- 1704 9.97 1.07
Set 9-Panel 2 Control -- 23.94 7.13 0.00 0.00 10.19 -- 1475 8.65 0.93
Special Condition Code:1: Includes No. 3 'normal' hairpins against duct at outer two vertical bars2: Includes No. 3 inverted hairpins against duct at outer two vertical bars3: Includes No. 3 single-side, inverted hairpins against duct at outer two vertical bars4: Includes No. 3 'flattened' hairpins against duct at outer two vertical bars5: Includes No. 3 Z-bars against duct at outer two vertical bars6: Includes No. 3 'staples' against duct at outer two vertical bars
154
Panel Set Ten: Nominal Dimensions 7x24 inches
Panel Test Specimen
Duct Material Type or Control
SpecimenGrout
ConditionWidth(in)
bw
(in) (in.)
f’c
concrete(ksi)
f’g
grout(ksi)
Pfailure
(kips) (ksi)
Special Condition
Code
Set 10-Panel 1 Control -- 24.00 7.13 0.00 0.00 9.82 -- 1533 8.96 0.93
Set 10-Panel 2 Control -- 24.19 7.13 0.00 0.00 9.82 -- 1778 10.32 1.07
Set 11-Panel 10 Control -- 23.75 9.00 0.00 0.00 9.25 -- 1197 5.60 0.94 1
Special Condition Code:1: Data not accepted – load frame error2: ηD computed based on estimated control failure load
156
157
Appendix B. Test Specimen Drawings
Introduction
Detailed drawings of the seven test girders constructed during the current study are provided in this appendix. The design of these girders outside of the end-block was guided by the current Tx62 standards which can be downloaded from the website of the Texas Department of Transportation.
'R' BAR SPACING 6" O.C. OUTSIDE OF END-BLOCKS(70) BARS @ 6" O.C. = 35'-0"
RE: SHEETS P-2 & P-3FOR END-BLOCK DETAILS
RE: SHEETS P-2 & P-3FOR END-BLOCK DETAILS
3'-0" 4'-6" 35'-0" 4'-6" 3'-0"
15'-0"END-BLOCK FORMS PROVIDED BY FSEL
15'-0"END-BLOCK FORMS PROVIDED BY FSEL
20'-0"STANDARD Tx62 FORMS PROVIDED BY PRECASTER
PRETENSIONED STEEL:- ALL STRANDS SHALL BE 0.5" DIA. LOW RELAXATIONSTRANDS
-ALL STRANDS (INCLUDING TOP STRANDS) SHALL BEBROUGHT TO FULL TENSION (0.7*Fpu)
POST-TENSIONED TENDONS:-ANCHORAGES, SPIRALS AND DUCTS WILL BE PROVIDEDTO THE PRECASTER BY THE UNIVERSITY OF TEXAS
-3" I.D. HDPE ('PLASTIC') AND GALVANIZED STEEL DUCT P-1
ELEVATION &FORMDETAILS
TE
ST
GIR
DE
R S
EV
EN
TxD
OT
SP
LIC
E G
IRD
ER
PR
OJE
CT
07/24/2013
0-6652
Date:
Project #:
ConsultantAddressAddressAddressPhone
Fer
guso
n S
truc
tura
lE
ngin
eerin
g La
bora
tory
ELEVATION & FORM DETAILS1P-1 SCALE: 1
4 " = 1'-0"
TRANSVERSE REINFORCEMENT2P-1 SCALE: 1
4 " = 1'-0"
188
RE: SHEET P-3 FORREINFORCING INFORMATION
1P-3
3P-3
2P-3
2P-2'R' BARS @ 4" O.C. OUTSIDE OF END-BLOCK
3'-8"
2'-10"
'A' BARS
'T' BARS
'R' BARS
TYPICAL Tx62 REINFORCING
9"
83 4"
31 2"
RE: SHEET P-5 FORSTRAND PATTERN
& DEBONDING DETAILS
35 1/
4"
P-2
GIRDERELEVATIONS
TE
ST
GIR
DE
R S
EV
EN
TxD
OT
SP
LIC
E G
IRD
ER
PR
OJE
CT
07/24/2013
0-6652
Date:
Project #:
ConsultantAddressAddressAddressPhone
Fer
guso
n S
truc
tura
lE
ngin
eerin
g La
bora
tory
GIRDER ELEVATION1P-2 SCALE: 1/2" = 1'-0"
STANDARD Tx622P-2 SCALE: 1" = 1'-0"
189
3'-0" 1'-6"
'U' BARS @ 2" O.C.3" 8'-0"
(8) 'H
' BAR
S @
6" O
.C. E
A. F
ACE
(TYP
)
1" 1'-8"(5) BARS @
4" O.C.
(9) 'D' BARS @ 4" O.C.
'E' BARS**NOT SHOWN
3'-0"(9) BARS @ 4" O.C. (TYP)
4'-6"(9) BARS @ 6" O.C. (TYP)
'D' AND 'DS' BARS
7'-6"START 'R' BAR 4" FROM LAST 'RE' BAR
NO 'R' BARS TO END OF TAPER (TYP)'R' BARS
(16) 'C' BARS @ 6" O.C. EA FACE (TYP)(2) 'HS' BARS @ INTERIOR CORNERS OF 'C' BARS EA FACE (TYP)
'C' BARS
ANCHORAGE FLUSHWITH BEAM END
START SPIRAL REBARAT ANCHOR PLATE
'A' BARS @ 1'-0" O.C.'T' BARS @ 6" O.C.
3" C
LR2"
(5) 'DS' BARS @ 4" O.C.'D', 'RC', & 'RE' BARSALIGNED, BEGIN AT
3" FROM BEAM FACE
'H' BARS
'D' BARS OMITTEDAT SPIRAL
111 2"
'RC' AND 'RE' BARS
TEND
ON LO
CATE
D 35
.25"
FROM
BTM
OF
BEAM
'HS' BARS12" LAP
'RC' BARS
'A' BARS (TOP)
'T' BARS (TOP)
'H' BARS EA FACE (TYP)
'D' BARS
'E' BARS AND SPIRALAT ANCHORAGE HEADS
'U' BARS (BOTTOM)
'C' BARS (BOTTOM)
1" C
LR
1" CLR
ANCHORAGEHEAD
1" C
LR
RE: DETAIL 2/P-3 FOR BARSPACING REQUIREMENTS
2'-10"
3'-8"
'RE' BARS
'D' BAR AT OUTSIDE FACE.RE: 2/P-3 FOR MORE INFO
24"
'HS' BARS (BOTTOM) (TYP)
'D' BARSOMITTED AT SPIRAL
'DS' BARS
'H' BARS'RE & RC' BARS BUNDLED AS NEEDED
'RC' BARS
'RE' BAR
3'-0"4'-6"
2'-0" 9"
ADDN'L'D' BAR
RE: DETAIL 2/P-3 FOR BARSPACING REQUIREMENTS
P-3
PRELIMINARYEND REGIONLAYOUT
TE
ST
GIR
DE
R S
EV
EN
TxD
OT
SP
LIC
E G
IRD
ER
PR
OJE
CT
07/24/2013
0-6652
Date:
Project #:
ConsultantAddressAddressAddressPhone
Fer
guso
n S
truc
tura
lE
ngin
eerin
g La
bora
tory
ELEVATION AT END REGION2P-3 SCALE: 1/2" = 1'-0"
PLAN VIEW AT END REGION3P-3 SCALE: 1/2" = 1'-0"
ELEVATION AT END REGION1P-3 SCALE: 1" = 1'-0"
190
H
O
G
GIRDER LENGTH - 3"
MIN. LAP
H
CB
A
B
C
A
K
C
B
D
A
B
C
D
B
GA
2
B A
16
E SPIRAL30S11S4
STRAIGHT (2)STRAIGHT (1)
P-4
REBARSCHEDULE
TE
ST
GIR
DE
R S
EV
EN
TxD
OT
SP
LIC
E G
IRD
ER
PR
OJE
CT
07/24/2013
0-6652
Date:
Project #:
ConsultantAddressAddressAddressPhone
Fer
guso
n S
truc
tura
lE
ngin
eerin
g La
bora
tory
REINFORCING DIMENSIONSNOT TO SCALE
1P-4
191
80 S
TR
AN
DS
TO
TA
LA
LL S
TR
AN
DS
12
" D
IAM
ET
ER
LO
W-L
AX
21 2"
14 COLUMNS @ 2" = 2'-2"STRAND PATTERN SYMMETRIC ABOUT CENTER-LINE
STRANDS DEBONDEDTO 54-INCHES FROMBEAM FACE
TOP STRANDS BROUGHT TO FULL STRESS** THESE ARE NOT HARPED STRANDS BUTSTRAIGHT THROUGH THE LENGTH OF BEAM
2.5"4.5"6.5"8.5"
10.5"
56.5"
58.5"
54.5"
12.5"14.5"16.5"18.5"20.5"
P-5
DEBONDINGLAYOUT
TE
ST
GIR
DE
R S
EV
EN
TxD
OT
SP
LIC
E G
IRD
ER
PR
OJE
CT
07/24/2013
0-6652
Date:
Project #:
ConsultantAddressAddressAddressPhone
Fer
guso
n S
truc
tura
lE
ngin
eerin
g La
bora
tory
STRAND DEBONDING PATTERN1P-5 SCALE: 1" = 1'-0"
192
193
Appendix C. Tx62 Specimen Shear Strength Calculations
Introduction and Notation
The following tables summarize the shear strength calculations of the specimens tested during this experimental program. The notation used in these tables is as follows:
β = Variable relating the concrete’s resistance to slip across a crack
f'c = Compressive strength of concrete at time of testing (psi)
bw = Minimum gross web width inside depth of dv. (inches)
bv = Minimum web width inside depth of dv reduced to account for the post-tensioning ducts. (inches)
Øduct Post-tensioning duct diameter. (inches)
λduct = Proposed shear strength reduction factor to account for the reduction in transverse reinforcement contribution to shear strength. (unitless)
dv = Effective shear depth measured perpendicular to the neutral axis between the compressive and tensile resultants due to flexure, but not to be taken as less than the greater of 0.9*(transformed steel area’s depth) or 0.72h.(inches)
Mu = Factored moment in member, but not to be taken as less than (lb.-in.)
Vu = Factored shear force in member (lbs.)
Vp = Vertical component of the prestressing force resisting shear (lbs.)
Aps = Area of prestressing steel on the tension side of member (in2)
fpo = ∆ ∗ (psi)
Δεp = Strain differential between prestressing strand and concrete (in./in.)
Ep = Modulus of elasticity of prestressing strand (psi)
εs = Estimated strain at mid-height of cross-section (in/in)
Av = Area of shear reinforcement within a distance s. (in2)
fy = Yield strength of transverse steel. (psi)
θ = Angle of inclination of diagonal compressive stresses. (degrees)
s = Transverse reinforcement longitudinal spacing. (inches)
K = Variable relating to the state of stress in the concrete
fpc = The unfactored compressive stress in the concrete after prestress losses have occurred either at the centroid of the cross-section resisting live loads for at the web-to-flange interface when the centroid lies in the flange. (psi)
194
fpe = Compressive stress in concrete due to effective prestress forces only (after losses) at extreme fiber of section where tensile stress is caused by externally applied loads (psi)
yt = Distance from centroidal axis of gross section, neglecting reinforcement, to tension face (in.)
fd = Stress due to unfactored dead load, at extreme fiber of section where tensile stress is caused by externally applied loads (psi)
Shear Strength calculations using the Current AASHTO (2013) General Procedure
Appendix D. Evaluation Database for Post-Tensioned Girders
Introduction
All references (outside of the experimental program described within this report) are shown in Table D.1 while their full citations are given in the list of references of this report.
Table D.1: References of the Evaluation Database for Post-Tensioned Girders
No. Authors Year Publication Number of Tests in Publication
Number of Tests in Eval. Database
1 Chitnuyanondh 1976 Dissertation 13 6
2 Rezai-Jorabi and Regan
1986 The Structural Engineer
13 7
3 Ruiz and Muttoni 2008 ACI Structural Journal
6 6
4 Lee, Cho, and Oh 2010 ACI Structural Journal
11 7
5 Rupf, Ruiz, and Muttoni
2013 Engineering Structures
12 8
200
Notation
This appendix provides detailed information of the 34 tests included in the Evaluation Database for Post-Tensioned Girders that were not part of the current study. The notation used in this appendix is as follows (adopted from Nakamura (2011):
SpecimenI.D. = Specimen identification as reported in original reference
f'c = Concrete compressive strength (ksi)
h = Overall specimen height including deck where applicable (inches)