Shear-flexure behaviour of prismatic, single stirrup, hollow cylindrical cross section, spun-cast reinforced concrete members Theses of the PhD Dissertation István VÖLGYI Budapest University of Technology and Economics (BME) Supervisor: Dr. György FARKAS Professor Budapest University of Technology and Economics (BME) Budapest, 2011.
Transcript
Shear-flexure behaviour of prismatic, single stirrup, hollow cylindrical cross section,
spun-cast reinforced concrete members
Theses of the PhD Dissertation
István VÖLGYI Budapest University of Technology and Economics (BME)
Supervisor:
Dr. György FARKAS Professor
Budapest University of Technology and Economics (BME)
Budapest, 2011.
1
1. Introduction …………………………………………………………........... 2 1.1. The examined type of member ………………………………………… 2 1.2. Research goals, research program organisation ………………………… 2 2. Examination of compressive strength of spun-cast concrete ………… 3 2.1. Introduction of experimental program ………………………………... 3 2.2. Summary of results ………………………………...................................... 4 3. Non-destructive strength estimation of spun-cast concrete ………… 5 3.1. Introduction of experimental program ………………………………... 5 3.2. Summary of results ………………………………...................................... 5 4. Force application questions ……………………………….......................... 7 4.1. Introduction of experimental program ……………………………….. 7 4.2. Summary of results ………………………………..................................... 7 4.3. Recommended mechanical model ……………………………….............. 9 5. Shear-resistance behaviour ……………………………….......................... 10 5.1. Introduction of experimental program ……………………………….. 10 5.2. Summary of results ………………………………...................................... 11 5.3. Recommended mechanical model ……………………………….............. 13 5.4. The modified mechanical model for sizing and its practical applications 15 6. New Scientific Results ……………………………….......................... 16 7. Related publications ……………………………….......................... 18 8. Further possible research directions ……………………………….. 19
2
1. Introduction 1.1. The examined type of member Spinning is an especially economical and productive method for manufacturing pole members which have a ring cross section. After loading the mix and sealing the form, a compaction machine spins the form about its longitudinal axis. The centrifugal force squeezes the mixture to the wall of the form. A result of the compaction method is that the cross section is always hollow and the spun element has an especially compact outer surface. Spun-cast concrete members were traditionally used worldwide for lighting and utility poles and for driven piles. The evolution of concrete technology, higher strength, higher productivity, and enhanced aesthetic appearance has led designers to new areas of usage. In recent decades, spun-cast elements have appeared in bridge superstructures and in buildings. Meanwhile, spun-cast concrete members are once again the topic of research, because the new areas of use impose new requirements on the members. One such topic is the shear resistance of the members, which may govern in the case of wind, earthquake, or impact loads. 1.2. Research goals, research program organisation Standardized shear sizing algorithms are based theoretical and experimental studies on support elements which have a web parallel to the shear force. For the economical and safe sizing of ring cross sectional members, it is necessary to analyse the shear behaviour of such elements. The ring cross section without diaphragm also requires the clarification of force application. The models also require the knowledge of the strength of spun-cast, low water-cement ratio concretes. The goal of the dissertation is the elaboration of the following topics: • the relationship between the strengths of vibrated and spun-cast concrete, prepared
from the same mix; • the preparation of a non-destructive procedure to estimate the strength of spun-cast
concrete, in order to determine the strength of those elements which cannot be examined destructively due to geometry or other reasons;
• the answers to the questions related to the application of radial forces on a ring cross section member. The goal of the experiments is to determine a method of force application and to ascertain the load bearing modes in the area of application. Another goal is to create a calculation model capable of determining the reactions to radial force application upon ring cross section members;
• the final goal of the dissertation is to reveal the phenomena before and during the shear-flexural failure of ring cross section, single stirrup, spun-cast concrete members as well as to create a load bearing model which:
o is adequate for taking the changes in parameters which affect load bearing capacity into consideration;
o agrees with the conclusions of the crack and fracture analysis; o agrees with the conclusions of the previous three topics; o leads to safer and more economic results than those of the shear models
found in literature; o can be used in practice.
The research follows the strategy outlined in Figure 1.
3
Figure 1. The organisation of the research, the relationships of the dissertation topics
2. Examination of compressive strength of spun-cast concrete 2.1. Introduction of experimental program In recent decades, the market and standards requirements for high strength and durability in precast structures led to significant reductions in the water-cement ratio for spun-cast concrete as well. This necessitates the actualisation to today's circumstances of earlier determinations regarding the strength of spun-cast concrete. The concrete mixes used in the experimental program represent the normal strength mixes currently used in Hungary for spun-cast products. The composition of the examined mixes are summarized in Table 1. Table 1. Used mixes
Mixture Sand Cement typeCement
[kg]Water [kg]
Fineness modulus U70/10
0-4 2-8 4-8 8-16 0-5 5-12A 31,9% 25,3% 42,8% CEM I 42,5 R 460 150 6,20 26,9B 34,0% 25,0% 41,0% CEM I 42,5 R 420 143 6,35 31,2C 32,0% 25,0% 43,0% CEM I 42,5 R 420 143 6,43 30,4D 19,0% 32,0% 24,0% 25,0% CEM I 52,5 N 400 136 6,30 19,4E 43,0% 30,0% 27,0% CEM I 52,5 N 420 143 6,03 22,8F 40,0% 25,0% 35,0% CEM I 52,5 N 420 143 6,55 14,7G 50,0% 10,0% 40,0% CEM I 52,5 N 460 138 6,06 15,7H 67,0% 33,0% CEM I 52,5 N 495 150 5,54 16,0I 45,0% 25,0% 30,0% CEM I 52,5 N 495 150 6,00 24,8
The structure of spun-cast concrete is organised due to the centrifugal force arising during compaction. The outer region has a higher density of aggregate size, while the inner region has a lower density with an abundance of cement paste. The degree of organisation depends upon the mix and compaction parameters. The change of strength characteristics of spun-cast concrete through the wall depend upon the degree of organisation and the achieved compaction. These phenomena-influencing characteristics were chosen as the parameters of the experimental series. The parameters derived from the concrete technology and compaction characteristics were created by the Author. The parameters of the experimental series and the course of the research are summarised in Figure 2.
4
Figure 2. Parameters of experimental series examining strength of spun-cast concrete
Fresh concrete examinations were conducted on one of the Ø500/200 mm test specimen pair immediately after compaction. The composition and density of the inner, central, and outer regions of the test specimen were determined. It was determined that these results confirm organisation and its degree, however, the significant human factor prevents a quantitative description. Five compaction categories were defined for spun-cast concrete based upon the tendency of the density values and visual observations of the various regions. A compaction factor was defined for the ratio of required to actual work of compaction. On the other test specimen of the pair and on the simultaneously-prepared etalon vibrated test specimen, strength tests were conducted once each cured. Figure 3 shows the used test specimens and results.
Figure 3. Test specimens used for strength tests of spun-cast concrete
2.2. Summary of results Statistical methods were used to examine the derived parameters (paste excess, nominal surface of stone fraction, compaction factor) and the relationship of the strength of the spun-cast concrete to the vibrated test specimen. On the basis of the results, the ratio of the strength of the outer region of the spun-cast concrete to that of the identical mix vibrated test specimen depends significantly upon the compaction factor. Figure 4 shows the regressive relationship of the two physical quantities.
5
Figure 4. Strength ratio of outer region of spun-cast concrete to identical mix vibrated test specimen as a function of the compaction factor (I-V: compaction classes)
Figure 5. Increment of strength of spun-cast concrete inwards along wall thickness as a function of the compaction factor and paste excess (I-V: compaction classes)
The strength of the outer region of spun-cast concrete with a low water-cement ratio (0.3-0.4) is less than that of the vibrated test specimen in the case of insufficient compaction and over-compaction. The amount of organisation along the wall thickness increases with compaction work and paste excess (VP+), which also appears in the respective change in strength. Figure 5 shows this regressive relationship. 3. Non-destructive strength estimation of spun-cast concrete 3.1. Introduction of experimental program Section 2 showed that depending upon various parameters the strength of spun-cast concrete can differ significantly from that of identical mix vibrated concrete. Therefore, direct examination of the strength of spun-cast concrete is important. The destructive strength examination of spun-cast concrete often has physical limits in practice – as well as in the case of the experimental series. Thus, the elastic rebound non-destructive strength test used during and after manufacture arises. The examinations showed that evaluation according to Borján (Nehme), MSZ 4715-5:1972, or MSZ EN 13791:2007 of the rebound values measured on the surface often leads to over-estimation of the strength of spun-cast concrete. The reason is the significant accumulation of stone fraction in the outer region of the wall. A parametric experimental series was conducted using the test specimens of Section 2 to determine a relationship in the case of low w/c ratio, quartz aggregate, normal strength spun-cast concrete.
Figure 6. Schmidt N hammer examinations on spun-cast and vibrated test specimens
3.2. Summary of results In most cases the butt end of the members is inaccessible – typically for strength estimation afterwards. For such cases, a simplified procedure was prepared which estimates the strength of the outer region of wall based exclusively on the rebound values measured on the outer surface (Rsur). This nature of this procedure prevents it from giving information on the
6
strength of the inner regions of the wall. The suggested relationship for the expected value of the strength of the outer region of the spun-cast concrete (fcm,out) is as follows:
The compaction class of the concrete in such examinations is usually unknown. The relationship between elastic rebound and strength is not independent of the accumulation of the stone fraction in the outer region, so the relationship has a systematic error. In the case of concretes in compaction categories IV and V, the formula leads to the over-estimation of strength. The compaction categories were known during the experiment, which allowed the preparation of a corrective function (∆) after the analysis of residual deviations. If the compaction class of the concrete is unknown, Class V is recommended.
-10
-8
-6
-4
-2
0
2
4
1 2 3 4 5
Compaction class
Dif
fere
nce
of
mea
sure
d t
o
calc
ula
ted
co
mp
ress
ive
stre
ng
th [
MP
a]
residual gap
proposed correction
Figure 7. The recommended ∆ corrective function as a function of compaction class
If the butt end of the member is accessible – typically the case of quality control at manufacture – the non-destructive examination can be performed in the three regions of the butt end as well as on the outer surface and the vibrated test specimen. The tendency of rebound values measured in various regions shows a definite relationship with the compaction class.
35
40
45
50
55
60
I. II. III. IV. V.
Sch
mid
t re
bo
un
d i
nd
ex
Figure 8. Rebound values typically measured in various regions. One typical set of results for each
compaction class
A system of criteria was defined which, along with the non-destructive examination of the element, helps determine the compaction class of spun-cast concretes. The resulting compaction class can be used in the corrective function of the simplified method, or – combined with the strength of the vibrated test specimen – as the input of the strength estimation procedure introduced in Section 2. This latter procedure was used to determine the strength of the test specimens for the force application and shear experiment series introduced in the remainder of the dissertation.
7
4. Force application questions 4.1. Introduction of experimental program One characteristic of ring cross sectional members is that the arrangement of forces related to force application as well as its effect on global load bearing resistance are not insignificant in the case of partial loading. In the area of force application, a radial arrangement of forces develops, similar to that found in concrete pipes loaded on edge. The goals of the experimental program were as follows:
• observation of local failure modes and the respective fracture forces; • observation of the phenomena of radial load bearing and crack pattern, and
thereby preparation of the model and the analyses of crack patterns of the shear experiments;
• selection of a force application method to prevent local failure in the shear experiments;
• creation of a model which allows local load bearing capacity calculations in the case of parameters which differ from those of the experiment.
•
Figure 9. Arrangement and locations of measurement for force application experiments
The experimental series was conducted with opposing load and support elements, as well as with straddled support elements. Test specimens with a diameter of 30 cm were used to examine the effects on radial load bearing of wall thickness (5.5; 9 cm), longitudinal reinforcement (12×Ø10; Ø14), transversal reinforcement (s=Ø5/75; /150 mm; no stirrups), length (33; 63; 93; 123 cm), number of load elements (1; 2; 4), angle of force application (30°; 60°; 90°), and axis spacing (18; 35; 45; 55; 65; 85 cm). The numbering of the test specimens is ordered on the characteristics shown here. The experimental arrangement and the locations of ring displacement measurements are shown in Figure 9. 4.2. Summary of results The fracture patterns of the 24 test specimens could be divided into three groups:
• frame fracture of cross section (local); • crump beneath load element (local); • shear failure (global).
The frame fracture of the cross section resembles the failure mode of concrete pipes loaded on edge, typical of test specimens with thin walls and low angle of force application. However, there are several differences worth discussing. In the current case, the force application is partial in the direction of the element axis, and variable in the radial direction. The former
8
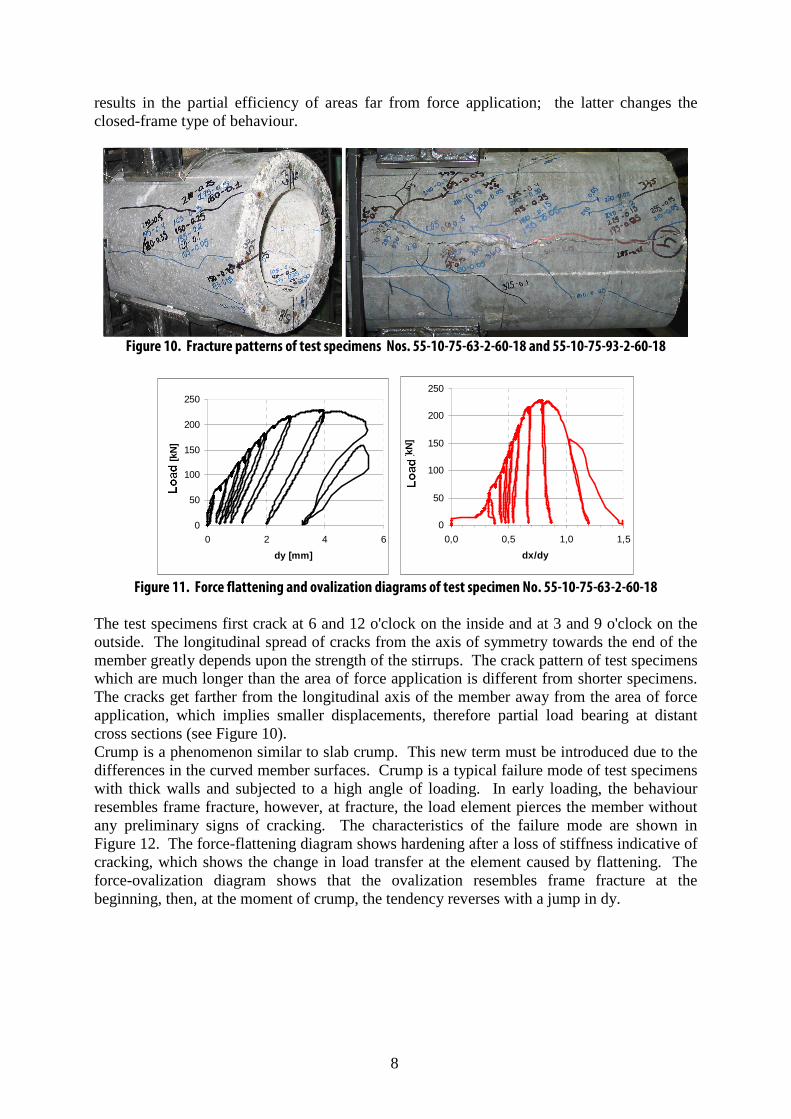
results in the partial efficiency of areas far from force application; the latter changes the closed-frame type of behaviour.
Figure 10. Fracture patterns of test specimens Nos. 55-10-75-63-2-60-18 and 55-10-75-93-2-60-18
0
50
100
150
200
250
0 2 4 6
dy [mm]
Erő
[kN
]
0
50
100
150
200
250
0,0 0,5 1,0 1,5
dx/dy
Erő
[kN
]
Figure 11. Force flattening and ovalization diagrams of test specimen No. 55-10-75-63-2-60-18
The test specimens first crack at 6 and 12 o'clock on the inside and at 3 and 9 o'clock on the outside. The longitudinal spread of cracks from the axis of symmetry towards the end of the member greatly depends upon the strength of the stirrups. The crack pattern of test specimens which are much longer than the area of force application is different from shorter specimens. The cracks get farther from the longitudinal axis of the member away from the area of force application, which implies smaller displacements, therefore partial load bearing at distant cross sections (see Figure 10). Crump is a phenomenon similar to slab crump. This new term must be introduced due to the differences in the curved member surfaces. Crump is a typical failure mode of test specimens with thick walls and subjected to a high angle of loading. In early loading, the behaviour resembles frame fracture, however, at fracture, the load element pierces the member without any preliminary signs of cracking. The characteristics of the failure mode are shown in Figure 12. The force-flattening diagram shows hardening after a loss of stiffness indicative of cracking, which shows the change in load transfer at the element caused by flattening. The force-ovalization diagram shows that the ovalization resembles frame fracture at the beginning, then, at the moment of crump, the tendency reverses with a jump in dy.
9
0
100
200
300
400
500
600
0,0 1,0 2,0 3,0
dy [mm]
Erő
[kN
]
0
100
200
300
400
500
600
0,0 0,5 1,0
dx/dy
Erő
[kN
]
Figure 12. Fracture pattern of test specimen No. 55-10-75-63-2-90-18 viewed from below, and its force-
flattening and force-ovalization diagrams
4.3. Recommended mechanical model An analytical mechanical model was created based on the experience of the experiments in order to calculate the fracture force which causes the two local failure modes. The model of the frame fracture resistance assumes radial force application increasing linearly with the angle from the fibre at 12 o'clock to the edge of the load element due to cross sectional flattening (see Figure 13). The crumped wall with only outer stirrups cannot bear load at 12 and 6 o'clock. Here, the model assumes a hinge in the outer fibre of the wall. The counterforce of the horizontal component of the load (Fx) is the load in the hinge. The force couple reduces the eccentricity of the load arising at the plastic hinges developing at 3 and 9 o'clock. The eccentric load is balanced by the sections at 3 and 9 o'clock. The determination of the effective width of the 3 o'clock cross section is shown in Figure 13. The crump resistance model examines the balance of the crump surface taken at a distance of v/2 around the load elements. The thickness of a substitute plate (v*) is identified as the length of a section cut from a vertical line drawn at the point of examination (see Figure 14). The relationship recommended for calculating crump resistance (Fb) summarizes the tensile strength of the concrete around the perimeter of the crump:
The consideration of reinforcement perpendicular to the crump occurs similarly to the examination of crump in standard MSZ EN 1992-1-1. This model identifies the failure mode well in all 24 cases. The average ratio of calculated to measured fracture force is 96%, the coefficient of variation is 9.7%. In the majority of cases, the model is on the safe side; the error in the underestimated cases was less than 10%. A tendency error was not observed in the series of calculated fracture forces. Therefore, the model is applicable for determining the expected resistance to local fracture of ring cross section concrete members examined in the experimental program.
Figure 13. Calculation details of cross sectional resistance to frame fracture
10
Figure 14. The crump surface and the calculation of the substitute wall thicknes
5. Shear-resistance behaviour 5.1. Introduction of experimental program Current standardized sizing algorithms rely on the theory of various truss analogies or assumed stress fields. These theories ignore compatibility constraints arising from the fracture pattern typical of the failure mode and the movement of cracked parts. Shear resistance is attributed to the play of forces in a web parallel to the shear force. The shear resistance of hollow, "curved web", ring cross section members cannot be explained with these theories in unchanged form. The description of the shear load bearing of ring cross section members is based on the hypothesis – built on an earlier theory of Juhász, Korda, Walther – that the shear resistance of concrete members should be examined along a slanted critical fracture section typical for such loadings. The member is exhausted by the effects of calculable shear, normal, and flexural stresses along the critical section. Fracture arises from the disappearance of the ever-decreasing compression zone due to compatibility constraints. Shear load bearing capacity is the sum of the resistances of the compression zone and the steel intersecting the critical section. To study the phenomena, an experimental program of 48 examinations was assembled, using for the 30 cm diameter test specimens the parameters of wall thickness (v = 5.5; 9 cm), longitudinal reinforcement (12× Ø12; Ø14; Ø16), transversal reinforcement (s = Ø5/75; (/110); /150 mm; no stirrups), axial spacing of support and load elements (a = 625; 825; 975 mm), and the stress level of the test specimens (-; F1; F2). In the case of stressed test specimens, 4 or 12 longitudinal bars were replaced by prestressed tendons. The numbering of the test specimens is ordered on the characteristics shown here. The experimental arrangement and the locations of electronic measurements are shown in Figure 15.
Figure 15. Arrangement and measurement techniques of the shear experiments
11
5.2. Summary of results The failure modes of the test specimens could be divided into three indistinct groups:
• flexural failure; • shear-flexural failure with extraction of longitudinal reinforcement; • shear-flexural failure.
Henceforth, only the shear-flexural failure relevant to the research goal is discussed. The results of 45 experiments were used to create the model. The failure mechanism is shown in Figure 16 with the help of test specimen No. 9-16-150-825. During load increase, the first cracks appeared beneath the load element in the area of the outer tensile fibre (Figure 16, crack No. 1). The cracks propagated quickly at first, then slowly along the neutral axis shown in Figure 16. by a horizontal line (assuming stress level III). The cracked region expanded towards the support with increased load level. Moving away from the load element, the cross sections experience decreasing flexural and increasing shear forces. This explains the decreasing slant of the cracks.
Figure 16. Crack pattern of test specimen No. 9-16-150-825 just before fracture
The photograph was prepared during the increasing slope of the force-deflection diagram, i.e. the stresses caused by external loads are balanced along all member cracks (sections). To understand the behaviour, it is important to explain why the section indicated by a thick line is critical. The tensile zones of crack No. [3] coincide with the critical section, but the crack reaches the compression zone much earlier than the load element, which results in increased load capacity, as shown in Section 5.3. It is interesting to note that crack No. [4], which has an identical upper section but fewer activated stirrups, is not critical. The explanation is that the adhesion zone of the longitudinal bars, which carry significant tensile and shear stresses, is loosened. This causes the flattening of the tensile belt section of the cracks, which results in the increase of the critical crack width and thus length. This is how the compression zone of the critical section extends well above that calculated by assuming pure flexure. On the diagram, a line connects the crack tips in the area of the load element. It is clear that, with distance from the element, the crack tips are located ever higher, despite decreasing flexural stress. This effect is the apparent softening of the longitudinal bars due to the loosening adhesion zone. Another point of interest is why crack No. [5] is stable at the fracture force level. This crack similarly activates an equal number of stirrups as the critical crack, but it reaches the level of the calculated neutral axis so far from the load element that the compression force calculated from flexure at that point is much lower. This results in higher shear resistance (see Section 5.3.). The analysis of the relative movement of the two parts of the crack determines that those move dominantly vertically in the tensile zone, but expand equally on the member longitudinal axis and vertical directions up to the moment of fracture in all cases (see Figure
2
5
4 1
3
12
17). Thus, the movement of the cracked parts at the level of the member axis makes a 60-70° angle with a 45° slanted crack. The crack width in this zone at member fracture is typically 1-2 mm. These conditions prevent effective crack friction in the tensile zones of the critical section (see Figure 18).
Figure 17. Movement of cracked parts at critical
section (Source: Muttoni)
Figure 18. Effective crack friction is not possible in the case of movement direction and magnitude
measured in the web
The effects of the examined parameters on member fracture force and behaviour were studied. The most important phenomena dependent upon parameter changes are: Wall thickness: A decrease in wall thickness leads to a decrease in fracture force. The cause is the decreased resistance of the smaller concrete zone caused by the deteriorated adhesion of the longitudinal bars subjected to extractive force and transversal displacement in the thinning wall reinforced only on the outer side. Quantity of longitudinal reinforcement: A decrease in longitudinal reinforcement leads to a decrease in fracture force. The smaller quantity of longitudinal reinforcement results in a smaller compression zone and its lower resistance. Quantity of stirrups: An increase in stirrup quantity leads to an increase in fracture force. The shape of the critical section does not depend upon the stirrup quantity; the load capacity increment is a result of the increased number of stirrups intersecting the section. The relationship is approximately linear, but the test specimens without stirrups also exhibit significant resistance after the appearance of shear cracks. Therefore, the compression zone resistance is active even without stirrups. The extent of cracking in test specimens without stirrups is intensive, and crack areas running parallel to longitudinal bars is typical. Force-support distance: Fracture force increases with a decrease in force-support distance. This cannot be explained by the shear reduction given in several standards, because in every case the critical section is entirely between the support and the load element. Consequentially, the full load is balanced in the critical section. The geometry of the critical section changes, and its horizontal projected length decreases necessarily, which decreases the number of effective stirrups. The increase in fracture force is due to the geometric change of the effective compression zone. As discussed in Section 5.3., the compression zone resistance is greater in the case of the section closer to the load element. Effect of normal force: Several series of experiments prove the beneficial effect of concurrent compression upon shear resistance. However, these experiments have shown that in the case of prestressed members the beneficial effect of compression is significantly reduced by the unfavourable properties of tendons compared to steel reinforcement. Tendons cannot be expected to
13
provide a dowel effect, and their adhesive properties are less favourable. That is why the incremental load capacity of the members is not discernable at the relatively low F1 stress level, until the prestressing force is increased. 5.3. Recommended mechanical model The model recommended for the calculation of the expected value of the shear resistance of the members contains the active resistance components at the critical section. Shear resistance (VR) is the sum of the shear force component transferable to the compression zone (including the longitudinal reinforcement in the compression zone) (Vc*) and the load capacity of the shear reinforcement intersecting the critical section (Vw):
An analysis determined the resistance of the shear reinforcement. The arrangement of the stirrups is discrete, therefore the number of stirrups intersected by the critical crack depends upon the relative position of the critical crack and the stirrups. Thus, the resistance of the shear reinforcement is partly stochastic, which explains part of the deviation of the experimental results. The force taken by the shear reinforcement is the sum of the vertical components of the tensile load capacity of the stirrups intersecting the tensile zones of the critical section.
Figure 19. Loosened soil during sliding plane development, rearranged stresses along the sliding plane.
Diagrams of Katzenbach and Bachmann
To determine the shear force transferable to the compressive concrete zone, a parametric non-linear finite element analysis was performed. The member fractures at the limit of the compression-shear concrete zone. The phenomenon is very similar to the failure along sliding planes of soils having internal friction and cohesion, as known in soil mechanics. The experimental and numerical examinations of Katzenbach and Bachmann showed that the development of soil sliding planes is stepped (see Figure 19), the grains near the load participate the greatest at the beginning of loading, then farther sliding planes active once the cohesion and friction between the grains reach their limits. Meanwhile, along a discontinuity near the load, the material carries the load according to a new model. When the material continuity ceases, cohesion disappears and the angle of internal friction decreases. The material model of concrete was defined as in Figure 20 for the finite element calculation. After the Mohr-Coulomb fracture condition is satisfied, the c = 0, φ2 = 37° (stone) condition replaces it. The 2D disc model models only the compression zone of the member. On the basis of the experiments, the height of the compression zone does not reach the value calculated with the model which assumes perfect interaction of concrete and reinforcement. The reason is the loosening of the adhesion zone of the tensile reinforcement. To handle this, an interaction factor was defined for reinforcement (ηs) and for tendons (ηp) as a function of outer diameter (R) and wall thickness (v):
14
The apparent material model of the reinforcement was defined using the interaction factor (see Figure 20).
Figure 20. Input data for finite element model of compression zone. Used apparent reinforcement material model, and Mohr-Coulomb fracture conditions for concrete before and after loosening
Figure 21 shows the finite element model. The examined parameters were the length (lc) available for the sliding plane and the intensity of the compression concurrent with the shear. The stress distribution on the loaded edge was approximated according to Figure 21.
Figure 21. Input data for finite element model of compression zone; model geometry
Figure 22 shows the final results of the parametric examination. It was determined that an increase in the free length available to the sliding plane there was a decrease in the shear force transferable to the concrete. This explains the load capacity of crack No. [3] of Figure 16 surpassing that of the critical crack. However, the amount of shear force transferable to the concrete depends greatly upon the intensity of the concurrent compression force. At low compression levels, the load capacity is only slightly dependent upon the relative longitudinal length of the sliding plane, at high compression levels, it depends greatly. In the case of a long, rather a flat sliding planes, concurrent compression approaching compressive strength reduces the shear force transferable to the concrete, while in the case of a short, rather a steep sliding plane, the compression force is clearly advantageous. The reason for the latter is that on a steep sliding plane the compression force causes compression stress, while on a flat sliding plane it causes mainly shear stress.
15
Figure 22. Shear resistance of the compression zone as a function of the length of the sliding plane at various concurrent compression levels
(xc=80mm, fc=70 MPa)
Figure 23. Stress components calculable from the compression force in the compression zone in the
case of various geometries of sliding planes
The dowel effect of the reinforcement in the tensile zone was neglected due to loosening in the adhesion zone and the tensile stress of the reinforcement approaching or reaching the yield strength. The dowel effect-like behaviour of the compression zone reinforcement was taken into consideration by modifying the shear force (Vc) transferable to the concrete of the concrete zone. Until formation of the sliding plane in the compression zone, the measurable displacement along the discontinuity is very small. Therefore, the dowel effect of the reinforcement is not described by the load capacity model here. With respect to the small deformations, the shear force transferable to the concrete zone is modified in proportion to the cross sectional area of the reinforcement and the modulus of elasticity:
The calculated results of the recommended mechanical model show good agreement with the experimental results. The calculated fracture forces are 95 % of the measured fracture forces. The deviation of the ratio of calculated to measured values is 11%, which is good for concrete structures. The deviation is comparable to the deviation of the governing tendency of the experimental results. The fracture force calculated with the expected strength and geometric parameter values is never 11% more than the measured fracture force. No systematic error was found in the results of the model. For ring cross section members, the model takes into consideration the effects on shear load bearing capacity of wall thickness, longitudinal and transversal reinforcement, force-support distance, and stress and normal forces concurrent with the shear force. 5.4. The modified mechanical model for sizing and its practical applications The exact geometry and location of the critical section depends, amongst others, upon the deviation of test specimen concrete strengths, and the relative location of stirrups and cracks. After analysis of the uncertainties of the components taken into consideration for the load capacity, arising from the arbitrary selection of the critical section, 85% of the results of the expected behaviour model can be considered in the case of design. The uncertainties arising from the deviation of the test specimen material strengths should be considered according to MSZ-EN 1992-1-1. The consequential model is applicable for the direct calculation of shear resistance of members. The model is applicable for determining the substitute cotθ value on the basis of parametric examinations performed on designated structures. With this aid, the member can be sized using the procedure in MSZ EN 1992-1-1. In the case of members represented by the experimental test specimens, cotθ = 1.75 is recommended, on the basis of parametric calculations.
16
6. New Scientific Results Thesis 1: Relationships between compressive strength of spun-cast concrete and vibrated concrete The results of a parametric experimental series performed on 23 elements prepared from 9 different quartz aggregate mixes (w/c = 0.3-0.4) were used to determine the development of strength along the wall thickness of spun-cast concrete elements for the mixes represented by test specimens. a On the basis of the fresh concrete examination results, five typical compaction categories
were determined for spun-cast concrete, and the classification criteria were defined. A relationship was offered for the compaction intensity to be used for given mix consistencies.
b Statistical analysis was performed on the results of destructive strength examinations on drilled core samples taken from the vibrated cube and three regions of the spun-cast element wall. This determined that the strength of the outer region depends significantly upon the compaction factor and the strength increment moving into the wall thickness depends significantly upon the compaction factor and the paste excess.
c A relationship was determined between the strength of the outer and inner fibre areas of the spun-cast test specimen and the vibrated test specimen prepared form the same mix.
Related publications: [82] [87] [88] Thesis 2: Estimation of spun-cast concrete strength on the basis of Schmidt hammer rebound values Rebound examinations on the test specimens of Thesis 1 determined the relationship between the cylinder strength and rebound values of the butt end and the outer surface. On the basis of the Schmidt hammer rebound values, it was determined that strength estimated according to MSZ 4715, EN 13791, or Borján (Nehme) often leads to significant over-estimation of the strength of spun-cast concrete. a A relationship was determined between the Schmidt hammer rebound values measured on
the outer surface and the expected spun-cast concrete strength. The areas of use and range of validity of the recommended relationship were determined.
b A method was formulated to determine the compaction class of spun-cast concrete using the rebound values from the outer surface and the butt end. The areas of use and range of validity of the recommended method were determined.
c A modifying factor dependent upon the compaction class was determined for the relationship in point a of this thesis, which significantly improves the reliability of the relationship, when the compaction class is known.
Related publications: [83] [87] [88]
17
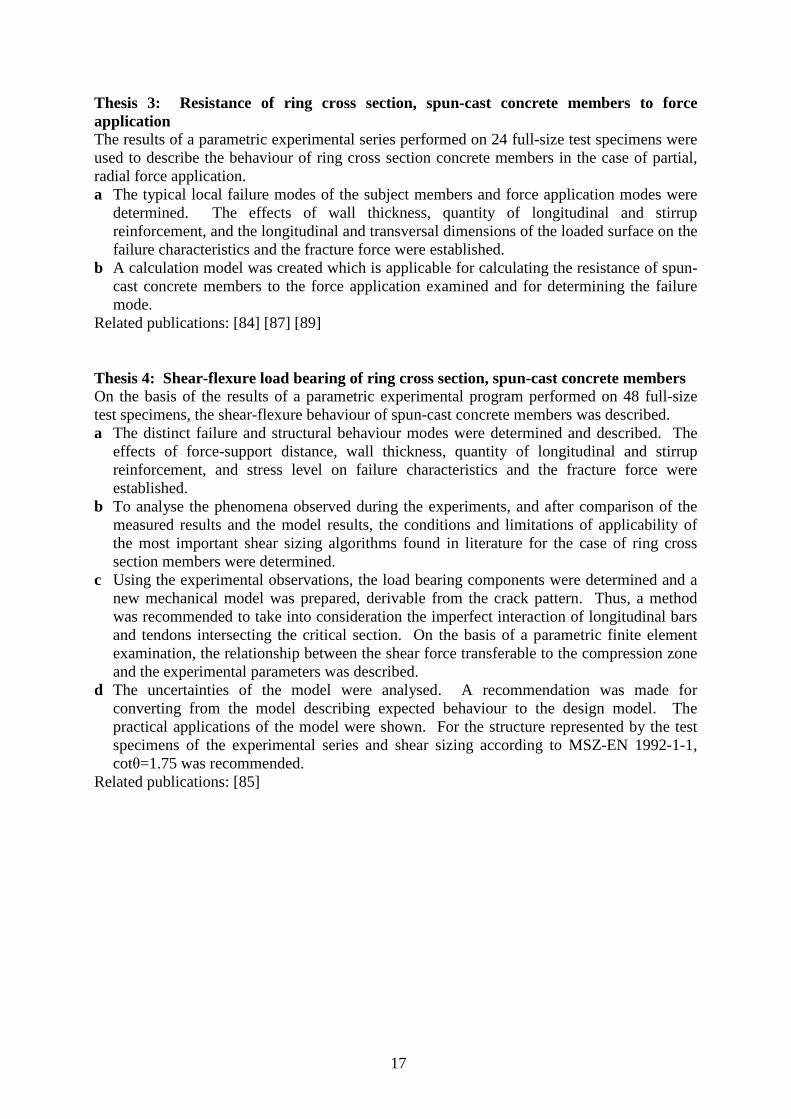
Thesis 3: Resistance of ring cross section, spun-cast concrete members to force application The results of a parametric experimental series performed on 24 full-size test specimens were used to describe the behaviour of ring cross section concrete members in the case of partial, radial force application. a The typical local failure modes of the subject members and force application modes were
determined. The effects of wall thickness, quantity of longitudinal and stirrup reinforcement, and the longitudinal and transversal dimensions of the loaded surface on the failure characteristics and the fracture force were established.
b A calculation model was created which is applicable for calculating the resistance of spun-cast concrete members to the force application examined and for determining the failure mode.
Related publications: [84] [87] [89] Thesis 4: Shear-flexure load bearing of ring cross section, spun-cast concrete members On the basis of the results of a parametric experimental program performed on 48 full-size test specimens, the shear-flexure behaviour of spun-cast concrete members was described. a The distinct failure and structural behaviour modes were determined and described. The
effects of force-support distance, wall thickness, quantity of longitudinal and stirrup reinforcement, and stress level on failure characteristics and the fracture force were established.
b To analyse the phenomena observed during the experiments, and after comparison of the measured results and the model results, the conditions and limitations of applicability of the most important shear sizing algorithms found in literature for the case of ring cross section members were determined.
c Using the experimental observations, the load bearing components were determined and a new mechanical model was prepared, derivable from the crack pattern. Thus, a method was recommended to take into consideration the imperfect interaction of longitudinal bars and tendons intersecting the critical section. On the basis of a parametric finite element examination, the relationship between the shear force transferable to the compression zone and the experimental parameters was described.
d The uncertainties of the model were analysed. A recommendation was made for converting from the model describing expected behaviour to the design model. The practical applications of the model were shown. For the structure represented by the test specimens of the experimental series and shear sizing according to MSZ-EN 1992-1-1, cotθ=1.75 was recommended.
Related publications: [85]
18
7. Related publications:
Journal papers
[82] Völgyi István, Farkas György, Salem Georges Nehme Concrete strength tendency in the wall of cylindrical spun-cast concrete elements. PERIODICA POLYTECHNICA-CIVIL ENGINEERING 54:(1) pp. 23-30. (2010) [83] Völgyi István, Farkas György Rebound testing of cylindrical spun-cast concrete elements; PERIODICA POLYTECHNICA-CIVIL ENGINEERING (accepted) [84] Völgyi István, Farkas György Experimental study on shear strength of hollow cylindrical spun cast concrete elements - Local behavior – Asian Journal of Civil Engineering (accepted) [85] Völgyi István, Farkas György, Windisch Andor Pörgetett vasbeton rudak nyírási-hajlítási viselkedésének kísérleti vizsgálata és modellezése MAGYAR ÉPÍTŐIPAR (accepted)
Conference papers
[87] Völgyi István, Farkas György Betontechnológiai és és erőtani kérdések a pörgetett vasbeton oszlopok esetén. ÉPKO 2009: XIII. Nemzetközi Építéstudományi Konferencia. Csíksomlyó, Románia, 2009.06.11-2009.06.14. Cluj-Napoca: Erdélyi Magyar Műszaki Tudományos Társaság, pp. 501-507. [88] Völgyi István Determination of strength of spun-cast concrete elements. Fifth International PhD&DLA Symposium. Pécs, Magyarország, 2009.10.19-2009.10.20. Pécs: University of Pécs, p. 70. [89] Völgyi István, Farkas György Experimental investigation of the upper limit of the shear strength of spun-cast concrete elements 7th CCC Congress Balatonfüred 2011.
19
8. Further possible research directions The aim of the research program was a deeper understanding of the shear behaviour of ring cross section concrete members. The scope, time, and financial limits of the research did not allow the general, expanded examination of the questions posed above. The examinations on spun-cast concrete strength and resistance to force application of ring cross sections concentrated only on the questions pertinent to the research. Meanwhile, several problems arose which should be addressed by later research. Within the framework of the research program, test specimens with low water-cement ratio, quartz aggregate, normal strength concrete, and normal after-treatment were examined. Valuable information could be gained from examining steam-treated elements, for example. Within the framework of examining the shear behaviour of spun-cast concrete members, the resistance to quasi-static, unilateral stresses was discussed. The condition for general use of the procedure is the study of behaviour due to alternating loads. A further question is how the shear force transferable to the compression zone of concrete changes if the compressed side of the cross section was cracked by an earlier, reversed load distribution. It is considered important to research under what conditions this shear model based on new principles is applicable in the case of members with different cross sections. The research showed that the adhesion of longitudinal bars loses efficiency if the shear stress on the member is high. The examination of the phenomenon is interesting for other structural members, too, and gives rise to important questions. A further research topic may be how interaction depends upon concrete cover on the inner side, diameter of longitudinal bars, and concrete strength. To present the created mechanical model for general use, proof of the accuracy of the model is desirable for different concrete strengths and cross sections.