Influence of Concrete Strength and Load History on the Shear Friction Capacity of Concrete Members Joost Wairaven Professor of Structural Engineering Darmstadt University of Technology West Germany Jerome Frenay Research Engineer Delft University of Technology The Netherlands #4 Arjan Pruijssers Research Engineer Delft University of Technology The Netherlands T he shear friction analogy is a design method which is familiar to most engineers in practice. r- rr It is a valuable and simple tool which can be used to estimate the maximum shear force transmitted across a cracked plane in a reinforced concrete member. The cracks considered may be caused by load ef- fects, but also by a variety of other rea- sons such as tensile forces due to re- strained shrinkage or temperature de- formations, or by accidental dropping. The shear friction method is used in the design of precast concrete structural connections for estimating the shear capacity of interfaces between precast members and cast-in-place concrete and for calculating the residual shear capac- ity of cross sections which are weakened by cracking. Well known is the applica- tion for the design of short corbels wherein a control of the interface stresses is necessary to prevent a possi- ble shear failure (see Fig. 1). The role of shear friction in the design of corbels was treated by Mattock.tO Similarly, the principles concerning interface shear capacity can also be 66
Transcript
Influence of Concrete Strengthand Load History on theShear Friction Capacityof Concrete Members
Joost WairavenProfessor of Structural
EngineeringDarmstadt University of
TechnologyWest Germany
Jerome FrenayResearch EngineerDelft University of
TechnologyThe Netherlands
#4Arjan PruijssersResearch EngineerDelft University of
TechnologyThe Netherlands
The shear friction analogy is a designmethod which is familiar to most
engineers in practice. r- rr It is a valuableand simple tool which can be used toestimate the maximum shear forcetransmitted across a cracked plane in areinforced concrete member. The cracksconsidered may be caused by load ef-fects, but also by a variety of other rea-sons such as tensile forces due to re-strained shrinkage or temperature de-formations, or by accidental dropping.
The shear friction method is used inthe design of precast concrete structural
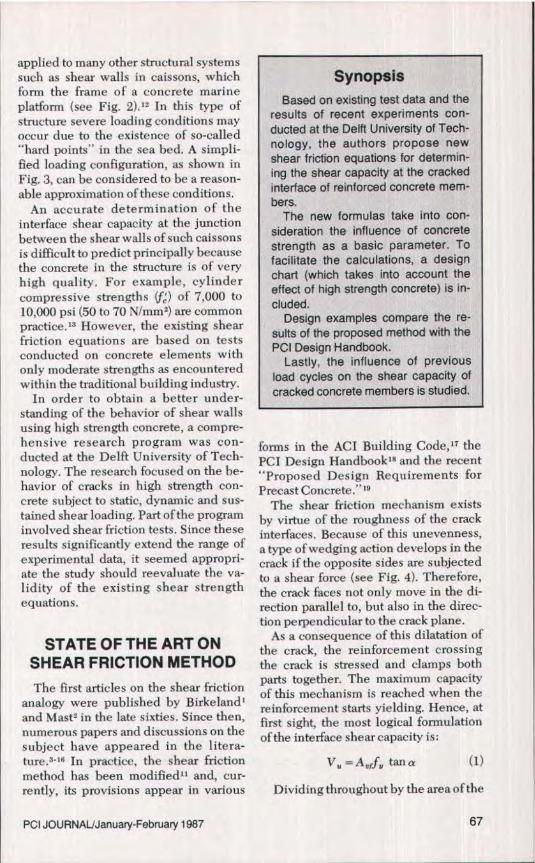
connections for estimating the shearcapacity of interfaces between precastmembers and cast-in-place concrete andfor calculating the residual shear capac-ity of cross sections which are weakenedby cracking. Well known is the applica-tion for the design of short corbelswherein a control of the interfacestresses is necessary to prevent a possi-ble shear failure (see Fig. 1).
The role of shear friction in the designof corbels was treated by Mattock.tO
Similarly, the principles concerninginterface shear capacity can also be
66
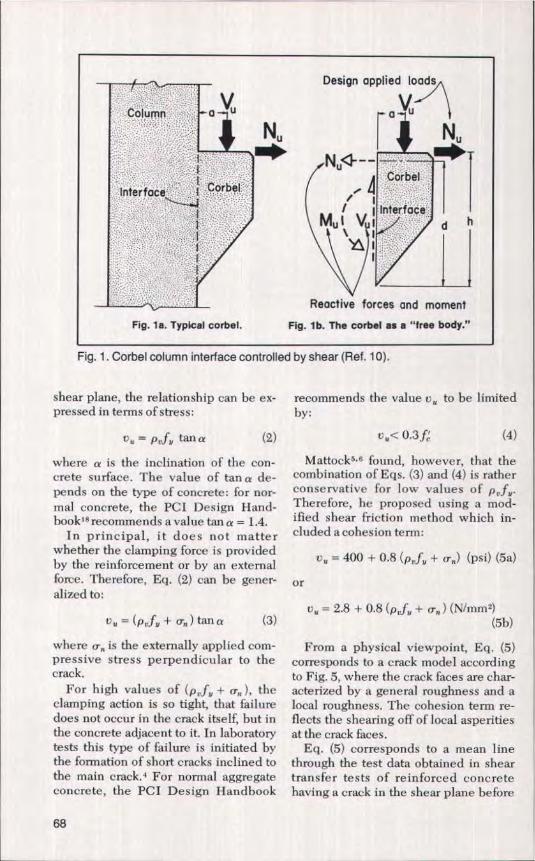
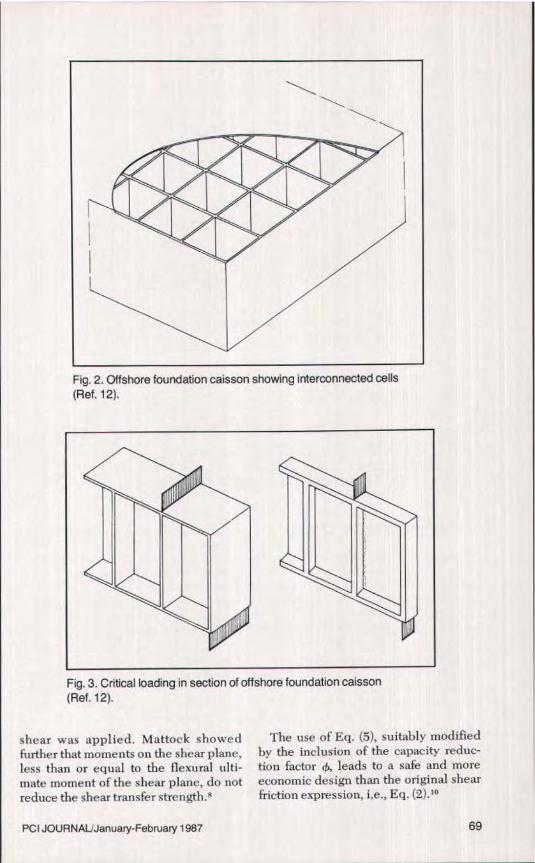
applied to many other structural systemssuch as shear walls in caissons, whichform the frame of a concrete marineplatform (see Fig. 2). 12 In this type ofstructure severe loading conditions mayoccur due to the existence of so-called"hard points" in the sea bed. A simpli-fied loading configuration, as shown inFig. 3, can be considered to be a reason-able approximation of these conditions.
An accurate determination of theinterface shear capacity at the junctionbetween the shear walls of such caissonsis difficult to predict principally becausethe concrete in the structure is of veryhigh quality. For example, cylindercompressive strengths (f^) of 7,000 to10,000 psi (50 to 70 Nlmm 2) are commonpractice. f3 However, the existing shearfriction equations are based on testsconducted on concrete elements withonly moderate strengths as encounteredwithin the traditional building industry.
In order to obtain a better under-standing of the behavior of shear wallsusing high strength concrete, a compre-hensive research program was con-ducted at the Delft University of Tech-nology. The research focused on the be-havior of cracks in high strength con-crete subject to static, dynamic and sus-tained shear loading. Part of the programinvolved shear friction tests. Since theseresults significantly extend the range ofexperimental data, it seemed appropri-ate the study should reevaluate the va-lidity of the existing shear strengthequations.
STATE OF THE ART ONSHEAR FRICTION METHODThe first articles on the shear friction
analogy were published by Birkeland'and Mast2 in the late sixties. Since then,numerous papers and discussions on thesubject have appeared in the litera-ture. 3-' 6 In practice, the shear frictionmethod has been modified" and, cur-rently, its provisions appear in various
SynopsisBased on existing test data and the
results of recent experiments con-ducted at the Delft University of Tech-nology, the authors propose newshear friction equations for determin-ing the shear capacity at the crackedinterface of reinforced concrete mem-bers.
The new formulas take into con-sideration the influence of concretestrength as a basic parameter. Tofacilitate the calculations, a designchart (which takes into account theeffect of high strength concrete) is in-cluded.
Design examples compare the re-sults of the proposed method with thePCI Design Handbook.
Lastly, the influence of previousload cycles on the shear capacity ofcracked concrete members is studied.
forms in the ACI Building Code,' 7 thePCI Design Handbook- and the recent"Proposed Design Requirements forPrecast Concrete. 'lS
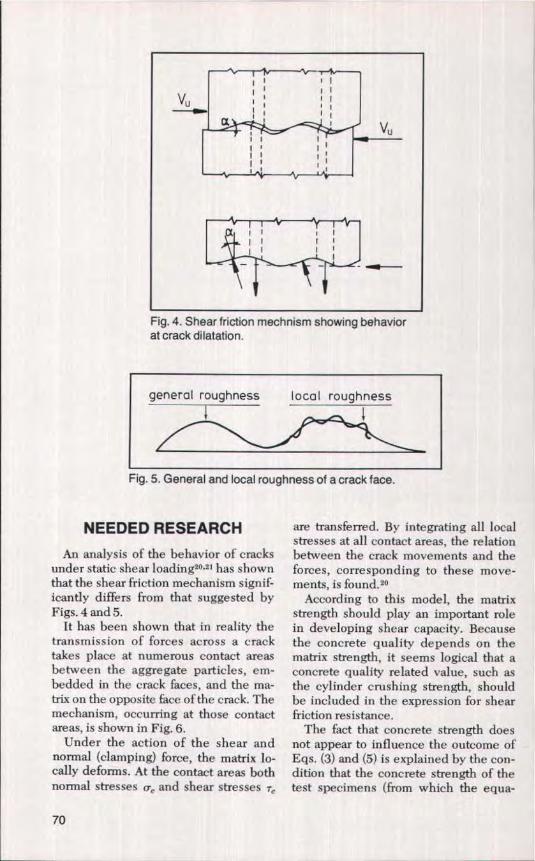
The shear friction mechanism existsby virtue of the roughness of the crackinterfaces. Because of this unevenness,a type of wedging action develops in thecrack if the opposite sides are subjectedto a shear force (see Fig. 4). Therefore,the crack faces not only move in the di-rection parallel to, but also in the direc-tion perpendicular to the crack plane.
As a consequence of this dilatation ofthe crack, the reinforcement crossingthe crack is stressed and clamps bothparts together. The maximum capacityof this mechanism is reached when thereinforcement starts yielding. Hence, atfirst sight, the most logical formulationof the interface shear capacity is:
V, = Atrf„ tan a (1)
Dividing throughout by the area ofthe
PCI JOURNAL/January-February 1987 67
Fig. 1. Corbel column interface controlled by shear (Ref. 10).
shear plane, the relationship can be ex- recommends the value v, to be limitedpressed in terms of stress: by:
v u = p,f,, tan a (2)
where a is the inclination of the con-crete surface. The value of tana de-pends on the type of concrete: for nor-mal concrete, the PCI Design Hand-book t8 recommends a value tan a = 1.4.
In principal, it does not matterwhether the clamping force is providedby the reinforcement or by an externalforce. Therefore, Eq. (2) can be gener-alized to:
v„ = (p„f i, + ex„) tan a (3)
where Q„ is the externally applied comn-pressive stress perpendicular to thecrack.
For high values of (p t,f,, + cr„ ), theclamping action is so tight, that failuredoes not occur in the crack itself, but inthe concrete adjacent to it. In laboratorytests this type of failure is initiated bythe formation of short cracks inclined tothe main crack. 4 For normal aggregateconcrete, the PCI Design Handbook
v< 0.3 fc (4)
Mattock s s found, however, that thecombination of Eqs. (3) and (4) is ratherconservative for low values ofTherefore, he proposed using a mod-ified shear friction method which in-cluded a cohesion term:
v,, = 400 + 0.8 (p„f„ + rra) (psi) (5a)
or
c„=2.8+0.8(pLf„ +rrn)(Nlmm2)(5b)
From a physical viewpoint, Eq. (5)corresponds to a crack model accordingto Fig. 5, where the crack faces are char-acterized by a general roughness and alocal roughness. The cohesion term re-flects the shearing off of local asperitiesat the crack faces.
Eq. (5) corresponds to a mean linethrough the test data obtained in sheartransfer tests of reinforced concretehaving a crack in the shear plane before
68
Fig. 2. Offshore foundation caisson showing interconnected cells(Ref. 12).
Fig. 3. Critical loading in section of offshore foundation caisson(Ref. 12).
shear was applied. Mattock showedfurther that moments on the shear plane,less than or equal to the flexural ulti-mate moment of the shear plane, do notreduce the shear transfer strength.R
The use of Eq. (5), suitably modifiedby the inclusion of the capacity reduc-tion factor 0, leads to a safe and moreeconomic design than the original shearfriction expression, i.e., Eq. (2).10
Fig. 5. General and local roughness of a crack face.
NEEDED RESEARCHAn analysis of the behavior of cracks
under static shear loading 20 • 21 has shownthat the shear friction mechanism signif-icantly differs from that suggested byFigs. 4 and 5.
It has been shown that in reality thetransmission of forces across a cracktakes place at numerous contact areasbetween the aggregate particles, em-bedded in the crack faces, and the ma-trix on the opposite face of the crack. Themechanism, occurring at those contactareas, is shown in Fig. 6.
Under the action of the shear andnormal (clamping) force, the matrix lo-cally deforms. At the contact areas bothnormal stresses Q,, and shear stresses r,.
are transferred, By integrating all localstresses at all contact areas, the relationbetween the crack movements and theforces, corresponding to these move-ments, is found, 20
According to this model, the matrixstrength should play an important rolein developing shear capacity. Becausethe concrete quality depends on thematrix strength, it seems logical that aconcrete quality related value, such asthe cylinder crushing strength, shouldbe included in the expression for shearfriction resistance.
The fact that concrete strength doesnot appear to influence the outcome ofEqs. (3) and (5) is explained by the con-dition that the concrete strength of thetest specimens (from which the equa-
70
tions were derived) varied between nar-row limits, i.e., nearly all the strengthvalues lay between 2900 and 4300 psi(20 to 30 N/mm 2). Therefore, a possibleeffect of the concrete strength is over-ruled by the natural scatter of the exper-imental results. It would, however, notbe surprising if tests over a wide rangeof concrete quality would displaystrength dependent tendencies.
Another aspect that needs consider-ation is the fact that cracks in practicalsituations may be subjected to load vari-ations and sustained loading. It mightbe questioned whether expressions forthe shear friction capacity, derived fromtests on monotonically loaded speci-mens, also apply under those circum-stances.
Recently, comprehensive tests wereconducted in the Netherlands dealingwith the issues discussed above,namely, the effect of concrete strengthand load history on the shear frictionequations. When combined with exist-ing data, these tests offer a broad rangeof parameter variation, enabling a newoverall analysis of the subject. In thefollowing section, the existing data andnew results will be discussed.
EXPERIMENTALRESULTS
The experimental results used in thisanalysis were taken from foursources. 3•' 5,2122 The detailed results arepresented in Tables 1 through 4. Theratio of the concrete cylinder strength(ff) to the cube strength if) is assumedto be 0.85.
From Ref. 3, results of shear tests onprecracked push-off specimens areavailable. The cylinder strength variedbetween 2400 and 4400 psi (17 and 31N/mm 2), whereas p, f„ varied between 50and 1460 psi (0.35 and 10.24 N/mm2),and f, was 50 or 66 ksi (350 or 464N/mm 2). The bar diameter of the stirrupsperpendicularly crossing the crack
1G^Z
`C ac
0
Fig. 6. Transmission of forcesbetween crack faces.
plane was between 0.37 and 0.63 in. (9.5and 15.9 mm). The concrete was madefrom Type III portland cement and Ira in.(22 mm) maximum size river gravel ag-gre gate.
The first series of tests on reinforcedpush-off specimens conducted at Delft,comprised 31 results. 21 The cylinderstrength varied between 2400 and 6850psi (17 and 48 N/mm 2). The concrete wascomposed of glacial river aggregates(Fuller grading curve and Type B port-land cement). The maximum particle di-ameter was 0.63 or 1.32 in. (16 or 32mm). The value of p„fu ranged between160 and 2170 psi (1.1 and 15.2 N/m►nz)andf„was 66 ksi (460 N/mm2).
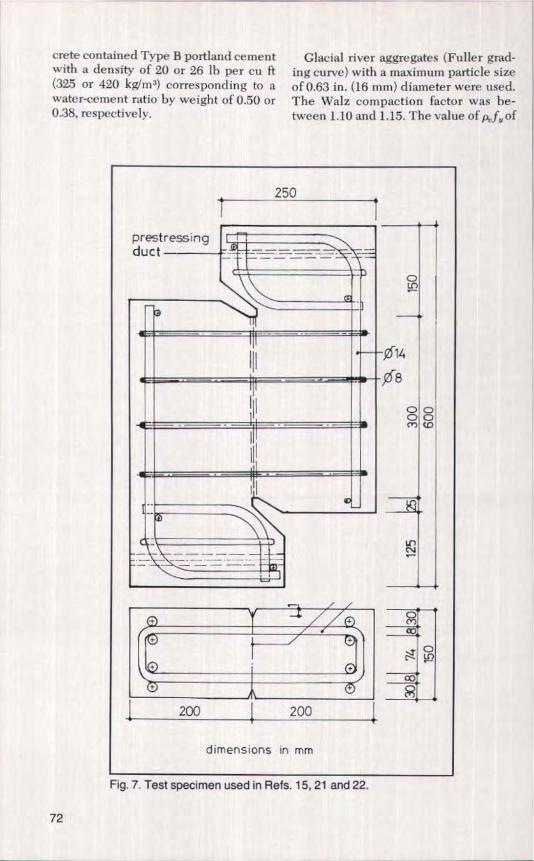
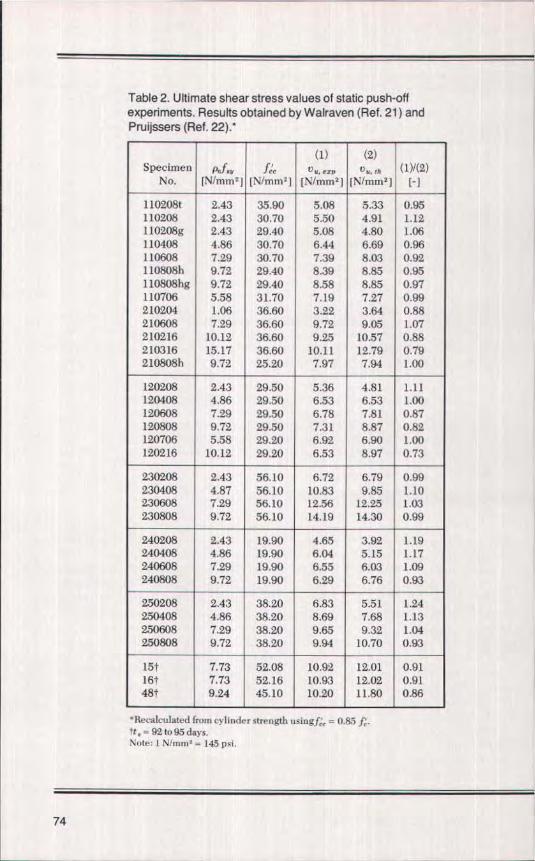
The tests were carried out on push-offspecimens (see Fig. 7) with a precrackedshear area of 4.7 x 11.8 in. (120 x 300mm), perpendicularly crossed by stir-nips having a bar diameter of 0.31 or0.63 in. (8 or 16 mm). The experimentalresults are summarized in Table 2.
Recently a new series of tests werecarried out by Pruijssers 22 and Fre nay'susing repeated and long-term shearloads on push-off specimens similar tothose used by Walraven 2l (see Tables 3and 4). In these tests the shear plane wasperpendicularly crossed by 0.31 in. (8mm) diameter embedded reinforcingbars. For these shear loading tests twoconcrete grades were chosen, with cyl-inder strengths of 6150 and 8550 psi (43and 60 Nlmm 2), respectively. The con-
PCI JOURNAL/January-February 1987 71
crete contained Type B portland cementwith a density of 20 or 26 lb per cu ft(325 or 420 kg/ma) corresponding to awater-cement ratio by weight of 0,50 or0.38, respectively.
Glacial river aggregates (Fuller grad-ing curve) with a maximum particle sizeof 0.63 in. (16 min) diameter were used.The Walz compaction factor was be-tween 1.10 and 1.15. The value of ptifw of
250
prestressingduct ---
0
I I
014
— ! -
III o O°
N
O
n ^
}
200 200 4.dimensions in mm
Fig. 7. Test specimen used in Refs. 15, 21 and 22.
72
Table 1, Ultimate shear stress values of static push-offexperiments. Results obtained by Mattock (Ref. 3).
*Recalculated from cylinder strength usingf ', = O.85f.Note: I Nlmm I = 145 psi.
the reinforcement ranged between 736and 1760 psi (5.15 and 12.32 N/mm2).Two steel grades were used with f0 = 66and 79 ksi (460 and 550 N/mm 2). Thespecimens were precracked beforetesting. The range of the initial crackwidth was between 0.0004 and 0.0040in. (0.01 and 0.10 mm). All the testsstarted at a concrete age of 28 days.
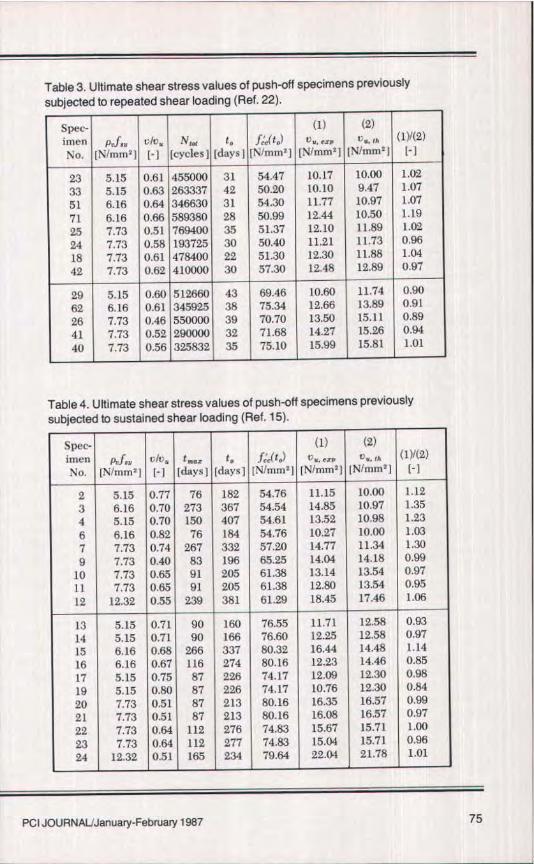
In the repeated loading tests, 22 thenumber of cycles varied between193,725 and 769,400. The repeatedshear loading was characterized by asinusoidal wave of 60 cycles per minutealternating between zero and valuesvarying between 46 and 66 percent ofthe static ultimate load. After theseseries of cycles the specimens were un-
loaded and pushed-off in a static test (13specimens).
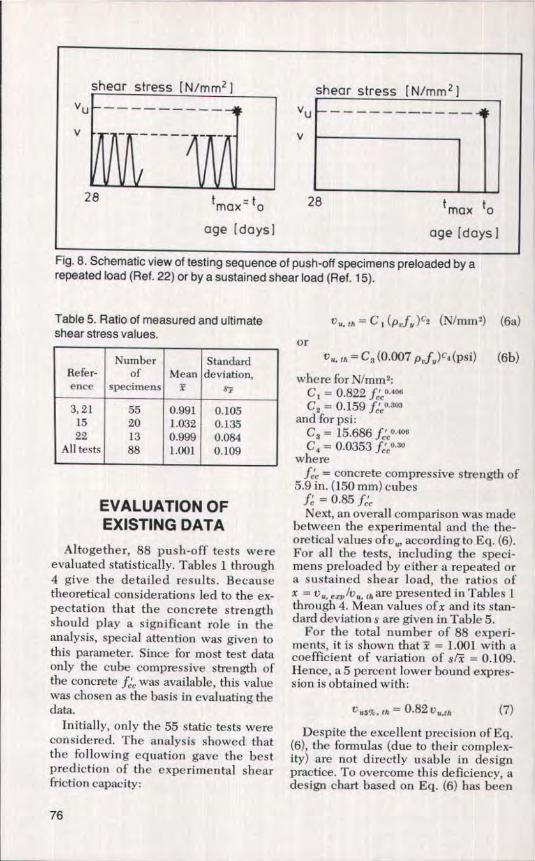
In addition, twenty sustained loadingtests were carried out, 15 the shear stresslevel of which varied between 40 and 82percent of the static ultimate load. Theduration of preloading was t,,,,, ,x days.Periodically, the displacements paralleland perpendicular to the crack planewere measured. Next, the loading wasremoved and the specimens werepushed-off statically at an age t, (see Fig.8). The preloading age t ma,,, varied be-tween 76 and 273 days while the staticpush-off age t, varied between 160 and407 days.
Tables 2 through 4 present the de-tailed data on the push-off specimens.
PCI JOURNAL/January-February 1987 73
Table 2. Ultimate shear stress values of static push-offexperiments. Results obtained by Walraven (Ref. 21) andPruijssers (Ref. 22).`
Altogether, 88 push-off tests wereevaluated statistically. Tables 1 through4 give the detailed results. Becausetheoretical considerations led to the ex-pectation that the concrete strengthshould play a significant role in theanalysis, special attention was given tothis parameter. Since for most test dataonly the cube compressive strength ofthe concrete f was available, this valuewas chosen as the basis in evaluating thedata.
Initially, only the 55 static tests wereconsidered. The analysis showed thatthe following equation gave the bestprediction of the experimental shearfriction capacity:
= C 3 (0.007 p 1..f )c4 (psi) (6b)
where for N/mm2.C I = 0.822 fe0405C E = 0,159.f 1 .3o3
and for psi:Cs = 15.686 ffr°. °sC 4 = 0.0353 fccU.30
wheref", = concrete compressive strength of
5.9 in. (150 mm) cubesJ, =0.85fNext, an overall comparison was made
between the experimental anti the the-oretical values of v, according to Eq. (6).For all the tests, including the speci-mens preloaded by either a repeated ora sustained shear load, the ratios ofx = U,, e ^,, /v„ mare presented in Tables 1through 4. Mean values of x and its stan-dard deviations are given in Table 5.
For the total number of 88 experi-ments, it is shown that x = 1.001 with acoefficient of variation of sf = 0.109.Hence, a 5 percent lower bound expres-sion is obtained with:
= 0.82 v ,,,th (7)
Despite the excellent precision of Eq.(6), the formulas (due to their complex-ity) are not directly usable in designpractice. To overcome this deficiency, adesign chart based on Eq. (6) has been
76
V„!bd
[Ntmm 2 1 psi]
220015
14 2000
DESIGN CHART
V v 0 200 400 600 800 1000 1200 14uu 1Ju
0 1 2 3 4 5 6 7 8 9 10 11
[Nlmm2]
Fig. 9. Design chart for determining shear friction capacity by taking into account thecompressive strength of concrete.
PCI JOURNALJanuary-February 1997 77
Vu,expl'u,th
2,8o Stati( {3 }
• Static {21 1 •24 q repented {22}
• sustained {i5} • •0 ■ ■
2,0 0 ■0•
• ■•
1,6r 0000. •■
•
p 0 q
1 2
O 0*°°•M 00 :1.. •Q • 0
1,0
0,8
2000 4000 6000 8000 10000 f' (psiI
0 10 20 30 40 50 60 70 80 f' [NImmzl
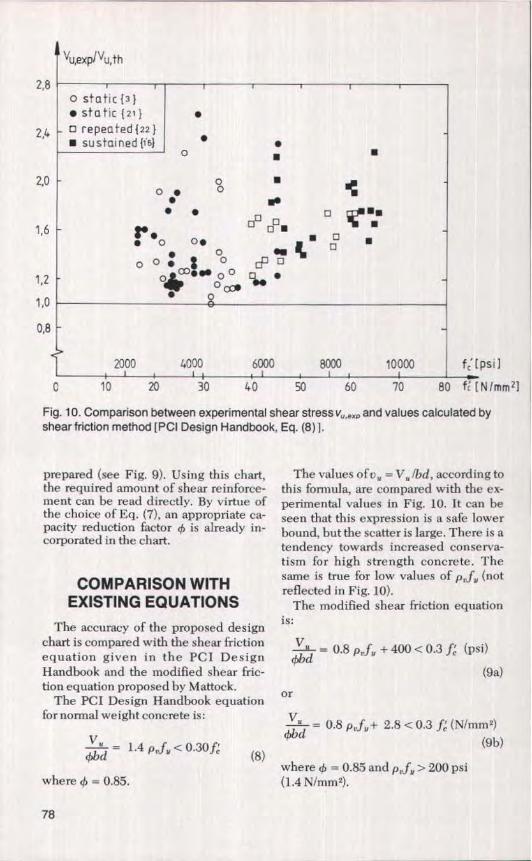
Fig. 10. Comparison between experimental shear stress vu,e=, and values calculated byshear friction method [PCI Design Handbook, Eq. (8) J.
prepared (see Fig. 9). Using this chart, The values of v. = VIbd, according tothe required amount of shear reinforce- this formula, are compared with the ex-ment can be read directly. By virtue of perimental values in Fig. 10. It can bethe choice of Eq. (7), an appropriate ca- seen that this expression is a safe lowerpacity reduction factor 0 is already in- bound, but the scatter is large. There is acorporated in the chart, tendency towards increased conserva-
tism for high strength concrete. The
EXISTING EQUATIONSThe accuracy of the proposed design
chart is compared with the shear frictionequation given in the PCI DesignHandbook and the modified shear fric-tion equation proposed by Mattock.
The PCI Design Handbook equationfor normal weight concrete is:
v" = 1.4 P,,f, < 0.30f^
4bd (8)
where 4) = 0.85.
COMPARISON WITH t f 1 1 f ( same is rue or ow va tic;,o p, ;fr, noreflected in Fig. 10).
The modified shear friction equationis:
d – 0 .8 Pr.fv + 400 < 0.3 ff (psi)
(9a)
or
d = 0.8 p„f„+ 2.8 <0.3 f (NJmm2)(9b)
where = 0.85 and p,fz,>200psi(1.4 N/mm2).
78
Vyexp/Vu,th
62
static {31•static {21}q repeated122)• sustainedlt5] VA
2,2 ■
n q n •1,8 q q̂ 4 q^
••
• o o • qo1,4
$0
• o o 'er:Op CX] •
1,0
0,8
2000 4000 6000 8000 10000 f [psil
0 10 20 30 40 50 60 70 80 f,'[Nlmm2]
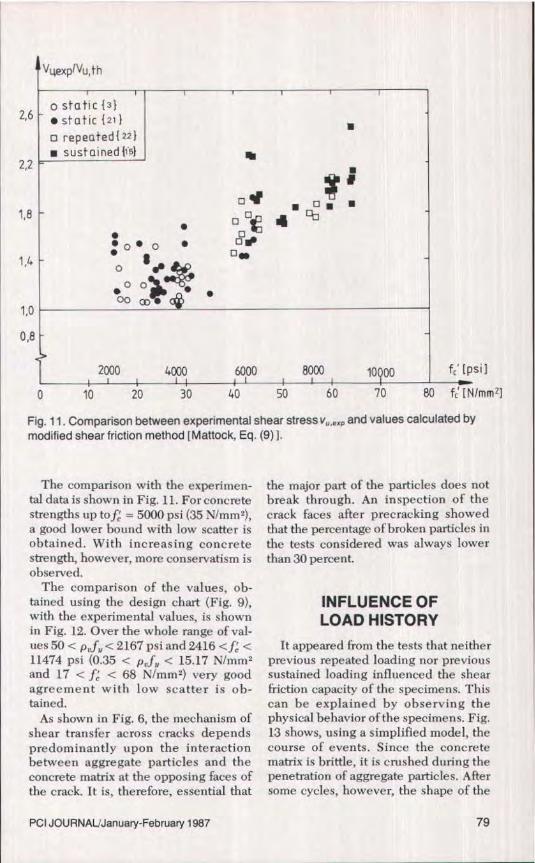
Fig. 11. Comparison between experimental shear stress v, ,g,, and values calculated by
The comparison with the experimen-tal data is shown in Fig. 11. For concretestrengths up to fc = 5000 psi (35 Nlmm2),a good lower bound with low scatter isobtained. With increasing concretestrength, however, more conservatism isobserved.
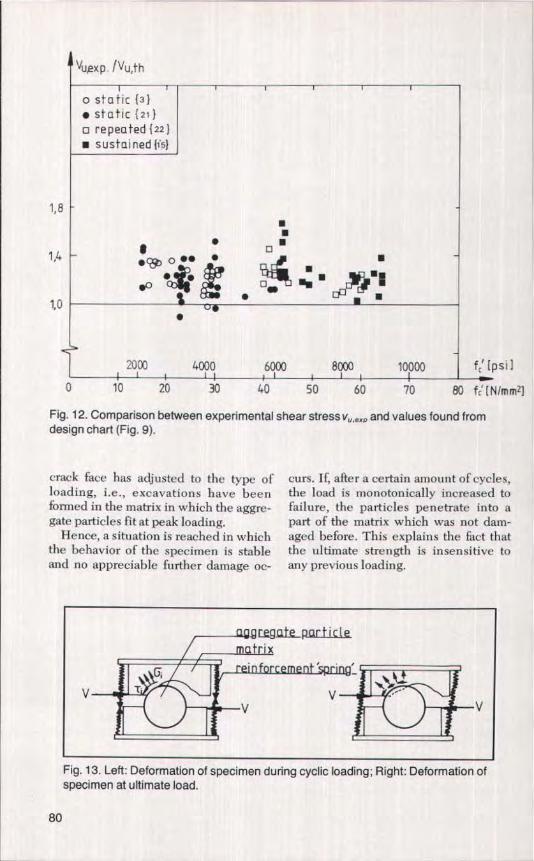
The comparison of the values, ob-tained using the design chart (Fig. 9),with the experimental values, is shownin Fig. 12. Over the whole range of val-ues 50 < p,, f , < 2167 psi and 2416 < ff <11474 psi (0.35 < p,,f„ < 15.17 N/mm2and 17 <f < 68 N/mm 2) very goodagreement with low scatter is ob-tained.
As shown in Fig. 6, the mechanism ofshear transfer across cracks dependspredominantly upon the interactionbetween aggregate particles and theconcrete matrix at the opposing faces ofthe crack. It is, therefore, essential that
the major part of the particles does notbreak through. An inspection of thecrack faces after precracking showedthat the percentage of broken particles inthe tests considered was always lowerthan 30 percent.
INFLUENCE OFLOAD HISTORY
It appeared from the tests that neitherprevious repeated loading nor previoussustained loading influenced the shearfriction capacity of the specimens. Thiscan be explained by observing thephysical behavior of the specimens. Fig,13 shows, using a simplified model, thecourse of events. Since the concretematrix is brittle, it is crushed during thepenetration of aggregate particles. Aftersome cycles, however, the shape of the
PCI JOURNAL,'January-February 1987 79
Vu^exp f Vu,th
o static {3}• static 21}o repeated {22}• sustained (is}
1,8
1 •1,4 • 0•• •
W1,0
•
■q n
■■ _
2000 4000 6000 8000 10000 f,' [psi]
0 10 20 30 40 50 60 70 80 fc' [Nlmm2]
Fig. 12. Comparison between experimental shear stress v,, ,ex. and values found fromdesign chart (Fig. 9).
crack face has adjusted to the type ofloading, i.e., excavations have beenformed in the matrix in which the aggre-gate particles fit at peak loading.
Hence, a situation is reached in whichthe behavior of the specimen is stableand no appreciable further damage oc-
curs. If, after a certain amount of cycles,the load is monotonically increased tofailure, the particles penetrate into apart of the matrix which was not dam-aged before. This explains the fact thatthe ultimate strength is insensitive toany previous loading.
r gaff—partic[eI_iIIIIlllI1iFig. 13. Left: Deformation of specimen during cyclic loading; Right: Deformation ofspecimen at ultimate load.
80
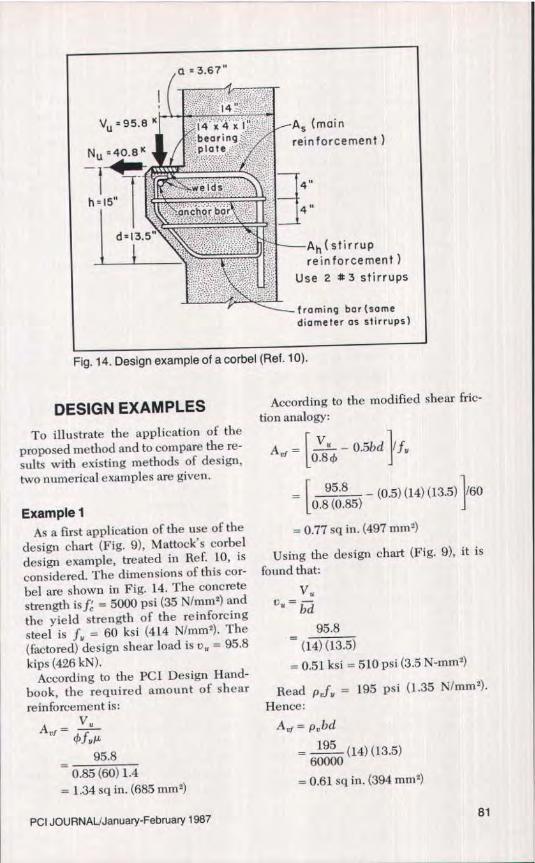
Fig. 14. Design example of a corbel (Ref. 10).
DESIGN EXAMPLESTo illustrate the application of the
proposed method and to compare the re-sults with existing methods of design,two numerical examples are given.
Example IAs a first application of the use of the
design chart (Fig. 9), Mattock's corbeldesign example, treated in Ref. 10, isconsidered. The dimensions of this cor-bel are shown in Fig. 14. The concretestrength is ff = 5000 psi (35 N11mm z) andthe yield strength of the reinforcingsteel is f„ = 60 ksi (414 Nlmm 2). The(factored) design shear load is v, = 95.8kips (426 kN).
According to the PCI Design Hand-book, the required amount of shearreinforcement is:
A °r cb.f1 L
95.8
0.85 (60) 1.4
= 1.34 sq in. (685 mm2)
According to the modified shear £ric-tion analogy:
A,, y" – 0.5bd ^1 f„
– (0.5) (14) (13.5) 160
= 0.77 sq in. (497 mm2)
Using the design chart (Fig. 9), it isfound that:
Vu
"" bd
95.8
(14) (13.5)= 0.51 ksi = 510 psi (3.5 N -rnm2)
Read p f„ = 195 psi (1.35 Nlmm2).
Hence:
A= p,,bd
195 (14) (13.5)600tH)
= 0.61 sq in. (394 mm2)
PCI JOURNALJJanuary-February 1987 81
Example 2
As a second design example, the cais-son structure shown in Fig. 3 is consid-ered. The concrete quality in such sub-marine shear walls may be very high. Itis assumed that the concrete cylinderstrength is f/ = 8000 psi (56 N/mm 2) andthat the design shear stress, to be trans-mitted across the interface at the junc-tion between the two shear walls (dottedline, Fig. 3), is V„Ibd = 1000 psi (7N/mm l),
According to the PCI Design Hand-book the required amount of reinforce-ment is determined from:
P^,fu = d Of;-
1000(0.85) (1.4)
= 840 psi (5.9 N/mmz)
According to the modified shear fric-tion equation:
PJM = Ol$ (_400)
— – 4001=0.8 0.85
= 970 psi (6.8 N/mm2)
Using the design chart (Fig. 9):p,f„ = 460 psi (3.1 N/mm2)The above example demonstrates the
desirability of having a shear frictionformula which is also valid for highstrength concrete. This formula willprevent unnecessary conservatism forsuch cases.
CONCLUSIONS1. The traditional shear friction equa-
tion, without a cohesion term, is safe hutconservative, especially in the region oflow reinforcement ratios or high con-crete strengths. The modified shearfriction equation, as proposed by Mat-tock, is a safe expression with good ac-curacy for low and intermediate con-
crete strengths. For ff > 5000 psi (35N/mmz), however, an increasing conser-vatism is found.
2. Taking the concrete strength intoaccount as a basic influencing parame-ter, an expression can he derived withexcellent accuracy over a very widerange ofparameter variation:
100 < p„fy < 1500 psi and
2500 <ff < 9000 psi
or
0.7 <pJu <10N/mm 2 and17.5 < f,<65N/mm2
A necessary condition for the validityof the above equations is that the aggre-gate is sufficiently strong. , In the testsconsidered, always less than 30 percentof the aggregate particles were brokenby cracking.
3. Previous loading cycles (n =200,000 to 750,000) with a maximumshear stress up to 65 percent of the staticshear capacity did not influence theshear capacity of the crack. The same istrue for sustained loading, up to 381days on a level of 40 to 80 percent of thestatic shear capacity.
ACKNOWLEDGMENTMost of the experiments used in this
paper to update the shear frictionmethod were carried out at the DelftUniversity of Technology in theNetherlands. This research was finan-cially supported by the Ministry ofEconomic Affairs.
The assistance of Professor Reinhardtand the other members of the Delft Uni-versity faculty is gratefully acknowl-edged. In addition, the authors aregreatly indebted to the CUR-VB(Netherlands Committee for Research,Codes and Specifications for Concrete)for supporting the research program.
82
REFERENCES
1. Birkeland, P. W., and Birkeland H. W.,"Connections in Precast Concrete Con-stnrctions," ACI Journal, V. 63, No. 3,March 1966, pp. 345-368.
2. Mast, R. F., "Auxiliary Reinforcement inConcrete Connections," Journal of theStructural Division, ASCE, V. 94, ST6,June 1968, pp. 1485-1504.
3. Hofbeck, J. A., Ibrahim, 1.0., and Mat-tock, A. H., "Shear Transfer in ReinforcedConcrete," AC! Journal, V. 66, No, 2,February 1969, pp. 119-128.
4. Mattock, A. H., and Hawkins, N. M.,"Research on Shear Transfer in Rein-forced Concrete," PCI JOURNAL, V. 17,No. 2, March-April 1972, pp. 55-75.
5. Mattock, A. H., "Shear Transfer in Con-crete Having Reinforcement at an Angleto the Shear Plane," ACI Special Publi-cation 42, Shear in Reinforced Concrete,American Concrete Institute, Detroit,Michigan, 1974, pp. 17-42.
6. Mattock, A. H., Discussion of the paper"Modified Shear Friction Theory forBracket Design," by B. R. Hermansenand J. Cowan, ACI Journal, V. 71, No. 8,August, 1974, pp. 421-423.
7. Houde, J., and Mirza, M. S., "A FiniteElement Analysis of Reinforced Con-crete Beams," ACI Special Publication42, Shear in Reinforced Concrete, V. 1,American Concrete Institute, Detroit,Michigan, 1974, pp. 103-128.
8. Mattock, A. H., John!, L., and Chow,H. C., "Shear Transfer in ReinforcedConcrete With Moment or Tension Act-ing Across the Shear Plane," PCIJOURNAL, V. 20, No. 4, July-August1975, pp. 76-93.
9. Mattock, A. H., Li, W. K., and Wang,T. C., "Shear Transfer in LightweightReinforced Concrete," PCI JOURNAL,V. 21, January-February 1976, pp. 20-39.
11. Shaikh, A. Fattah, "Proposed Revisionsto Shear-Friction Provisions," PCIJOURNAL, V. 23, No, 2, March-April1978, pp. 12-21.
12. Regan, P. E., and Harnadi, Y. D., "Con-crete in the Oceans; Behavior of Con-crete Caisson and Tower Members,"Technical Report, Cement and ConcreteAssociation, No.4, 1981.
13. Moksnes, J., "Offshore Concrete — Re-cent Developments in Concrete Mix De-sign," Nord irk Beton, V. 2, No - 4, 1982,pp. 102-105.
14. Cowan, J., and Cruden, A. F., "SecondThoughts on Shear-Friction," Concrete,
August 1975, pp. 31-32-15. Frfnay, J. W., "Shear Transfer Across a
Single Crack in Reinforced ConcreteUnder Sustained Loading," Part 1, Ex-periments, Stevin Report, 5-85-5, 1985,114 pp.
16. Paulay, T., and Loeber, P. J., "ShearTransfer by Aggregate Interlock," ACISpecial Publication 42, Shear in Rein-forced Concrete, V. 1, American Con-crete Institute, Detroit, Michigan, 1974,pp. 1-16.
17. ACI Committee 318, "Building CodeRequirements for Reinforced Concrete(AC! 318-83)," American Concrete In-stitute, Detroit, Michigan, 1983, 112 pp.
18. PCI Design Handbook –Precast andPrestressed Concrete. Third Edition,Prestressed Concrete Institute, Chicago,Illinois, 1985, 528 pp.
20. Walraven, J, C. "Fundamental Analysisof Aggregate Interlock," Journal of theStructural Division, ASCE, V. 11,November 1981, pp. 2245-2270.
21. Walraven, J. C., and Reinhardt, H. W.,"Theory and Experiments on the Me-chanical Behavior of Cracks in Plain andReinforced Concrete Subjected to ShearLoading," Heron, V. 26, No. 1, 1981.
22. Pruijssers, A. F., and Liqui Lung, G.,"Shear Transfer Across a Crack in Con-crete Subjected to Repeated Loading—Experimental Results," Part 1, Stevin Re-port 5-85-12, 178 pp.
PCI10URNAL;January- February 1987 83
APPENDIX — NOTATION
b = width of memberd = distance from extreme com-
pression fiber to centroid oftension reinforcement
= cylinder compressive strengthof concrete [6 x 12 in.(152 x 305 mm) ]
f . = cube compressive strength ofconcrete [5.9 in. (150 mm) eachside]
f –specified yield strength ofreinforcing steel
vu = nominal design shear stress(v 1bd)
N. exp = experimental shear stressvu, M = calculated shear stressA, = area of shear friction (transfer)
reinforcementa = angle of internal friction1,. = coefficient of frictionp,, =A,lbd
v,, = external compressive stress,normal to crack plane
c(, = capacity reduction factor
NOTE: Discussion of this paper is invited. Please submityour comments to PCI Headquarters by September 1, 1987.